Real Clear Science and Real Clear Energy are great aggregators of science and energy articles. But, invariably, there is always at least one article that merits lampooning, if not outright ridicule… And today was no exception.
“Alarmist CO2 Headlines Create Confusion”… Yes they do. Earth has been setting CO2 records since 1809, but it never became headline news before we crossed 387 ppm.
Why you should take hyperventilating headlines about CO2 with a grain of salt — but still be quite concerned
By Tom Yulsman | May 15, 2017
This graph shows carbon dioxide concentrations in the atmosphere as measured at the Mauna Loa Observatory in Hawaii. The last four complete years of the record plus the current year are shown. The dashed red line red line shows monthly mean values, and reveals a natural, up-and-down season cycle. The black line shows the trend after correcting for the average seasonal cycle. (Source: NOAA Earth System Research Laboratory)
Back in late April, there was a spate of hyperventilating headlines and news reports about the increasing levels of carbon dioxide in the atmosphere.
This one in particular, from Think Progress, should have made its author so light-headed that she passed out:
The Earth just reached a CO2 level not seen in 3 million years
Levels of atmospheric carbon dioxide hit record concentrations.
That story and others were prompted by measurements at Hawaii’s Mauna Loa Observatory showing that the concentration of heat-trapping CO2 in the atmosphere had exceeded 410 parts per million.
Some of you might be thinking this: Since rising levels of greenhouse gases are causing global warming, and myriad climate changes like melting ice sheets and glaciers, then this really was big news story.
And the highest CO2 level in 3 million years? WOW! That certainly justifies the hyperventilating hed, right?
I don’t think so. That’s because the headline is inaccurate, and the story hypes the crossing of a purely artificial CO2 threshold.
While Mr. Yulsman is spot-on in his characterization of alarmist CO2 headlines (“hed” is journalistic shorthand), he then veers right off into alarmist prattle about sea level:
My point is not that we shouldn’t be concerned about continuing to use the atmosphere as a dumping ground for the byproducts of fossil fuel burning. Quite the opposite. We should be moving more aggressively to do something about it. If you have any doubts, check out the trend in sea level since 1880:
Cumulative changes in sea level for the world’s oceans since 1880, based on a combination of long-term tide gauge measurements and recent satellite measurements. (Source: EPA.)
Moreover, sea level rise isn’t something that only future generations will have to deal with. It’s already causing significant challenges. If you doubt that, check out what’s happening in Miami right now.
So yes, we absolutely should be concerned about the rising tide of CO2 in the atmosphere, and doing something over the long run to transition away from fossil fuels.
[…]
But slapping an inaccurate, hyperventilating headline on a non-story to rile up readers is no way to do it.
I love irony. If “slapping an inaccurate, hyperventilating headline on a non-story to rile up readers is no way to do it,” what’s the point in “slapping an inaccurate, hyperventilating” comment about sea level rise? Mr. Yulsman linked to this article about “what’s happening in Miami right now”…
Miami Beach spends millions to hold back the sea
The city is installing powerful storm water pumps and raising some public streets by an average of two feet.
Sea levels in South Florida could rise up to two feet over the next four decades. That puts Miami Beach – an island three miles off the Florida coast – at risk.
The city is already experiencing sunny day flooding – days when there’s no rain, but high tides push water up through storm drains and flood city streets.
“Sea levels in South Florida could rise up to two feet over the next four decades”… No they can’t and this is not happening right now.
For sea level to rise “two feet over the next four decades,” it would have to accelerate to the pace of the Holocene Transgression:
Projected sea level rise through 2100 AD. Two feet of sea level rise over the next four decades would require a pace even faster than that required for 1 meter (~3 feet) of sea level rise by the end of this century. https://wattsupwiththat.com/2013/12/21/oh-say-can-you-see-modern-sea-level-rise-from-a-geological-perspective/
It would take an average rate of sea level rise nearly twice that of the Holocene Transgression for sea level to rise more than 1.5 meters (~5 feet) over the remainder of this century.
Sea level isn’t behaving any differently than it has throughout the Holocene.
Sea level rise in the Miami area is not accelerating and it is rising at a rate of about 1 foot per century.
The mean sea level trend is 2.39 millimeters/year with a 95% confidence interval of +/- 0.43 mm/yr based on monthly mean sea level data from 1931 to 1981 which is equivalent to a change of 0.78 feet in 100 years. https://tidesandcurrents.noaa.gov/sltrends/sltrends_station.shtml?stnid=8723170The mean sea level trend is 2.40 millimeters/year with a 95% confidence interval of +/- 0.15 mm/yr based on monthly mean sea level data from 1913 to 2016 which is equivalent to a change of 0.79 feet in 100 years. https://tidesandcurrents.noaa.gov/sltrends/sltrends_station.shtml?stnid=8724580The mean sea level trend is 3.63 millimeters/year with a 95% confidence interval of +/- 0.48 mm/yr based on monthly mean sea level data from 1971 to 2016 which is equivalent to a change of 1.19 feet in 100 years. https://tidesandcurrents.noaa.gov/sltrends/sltrends_station.shtml?stnid=8723970
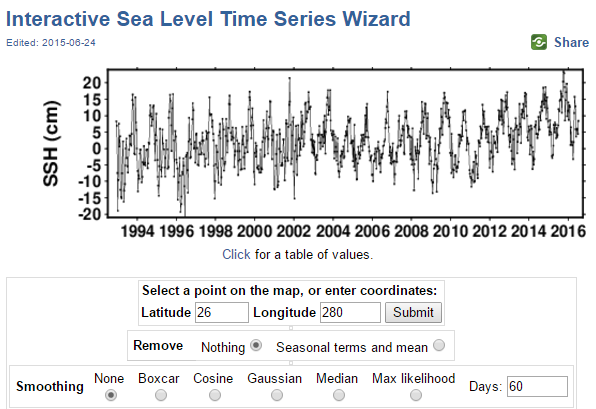
The satellite data indicate virtually no statistically significant sea level rise in the Miami area:
CU Sea Level Research Group University of Colorado http://sealevel.colorado.edu/content/interactive-sea-level-time-series-wizard?dlat=26&dlon=280&fit=n&smooth=n&days=60
I intentionally retained the “seasonal terms and mean” and did not smooth the data because the seasonal variability is real and at least 10 times the magnitude of any secular trends in sea level.
To the extent that there is a trend (R² = 0.0945), the rate of sea level rise in the Miami area is about 3 mm/yr. This would lead to about 5.5 inches of sea level rise over the next four decades.
Miami FL Area Sea Surface Height (cm). Data from CU Sea Level Research Group University of Colorado. http://sealevel.colorado.edu/cgi-bin/table.cgi?q=content%2Finteractive-sea-level-time-series-wizard&dlat=26&dlon=280&fit=n&smooth=n&days=60
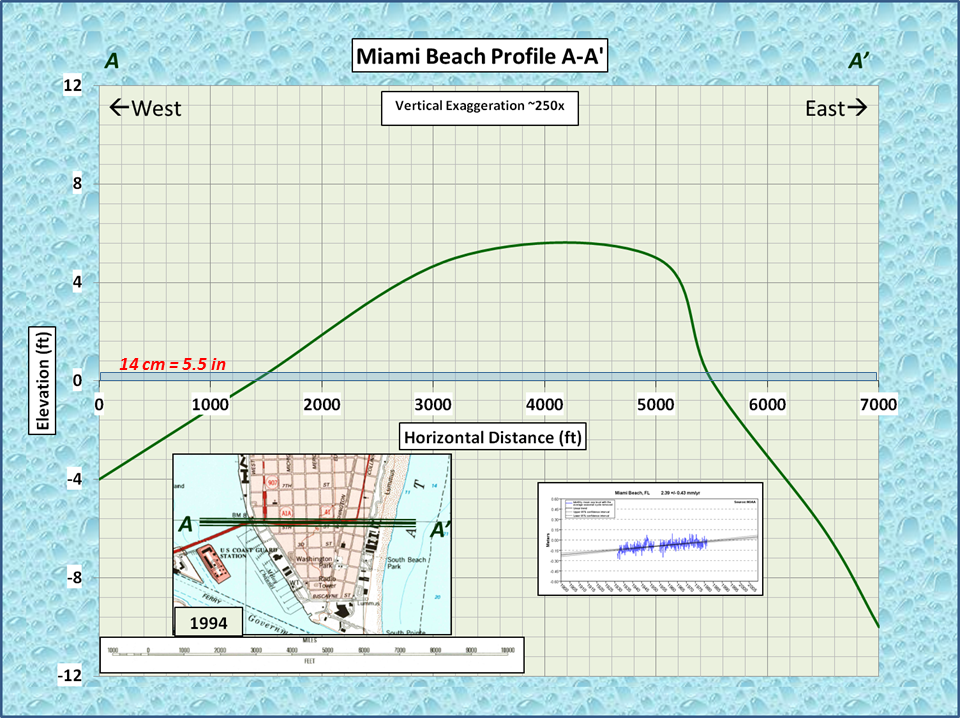
A review of USGS topographic maps reveals very little in the way of inundation by rising seas:
Miami Beach, Florida topographic maps from 1950 and 1994.(USGS).Miami Beach topographic maps for 1950 and 1994. Note that the 5′ elevation contour has not shifted (USGS).Miami Beach, Florida topographic maps for 1994 and 2012. The 2012 map has no 5′ contour because it has a 10′ contour interval. However, it is abundantly obvious that Florida is not being inundated.Topographic profile A-A’. The NOAA sea level trend has been plotted at.the same vertical scale.
Conclusion
Kudos to Mr. Yulsman for raising the alarm about alarmist CO2 headlines and ironically including alarmist prattle about sea level rise in his article. I’ve been looking for a reason to break out the Miami Beach topo maps and profile and use them in a WUWT post.
References
Bard, E., B. Hamelin, M. Arnold, L. Montaggioni, G. Cabioch, G. Faure & F. Rougerie. Deglacial sea-level record from Tahiti corals and the timing of global meltwater discharge.Nature 382, 241 – 244 (18 July 1996); doi:10.1038/382241a0
Blum, M.D., A.E. Carter,T. Zayac, and R. Goble. Middle Holocene Sea-Level and Evolution of The Gulf of Mexico Coast (USA). Journal of Coastal Research, Special Issue 36, 2002.
Jevrejeva, S., J. C. Moore, A. Grinsted, and P. L. Woodworth (2008). Recent global sea level acceleration started over 200 years ago? Geophys. Res. Lett., 35, L08715, doi:10.1029/2008GL033611.:
Nerem, R.S., D.P. Chambers, C. Choe & G.T. Mitchum. Estimating Mean Sea Level Change from the TOPEX and Jason Altimeter Missions. Marine Geodesy. Volume 33, Issue S1, 2010, pages 435- 446 Available online: 09 Aug 2010 DOI: 10.1080/01490419.2010.491031.
I believe the CISRO chart, the second one in your post, is incorrect. The satellite data is currently showing a rise of 3.4 mm/yr (https://climate.nasa.gov/vital-signs/sea-level/ ) while the tide gauges show a continuous rise of under 2 mm/yr. The chart shows the tide gauge increasing at a rate higher than the satellite.
Because land rises and subsides, it makes sense to apply adjustments to tide gauge data. link If I were looking for the culprit that’s where I would look.
Except reversing the labels wouldn’t quite work either. The satellite data doesn’t go that far back in time. The data would have to be maximum of satellite and tide gauge vs. satellite only.
South Florida is currently experiencing SUBSIDENCE of up to 3mm per year. The South Beach tidal gauge shows 2.39mm per year rise. Therefore Miami is only experiencing subsidence, not sea rise. http://www.ces.fau.edu/arctic-florida/pdfs/fiaschi-wdowinski.pdf
Anyone got any more data on that EPA graph on sea level rise. It shows a flatter trend for satellites and an accelerating rise for tidal gauges. I was led to believe the discrepancy went the other way with satellites showing an acceleration. Does this graph have a flipped legend or have both datasets been updated?
Miami Beach is our southern version of the supposed polar bear crisis. Except they look better in bathing suits. I just wish they’d shut up and start raising the city up. It’s mostly a barrier island and limestone fill that’s probably sinking anyway. Chicago, Seattle, Galveston have all raised ground level.
It is well worth reviewing this short video when considering claimed sea level rise.
Once again, it raises serious data issues issues and whether any reasonable reliance can be placed on the way that the data is now presented.
they changed the data to reflect the actual facts… here in NJ, they have known the sea level has increased by one foot in a century..
a combination of land fall /sea rise…
a noted fact ,way before global warring/co2 increase…
“… they changed the data to reflect the actual facts…”.
==========================
I love it, that could be the new NASA mission statement …
… from “to pioneer the future in space exploration, scientific discovery and aeronautics research” to …
“We change the data to reflect the actual facts”.
Tom O
May 16, 2017 8:15 am
Is it my imagination, or do those topo maps lying side by side make it appear that the 1994 map appears to show a wider peninsula than the 1950 map – almost like there is more land showing, especially on the right side. Land fill? Difference in tides? Even the shape has changed a little.
Recently I read a book about the 400-year immigration history of New York City (mainly Manhattan).
In the late 1600’s – early 1700’s settlers began filling in areas around the island, and the chapter illustrates a map showing the boundaries of the island with the portions of the area flooded by “Superstorm” Sandy, withe caption “The water is reclaiming the land filled in”/
TA
May 16, 2017 8:30 am
Well, it is good that Mr. Yulsman recognizes the CAGW hyperbole being put out by alarmists. That’s the first step. When he recognizes it in himself, he will take the next step to freeing himself from the CAGW narrative.
arthur4563
May 16, 2017 8:43 am
The article about car battery costs indicated lots of ignorance about electric cars. They claim the typical electric car has a 25kWhr battery. The smallest battery pack offered in Tesla’s Model S is 85 kWhr and their “low cost” Model 3 will have a 60 Kwhr battery pack. Tesla claims they are paying $190 per kWhr for their battery packs and GM claims $150 for just the cells, not including the wiring and enclosure, both of which are far cheaper than their “estimates” for 2020 prices.
The Colorado U sea level chart includes a “Glacial Isostatic Adjustment” of 0.3 mm/yr. When I started watching them in the early 2000’s, the s.l. rate was 3.2 mm/yr. Then it dropped to 3.1, then after a few years it was down to 2.9 headed to 2.8.
Then the site went down for a number of months.
When it came back up, the annual rate was back to (wait for it) 3.2 again. They’d stuck a G.I.A. on it. They had an explanatory link on the first page. Then the link was still there, but not so obvious. Now I had to do a site search to find it, buried in the FAQ section. http://sealevel.colorado.edu/faq#n3113
Convoluted explanation: you see the sea level rise would really be that much more if the sea bottom weren’t going down, so we need to add that little bit. It isn’t really sea level, but it ought to be. So we fixed it so it is. Really.
Mike McMillan May 16, 2017 at 3:50 pm
The Colorado U sea level chart includes a “Glacial Isostatic Adjustment” of 0.3 mm/yr. When I started watching them in the early 2000’s, the s.l. rate was 3.2 mm/yr. Then it dropped to 3.1, then after a few years it was down to 2.9 headed to 2.8.
Then the site went down for a number of months.
When it came back up, the annual rate was back to (wait for it) 3.2 again. They’d stuck a G.I.A. on it. They had an explanatory link on the first page. Then the link was still there, but not so obvious. Now I had to do a site search to find it, buried in the FAQ section. http://sealevel.colorado.edu/faq#n3113
Convoluted explanation: you see the sea level rise would really be that much more if the sea bottom weren’t going down, so we need to add that little bit. It isn’t really sea level, but it ought to be. So we fixed it so it is. Really.
And in January 2016 the GIA Corrected bullshit disappeared from their graph but they’re still adding it in. It annoys me that no one is up in arms about that.
As you point out they also “adjust & correct” their data. what had been 2.6 mm/yr in 2004 is now 3.5 mm/yr. Here’s what that looks like: http://oi67.tinypic.com/ojdn6h.jpg
“Moreover, sea level rise isn’t something that only future generations will have to deal with. It’s already causing significant challenges. If you doubt that, check out what’s happening in Miami right now. … The city is already experiencing sunny day flooding – days when there’s no rain, but high tides push water up through storm drains and flood city streets.”
It is technically a true statement, but what they are missing is that the city of Miami has always had sunny day flooding because the city is built too shallow. It always occurs during the period when the moon aligns with the sun to create a tide which is 1-2 feet higher than the normal high tide. It’s also boosted by a “supermoon” — when the moon is at apogee (i.e. closest point in its orbit to the Earth.)
We just about hit that perfect last year (hence all of the excitement.)
“The Supermoon on November 14, 2016, was the closest a Full Moon has been to Earth since January 26, 1948. The next time a Full Moon is even closer to Earth will be on November 25, 2034 (dates based on UTC time).”
[Miami] is just a place on a sand bar. There is no bed rock (unlike New York). As long as people want to live there, they will have to spend money to keep their city from sinking or being washed away. It has nothing to do with the climate.
Wasn’t there a post a while back that discussed how the military base on the east coast may actually be sinking and that could be part of the reason why sea levels have risen there?
Can the same thing be happening in Florida?
I sure read about lots of sink holes in FL….maybe I am too skeptical.
[Possibly Norfolk VA area – Significant cause of sinking across that area is groundwater being pumped out. As in Baytown TX in the 60-70’s. Lost 6+ feet (2 meters in elevation. .mod]
Most of the US is sinking since it is in the “forebulge” area of the last glaciation. However Florida is a stable carbonate platform, so there is no local subsidence through sediment compaction like in LOuisiana or around Delaware bay.. Sinkholes are strictly local and caused by cave-ins of subterranean cavities. During glaciations Florida is a 400 feet high limestone plateau with intense karstification so the whole peninsula is as full of holes as a swiss cheese.
Thanks for the new word. karstification Had to look it up.
Probably more than one but Flagler quarried fossil coral near the FL middle keys. Sign said the coral was growing when water levels were 25 meters higher. It’s a cool historic. Don’t tell Miami Beach.
“full of holes” is pretty metaphorical for most FL residents. Me excepted of course.
Remind me not to purchase a whole lot of property at Miami Beach. Built on sand and porous limestone that is subsiding .6 mm per annum and 4 feet above sea level should make for an interesting and expensive future. Not to mention ground water pumping from nearby aquifers or the weight of the city itself on the local landscape consolidating soils. Some roads are built below the King tide levels, which photos are used to show how seal level rise will drown us all. All of the cities infrastructure that is buried below ground is below sea level and subject to salt water intrusion. Talk about property taxes going up forever to deal with this perpetual problem. Good thing they are rich there, but somehow I feel everyone is going to pay for this.
When they talk about sea level rise and show pictures of Miami or Miami Beach as an example of rising sea levels, remember that this area is a very deceptive poor example of such. Especially if they don’t mention any of the above. https://phys.org/news/2015-10-sea-swallow-miami-orleans.html for real extreme SLR.
Another good article here at WUWT was back in Dec/16 by Kip Hansen https://wattsupwiththat.com/2016/12/07/miamis-vice/
Yup, I was never so happy as when we sold our mother’s beach front house in Florida that was about 12′ above MSL. A CAT 4 storm surge at high tide o0n the north side of the eye, will blow that thing away like a double wide in a tornado. But, it won’t be my problem.
That article in Physics was pervasive last year. It is also an extreme exaggeration (but a very subtle one, if you aren’t reading closely.) This exaggeration was widely repeated at the time — and it is very difficult to read through all the nonsense to appreciate the extent of the exaggeration.
Notice how it quotes “Climate Central” rather than the actual study.
“Scientists have already established that if we do nothing to reduce our burning of fossil fuel up to the year 2100, the planet will face sea level rise of 14-32 feet (4.3-9.9 meters), said lead author Ben Strauss, vice president for sea level and climate impacts at Climate Central.”
Except, the referenced study does not claim that sea level will rise by 4.4-9.9 meters by 2100. It says that sea level could rise by that much in two thousand years due to the carbon dioxide emitted by 2100.
That’s a very significant distinction. Instead of three generations, it’s sixty generations. Imagine the world 2000 years ago — try to extrapolate that 2000 years in the future to decide if it is significant to us now. This would be like Jesus Christ spending his entire ministry warning us about Donald Trump.
Strauss is the one who conducted the study referenced in his own article (another blogger scientist), but the study does not estimate sea level rise. It uses a sea level projection of 4.4 – 9.9 meters by 2100 and calculates the number of cities affected. http://www.pnas.org/content/112/44/13508.abstract
From the study — “Associated projections for sea-level rise generally range near or below 1 m by 2100. However, paleontological and modeling evidence indicates long-term sea-level sensitivity to warming that is roughly an order of magnitude higher. Here we develop relationships between cumulative carbon emissions and long-term sea-level commitment and explore implications for the future of coastal developments in the United States.”
In the article, he references the original estimate of 4.4 – 9.9 meters this way:
“We quantify sea-level commitment in the baseline case by building on Levermann et al. (10), who used physical simulations to model the SLR within a 2,000-y envelope… “
All of the Miami infrastructure which is below ground?
Please do tell…which infrastructure might that be?
I will tell you what…water and sewer pipes.
We do not build anything subject to water damage below ground here in the peninsula…it is saturated due to summer rainy season every year.
The whole state has been inundated at one time or another by storm surge, and yet the soil is not salt laden.
60+ inches of rain a year will do wonders for washing away salt.
Yes, the aquifer near the coast has some intrusion at depth, but that is from over-pumping in decades past.
You see the topo sheets from 1950 compared to the recent ones…virtually no change.
And you can google up photos of the buildings along Miami beach ocean front, and Lummus park across the street, that look identical as pictures taken yesterday, in terms of the location of the ocean in relation to the city streets and buildings.
The plain fact is that every year that goes by without a hurricane is a minor miracle for anyplace in Florida, as it is for much of the coastline of the eastern US.
We will all be long gone so it makes no sense, but I would bet anyone here any amount of money that storms will destroy every inch of Florida coastline long before the sea rises over those same places.
Which I doubt it will ever do.
The thing is, when these properties get destroyed by storms, they will all be rebuilt as fast as possible, just like every other low lying place which has been destroyed in recent years by ocean storms.
Actions speak louder than words.
Billions of dollars of newly built real estate now occupy a pile of spoils that Henry Flagler dumped at the mouth of the Miami river in Biscayne Bay when he dredged it over 100 years ago.
Here are some then and now picks of Brickell Key, formerly Claughton Island, formerly random sand pile in bay…still there, not submerged…not even washed away: http://miami-history.com/wp-content/uploads/2013/01/1928_Aerial_Miami_Downtown-300×240.jpg
Smart people with billions to spend and invest say this place is here and staying…liars say otherwise.
Excuse me, skipped a few words in this sentence: “…you can google up photos of the buildings along Miami beach ocean front…”
Should be “…you can google up photos, from about a hundred years ago and more, of the buildings along Miami beach ocean front…”
The early 20th century art deco hotels are a good example.
Here is a postcard of Lummus Park from decades before WWII…look at the cars, and compare this to a google street view of the same spot today…nothing has changed.
Here is one from the 1950s…those coconut palms all died off from lethal yellowing in the 1970s, and the Malays that they planted in the late 1980s are now nearly as big…and the beach remains…and is even wider now: http://3.bp.blogspot.com/-JAGH7lseIJ4/VRYD3fELdYI/AAAAAAAAUmY/fck8KdBrL1Y/s1600/Screen%2BShot%2B2015-03-27%2Bat%2B9.28.05%2BPM.png
“Remind me not to purchase a whole lot of property at Miami Beach”
Wish I had bought two whole lots 40 years ago. Then I could sell one lot and lie in my infinity pool with Tom Cruise shaking up the cocktails.
You do know why people would want to live in Miami Beach, surely?
South River Independent
May 16, 2017 9:49 am
Local environmentalists are hyping sea level rise in Annapolis, MD because of nuisance flooding, much of it due to land subsidence and back flow through the drainage systems, which have no check valves.
James at 48
May 16, 2017 9:52 am
The catastrophist “X meters of rise by 2100” depends on a massive sudden collapse of substantial volumes of continental glaciers in both Greenland and Polar Antarctica (e.g. the core part, not the relatively minor mountain glaciers of the Antarctic Peninsula). There is no foreseeable mechanism capable of doing that.
Greenland’s interior (bedrock that is) is below sea level. It is only above sea level on the coasts. Of course, the interior of Greenland is actually over 9,000 feet high due to all the glacial build-up.
Mountains on the east and west side of Greenland oughta do a pretty good job of continuing the hold the icecap in place, like for the last umpteen bajillion years.
That’s just a glacier in West Antarctica, not the massive East Antarctic Ice Sheet, repository of most of the planet’s fresh water.
But it is not going suddenly to melt, either. The “threat” is based upon models.
“The University of Washington study used satellite measurements and computer models to determine that the Thwaites could melt in as little as 200 years, or the melting could take as long as 1,000 years. Ian Joughin, a university glaciologist and the lead author of that study, said the most likely scenario is at the lower end of that range.” http://www.latimes.com/science/environment/la-sci-0513-antarctic-ice-sheet-20140513-story.html
“Hey, let’s get paid taxpayer money (the best kind of money) while worrying about things of unknown magnitude that might happen decades from now in uncertain locations while we ignore immediate, real problems!”
Neil Jordan
May 16, 2017 10:16 am
There is another periodicity in sea level not covered here. A ~19-year cycle was quantified a while ago (BC) by Meton of Athens, but the Babylonians knew of the cycle earlier. The cycle is applied in the National Tidal Datum Epoch, which uses tide gage measurements over the last 19-year epoch to compute tides for the next epoch. American Council on Surveying and Mapping covers it here: https://tidesandcurrents.noaa.gov/publications/Understanding_Sea_Level_Change.pdf
The British government has no alternative but to take the climate back into public ownership…. A balanced response to the risks of dangerous climate change
Independent, evidence-based advice to the UK and Devolved Governments and Parliaments https://www.theccc.org.uk/
Kip, yes I was surprised that no commenters thus far had noted your detailed, illustrated analysis of Miami flooding. IIRC, it is basically negligence of authorities in permitting construction, canal work and the like without the normal codes that coastal cities generally invoke. A foot or two of fill would have given the a couple of centuries of protection.
Clyde Spencer
May 16, 2017 11:21 am
David,
You said, “To the extent that there is a trend (R² = 0.0945), …”
I think that this is a good time to remind the readership what the practical meaning of R² is. It means that, in this particular case, less than 1% of the variance in the dependent variable (MSL) can be attributed to (or predicted by) the independent variable (time). That is, there are one or more other influences that are much more important than time, or something highly correlated with time, that results in changing sea levels.
The important influences are unpredictable factors such as wind, atmospheric pressure, lunar cycles, local subsidence, local seasonal temperature changes, and global tectonics. Oceanic heating and glacier meltwater would appear to have an insignificant impact on short-term variations. The trend itself correlates better with temperature, but there are other long-term events such as lunar cycles and global tectonics that are probably of the same order of magnitude. That is, undersea volcanos and new sea floor generated at spreading centers will displace water, causing sea level to rise. Isostatic rebound in areas formerly covered by ice will also cause global sea level to rise.
With respect to lunar influences, Harris (1981) remarks in “Tides and Tidal Datums in the United States,” that there are four major lunar periods ranging from about 9 years to 19 years, which because of phase differences in the periods can constructively and destructively interfere. He also notes that the revolution of the solar ‘perigee’ (perihelian), with a period of 209 centuries, has a measurable influence on tides.
So, until such time as ‘researchers’ comprehensively evaluate the confounding factors of measured SLR, we should take any claims of “acceleration” with a large pinch of sea salt. It isn’t just temperature that is important!
Gary,
Yes, I’m sure that the sediment being delivered to the oceans also contributes to a rise. It certainly reduces the capacity of man-made reservoirs. However, we know that ‘geosynclines’ like the Mississippi Delta are subsiding, and I’m not sure how that interplay works out.
The alarmists would claim that the R² would be a lot higher if I filtered out all of the “noise” (seasonal, annual, decadal, etc. fluctuations). Globally, the R² is a lot higher because the secular 1-3 mm/yr is fairly global.
Since 99% of the local sea level fluctuation is cyclical, filtering it out of a discussion of Miami’s flooding issues is extremely dishonest and par for the course with alarmists.
Every time we have a King tide in the area or if the wind blows strongly from the east for a while, we get stories about man-made sea level rise. It’s as tiresome as it is predictable. I have noted here in the past, they often illustrate such “news” articles with pictures of rain flooding in Miami inland, far away from the shore and any sea level rise. It is the next panic since global warming failed to arrive. Once it gets debunked, we will be on to some other crisis. Ho hum.
The whole accelerating sea level rise gig is probably the most pathetic side of CAGW – but set against some seriously stiff competition nevertheless. The flagrant lying is exposed to maximum effect in this most moronic sub-section of climate junk science. The photos of cliff erosion with dwellings on the brink of tumbling into the cruel encroaching sea. The endless egregious lying about Miami. The Pacific islands fiasco and the faux OMG total horror of transient sand bars being washed away. All viewed against the backdrop of the actual data showing the entirely unalarming and absolutely expected natural sea level rise at this point in the glacial cycle. For we connoisseurs of climate corruption and deceit, sea level rise is truly the jewel in the crown.
No, really, I’m not. Junk climate science and the media are different faces of the same broken town clock.
wyzelli
May 16, 2017 4:18 pm
Big numbers of very small units make things looks scary.
poitsplace
May 16, 2017 4:38 pm
The problem is if you look at the actual tide gage data, you find none of that acceleration anywhere. It doesn’t show up in any single tide gage…only when some shill of a “researcher” adjusts the data. 100% of the signal is adjustment.
Anyone have an idea of the sea level rise off the Netherlands in the last 30 years. Seems impossible to get but I need it for a blog. Thanks if anyone can help.
Virginia Key is the barrier island south of Miami Beach where a tide gauge was installed at the University of Miami marine School. The old one was removed when Miami Beach increased the width of its beach in 1980.
The new gauge on Virginia Key shows very high rates of SLR (5.3 mm/yr) as does Vaca Key (3.6 mm /yr ) while Key West is a more normal 2.4 mm/yr. The rapid rise is attributed to a combination of winds and currents “piling up” the water. The data can be found here http://andrew.rsmas.miami.edu/bmcnoldy/papers/MDPL_17Feb2016.pdf
It is a little bit odd that NOAA no longer shows Virginia Key at its tides-and-currents web site. There does not seem to be any subsidence as in coastal Virginia.
Any ideas??
Combined the adjusted data records from Miami
Beach, Haulover Pier, and Virginia Key to create 82-year time series of annual mean sea level… linear trend is 0.092 ± 0.005 “/yr
Thanks for the units conversion, but the rate for the last 20 years is 5.3mm/yr, which IS high when you consider Key West is not that far away. Is there is anything tricky in the way corrections are done or is this a cyclic fluctuation, and why did NOAA stop providing SLR trend data for Virginia Key?
I think the author of that slide show would say that 5.3mm/yr vs 2.3mm/yr proves acceleration and that satellites always read lower than tide gauges. How would you answer that?
Linear trends of noisy time series have to be used with
caution!!!
ESPECIALLY with relatively short periods
20-year trend (0.22”/yr): probably pretty reliable, but more
years would be better
5-year trend (0.92”/yr): likely not accurate
(if sea level rose 4” in past 20 years, it didn’t rise 5” in past 5 years!)
Longer time series allows for higher confidence in linear trend line, but cannot account for accelerating rates
His “acceleration” is based on short cherry-picked segments. If sea level rise was accelerating, it would clearly show up in the longer time series. The time series would clearly be curving upwards, rather than linear.
Even if sea level rise was accelerating at Virginia Key, it’s not accelerating in any of the longer time series. Nor is it accelerating globally.
Elsewhere, I have argued that there is no acceleration signal in the 20 year Virginia Key data; however, 20 years should be long enough to determine a slope unless there is a long term variation in the gulf stream and we are seeing the upward slope of a cycle.
That said, I don’t know anything about satellites, but it is strange that a few of them could disagree so much with hundreds of tide gauges. But then what does global SLR actually mean?
The global average of the tide gauges don’t show any recent acceleration either.
You could probably find several 20-yr segments in the Key West time series over which the slope would be greater than the long-term trend.?w=720
Our results (Fig. 4) clearly demonstrate that accelerations are not expected to exceed 0.1 mm per year until the second half of the 21st century for sea level rise pathways towards targets of 0.5–1 m (P1, P2), and will only exceed this threshold around 2030–2050 for pathways towards targets of 1.5–2 m (P3, P4).
Like the bear in the woods, the acceleration is always just out of sight, generally well-beyond the retirement dates of the authors of papers like this.
I think the author of that slide show would say that 5.3mm/yr vs 2.3mm/yr proves acceleration and that satellites always read lower than tide gauges. How would you answer that?
steve in miami
May 17, 2017 9:47 am
I think the author of that slide show would say that 5.3mm/yr vs 2.3mm/yr proves acceleration and that satellites always read lower than tide gauges. How would you answer that?
One would think that, for all the caterwauling about sea rise doom in Miami, they’d have a work gauge.
Or not, considering that it is harder for people to scaremonger when people do not have actual data to debunk.
There are two obvious things wrong with that CSIRO-based EPA sea-level graph, which appears to come from this EPA page.
I used WebPlotDigitzer (bookmark it!) to digitize a couple of points on the graph, twenty years apart, to see what rate they are claiming. It is absolutely preposterous: http://sealevel.info/sea-level-download1-2016_digitized_cropped.png
The two obvious things wrong are:
1. That graph wildly exaggerates the rate of sea-level rise from tide gauge measurements. In fact, it shows sea-level from tide gauge measurements as even more rapid than satellites! That’s nonsense. The sea-level from tide gauges actually averages about 1½ mm/year. Sea-level from satellite altimetry averages about twice that (and isn’t trustworthy).
2. That graph clearly shows average sea-level from tide gauge measurements accelerating over the last thirty years. Yet none of the best-quality, long-term, sea-level measurement records show such an acceleration. Some of them spike with El Niños, so there’s been a very slight uptick over the last couple of years, but there’s certainly been no upward curve resembling that EPA graph. Here’s a typical sea-level measurement record:
Sealevel.info: http://www.sealevel.info/MSL_graph.php?id=Honolulu
NOAA: https://tidesandcurrents.noaa.gov/sltrends/sltrends_station.shtml?stnid=1612340 http://www.sealevel.info/1612340_Honolulu_vs_CO2.png
(Note: Peltier estimates that Honolulu experiences 0.1 mm/yr uplift, which makes the global rate about 1½ mm/year.) All of the best-quality, long-term, sea-level measurement records show that there has been no significant, sustained acceleration in rate of sea-level rise since the 1920s or before. Mathematically, if an average of several measurement records shows acceleration, it must be the case that at least some of the individual measurement records show acceleration, but the CSIRO bunch seem to somehow have found a way around that problem. I assume that it is an artifact of using a changing mix of tide gauges in their “average” over the period of time represented in the graph.
Or maybe it’s something even stranger. That group definitely does some strange stuff. That group’s Church & White (2006) was the first paper to claim to have detected a small “20th century acceleration in global sea-level rise.” About five years ago I reanalyzed the averaged sea-level data used in that paper (the output of a mysterious algorithm involving empirical orthogonal functions), and discovered that all their detected acceleration predated 1925. Their data actually showed a slight (statistically insignificant) deceleration after 1925. In other words, when CO2 levels rose above about 307 ppmv, sea-level rise acceleration ceased.
But there was more weirdness in that paper than that. This is a quote from the paper:
“An additional spatially uniform field is included in the reconstruction to represent changes in GMSL. Omitting this field results in a much smaller rate of GMSL rise…”
That sounds to me like a fudge factor, to increase the reported rate of sea-level rise! But I stared at it a while and wondered: why did they say “spatially?”
Surely, I thought, since they were reporting measured acceleration trends, the “additional field” must at least have been temporally uniform. So why did they use the word “spatially?” What other sort of non-uniformity could there be, besides spatial and temporal?
I emailed Drs. Church & White and asked them why they used the adjective “spatially.” Was the “additional field” temporally uniform, I asked? I’ve yet to figure out what that “field” was, but to my amazement Dr. Church replied that it was not temporally uniform.
In 2009 they posted on their web site a new set of averaged sea-level data, from a different set of tide gauges. But they published no paper about it, and I wondered why not. So I duplicated their 2006 paper’s analysis on their new data, and not only did it, too, show slight deceleration after 1925, all the 20th century acceleration had gone away, too. Even for the full 20th century their data showed a slight deceleration.
My guess is that the reason they wrote no paper about it was that the title would have had to have been something like, “Neeeeever mind: no 20th century acceleration in global sea-level rise, after all.”
Finally, in 2011, they posted another new dataset, and this one finally showed a acceleration for sea-level even after 1930, though it was very slight, and statistically insignificant.
davidrussell22
May 18, 2017 6:45 am
South Florida, specifically parts of Miami are SUBSIDING up to 3mm per year: http://www.ces.fau.edu/arctic-florida/pdfs/fiaschi-wdowinski.pdf
The South Beach tidal gauge reports sea-rise or 2.39mm per year.
Consequently, there is no sea rise in Miami….. only subsidence.
The tide gauge has not been on South Beach since 1980, but on another island with much less high-rise development. My theory of the 5.3 mm/yr is that they converted units incorrectly and it is really 0.8mm/yr.
The tide gauge has not been on South Beach since 1980, but on another island with much less high-rise development. My theory of the 5.3 mm/yr is that they converted units incorrectly and it is really 0.8mm/yr.


 Sea level was 1-2 meters higher than it currently is during the Holocene Highstand. All of the sea level rise since 1700 is insignificant relative to the natural variability of Holocene sea levels.


I believe the CISRO chart, the second one in your post, is incorrect. The satellite data is currently showing a rise of 3.4 mm/yr (https://climate.nasa.gov/vital-signs/sea-level/ ) while the tide gauges show a continuous rise of under 2 mm/yr. The chart shows the tide gauge increasing at a rate higher than the satellite.
I noticed that too… more irony.
Because land rises and subsides, it makes sense to apply adjustments to tide gauge data. link If I were looking for the culprit that’s where I would look.
I think they probably accidentally reversed their plot line labels..
Except reversing the labels wouldn’t quite work either. The satellite data doesn’t go that far back in time. The data would have to be maximum of satellite and tide gauge vs. satellite only.
The tide gauge data looks suspect. Their chart gives a satellite based rise of around 3.2 mm/yr, which is similar to the NOAA data with no glacial isostatic adjustment as shown here: https://www.star.nesdis.noaa.gov/sod/lsa/SeaLevelRise/LSA_SLR_timeseries_global.php
South Florida is currently experiencing SUBSIDENCE of up to 3mm per year. The South Beach tidal gauge shows 2.39mm per year rise. Therefore Miami is only experiencing subsidence, not sea rise.
http://www.ces.fau.edu/arctic-florida/pdfs/fiaschi-wdowinski.pdf
Anyone got any more data on that EPA graph on sea level rise. It shows a flatter trend for satellites and an accelerating rise for tidal gauges. I was led to believe the discrepancy went the other way with satellites showing an acceleration. Does this graph have a flipped legend or have both datasets been updated?
DHR – apparently I type to slowly.
It’s from the EPA. So it’s probably wrong.
Miami Beach is our southern version of the supposed polar bear crisis. Except they look better in bathing suits. I just wish they’d shut up and start raising the city up. It’s mostly a barrier island and limestone fill that’s probably sinking anyway. Chicago, Seattle, Galveston have all raised ground level.
It is periodical: https://tidesandcurrents.noaa.gov/sltrends/50yr.htm?stnid=8724580
It is well worth reviewing this short video when considering claimed sea level rise.
Once again, it raises serious data issues issues and whether any reasonable reliance can be placed on the way that the data is now presented.
they changed the data to reflect the actual facts… here in NJ, they have known the sea level has increased by one foot in a century..
a combination of land fall /sea rise…
a noted fact ,way before global warring/co2 increase…
“… they changed the data to reflect the actual facts…”.
==========================
I love it, that could be the new NASA mission statement …
… from “to pioneer the future in space exploration, scientific discovery and aeronautics research” to …
“We change the data to reflect the actual facts”.
Is it my imagination, or do those topo maps lying side by side make it appear that the 1994 map appears to show a wider peninsula than the 1950 map – almost like there is more land showing, especially on the right side. Land fill? Difference in tides? Even the shape has changed a little.
The brown color indicates a built up area. They have been adding sand to the beach.
Recently I read a book about the 400-year immigration history of New York City (mainly Manhattan).
In the late 1600’s – early 1700’s settlers began filling in areas around the island, and the chapter illustrates a map showing the boundaries of the island with the portions of the area flooded by “Superstorm” Sandy, withe caption “The water is reclaiming the land filled in”/
Well, it is good that Mr. Yulsman recognizes the CAGW hyperbole being put out by alarmists. That’s the first step. When he recognizes it in himself, he will take the next step to freeing himself from the CAGW narrative.
The article about car battery costs indicated lots of ignorance about electric cars. They claim the typical electric car has a 25kWhr battery. The smallest battery pack offered in Tesla’s Model S is 85 kWhr and their “low cost” Model 3 will have a 60 Kwhr battery pack. Tesla claims they are paying $190 per kWhr for their battery packs and GM claims $150 for just the cells, not including the wiring and enclosure, both of which are far cheaper than their “estimates” for 2020 prices.
Colorado University’s Sea Level Research Group
http://sealevel.colorado.edu/
is overdue to publish their first release of 2017. When they do, look for them to detect accelerated sea level rise. After all, they’ve been crying that there’s been no acceleration for some time now.
Why has an acceleration of sea level rise not been observed during the altimeter era?
and
NASA Satellites Detect Pothole on Road to Higher Seas
and
Is the detection of accelerated sea level rise imminent?
So I guess it’s about time they find some and cue the trumpets.
Let’s try that first link again:
Why has an acceleration of sea level rise not been observed during the altimeter era?
The Colorado U sea level chart includes a “Glacial Isostatic Adjustment” of 0.3 mm/yr. When I started watching them in the early 2000’s, the s.l. rate was 3.2 mm/yr. Then it dropped to 3.1, then after a few years it was down to 2.9 headed to 2.8.
Then the site went down for a number of months.
When it came back up, the annual rate was back to (wait for it) 3.2 again. They’d stuck a G.I.A. on it. They had an explanatory link on the first page. Then the link was still there, but not so obvious. Now I had to do a site search to find it, buried in the FAQ section.
http://sealevel.colorado.edu/faq#n3113
Convoluted explanation: you see the sea level rise would really be that much more if the sea bottom weren’t going down, so we need to add that little bit. It isn’t really sea level, but it ought to be. So we fixed it so it is. Really.
Mike McMillan May 16, 2017 at 3:50 pm
The Colorado U sea level chart includes a “Glacial Isostatic Adjustment” of 0.3 mm/yr. When I started watching them in the early 2000’s, the s.l. rate was 3.2 mm/yr. Then it dropped to 3.1, then after a few years it was down to 2.9 headed to 2.8.
Then the site went down for a number of months.
When it came back up, the annual rate was back to (wait for it) 3.2 again. They’d stuck a G.I.A. on it. They had an explanatory link on the first page. Then the link was still there, but not so obvious. Now I had to do a site search to find it, buried in the FAQ section.
http://sealevel.colorado.edu/faq#n3113
Convoluted explanation: you see the sea level rise would really be that much more if the sea bottom weren’t going down, so we need to add that little bit. It isn’t really sea level, but it ought to be. So we fixed it so it is. Really.
And in January 2016 the GIA Corrected bullshit disappeared from their graph but they’re still adding it in. It annoys me that no one is up in arms about that.
As you point out they also “adjust & correct” their data. what had been 2.6 mm/yr in 2004 is now 3.5 mm/yr. Here’s what that looks like:
http://oi67.tinypic.com/ojdn6h.jpg
This is my favorite non-story.
It is technically a true statement, but what they are missing is that the city of Miami has always had sunny day flooding because the city is built too shallow. It always occurs during the period when the moon aligns with the sun to create a tide which is 1-2 feet higher than the normal high tide. It’s also boosted by a “supermoon” — when the moon is at apogee (i.e. closest point in its orbit to the Earth.)
We just about hit that perfect last year (hence all of the excitement.)
[Miami] is just a place on a sand bar. There is no bed rock (unlike New York). As long as people want to live there, they will have to spend money to keep their city from sinking or being washed away. It has nothing to do with the climate.
You mean perigee, apogee is when it is farthest from the Earth.
Ironically, I was thinking “perigee” when I wrote “apogee”. Imagine my surprise when I see the word “apogee” in my post.
“Imagine my surprise”
Russian Hackers again?
Ah, the ol’ good-klimate-kop bad-climate-kop routine.
I veel enjoy vatching you die Meester Bond.
Wasn’t there a post a while back that discussed how the military base on the east coast may actually be sinking and that could be part of the reason why sea levels have risen there?
Can the same thing be happening in Florida?
I sure read about lots of sink holes in FL….maybe I am too skeptical.
[Possibly Norfolk VA area – Significant cause of sinking across that area is groundwater being pumped out. As in Baytown TX in the 60-70’s. Lost 6+ feet (2 meters in elevation. .mod]
Most of the US is sinking since it is in the “forebulge” area of the last glaciation. However Florida is a stable carbonate platform, so there is no local subsidence through sediment compaction like in LOuisiana or around Delaware bay.. Sinkholes are strictly local and caused by cave-ins of subterranean cavities. During glaciations Florida is a 400 feet high limestone plateau with intense karstification so the whole peninsula is as full of holes as a swiss cheese.
Thanks for the new word. karstification Had to look it up.
Probably more than one but Flagler quarried fossil coral near the FL middle keys. Sign said the coral was growing when water levels were 25 meters higher. It’s a cool historic. Don’t tell Miami Beach.
“full of holes” is pretty metaphorical for most FL residents. Me excepted of course.
No, Miami is not sinking. It floods regularly
Remind me not to purchase a whole lot of property at Miami Beach. Built on sand and porous limestone that is subsiding .6 mm per annum and 4 feet above sea level should make for an interesting and expensive future. Not to mention ground water pumping from nearby aquifers or the weight of the city itself on the local landscape consolidating soils. Some roads are built below the King tide levels, which photos are used to show how seal level rise will drown us all. All of the cities infrastructure that is buried below ground is below sea level and subject to salt water intrusion. Talk about property taxes going up forever to deal with this perpetual problem. Good thing they are rich there, but somehow I feel everyone is going to pay for this.
When they talk about sea level rise and show pictures of Miami or Miami Beach as an example of rising sea levels, remember that this area is a very deceptive poor example of such. Especially if they don’t mention any of the above. https://phys.org/news/2015-10-sea-swallow-miami-orleans.html for real extreme SLR.
Another good article here at WUWT was back in Dec/16 by Kip Hansen https://wattsupwiththat.com/2016/12/07/miamis-vice/
Yup, I was never so happy as when we sold our mother’s beach front house in Florida that was about 12′ above MSL. A CAT 4 storm surge at high tide o0n the north side of the eye, will blow that thing away like a double wide in a tornado. But, it won’t be my problem.
That article in Physics was pervasive last year. It is also an extreme exaggeration (but a very subtle one, if you aren’t reading closely.) This exaggeration was widely repeated at the time — and it is very difficult to read through all the nonsense to appreciate the extent of the exaggeration.
Notice how it quotes “Climate Central” rather than the actual study.
Except, the referenced study does not claim that sea level will rise by 4.4-9.9 meters by 2100. It says that sea level could rise by that much in two thousand years due to the carbon dioxide emitted by 2100.
That’s a very significant distinction. Instead of three generations, it’s sixty generations. Imagine the world 2000 years ago — try to extrapolate that 2000 years in the future to decide if it is significant to us now. This would be like Jesus Christ spending his entire ministry warning us about Donald Trump.
Strauss is the one who conducted the study referenced in his own article (another blogger scientist), but the study does not estimate sea level rise. It uses a sea level projection of 4.4 – 9.9 meters by 2100 and calculates the number of cities affected. http://www.pnas.org/content/112/44/13508.abstract
In the article, he references the original estimate of 4.4 – 9.9 meters this way:
A 2,000 year envelope — not a one century envelope.
And here is the referenced Levermann study titled, “The multimillennial sea-level commitment of global warming” http://www.pnas.org/content/110/34/13745.abstract?ijkey=dc0736bb7202f033afaec8bd167876c2c2a7b890&keytype2=tf_ipsecsha
All of the Miami infrastructure which is below ground?
Please do tell…which infrastructure might that be?
I will tell you what…water and sewer pipes.
We do not build anything subject to water damage below ground here in the peninsula…it is saturated due to summer rainy season every year.
The whole state has been inundated at one time or another by storm surge, and yet the soil is not salt laden.
60+ inches of rain a year will do wonders for washing away salt.
Yes, the aquifer near the coast has some intrusion at depth, but that is from over-pumping in decades past.
You see the topo sheets from 1950 compared to the recent ones…virtually no change.
And you can google up photos of the buildings along Miami beach ocean front, and Lummus park across the street, that look identical as pictures taken yesterday, in terms of the location of the ocean in relation to the city streets and buildings.
The plain fact is that every year that goes by without a hurricane is a minor miracle for anyplace in Florida, as it is for much of the coastline of the eastern US.
We will all be long gone so it makes no sense, but I would bet anyone here any amount of money that storms will destroy every inch of Florida coastline long before the sea rises over those same places.
Which I doubt it will ever do.
The thing is, when these properties get destroyed by storms, they will all be rebuilt as fast as possible, just like every other low lying place which has been destroyed in recent years by ocean storms.
Actions speak louder than words.
Billions of dollars of newly built real estate now occupy a pile of spoils that Henry Flagler dumped at the mouth of the Miami river in Biscayne Bay when he dredged it over 100 years ago.
Here are some then and now picks of Brickell Key, formerly Claughton Island, formerly random sand pile in bay…still there, not submerged…not even washed away:
http://miami-history.com/wp-content/uploads/2013/01/1928_Aerial_Miami_Downtown-300×240.jpg
Smart people with billions to spend and invest say this place is here and staying…liars say otherwise.
Hmmm, the one from 1928 did not post for some reason…here is a less old one:
http://fksa.org/gallery3/var/resizes/Florida/Admin-File/album346/album348/2014-Orange-Bowl-Paddle-Championship/3%20Claughton%20Island%20s.jpg
That’s the “new ” island at the start of Hwy 41 and US1, right?
Excuse me, skipped a few words in this sentence: “…you can google up photos of the buildings along Miami beach ocean front…”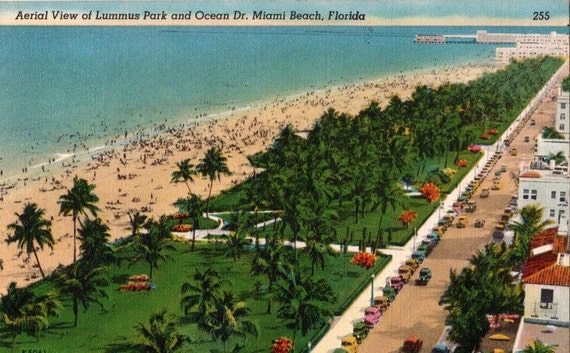
Should be “…you can google up photos, from about a hundred years ago and more, of the buildings along Miami beach ocean front…”
The early 20th century art deco hotels are a good example.
Here is a postcard of Lummus Park from decades before WWII…look at the cars, and compare this to a google street view of the same spot today…nothing has changed.
Here is one from the 1950s…those coconut palms all died off from lethal yellowing in the 1970s, and the Malays that they planted in the late 1980s are now nearly as big…and the beach remains…and is even wider now:
http://3.bp.blogspot.com/-JAGH7lseIJ4/VRYD3fELdYI/AAAAAAAAUmY/fck8KdBrL1Y/s1600/Screen%2BShot%2B2015-03-27%2Bat%2B9.28.05%2BPM.png
It is just offshore from where 41 runs into US1.
But it is not new…just recently developed.
“Remind me not to purchase a whole lot of property at Miami Beach”
Wish I had bought two whole lots 40 years ago. Then I could sell one lot and lie in my infinity pool with Tom Cruise shaking up the cocktails.
You do know why people would want to live in Miami Beach, surely?
Local environmentalists are hyping sea level rise in Annapolis, MD because of nuisance flooding, much of it due to land subsidence and back flow through the drainage systems, which have no check valves.
The catastrophist “X meters of rise by 2100” depends on a massive sudden collapse of substantial volumes of continental glaciers in both Greenland and Polar Antarctica (e.g. the core part, not the relatively minor mountain glaciers of the Antarctic Peninsula). There is no foreseeable mechanism capable of doing that.
Greenland ice can’t collapse, since the ground underneath is above sea-level. The same is true for East Antarctica.
Greenland’s interior (bedrock that is) is below sea level. It is only above sea level on the coasts. Of course, the interior of Greenland is actually over 9,000 feet high due to all the glacial build-up.
Mountains on the east and west side of Greenland oughta do a pretty good job of continuing the hold the icecap in place, like for the last umpteen bajillion years.
Rolling Stone has a recent long article, “The Doomsday Glacier,” claiming that there is such a mechanism. See:
http://www.rollingstone.com/politics/features/the-doomsday-glacier-w481260
Perhaps someone on our side should write a rebuttal.
That’s just a glacier in West Antarctica, not the massive East Antarctic Ice Sheet, repository of most of the planet’s fresh water.
But it is not going suddenly to melt, either. The “threat” is based upon models.
“The University of Washington study used satellite measurements and computer models to determine that the Thwaites could melt in as little as 200 years, or the melting could take as long as 1,000 years. Ian Joughin, a university glaciologist and the lead author of that study, said the most likely scenario is at the lower end of that range.”
http://www.latimes.com/science/environment/la-sci-0513-antarctic-ice-sheet-20140513-story.html
And melting of the entire West Antarctic IS would raise sea level only about ten feet.
A portion of that glacier breaks off about once every few years. Then it grows back. The portion is small in regard to the overall ice sheet, but they always report it in a scale that makes it sound enormous (“A piece the size of Rhode Island”.) Then they confound the issue with phrases like “Altogether, the glacier has the potential to raise global sea levels by an estimated two feet.”
https://www.washingtonpost.com/news/energy-environment/wp/2017/02/22/a-huge-antarctic-glacier-just-lost-another-chunk-of-ice-and-we-know-because-of-nasa/?utm_term=.00fbfae83d28
http://www.npr.org/sections/thetwo-way/2017/01/16/509565462/an-ice-shelf-is-cracking-in-antarctica-but-not-for-the-reason-you-think
There is no foreseeable mechanism capable of doing that.
Incorrect.
http://www.sciencemag.org/news/2014/05/west-antarctic-ice-sheet-collapsing
The WAIS has been “collapsing” for about 20,000 years. It didn’t merit hysterical headlines as recently as 1999.
http://earthweb.ess.washington.edu/Glaciology/projects/ross_sea_history/conway+.pdf
https://wattsupwiththat.com/2014/05/17/flashback-irreversible-collapse-of-the-west-antarctic-ice-sheet-from-1999/
“Hey, let’s get paid taxpayer money (the best kind of money) while worrying about things of unknown magnitude that might happen decades from now in uncertain locations while we ignore immediate, real problems!”
There is another periodicity in sea level not covered here. A ~19-year cycle was quantified a while ago (BC) by Meton of Athens, but the Babylonians knew of the cycle earlier. The cycle is applied in the National Tidal Datum Epoch, which uses tide gage measurements over the last 19-year epoch to compute tides for the next epoch. American Council on Surveying and Mapping covers it here:
https://tidesandcurrents.noaa.gov/publications/Understanding_Sea_Level_Change.pdf
NJ,
See my remark below.
The British government has no alternative but to take the climate back into public ownership….
A balanced response to the risks of dangerous climate change
Independent, evidence-based advice to the UK and Devolved Governments and Parliaments
https://www.theccc.org.uk/
MIAMI’S VICE ==> for data on Miami’s sea level problems, also see my essay, Miami’s Vice, posted Dec 2016.
Kip, yes I was surprised that no commenters thus far had noted your detailed, illustrated analysis of Miami flooding. IIRC, it is basically negligence of authorities in permitting construction, canal work and the like without the normal codes that coastal cities generally invoke. A foot or two of fill would have given the a couple of centuries of protection.
David,
You said, “To the extent that there is a trend (R² = 0.0945), …”
I think that this is a good time to remind the readership what the practical meaning of R² is. It means that, in this particular case, less than 1% of the variance in the dependent variable (MSL) can be attributed to (or predicted by) the independent variable (time). That is, there are one or more other influences that are much more important than time, or something highly correlated with time, that results in changing sea levels.
The important influences are unpredictable factors such as wind, atmospheric pressure, lunar cycles, local subsidence, local seasonal temperature changes, and global tectonics. Oceanic heating and glacier meltwater would appear to have an insignificant impact on short-term variations. The trend itself correlates better with temperature, but there are other long-term events such as lunar cycles and global tectonics that are probably of the same order of magnitude. That is, undersea volcanos and new sea floor generated at spreading centers will displace water, causing sea level to rise. Isostatic rebound in areas formerly covered by ice will also cause global sea level to rise.
With respect to lunar influences, Harris (1981) remarks in “Tides and Tidal Datums in the United States,” that there are four major lunar periods ranging from about 9 years to 19 years, which because of phase differences in the periods can constructively and destructively interfere. He also notes that the revolution of the solar ‘perigee’ (perihelian), with a period of 209 centuries, has a measurable influence on tides.
So, until such time as ‘researchers’ comprehensively evaluate the confounding factors of measured SLR, we should take any claims of “acceleration” with a large pinch of sea salt. It isn’t just temperature that is important!
Clyde, a factor I never hear mentioned vis a VIS SLR is the sediment delivered by rivers, glaciers and even wind blown from the Sahara and other significant arid regions into the seas. China’s rivers alone move 2 x10^9 t/y.
http://www.bing.com/search?q=annual+volume+of+sediment+deposited+in+the+sea&PC=SMSM&FORM=MBDPSB
Gary,
Yes, I’m sure that the sediment being delivered to the oceans also contributes to a rise. It certainly reduces the capacity of man-made reservoirs. However, we know that ‘geosynclines’ like the Mississippi Delta are subsiding, and I’m not sure how that interplay works out.
The old geosynclinal theory still works on many levels… particularly the Gulf of Mexico. While sediment loading didn’t build mountain ranges like the Appalachians, it has built subsurface “mountain ranges” of salt.
https://www.slb.com/~/media/Files/resources/oilfield_review/ors08/aut08/the_prize_beneath_the_salt.pdf
The alarmists would claim that the R² would be a lot higher if I filtered out all of the “noise” (seasonal, annual, decadal, etc. fluctuations). Globally, the R² is a lot higher because the secular 1-3 mm/yr is fairly global.
Since 99% of the local sea level fluctuation is cyclical, filtering it out of a discussion of Miami’s flooding issues is extremely dishonest and par for the course with alarmists.
Every time we have a King tide in the area or if the wind blows strongly from the east for a while, we get stories about man-made sea level rise. It’s as tiresome as it is predictable. I have noted here in the past, they often illustrate such “news” articles with pictures of rain flooding in Miami inland, far away from the shore and any sea level rise. It is the next panic since global warming failed to arrive. Once it gets debunked, we will be on to some other crisis. Ho hum.
The whole accelerating sea level rise gig is probably the most pathetic side of CAGW – but set against some seriously stiff competition nevertheless. The flagrant lying is exposed to maximum effect in this most moronic sub-section of climate junk science. The photos of cliff erosion with dwellings on the brink of tumbling into the cruel encroaching sea. The endless egregious lying about Miami. The Pacific islands fiasco and the faux OMG total horror of transient sand bars being washed away. All viewed against the backdrop of the actual data showing the entirely unalarming and absolutely expected natural sea level rise at this point in the glacial cycle. For we connoisseurs of climate corruption and deceit, sea level rise is truly the jewel in the crown.
You’re confusing science with the media.
No, really, I’m not. Junk climate science and the media are different faces of the same broken town clock.
Big numbers of very small units make things looks scary.
The problem is if you look at the actual tide gage data, you find none of that acceleration anywhere. It doesn’t show up in any single tide gage…only when some shill of a “researcher” adjusts the data. 100% of the signal is adjustment.
Muhs et al., 2011 (Florida)
https://www.researchgate.net/profile/Daniel_Muhs/publication/252792818_Sea-level_history_of_the_past_two_interglacial_periods_New_evidence_from_U-series_dating_of_reef_corals_from_south_Florida/links/0deec52d2d68cd5dc3000000/Sea-level-history-of-the-past-two-interglacial-periods-New-evidence-from-U-series-dating-of-reef-corals-from-south-Florida.pdf
Elevation measurements of both the Key Largo Limestone and the Miami Limestone indicate that local (relative) sea level was at least 6.6 m, and possibly as much as 8.3 m higher than present during the Last Interglacial period [115,000 to 130,000 years ago].
Donoghue, 2011 (Gulf of Mexico)
https://www.researchgate.net/profile/JF_Donoghue/publication/226009421_Sea_level_history_of_the_northern_Gulf_of_Mexico_coast_and_sea_level_rise_scenarios_for_the_near_future/links/0046352b207b95d6e9000000/Sea-level-history-of-the-northern-Gulf-of-Mexico-coast-and-sea-level-rise-scenarios-for-the-near-future.pdf
For much of the period since the last glacial maximum (LGM), 20,000 years ago, the region has seen rates of sea level rise far in excess of those experienced during the period represented by long-term tide gauges. The regional tide gauge record reveals that sea level has been rising at about 2 mm/year for the past century, while the average rate of rise since the LGM has been 6 mm/year, with some periods of abrupt rise exceeding 40 mm/year [4 meters per century]. … Sea level has at times risen at rates more than 20 times that of today, more than 40 mm/year. At such rates, the regional shorelines would have retreated by as much as 40 m/year, or more than 75 cm/week
“Just remember, kids – if the sea level rise doesn’t get you, the dreaded ocean acidification will.”
‘“Sea levels in South Florida could rise up to two feet over the next four decades”… No they can’t
I’m sure they could if they really tried.
An interesting read on “adjustments” to sea level “once-was-data”.
http://mycoordinates.org/our-influence-on-sea-level-is-negligible/
Anyone have an idea of the sea level rise off the Netherlands in the last 30 years. Seems impossible to get but I need it for a blog. Thanks if anyone can help.
The satellite-derived sea level data can be accessed here: http://sealevel.colorado.edu/content/interactive-sea-level-time-series-wizard
Pick a point on the map or enter Lat/Lon.
Tide gauge data from PSMSL can be accessed here: http://www.psmsl.org/data/obtaining/
Scroll down to the NLD (Netherlands) stations,
Virginia Key is the barrier island south of Miami Beach where a tide gauge was installed at the University of Miami marine School. The old one was removed when Miami Beach increased the width of its beach in 1980.
The new gauge on Virginia Key shows very high rates of SLR (5.3 mm/yr) as does Vaca Key (3.6 mm /yr ) while Key West is a more normal 2.4 mm/yr. The rapid rise is attributed to a combination of winds and currents “piling up” the water. The data can be found here http://andrew.rsmas.miami.edu/bmcnoldy/papers/MDPL_17Feb2016.pdf
It is a little bit odd that NOAA no longer shows Virginia Key at its tides-and-currents web site. There does not seem to be any subsidence as in coastal Virginia.
Any ideas??
3.6 mm/yr is not a high rate of SLR.
0.092 in/yr = 2.3 mm/yr
Thanks for the units conversion, but the rate for the last 20 years is 5.3mm/yr, which IS high when you consider Key West is not that far away. Is there is anything tricky in the way corrections are done or is this a cyclic fluctuation, and why did NOAA stop providing SLR trend data for Virginia Key?
I think it’s a function of it being a short time series.
I just picked a point in the Straits of Florida from the satellite data: http://sealevel.colorado.edu/content/interactive-sea-level-time-series-wizard?dlat=24&dlon=278&fit=n&smooth=n&days=60
I get a slope of 1.1 mm/yr for 1993-2016.
I think the author of that slide show would say that 5.3mm/yr vs 2.3mm/yr proves acceleration and that satellites always read lower than tide gauges. How would you answer that?
I would answer him with his own slides.
His “acceleration” is based on short cherry-picked segments. If sea level rise was accelerating, it would clearly show up in the longer time series. The time series would clearly be curving upwards, rather than linear.
Even if sea level rise was accelerating at Virginia Key, it’s not accelerating in any of the longer time series. Nor is it accelerating globally.
Elsewhere, I have argued that there is no acceleration signal in the 20 year Virginia Key data; however, 20 years should be long enough to determine a slope unless there is a long term variation in the gulf stream and we are seeing the upward slope of a cycle.
That said, I don’t know anything about satellites, but it is strange that a few of them could disagree so much with hundreds of tide gauges. But then what does global SLR actually mean?
The global average of the tide gauges don’t show any recent acceleration either. ?w=720
You could probably find several 20-yr segments in the Key West time series over which the slope would be greater than the long-term trend.
From Judith Curry and of interest to the fans of SLR.
https://www.nature.com/articles/ncomms4635
I skimmed it once will look again mañana.
The bear is in the woods…
Like the bear in the woods, the acceleration is always just out of sight, generally well-beyond the retirement dates of the authors of papers like this.
From Judith Curry and of interest to the fans of SLR.
https://www.nature.com/articles/ncomms4635
I skimmed it once will look again mañana.
From Judith Curry and of interest to the fans of SLR.
https://www.nature.com/articles/ncomms4635
I skimmed it once will look again mañana.
I think the author of that slide show would say that 5.3mm/yr vs 2.3mm/yr proves acceleration and that satellites always read lower than tide gauges. How would you answer that?
I think the author of that slide show would say that 5.3mm/yr vs 2.3mm/yr proves acceleration and that satellites always read lower than tide gauges. How would you answer that?
The same way I just did.
One would think that, for all the caterwauling about sea rise doom in Miami, they’d have a work gauge.
Or not, considering that it is harder for people to scaremonger when people do not have actual data to debunk.
Property prices in Venice are still holding up nicely despite the fact that it’s supposed to be disappearing.
http://www.telegraph.co.uk/finance/property/international/3360120/Property-in-Venice-A-little-place-by-the-canal.html
There are two obvious things wrong with that CSIRO-based EPA sea-level graph, which appears to come from this EPA page.
I used WebPlotDigitzer (bookmark it!) to digitize a couple of points on the graph, twenty years apart, to see what rate they are claiming. It is absolutely preposterous:
http://sealevel.info/sea-level-download1-2016_digitized_cropped.png
The two obvious things wrong are:
1. That graph wildly exaggerates the rate of sea-level rise from tide gauge measurements. In fact, it shows sea-level from tide gauge measurements as even more rapid than satellites! That’s nonsense. The sea-level from tide gauges actually averages about 1½ mm/year. Sea-level from satellite altimetry averages about twice that (and isn’t trustworthy).
2. That graph clearly shows average sea-level from tide gauge measurements accelerating over the last thirty years. Yet none of the best-quality, long-term, sea-level measurement records show such an acceleration. Some of them spike with El Niños, so there’s been a very slight uptick over the last couple of years, but there’s certainly been no upward curve resembling that EPA graph. Here’s a typical sea-level measurement record:
Sealevel.info: http://www.sealevel.info/MSL_graph.php?id=Honolulu
NOAA: https://tidesandcurrents.noaa.gov/sltrends/sltrends_station.shtml?stnid=1612340
http://www.sealevel.info/1612340_Honolulu_vs_CO2.png
(Note: Peltier estimates that Honolulu experiences 0.1 mm/yr uplift, which makes the global rate about 1½ mm/year.)
All of the best-quality, long-term, sea-level measurement records show that there has been no significant, sustained acceleration in rate of sea-level rise since the 1920s or before. Mathematically, if an average of several measurement records shows acceleration, it must be the case that at least some of the individual measurement records show acceleration, but the CSIRO bunch seem to somehow have found a way around that problem. I assume that it is an artifact of using a changing mix of tide gauges in their “average” over the period of time represented in the graph.
Or maybe it’s something even stranger. That group definitely does some strange stuff. That group’s Church & White (2006) was the first paper to claim to have detected a small “20th century acceleration in global sea-level rise.” About five years ago I reanalyzed the averaged sea-level data used in that paper (the output of a mysterious algorithm involving empirical orthogonal functions), and discovered that all their detected acceleration predated 1925. Their data actually showed a slight (statistically insignificant) deceleration after 1925. In other words, when CO2 levels rose above about 307 ppmv, sea-level rise acceleration ceased.
But there was more weirdness in that paper than that. This is a quote from the paper:
That sounds to me like a fudge factor, to increase the reported rate of sea-level rise! But I stared at it a while and wondered: why did they say “spatially?”
Surely, I thought, since they were reporting measured acceleration trends, the “additional field” must at least have been temporally uniform. So why did they use the word “spatially?” What other sort of non-uniformity could there be, besides spatial and temporal?
I emailed Drs. Church & White and asked them why they used the adjective “spatially.” Was the “additional field” temporally uniform, I asked? I’ve yet to figure out what that “field” was, but to my amazement Dr. Church replied that it was not temporally uniform.
In 2009 they posted on their web site a new set of averaged sea-level data, from a different set of tide gauges. But they published no paper about it, and I wondered why not. So I duplicated their 2006 paper’s analysis on their new data, and not only did it, too, show slight deceleration after 1925, all the 20th century acceleration had gone away, too. Even for the full 20th century their data showed a slight deceleration.
My guess is that the reason they wrote no paper about it was that the title would have had to have been something like, “Neeeeever mind: no 20th century acceleration in global sea-level rise, after all.”
Finally, in 2011, they posted another new dataset, and this one finally showed a acceleration for sea-level even after 1930, though it was very slight, and statistically insignificant.
South Florida, specifically parts of Miami are SUBSIDING up to 3mm per year:
http://www.ces.fau.edu/arctic-florida/pdfs/fiaschi-wdowinski.pdf
The South Beach tidal gauge reports sea-rise or 2.39mm per year.
Consequently, there is no sea rise in Miami….. only subsidence.
The tide gauge has not been on South Beach since 1980, but on another island with much less high-rise development. My theory of the 5.3 mm/yr is that they converted units incorrectly and it is really 0.8mm/yr.
The tide gauge has not been on South Beach since 1980, but on another island with much less high-rise development. My theory of the 5.3 mm/yr is that they converted units incorrectly and it is really 0.8mm/yr.