
Guest essay by Eric Worrall
The National Center for Science Education has in my opinion betrayed the scientific principles they claim to defend, by suggesting in its global warming primer that climate models are reliable, and by claiming the serially debunked Mann hockey stick graph is credible.
…
Q: Still, shouldn’t there be some explanation for the slowing? [the pause]
Yes, there should be, and while scientists are still trying to understand the details, the basic explanation almost certainly goes as follows. The addi- tional heat and energy trapped in the atmosphere by the rising carbon diox- ide concentration can manifest itself in several di erent ways, and the ris- ing surface temperature shown in figures 2.1 and 2.2 is only one of those. In fact, more than 90% of the added heat and energy is expected to warm the water in the oceans (as opposed to warming the land and ocean surface), and data indicate that the ocean waters have continued to warm without any evidence of slowing (figure 2.3).
…
Scientific models differ from the models you may be familiar with in everyday life, which are typically miniature representations of real objects, such as model cars or airplanes. In contrast, a scientific model is a conceptual representation, often developed with the help of com- puters, that uses known scientific laws, logic, and mathematics in an attempt to describe how some aspect of nature works. The model can be tested by seeing how well it corresponds to reality. Models are important in almost every field of science, but here we’ll focus specifically on models of Earth’s climate.
The principle behind a climate model is relatively simple. Scientists create a computer program that represents the climate as a grid of cubes like those shown in figure 2.6, so that each cube represents one small part of our planet over one range of altitudes in the atmosphere. The “initial conditions” for the model consist of a mathematical represen- tation of the weather or climate within each cube at some moment in time. This representation might incorporate data on such things as the temperature, air pressure, wind speed and direction, and humidity at the time the model begins. The model uses equations of physics (for example, equations that describe how heat flows from one cube to neighboring cubes) to predict how the conditions in each cube will change in some time period, such as the next hour. It then uses the new conditions and the equations to predict the conditions after another hour, and so on. In this way, the model can simulate climate changes over any period of time.
Decades ago, climate models were fairly simple, using grids no more complex than the one in figure 2.6. Over time, however, scientists have in essence used trial and error to make the models better and better. Again, the principle is easy to understand: If your model fails to reproduce the real climate in some important way, then you look to see what might be going wrong. For example, you might have neglected some important law of physics, or the cubes in your grid might need to be smaller to give accurate results. Once you think you know what went wrong, you revise the model, and see if it works better. If it does, then you have at least some reason to think you are on the right track, and if it doesn’t, you go back to the drawing board.
Today’s climate models are fantastically detailed, and they reproduce the actual climate of the past century with remarkable accuracy. Indeed, the modern models work so well that scientists can use them to conduct “experiments” in which they ask what would happen if this or that were different than it is. Figure 2.7 shows an example of the power this approach provides. The red curve shows temperatures over the past century and a half as predicted by the best available climate models, which take into account both natural factors affecting cli- mate, such as changes in the Sun’s output and volcanic eruptions, and human factors, such as the increase in the carbon dioxide concentra- tion from the burning of fossil fuels. Notice that these models provide an excellent match to the general trends in the real data (black curve). In contrast, models that leave out the human factors predict the blue curve, and as you can see, this curve does not agree with the observed warming of the past few decades. The fact that we get a close match between the models and reality only when changes in both natural and human factors are included gives us great confidence that human factors are the cause of the recent warming.
…
What’s the bottom line for Skeptic Claim 2?
There are no known natural factors that could account for the substantial warming of the past century. We’ve discussed two sets of observations that definitively rule out the Sun as the cause: (1) solar energy input has been falling while the temperature has been rising; and (2) the upper atmosphere has been cooling while the lower atmosphere warms, which is consistent only with greenhouse warming, not warming due to the Sun. Scientists investigate other potential causes with models, and today’s sophisticated models match up extremely well with observations of the actual climate — but only when we include the human contributions to global warming, not natural factors alone. The match makes it highly likely that the models are on the right track, giving us further confidence in the idea that human activity is the cause of most or all recent global warming.
…
Wait — didn’t I hear that the hockey stick graph has been discredited?
Well, you probably have heard this, since it is frequently repeated in places like the Wall Street Journal’s op-ed pages, but it is not true. The original version of the “hockey stick” was published by climate scientist Michael Mann in 1998, and he used only a single data set. Skeptics jumped on it, claiming all kinds of reasons why the data should be doubted. Scientists took the skeptic concerns seriously, and therefore did what scientists do: They investigated in more detail. Indeed, the reason you see so many data sets — from independent sources including tree rings, corals, stalagmites, ice cores, and more — in figure 2.10 is that the scientific community went to great lengths in trying to either confirm or refute Mann’s original “hockey stick.” Keep in mind that every curve you see in figure 2.10 represents many years of fieldwork and careful research by a substantial group of scientists, who often put their lives on the line to collect the data in remote and dangerous locations. As you can see, these additional studies clearly confirm Mann’s original conclusions. Still not mollified, the skeptics were so adamant in their objections that they convinced Con- gress to ask the National Research Council (NRC) to investigate those conclusions. The NRC report, published in 2006, concluded that the graph and the data were fully valid.
…
Read more: https://ncse.com/files/pub/evolution/excerpt–primer.pdf
The NCSE document clearly contradicts itself with regard to the reliability of climate models. The suggestion that models are so reliable they can be used to conduct climate experiments is ridiculous in the face of the admission that the reason for the pause is still being investigated, that the models might have to be adjusted. The “modern” models have failed their first serious test.
One third of all the CO2 humans have ever produced was emitted during the pause. If model assumptions were correct, this should have blown global temperatures sky high. The fact surface temperatures stagnated, you can’t simply sweep an anomaly like that under the carpet, or into the ocean. Even if the ocean did swallow the heat, a valid climate model should have predicted this. If a model cannot predict when the ocean will swallow vast amounts of excess heat, then projections of future temperature are utterly unreliable.
As for suggestions Mann’s hockey stick has been upheld by scientific investigation, you could read many excellent analysis of hockey stick methodology issues, but what I find most intriguing is that even the scientists who helped produce the hockey stick had reservations – they just chose not to talk about those concerns in public.
Climategate email 0938018124.txt (CRU Professor Keith Briffa in September 1999, recipients include Michael Mann)
… I know there is pressure to present a nice tidy story as regards ‘apparent unprecedented warming in a thousand years or more in the proxy data’ but in reality the situation is not quite so simple. We don’t have a lot of proxies that come right up to date and those that do (at least a significant number of tree proxies ) some unexpected changes in response that do not match the recent warming. I do not think it wise that this issue be ignored in the chapter.
For the record, I do believe that the proxy data do show unusually warm conditions in recent decades. I am not sure that this unusual warming is so clear in the summer responsive data. I believe that the recent warmth was probably matched about 1000 years ago. …
Climategate email 3759.txt, sent to Keith Briffa in August 2000, discusses substantial evidence that the medieval warm period and little ice age were global, not local variations of limited geographic scope, as was claimed by Michael Mann.
Hi Keith,
Here is the Oroko Swamp RCS chronology plot in an attached Word 98 file and
actual data values below. It certainly looks pretty spooky to me with
strong “Medieval Warm Period” and “Little Ice Age” signals in it. It’s
based on substantially more replication than the series in the paper you
have to review (hint, hint!). In terms of rbar, sample size, and eps, it is
probably okay back to about AD 980 at this time. I still have 3-4 more
subfossil sections to process, but it is doubtful that the story will
change much. When I come over in October, I am thinking about asking
Jonathan Palmer to come over from Belfast for a visit. What do you think
about that?
Ed …
Cimategate source material available from Wikileaks
Oroko Swamp is in New Zealand, a long way from Northern Europe, where the medieval warm period and little ice age are documented history. The existence of a substantial global medieval warm period and little ice age is a direct contradiction of the flatness of the pre-anthropogenic component of Mann’s hockey stick reconstruction. And its not just the reconstruction from Oroko Swamp in New Zealand – other proxies from Japan, Antarctica and elsewhere have confirmed that the medieval warm period and little ice age were global.

Submitting to pressure to tell a nice tidy story, at least in public, ignoring or discounting evidence which contradicts the alarmist position, trying to sweep aside criticism of a theory by suggesting everything is OK because a major anomaly is being investigated – this isn’t the scientific method I was taught.
In my opinion the NCSE is doing a grave disservice by advancing such a nakedly partisan assessment of climate science, by ignoring or glossing over very real issues with climate alarmist positions. I’m not suggesting the NCSE should necessarily take the skeptic position on every climate issue, but a little more balance would provide a much better teaching resource for their audience. Let us hope the NCSE have the integrity to apologise for and correct their unbalanced assessment, once they realise what they have done.
I wouldn’t hold my breath on the national Center for scientific education correcting anything. They are creatures of D.C. and this was all quite deliberate
Agreed. They have too much invested in the CAGW narrative to ever admit doubts.
NCSE is located in Oakland, California, not DC. However, I know Jenny Scott, who was director of NCSE back when they embraced climate alarm. They did so without consulting their membership. I was a member then, and was badly surprised by their announcement.
I contacted Jenny, warning of the lack of science in AGW. She would not hear a contradictory word, and was as arrogant and rejectionist as the standard bigot.
I sent a manuscript to NCSE Reports, outlining the failings of AGW science. Editor Andrew Petto took every excuse to reject, with Jenny’s support.
NCSE became the very same anti-intellectual people they had previously opposed.
Thanks for the insider info on what is going on there.
Looks pretty clearly to be “anti-science” and “climate science denial” to me.
Yes, disappointing to see the NCSE take up the climate alarmism topic.
But it isn’t like they have changed their approach to things. Still the same old arrogant, “consensus science” stance they have always peddled. New issue. Same approach.
Fire (dismiss) them all, or let burn in the next riot.
The Royal society and NASA still stand behind the facts that the greenhouse effect is causing records high temperatures. They know a lot.
The more you think you know the less you really know.
Yes, they know a lot that just ain’t so.
No, Steve, they do not.
They cannot stand behind the “facts” about AGW.
There aren’t any. Only speculation and conjecture.
Not one piece of data proves causation between CO2 and “record high temperatures.”
Another strenuous objection!
“They know a lot.”
The Royal Society know a lot of well connected people in the British establishment. They also knew what questions NOT to ask when conducting their whitewash “investigation”. They also knew to choose a previous member of UEA CRU to “investigate” his old pals.
Yes, they know a lot all right. But perhaps not the “lot” you were imagining in your comment.
Steve said:
“The Royal society and NASA still stand behind the facts that the greenhouse effect is causing records high temperatures. They know a lot.”
Reply
The temperatures are not “record highs”.
99.9999% of earth’s past has no real-time measurements for comparison !
The average temperature is merely said to be up +1 degree C, in 137 years (since 1880) — with a reasonable margin of error of +/- 1 degree C., so we can’t be very certain of that +1 degree:
(1) At least half the “warming since 1880 is “adjustments” to raw data
(2) Even today, a majority of our planet’s surface has no measurements, so wild guesses are used
(the coverage was far less in the 1800s.
Another way of looking at the past 137 years is to say the temperature range was only 1 degree C.
There was a warming trend from 1910 to 1940
There was a similar warming trend from 1975 to the early 2000s
The first warming is said to be natural
The second warming was said to be caused by CO2
There has never been an explanation for how, or why, 4.5 billion years of natural climate change suddenly
stopped in 1975, and man made CO2 allegedly became the climate controller.
In fact The Royal Society and NASA do not know a lot — the causes of climate change are unknown, the future climate can not be predicted, and manmade CO2 is not likely to be a major variable for many reasons I explain in my free climate change blog (address below)
You are mistaking the overconfident predictions of government employees … who have actually been making grossly inaccurate climate predictions for the past 30 years — with knowledge.
One thing you may want to learn about life is that predictions of the future are usually wrong, so its no surprise that climate predictions have been consistently wrong for three decades.
Climate change has become a big policy favorite of Democrats and liberals — liberal teachers brainwash their students.
They claim a climate disaster is coming, so everyone must do as the liberals say without question.
Real scientists welcome questions and try to answer them.
But Climate questions are never answered by liberals, except with character attacks, and ridicule, and wild guess predictions of the future climate.
Skepticism is the primary attribute of a good scientist.
Most scientists in history ended up being wrong about science — ranging from slightly wrong to completely wrong.
You, Mr. Steve, need to be more skeptical of authorities who make wild guess predictions of the future climate seem believable by wearing a nice suit and having a science degree.
The good news about the climate now is its wonderful, and has barely changes from the early 2000s to April 2017 in spite of lots of CO2 added to the air — the greenhouse theory says that can’t happen ,,, but it did,
I doubt if I have changed your mind and made you more skeptical of climate predictions.
I usually treat “global warmers” as lost causes, and give them as little respect as possible, but I tried to be nice to you.
My free climate website for non-scientists:
http://www.OnionBloggle.Blogspot.com
Sorry wrong blog address:(I write three blogs !)
My climate blog is
http://www.elOnionBloggle.Blogspot.com
or click on my name
Steve, is deep into the argument from Authority fallacy.
Boring…..
Elsewhere he demonstrates an expert level grasp of the argument from ignorance fallacy.
I have a greenhouse. It does not warm by CO2, even if I added some for the plants. It works by preventing convection. It warms up by sunshine. All the hiroshimas of heat do vanish during the night. No heat is being stored, proven by the trend which is equal in and out.
What was the name of your effect again?
Hugs,
Greenhouses warm the same way a sun bather behind a wind break is warmer than one out in the open.
I suppose that could be considered convection – sort of.
Steve,
Adding a /sarc tag [if appropriate; and I, for one, thought it was] would have saved many commenters some work.
If not /Sarc, though, I misunderstood you. And do read Richard Green, above, carefully.
Thanks.
Auto
This is an organization with advisors like Michael Mann, Bill Nye, Bill McKibben and Jim Hansen. Why bother.
Eric, if the NCSE received, say, 200 letters of complaint about its bias with a useful number CC’d to various media outlets do you think they would react ? And who funds them ?
Today’s climate models are fantastically detailed…
yep, $billions to show as CO2 increases….temps increase
Have got a link that confirms BILLIONS of dollars have been spent because the experiment that proves more co2 = higher global temperatures was proven more than 1 hundred years ago. I read the science and it didn’t cost me anything. You could read the science as well. A good education.
Wiki??? Read version 2 from the original author. But no one talks about OOPS. Alley, that is.
Explain this, Steve:
CO2 UP. WARMING STOPPED.
Royal society and NASA were my source of education.
Well, Steve. You get an “A” for typing speed, but I’m afraid you get an “F” in “Science.” You attended a class that was not designed to teach facts, but, rather propaganda.
You have been misled. Shrug. Sorry.
engarp: Prove it has resumed to a statistically meaningful degree.
What “experiment” was that? Ref required. You cannot do an experiment which proves ” more co2 = higher global temperatures” unless you have a spare planet to play with. You may be confusing with an experiment to show the radiative properties of a gas in laboratory conditions. How the climate reacts to such a change is a different matter.
You have displayed your total ignorance of the scientific method in confusing the two.
You should go back and read “the science” again.
Steve May 3, 2017 at 7:30 pm
Enlighten us
State how many degrees warming happens for each percentage increase of CO2.
I expect an answer with references.
The Arrhenius experiment showed that in a closed tube CO2 was excited by infrared and the temperature of the gas in the tube increased.
It most certainly did not “Prove more co2 = higher global temperatures” as you may have noticed the atmosphere is not a closed tube and contains only ~400ppm CO2. No observational evidence has shown that CO2 in the atmosphere has caused any warming. Mathematical models of the atmosphere that instantaneously add CO2 to an immobile atmosphere claim to show that there is warming, but balloon sondes do not show that to be the case in the real world. Neither does the recent pause agree with the hypothesis that more CO2 in the atmosphere causes warming. Indeed, observations of historic CO2 levels from ice cores and other proxies show that as the concentration of CO2 in the atmosphere rises the Earth can cool and that in all cases temperature rises precede CO2 rises. This seems to be more inline with Henry’s law than with any infrared trapping.
You should also realize that experiments can only disprove a hypothesis not prove it.
Neither Steve nor enargpia have a clue as to what “statistically significant” means.
They’ve got their marching orders and they are going to follow them.
MarkW, what is “statistically significant” is the Lord Monckton has stopped publishing his monthly “Pause Continues now for X months” articles.
Michael, so what? We all knew that the recently passed El Nino would interrupt the months since series.
You preen as if you have discovered something unique and meaningful.
Current temperatures have dropped back to what they were before the El Nino and in 6 months or so, the series will more than likely resume, with the pause now exceeding 20 years.
A “pause” that ended cannot resume. It’s over. The next pause will start a 1-month, then go to 2-months, etc.
Michael Darby, the pause never ended. For the pause to end you need ENSO neutral conditions to show warming. That hasn’t happened. The trend for ENSO neutral months over the past 20 years is flat.
@ Alan, the 50X coin toss brought to mind the “No Country For Old Men Coin Tosses”, here’s one:
Michael, do you take courses in embarrassing yourself?
Of course the pause can resume. The pause is defined as the length of time that a trend line starting from the present can continue back in time while having no statistically significant upward trend.
At some point in the future, if there is no further warming, the trend line will continue past the recent El Nino.
MarkW says: ” The pause is defined as the length of time that a trend line starting from the present can continue back in time while having no statistically significant upward trend.”
..
.
So, according to Mark, the “pause” is now going on 800+ years, since you can go back all the way to the MWP to find no statistically significant upward trend. Congratulations Mark, you just wiped out the LIA!!!!!
…
We can even wipe out the MWP if we go back to the Roman warming period!!!!!
According to MarkW’s definition, “the pause” has been going on now for 2 years: http://woodfortrees.org/plot/rss/from:2015.2/plot/rss/from:2015.2/trend
MarkW, if you go back 2 and 1/4th years, the “pause” ends: http://woodfortrees.org/plot/rss/from:2015/plot/rss/from:2015/trend
Michael, it really is nice of you to go so far out of your way to demonstrate how little you know of math as well as science.
If you have something factual you want to say, for once, say it.
If all you want to do is scream nonsensical pablum, be my guest. It just further discredits you and the rest of your fellow trolls.
Well, for some years in some data sets.
I wish you were accurate, but no, there is still a 30 year increasing temp trend, as well as 60 and 120 yr. So I’d say climate has been warming up. For this very moment climate is definable only afterwards.
But Janice, I do give an advice. Steve is trolling us. You get very picky when that happens. I like more when you give high-fives to Anthony.
Hugs.
A spectacular misunderstanding from your side.
A pause and a winning streak work the same way. If your favorite sports team wins 10 games in a row, they have a 10 game winning streak. If they lose the 11th game, the streak is over. If they then win the 12th game, the streak does not resume. If you are watching a movie on a DVD player and hit the pause button, the pause ends when you press the resume button. If we follow your logic, then the MWP never ended, and modern warming has merely “resumed” the warming from the past, erasing the LIA.
Michael Darby, silly analogies. The pause is simply a measure of whether there’s been an upward movement of the global temperature or not. You need to compare like with like. That means El Nino with El Nino, La Nina with La Nina and neutral with neutral. None of those measures show any warming in the satellite data.
I realize you are digging deep to try and find anything at all to maintain your belief system. Sadly, your comments demonstrate your bias all too clearly.
Richard M, here is all of the satellite data. Nothing left out. I don’t see any “pause” in it. http://woodfortrees.org/plot/rss/plot/rss/trend
That would mean the warming stopped, would it not?
That piece of crap immediately made me think of a scene in Tora! Tora! Tora!
http://www.imdb.com/character/ch0218788/quotes
10+!
David — document in reference to what?
In the movie, Tora! Tora! Tora!, Secretary Hull is referring to the the Japanese declaration of war, which had just been handed to him by Japanese Ambassador Nomura.
When I read the piece of crap from NCSE, it made me think of this phrase: “I have never seen a document so crowded with infamous falsehoods and distortions, on a scale so huge that I never imagined until today that” anyone with an ounce of integrity and an IQ above 13 “was capable of uttering them.”
Got it. The declaration of war was probably full of justificatory accusations of US wrong-doing.
Ditto, Alex’s comment.
I believe the proper term for this is cult pamphlet.
Propaganda will not change what did or did not cause the planet to warm in the last 150 years.
Every warming period in the paleo record was followed by a cooling period, sometimes abrupt cooling.
It is a fact that there has been an abrupt change to the solar cycle. There is now observational evidence of increase cloud cover, cooling, and increased precipitation which is in the same regions and the same type of ‘climate change’ as was observed in past cyclic cooling periods.
There is observational evidence that greenhouse gases cause no warming which is a paradox. A paradox is an observation that is not possible if a theory/ (model assumptions) are correct.
There is a reason the cult of CAGW talks on and on and on concerning the warmest year in ‘recorded’ history. ‘Recorded’ history is the temperature in the last 150 years.
1) Latitudinal warming paradox (warming in the last 150 years has been primarily high latitude warming not global warming). As CO2 is evenly distributed in the atmosphere and as the most amount of long wave radiation emitted to space is at the equator, the most amount of ‘greenhouse’ gas warming should have occurred at the equator.
2) The earth has warmed and cooled cyclically the past paradox
It is a fact that the earth cyclically warms and cools, with the majority of the warming occurring at high latitudes. It is also a fact that solar cycle changes correlate with the cyclic warming and cooling of the planet.
The warming that has occurred in the last 150 years is high latitude warming.
3) The lack of correlation in the paleo record between atmospheric CO2 levels and planetary temperature
There are periods of millions of years when atmospheric CO2 has been high and the planet is cold and vice versa. There is not even correlation in the paleo record.
It is a fact that there has been cyclic warming in the paleo record both poles. The magnitude of the past warming cycles is a great or greater than the recent warming period.
http://wattsupwiththat.files.wordpress.com/2012/09/davis-and-taylor-wuwt-submission.pdf
I wonder what caused cyclic warming and cooling on the Greenland Ice sheet in the past? Curious that the same periodicity (time between events, 1500 years with a beat of +/- 400 years) between all warming and cooling events/cycles (including the massive ‘Heinrich’ Event is the same (same periodicity, same forcing function). It is also really weird that the warming and cooling periodicity is observed in both hemisphere.
Greenland ice temperature, last 11,000 years determined from ice core analysis, Richard Alley’s paper. William: As this graph indicates the Greenland Ice data shows that have been 9 warming and cooling periods in the last 11,000 years.
http://www.climate4you.com/images/GISP2%20TemperatureSince10700%20BP%20with%20CO2%20from%20EPICA%20DomeC.gif
It is a fact that albedo changes due to cloud cover completely explain all of the warming in the last 20 years. There are solar cycle mechanisms which explain the cloud cover changes.
Mechanism where Changes in Solar Activity Affects Planetary Cloud Cover
1) Galactic Cosmic Rays (GCR) (Silly name for mostly high speed milky way produced protons that strike the earth’s atmosphere and create cloud forming ions)
Increases in the sun’s heliosphere strength and extent reduces the magnitude of GCR that strike the earth’s atmosphere. Satellite data shows that there is 99.5% correlation of GCR level and low level cloud cover 1974 to 1993.
2) Increase in the Global Electric Current flow (Electroscavening mechanism)
Starting around 1993, GCR and low level cloud cover no longer correlate. (There is a linear reduction in cloud cover.) The linear reduction in cloud cover does correlate with an increase in low latitude solar coronal holes, particularly at the end of the solar cycle, which cause solar wind bursts. The high speed solar wind bursts create potential difference between from high latitude regions of the planet and the equator. The increase in potential difference removes cloud forming ions from high latitude regions and the equatorial region which causes changes in cloud properties and cloud duration which causes warming in both locations.
http://solar.njit.edu/preprints/palle1266.pdf
Checkout the lack of melting on the Greenland Ice sheet and super high snowfall.
A step change in ‘climate’ requires a physical cause. The cause is the solar cycle change.
http://beta.dmi.dk/en/groenland/maalinger/greenland-ice-sheet-surface-mass-budget/
This swamp must be drained.
I like the description of a climate model as dividing the atmosphere in “cubes”. A cube is 100 miles South-North times 100 miles East-West times 100 miles vertically. While the horizontal dimension of 100 miles is typical of current models, the vertical step is more like 1/2 mile, so the cube is wide but extremely thin. How you model a thunderstorm in that model is still beyond me.
This particular part of the swamp should be napalmed!
” I love the smell of napalm in the morning.”
Only letters from members of Congress and White House staff will get the attention of NCSE trough-feeders.
It wasn’t money, Chimp. It was sincere piety.
The NCSE board that decided to go down the AGW chute didn’t have a single physical scientist on it. Their consultants were Jim Hansen and Peter Gleick.
It’s noble cause corruption all the way down, for them.
There must be some sort of prize for the greatest ratio of fallacies to words in one sentence, and I think this one should be nominated.
Wow! Beaten by two contenders already:
“We can’t find the natural factors … but when we put them in the climate models …”
I can see how the logic failure escapes them but really.
The whole thing is based on speaking points developed over a few decades to see what works with the pro-global warming audiences and what doesn’t. And even if the explanations are illogical and not supported by the real data, as long as it continues to work with the faithful, they keep using it.
So their models include a “human factor” they add to natural observations…. and that gives us…
Get ready for this:
Their highly biased models!
HA!
This statement makes no sense.
If the model doesn’t match up when you exclude human impacts, when you assume human impacts account for all of the warming then of course it’s not going to line up.
They obviously need to rework their model of natural climate drivers to match up with current temperatures and THEN run that model into the future to test its predictive capacity.
But if they have no idea how to model natural climate drivers how good could their model be but one that matches co2 concentrations?
A multi-decadal decline in global windiness is one explanation they hadn’t thought of.
“There are no known natural factors that could account for the substantial warming of the past century.”
The same natural factors that accounted for the substantial warming from 1910 to 1940 could be what did it. The warming from 1910 to 1940 was of the same magnitude as the warming from 1978 to the present. The warming from 1910 was not caused by excess CO2 in the atmosphere, so there is no reason to expect that the current warming is anything but natural.
What grade is this propaganda aimed at, btw? Third grade? High school? College?
egarpia : natural variation! The slope and extent of earlier recognized warming trends and intervening cooling trends follow a 60-70yr cycle. There are also several other cycles at longer intervals. The cooling trend of the ’40s to 70s which preceded the warming trend to ~1998 actually had the scientific community of the time certain with high confidence that we were being herded into an ice age caused by human activities. Mass starvation and conflict would engulf the world by 2000 if we didn’t do something immediately.
Dr. Ehrlich of Berkeley, who predicted the deaths of a major proportion of mankind in this scenario, immediately segued into CAGW without skipping a breath. The natural variation effect, much employed by skeptics in their arguments then took a hit in 2007, when James Hansen altered the temperature record massively to get rid of the 1937 all time high that reigned over 1998’s high. 1937 still is the reigning record high in every US states’ series, Canadian provinces, Greenland, Iceland, Siberia, and in the southern hemisphere: Ecuador, Paraguay, South Africa, and others.
Following 1998, the temperature (right on schedule) went into a “pause” that lasted 18 yrs and was even beginning to decline after 2005. A number of prominent climate scientists went into clinical depression (popularly known as the Climate Blues) and basically stopped working because of what this dreaded pause, during which period CO2 increased by 30%, suggested about the beliefs they had held for most of a working lifetime (they rationalized it differently and suffered because they rejected what their own minds were trying to tell them, ironically the venerable psychiatric neurosis termed “dзиial” ). After 18 yrs, in June 2015, a CAGW scientist at NOAA, Tom Karl, a week or two before his retirement, jiggered global sea surface temperatures (SST) to erase the scourge that was the pause.
I hope this bit of history helps you to understand what the battle for honesty in science has been like. For more, read selected climategate emails that were dumped on a server by an insider at the Univ of East Anglia (UEA) UK. They reveal the dirty tricks that the core scientists in the CAGW movement were up to.
We don’t know what caused the Minoan, Roman, or Medieval warm periods or the little ice age either.
That is exactly the reason some people try to argue they didn’t happen. Go see SKS and try to locate warm periods. Our models don’t explain them, so they can’t exist. The logic has been going backwards for some time, probably because some scientists went fully Nye Quadrant a long time ago.
You are right “no known natural factors is true”. Burning fossil fuels is the answer. You should google greenhouse effect it will educate you.
Steve obviously hasn’t heard of global brightening.
Global brightening came about because we centralised coal burning, then added filters to the smoke stacks. That meant less aerosols in the air. This it is proposed caused warming. A two step reduction.
Think the old smoggy London.
Jer0me:
That quotation alone warrants major revision or withdrawal of the document because they should “know”.
For example, the recent climate changes could be attributed to changes in cloud cover: clouds reflect sun light back to space so it does not reach the Earth’s surface. Human activities have provided much less variation to radiative forcing that causes warming than the observed recent variations in cloud cover.
Good records of cloud cover are very short because cloud cover is measured by satellites that were not launched until the mid-1980s. But it appears that cloudiness decreased markedly between the mid-1980s and late-1990s
(ref. Pinker, R. T., B. Zhang, and E. G. Dutton (2005), Do satellites detect trends in surface solar radiation?, Science, 308(5723), 850– 854.)
Over that recent period of less than two decades, the Earth’s reflectivity decreased to the extent that if there were a constant solar irradiance then the reduced cloudiness provided an extra surface warming of 5 to 10 W/sq metre. This is a lot of warming. It is between two and four times the entire warming estimated to have been caused by the build-up of human-caused greenhouse gases in the atmosphere since the industrial revolution. (The UN’s Intergovernmental Panel on Climate Change says that since the industrial revolution, the build-up of human-caused greenhouse gases in the atmosphere has had a warming effect of only 2.4 W/sq metre).
Richard
CO2 is to alarmists as “The God of the Gaps” is to creationists. It explains every event, and accounts for every inconsistency.
Steve, they have identified many natural factors, for example when temperature was not rising(assuming it is now just to avoid that discussion) one of the multiple excuses used and is repeated in this paper, is the heat was absorbed faster then usual by some unknown mechanism into the ocean. If this mechanism can cause more heat into ocean then could it not have also reversed and released enough heat to account for global warming?
This is not in any climate model. So, you can’t say all known natural causes are accounted for, then turn around say but this one accounts for cooling e just didn’t account for it. Can you not see the contradiction?
Great comment, I think we should adopt ” rate of fallacies to words in one sentence” as an official ratio measure of alarmist hysteria – lots of work to do then!
+ 100
It’s called arguing from ignorance.
I can’t think of anything else, therefor it must be …
The fact that you can’t think of anything else is proof of the fact that you can’t think of anything else. Nothing more.
Because of the scale of the grid cells. There really is not all that much in the climate models. Everything interesting has been parameterized.
This kind of propaganda would cease if Pres Trump would follow through on his promise to get us out of the Paris Accords and zero out climate change (global warming) research. But the recent budget “deal” does not bode well for draining the swamp. On the contrary, it suggests that the RINOs and Democrats will roll Pres Trump just like they have always done in cooperation with the Democrats to bust the budget.
Unfortunately, too many congressional Republicans have an irrational fear of being blamed for government shutdowns.
The Congressional Republicans have good reason to fear being blamed for any government shutdown because the MSM always succesfully blames them for it.
Republicans don’t know how to defend themselves from the MSM. Many of them want to be loved by the MSM so confronting the MSM over their lies about who is causing a government shutdown isn’t in the cards for a lot of Republicans. Which just shows the power of the MSM to control the narrative. They can prevent Republicans from taking action just by threatening them with criticism if they do.
Trump is different. 🙂
Trolls believe what trolls are paid to believe.
When Reagan vetoed the Democrat budget and government shut down, it was the fault of Reagan because the budget originated in the house and the house represents the people.
When Clinton vetoed the Republican budget and government shut down, it was the fault of the Republicans because the president is the one person who represents all the people. While senators and representatives have only their parochial priorities.
I know this because that’s what the media told me.
“Trump can grab genitals and get away with it.”
Trump said he could, not that he did. He was playing one-up with another celebrity at the time. Ever been in a lockerroom with a bunch of guys before? I hear female lockerrooms have a lot of sexually-oriented talk going on, too, although that’s hearsay on my part. I do know some women outside a lockerroom who talk just as nasty as any man.
Bottom line: There is no evidence Trump ever forced himself on a woman. There is a LOT of evidence that Trump has helped nummerous women over his lifetime.
TA: ” There is no evidence Trump ever forced himself on a woman.” Mr. “I never settle” https://en.wikipedia.org/wiki/Donald_Trump_sexual_misconduct_allegations#Jill_Harth_.281992.29
Allegation equals proof.
But only if you don’t like the accused.
MarkW, you are spot on
Allegations = Proof is kind of like correlation = causation. If you want it to be true then that’s all the evidence you needed
Or if the train gets back on track in September with a niceknockdown, dragout shutdown, after Kimmie gets kalmed down.
Trump is real close to getting all his ducks in a row. The House just passed a budget bill, which now goes to the U.S. Senate, and the word is that a vote on the Obamacare replacement bill will be held tomorrow. I suppose Paul Ryan is a good vote counter, so it looks like the healthcare law will pass the House, then it goes to the U.S. Senate.
The Senate will be tricky because the Republicans barely have a majority, and some Republicans might not get with the program, so there is difficulty ahead but maybe it can be overcome.
The Democrats better watch their obstructionism. They are going to force the Republicans to pull a Harry Reid and reduce the requirement for passing bills in the U.S. Senate to a simple majority, rather than the 60 votes currently required. If all the Democrats are going to do is obstruct, then we have to go around them.
Trump is going to be a busy man in 2018. He will be out campaigning for lots of Republican Senators in an effort to increase Republican numbers in the Senate in order to make the obstructionist Democrats irrelevant.
“In fact, more than 90% of the added heat and energy is expected to warm the water in the oceans (as opposed to warming the land and ocean surface)…”
Can anyone please explain to this skeptical layman how the 4 CO2 molecules out of every 10,000 warm not the land, and not the ocean surface, but water deeper in the oceans? How do they “know” and “choose” the deep ocean and avoid the land and ocean surface? In fact I still have trouble believing and understanding how those 4 CO2 molecules can appreciably warm anything to any *significant* degree, unless there’s some sort of atomic fission reaction taking place!
Shut up, that’s how.
🙂
It could be an amazing instance of “cold fusion”, except that the results cause warming so it’s called “warm fusion”.
I know this sounds crazy but I’m just trying to follow their logic…. or lack thereof.
Its called the grenhouse effect. Its been irrefutable science for more than 100 years. Google it. It explains everything.
Does it explain the missing “hot spot”? Does it explain the “pause” shown in the satellite temperature records. Does it explain the Younger-Dryas, the Roman and medieval warming periods? Does it explain the cosmic background radiation? No. Well I guess the greenhouse theory does not explain “everything”, does it.
LOL! Steve — you are so much FUN! 🙂
I have a feeling I know who you might really be…. lololo.
Well, you, heh, know this, I am almost sure, but…. in case you might fool someone:
The question:
how the 4 CO2 molecules out of every 10,000 warm not the land, and not the ocean surface, but
?
about water deeper in the oceans
is not answered by asserting the fact that a “greenhouse effect” exists.
It’s not even 4 molecules per 10,000, it’s actually just 1 extra molecule or so per 10,000.
That’s some dammed powerful molecule, right there!
Janice. ‘Steve’ must be Robin Whitlock. If not, it is the first recorded occurrence of the ‘ Whitlock effect’.
Steve. You should know that aa far as global warming is concerned, Google is your fiend.
Steve:
Everyone here knows what the greenhouse effect is supposed to do:
Gradual warming of about 1 degree for each doubling of CO2 based on laboratory experiments.
Warming mainly at the poles at night.
All totally harmless.
At a 2 ppm increase of CO2 every year, it would take 200 years for +1 degree of warming at night = still totally harmless (I’m assuming people would still be using fossil fuels for the next 200 years, although I doubt it,)
Then we have reality, which is NOT matching the greenhouse theory,
such as having little warming around the south pole,
most years since 1940 having a cooling or a flat trend,
almost no warming from the early 2000s to April 2017,
cooling from 1940 to 1975,
and no hot spot in the atmosphere over the tropics.
Most important is the warming from 1910 to 1940 was not blamed on CO2, even by the IPCC, while the very similar warming from 1975 to early 2000s is blamed on CO2, as if natural climate change suddenly stopped in 1975.
There is nothing unusual about the climate in 2017.
The climate change from 1880 to 2017, of +1 degree C, is normal for our planet — actually unusually stable.
I’ve tried to be nice to you but I’m not that nice a guy — you are a brainwashed parrot on climate change with no skepticism, and no desire for any independent learning.
You seem to believe everything liberal politicians and government officials tell you — yet I can’t imagine you believe everything (or anything) conservative Bush or Trump said.
I suppose in your fantasy world liberals always tell the truth, and conservatives never do.
And if a liberal tells you that runaway global warming is coming, then it must be true.
And never mind that liberals have been saying that for 30 years … starting right after they stopped telling us global cooling was coming!
You, Steve, are what real scientists, logical people, and people without political bias, would call a left-wing parrot.
You repeat what you are told by liberal media sources, never question what you are told, and never bother to learn anything of value independently about climate change … or human nature.
You have no idea how common it is for leaders to gain power by predicting a catastrophe, and then telling ordinary people they can prevent it.
Religious leaders do that.
Political leaders do that.
A lot of gullible people believe them.
You appear to be one of the gullible people.
I offer alternatives to the official left-wing party line at my blog.
I have been correct about climate change since I began studying the subject in the late 1990s,
by assuming the climate can not be predicted, based on how inaccurate the predictions have been.
The wild guess computer games (government climate models) have three decades of very wrong climate forecasts.
How many more decades of wrong predictions will be required before you, Steve, begin to get even slightly skeptical about the unproven greenhouse theory, the unproven claim that CO2 is the climate controller, and the unproven claim that runaway warming is ahead?
After 30 years of being told a global warming catastrophe is coming, that never comes, and then walking outside to enjoy the wonderful climate, only a fool would still believe ‘a climate crisis is coming’ with 100% confidence !
http://www.elOnionBloggle.blogspot.com
Steve,
How did the Holocene Optimism exist without that greenhouse effect you keep talking about? It was around the 260 ppm level for the few thousand years it was much warmer than now.
Given that it’s the top few meters of ocean that are heated by the sun and then transfer that heat to the air , that is a good trick to have the air “warm” the water without getting warmer itself .
Some might think it impossible .
If the air is warmer, the rate of heat transfer from the sun warmed waters will be lower.
Yea , but the claim is made that the heat has decided to go into the oceans leaving the air temperature paused .
Another commenter some time ago provided the explanation for heat going directly down into the abyssal ocean: Immaculate Convection.
LOL
Consider that phrase recycled 🙂
The CO2 molecule absorbs a photon, then transfers the energy to surrounding molecules. It can do this about a million times per second.
It can also radiate a photon, or as you state transfer its excited energy to another molecule in the air by collision.
Once again the wisdom of allowing green/red ideologues to run education is called into question. The schools have been turned quite effectively into indoctrination centers for progressive one worlders.
The schools are a big problem, not only for the parents and students, but what they teach affects all our futures, and coming generations can’t make good decisions for themselves if they are continually filled with leftwing political propaganda, which is the case today.
I saw on the news where some college is now offering a class for credit in “How to resist Trumpism”. They are going off the deep end. Mass psychosis, and they are infecting our youth with their delusions. The centers of power in our society perpetuate these delusions.
But, we may be turning a corner. I see some conservatives starting to push back and challenge the status quo that has been established by the Liberal elites, and Trump is definitely pushing back on that whole agenda, which I think, gives others the impetus to do the same.
We are not going to accept the Liberal narrative of things. The Liberal narrative is a distortion of reality, which the Liberals seem to be caught up in, but which we should avoid at all costs because it is delusion, and will lead to our destruction, and not just politically, but in every way by destroying the basic freedoms all of us cherish.
Presenting false pictures of the world, as the Liberals do, is a recipe for disaster. That false narrative is what colleges ought to be warning their student’s about.
No mention of the chaotic nature of the global climate system. A slight change in the initial conditions in the REAL world would lead to a completely different outcome – the butterfly effect. The climate is deterministic, but far too complex to model. We can’t even model a relatively simple system like 3 celestial bodies revolving around one another. The only reason the models track the temperature conditions since the industrial revolution up to about year 2000 is that they were “paramaterized” (i.e. forced) to do so using fudging factors like water vapor feedback CO2 alone can’t produce enough radiative forcing. This is the reason why they are diverging from reality since year 2000. As for the models not “matching” reality when CO2 is left out, how about including a separate variable, say natural warming for reasons we don’t understand? A similar good fit could be achieved by paramaterizing that variable instead of CO2. Bottom line, CO2 warming is a conjecture. Other conjectures are equally plausible.
Trebla
If Natural Warming is not understood, it cannot be modeled, only denied.
I used to be a major player at the NCSE during our days of taking on creationism. Today I’m appalled at their stance on AGW, as it goes against everything we fought for in the 1980s.
They replaced one religion with another?
Always painful when something like that happens. I used to be involved in a small way with the Skeptics Society, turned up to a few of their events, their transition to AGW cult followers was disappointing.
Yes, I noticed that about a couple other “skeptics” societies as well. They became infected and then infested somehow – completely surreal. I bailed out of snopes once the ridiculing and insults towards climate realists started about 7 years ago.
They ban anyone who disagrees with them, then use the fact that there is nobody left who disagrees with them as proof that they must be right.
“I used to be a major player at the NCSE during our days of taking on creationism. Today I’m appalled at their stance on AGW, as it goes against everything we fought for in the 1980s.”
It looks the essentially the same, to me . . bullying people who see things differently (and forcing them to pay for their own children’s indoctrination into your belief system) . . You helped make this Siants monster, sir, as I see my reality, and now it turns on you too . .
No bullying required. Just the facts. Try reading the federal court decisions in the relevant cases. No rational, sane person could possibly imagine that creationism is even remotely related to science.
Creationism is not science, but the antithesis of science. It is a religious sect based upon blind faith in a belief without a shred of basis in scientific fact, ie observation of reality. It is not only antiscientific but contrary to genuine Christian theology, both Catholic and Protestant, a blasphemous cult which lies against God.
CACA, OTOH, is a scientific hypothesis which has repeatedly been shown false.
If you don’t want your kids to learn science, ie to be equipped for life in the real world, then don’t send them to public school, where it is clearly unconstitutional to teach creationism in science classes.
Your kids don’t have to believe the results of the scientific method. They just have to learn how science works in order to graduate.
Sure, Chimp, the science was settled, the debate was over,, and the little kids just had to have their heads filled with images of critters morphing into different critters, lest they fall behind in the consensus Siants of imagining things . .
John,
Science is never settled, but that creationism isn’t science is not only settled, but obvious to the most casual observer. It’s the antithesis of science, so could not possibly be less scientific. It’s the attitude against which the Scientific Revolution occurred.
Please do as I asked and read the court decisions. Or just the Dover case finding ID not to be science, for the same reason as creationism was previously found not to be.
I’ve linked to it and posted relevant portions of it here previously. At least please try to educate yourself about the issues before presuming to comment upon them.
“… then don’t send them to public school, where it is clearly unconstitutional to teach creationism in science classes.”
It’s just a word game to me, Chimp. The vast array of critters all had to be created one way or another, or they wouldn’t exist. You claim the great god of bit by bit is the only one allowed to be mentioned in science classes, because your an insecure zealot, it seems to me.
John,
The only zealot in this exchange is you. I’m reporting objective, observed reality to you. You’re adhering to a collection of ancient myths rather than face that reality.
All critters were “created” in the same way. They exist because they evolved from other organisms. They weren’t all created bit by bit. Many if not most arose in a single generation. You do not understand the fact of evolution, having never studied what you presume to comment upon. The reason that the fact of evolution can be taught in public school science classes and not the religious dogma of creationism is that the latter is not science. The Constitution prohibits an establishment of religion.
It should be obvious even to you that creationism is not science. In the first place, it’s based upon blind faith, not observation and testing of hypotheses. In the second, it relies on supernatural rather than natural events. Science is specifically natural. In the third, it cannot make confirmable or falsifiable, testable predictions based upon hypotheses. Any and all predictions from creationism are always found false, but that doesn’t change believers’ opinions. It has no explanatory power, but is merely a punt.
For these and every other possible reason, it is not science but religion, hence is illegal to be taught in public school science classes. If you imagine that there is a falsifiable prediction based upon the hypothesis of “God did it”, which confirms the hypothesis, then please present it. You won’t because you can’t. Nobody can. Behe, who hatched ID, tried but admitted in court that he couldn’t, that evolution is a fact and that his definition of “science” would include astrology, which has more going for it than ID creationism.
“All critters were “created” in the same way.”
You (and others) imagine, but have never observed, sir. The very lack of any “I believe” sort of qualifier puts the lie to your claims of this being about actual science, as far as I’m concerned . . It’s philosophy masquerading as science.
John,
It has nothing to do with belief. It’s just observation.
You have been shown over and over and over again the superabundant instances of evolution being observed in the wild and “created” in the lab, to include not only new species but genera.
Nor can you or anyone else present a scientific alternative to the inescapable inference from all sources of evidence of the evolution of families, orders, classes and phyla previously.
All creationism does is attempt to make up excuses why evolution doesn’t happen. But the repeatedly observed fact is that it does. It’s a consequence of reproduction.
It is not science but a religious cult, so cannot legally be taught in public school science classes. Theologically, it’s also a false religious cult, but that’s another matter.
I know it’s pointless yet again to present you with just a few of the observed instances of speciation and evolution of new genera, but here are link to a few of them:
Instances of speciation observed:
http://evolution.berkeley.edu/evolibrary/news/100201_speciation
https://blogs.scientificamerican.com/science-sushi/evolution-watching-speciation-occur-observations/
http://www.talkorigins.org/faqs/faq-speciation.html
http://www.talkorigins.org/faqs/speciation.html
https://en.wikipedia.org/wiki/Nylon-eating_bacteria
Instances of evolution inferred:
https://www.nature.com/nature/newspdf/evolutiongems.pdf
http://www.talkorigins.org/faqs/comdesc/
Why do flightless beetles have wings, locked under a carapace which they can’t open? Only an intensely stupid designer would do that. For the umpteenth time, only a hopelessly incompetent designer would have mammalian gonads originate in the chest, as in fish, then migrate to the abdomen, in males through the wall, leaving behind hernias waiting to happen. Only a sadistic designer would deprive tarsiers, monkeys and apes, including humans, of the ability to make our own vitamin C, leaving us at risk of scurvy.
Your demonic designer-deity is thus cruel, incompetent, idiotic and deceitful.
Claiming that evolution has never been observed is a preposterous lie.
Readers,
Please note the utter lack of any skepticism whatsoever in Chimp’s supposedly scientific views on the Evolution hypothesis. Seem familiar?
All the kids are familiar with it, so they do not react negatively when seeing the CAGW pushers act that same way . . They think it’s normal for science. You know, like the Sagans and Dawkins and Nyes and so on, who pushed both in that same way . .
“Your demonic designer-deity is thus cruel, incompetent, idiotic and deceitful.
Claiming that evolution has never been observed is a preposterous lie.”
Sure, not bullying one ; )
(You’re a joke to me, Evo justice warrior ; )
John,
IOW you still can’t handle the truth.
What exactly do you imagine there is to be skeptical about? Facts are facts, ie valid observations, when not “adjusted” to fit a narrative. It is essential in science to be skeptical about hypotheses and theories, which is why tests of predictions are required. But facts which can be confirmed by repeated observations are the basis of science.
It’s hilarious that you take the clearly laughably false biblical myths on blind faith, but imagine that biology isn’t skeptical. Do you really not see how absurd it is to imagine your evidence-free, baseless blind faith, contradicted by all objective reality, is somehow equivalent to scientific skepticism?
The fact of evolution is based upon observations. Creationism is a religious belief based upon lies based upon myths. As repeatedly noted, it’s the antithesis of science.
Chimp,
“For the umpteenth time, only a hopelessly incompetent designer would have mammalian gonads originate in the chest, as in fish, then migrate to the abdomen, in males through the wall, leaving behind hernias waiting to happen. Only a sadistic designer would deprive tarsiers, monkeys and apes, including humans, of the ability to make our own vitamin C, leaving us at risk of scurvy.”
I take it you feel that it is not best to have a world wherein death is a necessary “evil” for all creatures to face, lest the “balance of nature” be destroyed . . He apparently agrees with you, but feels it important that we (His “children”) experience such a world . . for now.
John,
Why do you suppose that your hideous, repulsive, disgusting, diabolical monster of a bloodthirsty, sadistic deity wants those primates, including humans, to suffer scurvy, along with guinea pigs and Indian fruit-eating bats, whose vitamin C genes are broken in different places, but not the thousands of other mammal species?
Did tarsiers and guinea pigs also do something to tick off your demonic torture-god, earning the curse of original sin, along with those naughty, disobedient humans? Why do just these of its “children” have to suffer such abuse?
Do you have any idea how bizarre your imaginary alternative universe appears to rational people, to include most Christians?
PS ~ Fish and mammals don’t even share the same basic form of early development, so it seems kinda . . ignorant to speak of mammalian body design being bound/limited because of what happens in developing fish bodies.. From the Wiki; (Fish Development)
“The fate of the first cells, called blastomeres, is determined by its location. This contrasts with the situation in some other animals, such as mammals, in which each blastomere can develop into any part of the organism.”
The fish/mammal gonad thing is hence . . nonsensical as I see it, Chimp.
John,
Creating new species in the lab is not just to further basic science, but has practical applications across a vast range of endeavors. Whether by directed evolution, ie selection, synthetic biology, reproductive isolation, hybridization, polyploidy, genetic engineering or any other process, the results are at least improve our understanding of the natural world and at best help us fight disease, make new useful products, clean the environment and eventually to colonize new worlds.
http://www.sciencealert.com/scientists-have-created-a-living-organism-with-the-smallest-genome-yet
Several times a year these days, new species are created in the lab and observed evolving in the wild. It’s not yet a weekly occurrence, but headed that way.
OTOH, creationism has contributed nothing to human betterment. Quite the contrary.
John,
As always, wrong as wrong can be.
Fish and mammals most certainly do share the same basic form of early development. Our embryological development is so similar that we can use fish as experimental organisms to study human development.
You are trying really hard not to understand. That human gonads start out in the same place as fish gonads isn’t a “bound”. It’s a fact. Your link means nothing. I’m not talking about blastomeres, but the formation and migration of gonads, which occurs much later. So what is your point?
What is nonsensical is your failure to come to grips with reality.
You can call anything and everything ‘evolution’, you zealous silly you, and then claim if anything you’ve labeled is observable, all Evolution theory is proven, but I don’t give damn about your watered down “micro evolution” extrapolations and deep imaginings ; )
The basic Theory is so useless that it isn’t even used in making GMOs and chimeras and such . . it has no practical applications at all, as far as I can determine. No inventions, no patents, no processes, no technologies, etc . . that make use of the Evolution h7yupotthysis. If one never even heard of the idea, one would not be at any disadvantage at all scientifically speaking . . but, would be just because zealots like you would pester and abuse them, as far as I ca tell.
John,
Here’s an excerpt from a standard text on embryological development, showing just a few of the ways in which fish embryos have helped us understand human development:
https://www.ncbi.nlm.nih.gov/books/NBK10100/
Since you seem to favor Wiki over primary sources, here’s a discussion of the problems associated with the need for gonads to descend in mammals, thanks to their origination in the same ancestral region as in fish, ie the chest, as explained in the second link.
https://en.wikipedia.org/wiki/Development_of_the_gonads#Before_differentiation
http://www.naturalhistorymag.com/features/04971/fish-out-of-water?page=3
John,
No, I only call evolution evolution.
Its uses are legion. Do you seriously imagine yourself competent to comment on the growing applications of evolution in human betterment? How can you live with yourself, just making crazy assertions out of total ignorance and desperation, when confronted with reality.
In this century, old-fashioned genetic engineering has been increasingly replaced by directed evolution and synthetic biology to find new drugs and other products, ie letting evolution do the work rather than trying hit or miss by trial and error to discover useful things.
We’ve improved a lot since this assessment of the success of directed evolutionary techniques in drug development in 2012:
https://www.ncbi.nlm.nih.gov/pmc/articles/PMC3155183/
Here’s how it worked in the early days:
https://www.technologyreview.com/s/423679/high-speed-evolution-aids-drug-development/
This is what your crusade spawned, J. Richard Wakefield . . endless self-righteous special snowflake bullshit . . churned out by people indoctrinated to worship their own imaginations, and claim others are under a burden of proof, to demonstrate that whatever happens to pop into their heads is not science.
Congratulations.
John,
It’s hilarious and obvious that you’re so brain-washed you can’t even begin to glimpse how deranged your totally faith-based desperate spiel is.
I’ve given you fact after fact, but your benighted, clouded consciousness can’t process them. Facts do not compute in the blind faith-fogged mind of a true believer, who imagines that an ancient collection of myths and legends reflects physical reality.
Did you know that the “begats” in the Bible come from the Sumerian king list?
Please explain to me how creationism would help treat MRSA? Evolution offers us the only way out of our drug resistance dilemma.
Then tell me how a petroleum exploration company uses “flood geology” to find new oil and gas deposits.
Sorry, my zealous, deluded, gullible friend, but your mind has been captured by a gang of professional liars.
I don’t know why the mods permit such antiscientific spew on this site, giving ammo to the Warmunistas who, rightly it appears, claim it’s against science, harboring as it does creationists and giving them a platform to attack science.
I appreciate being able to teach the uneducated, but the student needs to want to learn.
Biotech in this century has become increasingly reliant on directed evolution and synthetic biological techniques for drug discovery. If evolution weren’t a fact, these industries and the technologies upon which they rely wouldn’t exist:
http://www.syntheticbiologics.com/product-pipeline/overview
The proof is in the pudding. Creationism isn’t even the air in the pudding. It contributes nothing of any scientific or industrial value. As noted. Quite the contrary.
If you didn’t catch the significance of tissue/organ placement in fish and mammals being very different, I have no reason to take you seriously, Chimp . . The implication of your position being that evolution favored retaining a harmful organ placement, despite the entire organ placement system having undergone wholesale transformation, is just so contra-logical to me that I can’t imagine you are actually understanding the basic hypothesis . . Sorry . .
John,
You’re simply displaying your total ignorance of embryology in grasping at such straws. Clearly you have no clue what a blastomere is. It occurs as cleavage at the beginning of embryo formation. It is not a tissue.
https://en.wikipedia.org/wiki/Blastula
The relevant fact is that, at a much later stage in embryonic development, vertebrate gonads arise in the chest of the embryo. Why would an intelligent designer make it so?
Just answer the simple question, why do gonads form in the same place in both fish and mammalian (also amphibian and reptilian) embryos, if forming there puts male mammals at risk of inguinal hernias? Why wouldn’t an intelligent designer have mammalian gonads form outside the body in males and inside the abdomen in females?
Then please tell me why this same profoundly stupid designer puts wings inside flightless beetles even if they can’t open the carapace covering the wings, as of course flying beetles can do?
And next please show how creationism helps find new drugs and how flood geology finds oil. Thanks.
And, speaking of embryos, how about the gradual loss of the yolk gene during mammalian evolution:
http://journals.plos.org/plosbiology/article?id=10.1371/journal.pbio.0060063
As you’d expect, egg-laying monotremes retain some functional yolk genes, but not all, since they rely upon lactation after hatching.
http://journals.plos.org/plosbiology/article/figure/image?size=large&id=10.1371/journal.pbio.0060063.g001
Evolution is all around you, John, if you’re only willing to take off the biblical blinkers and look at God’s Work instead of sticking your nose in the Word people concocted to try to understand Him before science.
“The relevant fact is that, at a much later stage in embryonic development, vertebrate gonads arise in the chest of the embryo. Why would an intelligent designer make it so?”
For the exact same reasons evolution would make it so . . it allows the creature to survive. You can’t just abandon the basic hypothesis every time something is a slight mystery to you, and claim to be thinking critically . . If it was such a disadvantage, why would so many highly successful creatures have that arrangement, O disbeliever in the basic concept of evolution?
John,
Can you really be this willfully obtuse?
Fish, amphibians, reptiles (including birds) and mammals all start out with their gonads in their chests because that is the shared, derived condition. Only in mammals is descent outside the abdomen required, because of our high body temperature. Bird evolution took a different approach, such that their testes are still able to function at high temperature. Non warm-blooded amphibians and reptiles don’t have a problem.
Please feel free to d@ny the fact of evolution on strictly religious grounds, but you do skeptics no favors by polluting this science site with the errant nonsense of cultic creationism.
For example;
“Why do flightless beetles have wings, locked under a carapace which they can’t open? Only an intensely stupid designer would do that.”
He would do that if he originally created basic beetles that already contained the coding for a wide array of potential specialized ones, for a wide array of environmental circumstances . . just as He (I believe) made basic canines, which we “evolved” into a wide array of specialized breeds, with no new genetic coding being needed.
Now, how exactly can we be sure it’s not all like that? With the variety resulting from selection among “on-board” coding? Your sense of faith in the opposite? ?
John,
It’s easy to know that that isn’t how the supposedly intelligent designer did it. If he/she/it were intelligent, the designer would not leave the genetic coding for wings in the flightless beetle species. Why would it? Doing so shows it a stupid designer. Developing a useless structure could only harm the organism’s odds of survival.
But then, maybe the designer also intervenes to zap the competitors of the organisms which it has designed to be less competitive.
Do you really not see how absurd your faith-based, reality-ignoring blind belief is?
“Fish, amphibians, reptiles (including birds) and mammals all start out with their gonads in their chests because that is the shared, derived condition.”
Boy, that circular reasoning just can’t be beat. We have a similar “derived condition” situation (demonstrating Evolution) . . whereas differences, demonstrate . . Evolution. I got it now . . you would make everything much better, if only you had the slightest idea how to make anything at all . .
John,
It’s not circular reasoning, but a fact, ie an observation.
We now know at the biomolecular level the genetic changes that cause the descent to occur, and can trace its evolution in terrestrial vertebrates.
Your deni@al of the facts of the Work of God makes you a blasphemer of the lowest order. I pray that your soul doesn’t burn in Hell for eternity, as a truly just and jealous God would require for your most grievous sin of d@nying his Work.
“If he/she/it were intelligent, the designer would not leave the genetic coding for wings in the flightless beetle species. Why would it?”
It survived that way . . This is the flesh world (not heaven or?) so that’s the determinant factor . . natural selection . . if you can make babies you keep going . . Your an SJW, I say, dude, and here you are bitching on behalf of some wing oppressed beetles . .
John,
As a creationist warrior, however inept, you become ever more laughable. And sad.
You can’t answer the question, why would an intelligent designer burden a flightless beetle with nonfunctional wings. You even more hilariously attempt to do this by citing selective advantage, the very core of darwinian evolution.
I’m reminded of the hyperevolution invoked by Noah’s Flood proponents to explain how so many species could have resided on the Arc.
Do you really not see how ludicrous, preposterous and blasphemous is your adherence to the demonic cult of creationism, which requires not only idiotic excuses, but lies and calumnies against God?
“Its uses are legion.”
Name one.
“In this century, old-fashioned genetic engineering has been increasingly replaced by directed evolution and synthetic biology to find new drugs and other products, ie letting evolution do the work rather than trying hit or miss by trial and error to discover useful things.”
And they count on brand spanking new genetic coding coming into existence? . . Or just minor rearrangements such as one would expect if the theory was imagined up bunkum or not? I am ONLY discussing BRAND NEW GENETIC CODING COMING INTO EXISTENCE, period, No one is waiting on that to happen, I’m pretty sure . .
First; World totally free of any genetic materials . . then, world filled with a vast array of functional genetic coding. Evolution . . not mere evolution.
John,
I’ve showed you not one, but many. Clearly you’re not paying attention because you dare not. Rational thought has been short-circuited by your cult.
I;m on my fifth evolutionary start-up, each one of which has not only made money but saved lives, because based upon reality.
Again, what has your cult ever contributed? I’m sure that we can both agree, nothing.
No matter how much you twist and turn, squirm and squeal, the undeniable fact is that evolution is real and rules the universe.
“I’ve showed you not one, but many.”
Sir, you could have claimed simple animal breeding is “using Evolution”, because we “let evolution do the work”, rather than trial and error . . It’s not, because it’s not dependent on new coding coming into existence, which Evolution certainly is.
“Again, what has your cult ever contributed?”
Science, among many other things. How could you not know that? . .
John.
Please show the science which you imagine the creationist cult has contributed.
New coding indeed comes into existence through evolution, which even the most cursory review of genomes shows. And we know whence the innovations came in many critical transitions.
You still haven’t even tried to show what creationism has contributed to science. Because you can’t. For the simple reason that it isn’t real science but false religion.
“Please show the science which you imagine the creationist cult has contributed.”
The thing/approach itself . . it didn’t just pop up out of the mud . . Christian intellectuals began/developed science (as we now know it), and dominated it until rather recently. This is not a secret, or in any sense disputed by historians. What the hell were you taught?
John,
What I was taught doesn’t matter. Sure, in the 16th and 17th centuries, scientists were believing Christians, although most were heretics. For example, Newton was a secret Unitarian. But what does that have to do with the fact that now we know the Bible to be a laughably anti-scientific tract?
What I know, regardless of teaching, is that accounts of nature in the Bible bear no relationship whatsoever to reality.
“What I was taught doesn’t matter. Sure, in the 16th and 17th centuries, scientists were believing Christians, although most were heretics.”
In your imagination, perhaps . .. From the Wiki-
~ 1901–2000 A.D. (20th century)
According to 100 Years of Nobel Prizes a review of Nobel prizes award between 1901 and 2000 reveals that (65.4%) of Nobel Prizes Laureates, have identified Christianity in its various forms as their religious preference.[79] Overall, Christians have won a total of 72.5% of all the Nobel Prizes in Chemistry,[80] 65.3% in Physics,[80] 62% in Medicine,[80] 54% in Economics.[80][80] ~
Seriously, you’ve been indoctrinated to believe utter nonsense, I think ..
Chimp:
You wrongly assert
Nobody knows the Bible is an “anti-scientific tract” because it is not. Indeed, the Bible cannot be that because science did not exist when the Bible was compiled.
There is no conflict between Biblical ‘truth’ and scientific ‘truth’. If there were then e.g. Friar Mendel would not have conducted his work to found the science of genetics in his monastery garden.
Richard
Griff will be creaming his/her jeans with stuff like this childrens’-mind-polluting propaganda from NCSE.
Along with our new[?] troll, Richard Whatsit from Bristol/Weston with an education from BathSpa (which used to be a Polytechnic for the academically low-achievement types, if I remember correctly) with a “degree” [diploma??] in anything but Science, who pontificates on Climate Science matters. Bath Spa is best known for its hot baths and hot vapours …. mehtinks Troll Richard inhaled too much of the latter for the good of his critical thinking skills (if that was *ever* an achievable target). Sure loosened his larynx, but there appears to be a disconnect between the latter and the former.
“Along with our new[?] troll, Richard Whatsit”
He’s not coming back.
“As for suggestions Mann’s hockey stick has been upheld by scientific investigation”
The fact is, it has. Many other people have published analyses using a variety of methods, and the basic story doesn’t change. To quote the abstract and intro of the Mann et al Science paper that you linked
“The global climate record of the past 1500 years shows two long intervals of anomalous temperatures before the obvious anthropogenic warming of the 20th century: the warm Medieval Climate Anomaly between roughly 950 and 1250 A.D. and the Little Ice Age between around 1400 and 1700 A.D.”
and goes on to say:
“The Medieval period is found to display warmth that matches or exceeds that of the past decade in some regions, but which falls well below recent levels globally. “
None of that is contradicted by observations of warmth in the Oroko swamp.
“is ridiculous in the face of the admission that the reason for the pause is still being investigated, that the models might have to be adjusted”
Models do not claim to be able to predict fluctuations on the timescale of the pause. They are climate models. They are not initialized to get such fluctuations in phase. I did not see anything there that said the models might have to be adjusted because of the pause.
“They are climate models.”
Nicky, just last week you said they were weather models.
Andrew
“Add to that the fact that Mann’s statistical methods produce hockey sticks almost regardless of what is fed into them”
False
“A scientist would know that the idea that later studies have produced hockey sticks by other means does NOT validate Mann’s hockey stick”
Scientists know that what count are the results. Mann got a temperature history. Others can get a temperature history. You can decide what the history was. And it’s pretty close to Mann’s.
“A scientist would know that extrapolating from one location to a claim about global temperatures is invalid.”
Indeed. That’s why they get lots of them.
“But then again, you are no scientist.”
I’m very happy to compare qualifications, Forrest. And looking forward to hearing your explanation of exactly what was wrong with Mann’s statistics.
Nick continues his campaign to defend the indefensible.
It’s amazing that the zombie hockey stick is still shuffling along. Maybe he’ll bring up that 97% consensus soon?
I think the translation for this is: “Everything is consistent with CAGW, now keep the money spigot open and learn your place, heathens.” Or something.
Mann’s math and program were shown garbage by 2003:
https://www.technologyreview.com/s/403256/global-warming-bombshell/
Quite apart from his hiding the decline, getting things upside down and misusing tree rings in the first place.
Utter, complete, total rubbish, made so intentionally in order to deceive and keep up the scare. Legally actionable fr@ud.
Not to mention unwarranted grafting of instrumental onto proxy “records”.
With the emphasis on graft, as in corruption.
Chimp,
“Mann’s math and program were shown garbage by 2003:”
No, that article is garbage. It says:
“To demonstrate this effect, McIntyre and McKitrick created some meaningless test data that had, on average, no trends. This method of generating random data is called Monte Carlo analysis, after the famous casino, and it is widely used in statistical analysis to test procedures. When McIntyre and McKitrick fed these random data into the Mann procedure, out popped a hockey stick shape!”
What M&M actually did was to do 10000 simulations and got plots of first principle components.But the undisclosed step was that they first selected the 100 that looked most like hockey sticks (by hockey-stick index). Then what was shown, in the Wegman report, was a selection from that top 100. So of course they looked like hockey sticks.
But the other nonsense is that the HS did not pop out as a result. All it showed was that the first principal component had an HS appearance. The actual result is unaffected by that; the principal components are just defining axes, but when you add it all together, the axes don’t matter any more (provided you don’t truncate too much). But M&M actually published the result if you follow Mann’s process right through. And it is very little different from their own.
And MBH did not graft instrumental onto proxy. It showed separate curves, clearly marked.
FG
Until someone has falsified Mann’s results and published those results, his paper stands. And his paper stands to this day. As do all those that have reproduced his work. It’s one of those “sciency” things. So your non-scientific rant does not signify.
And only a fool would say that Nick Stokes “are no scientist”
Re: Mann the liar (or incompetent….)
1.
(Source: https://www.technologyreview.com/s/403256/global-warming-bombshell/ )
2.
(Source: http://wattsupwiththat.com/2008/03/12/all-we-need-are-a-few-good-trees-er-sticks/ )
JM
Great. Cool. But it’s blog stuff. Rule #1 of blogs: You can say anything you like. But did McIntyre’s nitpicking cause a retraction of the article. No.
So Mann’s article stands. And even if his didn’t, all the ones afterwards are not affected by McIntyre’s comments.
Seems the hockey stick is quite real. Darn.
Steve McIntyre showed that random input (red noise) produced the same Hockey Stick in the Mann model.
The fact that other climate charlatans have also reproduced this fraudulent charade means what exactly?
Mann dodges FOIA and discovery in the lawsuit he brought against Steyn.
Steve also showed that white noise didn’t, and it is worth exploring the difference between red and white noise generators.
As for Mickey’s correspondence, it may show up from unsuspected sources, just as the first three (missing) months of Hillary’s BlackBerry-based correspondence showed up on Anthony Weiner’s laptop, prompting Comey to reveal to Congress that the first missing months had been found and they were investigating why it was there and what it contained.
RS: cite even ONE “real,” scientifically valid, “hockey stick.”
So far, you have cited exactly: 0.
@ ReallySkeptical: Why would a Mann who lied to the world be honest enough to retract anything?
Mann has no character, hence you can’t use the lack of it as evidence that he has character.
I also level the same charge at you, “Really”…. sadly, contrary to your name you’re not skeptical and certainly not the epitome of “really skeptical”.
A little off subject, the Oroko Swamp findings have led to further work to define mammalian and bird migration into the South Island of NZ.
The Little Ice Age led to the primary introduced predator and land mammal, Man, leaving the cooling south Island and migrating north.
Although land mammals did not evolve in NZ, leading to ground dwelling large birds in that evolutionary niche, the LIA led to the northerly migration of sub arctic cold adapted animals such as sea lions and penguins.
http://www.newsie.co.nz/news/23978-little-ice-age-linked-to-wildlife-arrivals-nz.html
Just on topic.
One of the problems I have with the predictive, prognostic, models is that they fall short of the mark on predictability of future climate temperature.
They continue to do so.
Its OK to argue that they can do better.
Tongue in cheek those Chinese in their solar review article said they had found a ‘fingerprint’ of solar influence on climate.
Its arguable that GCM’s are not ‘fit for purpose’.
That should be explained when instructing inquiring minds.
The red and blue team approach is best.
Best for them, best for us, best for the scientific method.
Forrest,
“Now have a go at the two of Mann’s hockey stick paper’s most glaring failures.”
Let’s hear you explain just why they are a failure. You’re keen to explain why the people who eg made Mann an AGU fellow in 2012 can’t be scientists. Let’s hear your explanation of just what is wrong with Mann’s paper. What is the failure?
Janice, it brings back to me the quip following the revelation that Mann selected one ‘yamal’ Tree from a large data base that showed what he wanted and he weighted it by ten times (IIRC). The quip was in a commentary ” Once you’ve seen one tree, you’ve seen Yamal”
Forrest,
“I’ve set out the reasons Mann’s paper will not be relied on by any scientist “
You haven’t. You have parrotted. Just consider
“Add to that the fact that Mann’s statistical methods produce hockey sticks almost regardless of what is fed into them and his hockey stick is irretrievably destroyed.”
Which statistical methods? Produce hockey sticks where? What is fed into them? Evidence and answers please.
Forrest,
” the proxy heads in the wrong direction in modern times”
Which proxy? Let’s have some specificity and evidence. Briffa wrote papers in the 1990’s saying that in some regions, tree ring widths became narrower since 1960, for unknown reasons. So how much effect does that have?
Or are you speaking of other proxies?
Forrest,

No, I don’t agree. For one thing, Briffa’s paper came after MBH. But in any case, again your plotter has no idea of being properly specific. There is no such plot in Briffa, 1999. There is plot of maximum ring density for the northern boreal forest which shows a vaguely similar pattern, although it is most unclear how that was turned into temperature – that isn’;t in Briffa. Briffa does have temperature plots, eg NH here
or SH here
Both are mixed, but nothing like your plot.
Forrest,
“Do you accept this as Mann’s work?”
They say the blue curve is MBH 1999, which seems reasonable. And the green dots are Pages2K (recent), and correspond well. That is an example of the replication of Mann’s results.
But why not show the original?
Forrest,
“When does the proxy data end and the instrumental data begin? “
The caption says. The black is the recon, so ends in 1980. The grey curve that continues is instrumental. There are no horizontal shifts.
“and published those results”
Who was it who said that they would make sure that a particular paper never got published, even if they had to change the definition of peer review?
Chimp, I understand, according Nick Stokes, that Mann got the right answer even though his 1998 methods were BS. When did he get this right answer?
Any set of data fed into Mann 1998’s algorithm was filtered for hockey stick shaped outputs and weighted according to how well it happened to match a predetermined shape. That desired shape (eliminating the Medieval Warm Period MWP) was created de novo prior to the investigation, thus setting up the analytical method to always find and heavily weight ‘hockey stick’ shapes. Well, it worked; the desired shape was produced. As the shape ‘at the end’ in the late 20th Century turned down, it was truncated and substituted with instrumental readings of a different resolution and provenance and deliberately presented in a manner that gave the casual reader the impression that the proxy series confirmed the modern instrumental temperature data. Shorn of colour, the chart is both mathematically flawed and visually, highly misleading.
Nick basically says other have used different methods to locate the same sort of shape, but which shape? Mann’s execrable 1998 work, shown to be bungled math and stats by M&M, was reworked in 2008 with a clearly visible MWP. The cite by Nick above has Mann claiming that the MWP was definitely there (a reversal of claims) but it was not as hot as recent temperatures which is a separate issue.
Interesting. Mann invalidates his fatally flawed 1998 work without admitting to the errors in it, and affirms critics’ claims that there was indeed a MWP. Nick says others have supported Mann’s work, but which work and which claim? That there was no MWP or that there was?
Note that Nick’s post says Mann was right, and his work validated, but the complaint was that Mann 1998 was junk science and Nick defends Mann 2008. Switcheroo, right?
Nick: Mann1998 was junk science, deconstructed by M&M in 2003 and it goes down in history as the most influential chart based on defective and disproven methodology. Mann 2008 was his admission that M&M were correct, and that there was indeed an MWP. Mann’s additional claim that it was regional is not supported by evidence from around the world. He never provided any evidence that it was ‘regional’ while others provided evidence that it was global. Mann 2008 brings him up to IPCC 1990. So what?
It is worth remembering that Mann’s original two 1998 claims were that there was no MWP and that the temperature chart he produced represented global temperatures. When challenged, he produced a new chart clearly showing an MWP which he claimed was not global, or if it was, that the high temps reached were not as high as the modern instrumental readings. I do no think he is a trustworthy witness.
The claim ‘it is warmer now than during the MWP’ is unproved because all his proxy results have a time resolution that hides peak temperatures, while the instrumental readings do not. When the appropriate error bars are added, modern temperatures smoothed to match the proxy smoothing, are well within the Mann 2008 Sigma 2 boundaries. The assertion about modern temperatures may or mat not be true, but his work isn’t good enough to show it.
The conclusion is that nothing out of the ordinary has yet happened with global temperatures fluctuating around historical limits. It is foolish to assert ‘human influence’ has been detected through such works
Nick Stokes
“But why not show the original?”
That is not the original. That is a B&W version which was produced afterwards.
Commenters: the major issue with creating the MBH98 or Mann 2008 plots is that of using smoothed (proxy) data and instrumental data which have not been similarly smoothed. Apart from the mistake of tacking instrumental data onto a proxy series, having a different smoothing applied to different sets of data means comparing the vertical scale values are not helpful to understanding what is going on. 50 year smoothing of 20th century temperatures looks a great deal like a horizontal line.
Crispin,
“That is not the original. That is a B&W version which was produced afterwards.”
It is Fig 3 in the original paper here.
” using smoothed (proxy) data and instrumental data which have not been similarly smoothed”
The recon shown in the figure has annual resolution, which is also what is used for instrumental. They could have shown 40 year smoothed instrumental – it would make very little difference.
“Mann 2008 was his admission that M&M were correct, and that there was indeed an MWP.”
Here is the M&M2005 admission that MBH98 was correct. It shows MBH top, and their own calc below. There is no difference in the degree of HS-ness:
“It is worth remembering that Mann’s original two 1998 claims were that there was no MWP”
It is true that in the M&M plot above, the 1400-1600 is a bit higher. But MBH98 showed no MWP? When was that blessed MWP. Here is the 2015 NIPCC history; I have added a green line showing where MBH98 starts. That’s where the sceptic NIPCC now starts the LIA. So M&M were getting more MWP right in the LIA.
Crispin,

Sorry, once more with images:
“Mann 2008 was his admission that M&M were correct, and that there was indeed an MWP.”
Here is the M&M2005 admission that MBH98 was correct. It shows MBH top, and their own calc below. There is no difference in the degree of HS-ness:
“It is worth remembering that Mann’s original two 1998 claims were that there was no MWP”
It is true that in the M&M plot above, the 1400-1600 is a bit higher. But MBH98 showed no MWP? When was that blessed MWP. Here is the 2015 NIPCC history; I have added a green line showing where MBH98 starts. That’s where the sceptic NIPCC now starts the LIA. So M&M were getting more MWP right in the LIA.
MarkW
“Who was it who said that they would make sure that a particular paper never got published, even if they had to change the definition of peer review?”
No-one.
Nick,
I’ve always been of the AD 1400 LIA onset school rather than 1250.
Thanks for the graph and source.
Nick, What year did Michael Mann’s treemometer break?
As always, little Nicky’s defense for evidence that he doesn’t want to acknowledge is to deny it exists.
Ah yes, the old “the heat has gone into the oceans – the dog ate my global warming” excuse. These people are pathetic beyond words.
Give them a grade of “D” as in defund.
1.
NCSE
Reality
http://www.drroyspencer.com/wp-content/uploads/CMIP5-90-models-global-Tsfc-vs-obs-thru-2013.png
2.
NCSE
Reality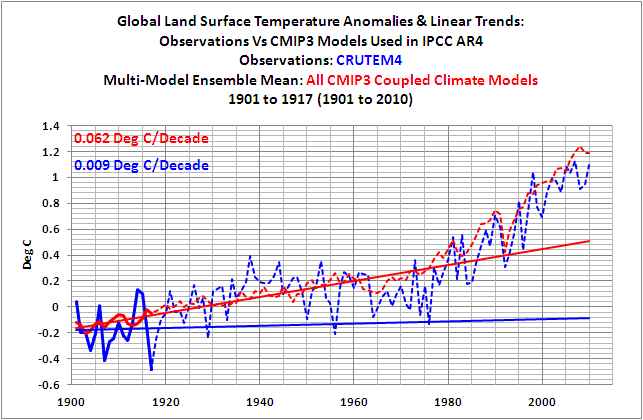
3.
NCSE
Reality
http://i55.tinypic.com/2i7qn9y.jpg
“Reality”
Cherry-picked to end 2011. This is real:
“Reality” (CRUTEM4 vs AR4 models)
Do you even look at what you are plotting? It shows the red dashed models and blue CTUTEM tracking very closely.
Apparently you want us to be impressed that a linear extrapolation from the years 1901-1917 doesn’t work very well. Why?
Do you even look at what you are plotting, Nick?
What ocean temperature instruments measure Joules? Complete BS.
Argo, the “Gold Standard” of ocean temperature data initially show cooling. This was maliciously adjusted, not once, but twice.
Truth is not on your side.
No, this is real:
The Hansen 1999 U.S. temperature chart/Proxy for Global Temperatures
And the UAH satellite chart
http://www.drroyspencer.com/wp-content/uploads/UAH_LT_1979_thru_April_2017_v6.jpg
Just tack the UAH chart onto the end of the 1999 Hansen chart and you will have the REAL global temperature profile. No Hockey Stick here. 1934 was hotter than either 1998 or 2016, so we aren’t even in a temperature uptrend at the moment, we are still in a downtrend from the 1930’s.
You want to claim the 1999 Hansen chart doesn’t represent the world? Of course, you do. Well, I have lots of charts from around the world, in both hemispheres, which show the very same profile as the 1999 Hansen chart: the 1930’s-40’s as being hotter than subsequent years. They have NO resemblance to the Hockey Stick chart.
The temperature adjustments NASA and NOAA have taken were meant to fool people into thinking it was getting hotter and hotter for years and years. It’s all a lie. As the proper temperature profile demonstrates.
If the alarmists didn’t have the Hockey Stick chart to point to, they wouldn’t have anything. And they don’t have anything. They just pretend they do.
Here’s a 1999 Hansen U.S. temp chart beside a bastardized, bogus surface temperature chart. Hansen wants us to believe the whole globe is that much different from the U.S.
As you can see, the true temperature profile is on the left, which is the 1999 Hansen U.S. chart, with the bastardized Hockey Stick chart on the right.
There are unmodified charts from other parts of the planet that closely resemble the 1999 Hansen chart profile, and look nothing at all like the Hockey Stick chart profile. The Hockey Stick was made up out of wishful thinking. The U.S. temperature chart profile is the proper profile to base our future actions on.
Nick, you have the Karlization version he shoved out there on the eve of his retirement to erase the 18yr pause. Even his own colleagues were scornful having produced studies that they thought explained pause.
RN,
“Do you even look at what you are plotting, Nick?”
I am simply plotting the version of Janice’s plot to 2017, not 2011. Using the same units.
TA,
“Just tack the UAH chart onto the end of the 1999 Hansen chart and you will have the REAL global temperature profile.”
Wow! That’s reality? A hybrid of US temp and lower troposphere?
“Wow! That’s reality? A hybrid of US temp and lower troposphere?”
You want us to believe that a hybrid of low resolution questionable proxy data and high resolution questionable instrumental data (AKA the hokey stick) is reality, so…..
4.
NCSE
Reality
A Comparison of Local and Aggregated Climate Model Outputs with Observed Data — Anagnostopoulos, G.G., Koutsoyiannis, D., Christofides, A., Efstratiadis, A., and Mamassis, N. … Hydrological Sciences Journal, 55:7, 1094 – 1110.
Abstract — We compare the output of various climate models to temperature and precipitation observations at 55 points around the globe. We also spatially aggregate model output and observations over the contiguous USA using data from 70 stations, and we perform comparison at several temporal scales, including a climatic (30-year) scale. Besides confirming the findings of a previous assessment study that model projections at point scale are poor, results show that the spatially integrated projections are also poor. …
INTRODUCTION — According to the Intergovernmental Panel on Climate Change (IPCC), global circulation models (GCM) are able to “reproduce features of the past climates and climate changes” (Randall, et al. 2007, p. 601). Here we test whether this is indeed the case. …
CONCLUSIONS AND DISCUSSION — … [W]e found that local projections do not correlate well with observed measurements. Furthermore, we found that the correlation at a large spatial scale, i.e. the contiguous USA, is worse than at the local scale. … (see also Koutsoyiannis et al., 2009a). …”
(Source: https://wattsupwiththat.com/2010/12/05/new-peer-reviewed-paper-shows-just-how-bad-the-climate-models-are/ )
(Source: Climate Models Fail, e book by Bob Tisdale, p. 14)
Moreover (re: the JUNK climate models)….
Believing in Six Impossible Things Before Breakfast and Climate Models
— Christopher Essex
(youtube)
rgbatduke: “I watched a variation of this talk several years ago, and it was brilliant and, AFAICT (and I can tell a lot!) utterly correct and fair. A Kolmogorov scale cell for atmospheric air is order of cubic meters (one cubic millimeter). The scale of cells used in climate models is around cubic meters (100x100x1 kilometers). There are 24 orders of magnitude difference. The timescale used in the climate models is determined by the size of the cells, cheating. seconds (five minutes) is the time required for sound to cross a cell, …[Thus,] climate models use stepsizes of roughly 5 minutes, the time needed for pressure variations to propagate across a cell so that they can pretend that a cell has a homogeneous pressure and temperature. The timescale required for a Kolmogorov scale cell is microseconds. The ratio between them is another factor of , making climate models a stunning 32 orders of magnitude short of where they would need to be in order to reliably integrate the spatiotemporal dynamics; and even if we could integrate at this granularity the solution would still be chaotic and, thus, infinitely sensitive to initial conditions.
As it is, the assumptions built into the cell dynamics are merely absurd — cells are much larger than well-known energy dissipating structures such as thunderstorms and, thus, are essentially ‘blind’ to thunderstorm dynamics, cloud dynamics, nucleation, and growth of the defects that eventually become large scale weather patterns, and more.
Then, there is the second coupled Navier-Stokes system — the ocean — with its enormously complicated dynamics, chemistry, and boundary. And I — or he — could go on.
To attempt to solve the unsolvable, climate modellers have to replace all of this dynamics at less than their cell scale with smoothed approximations. Thunderstorms are always 1 cell in size (they cannot be any smaller) so that where a real weather pattern might have a front with scattered thunderstorms along a 300 x 100 kilometer band, the best a climate model could do would be to have thunderstorms in 1 out of three cells or some intermediate ‘rainy’ state assigned to the cells that is supposed to correspond to the average ‘thunderstorminess’ and correctly add up to the right vertical heat and moisture transfer and so on. Similarly scattered clouds on a scale from meters to kilometers become some sort of crude average modulation of cell albedo and radiative transfer. This is further modulated with ad hoc corrections for GHGs, aerosols, soot, and so on, all on a granularity of 100 km square patches where a single property has to be assigned to the entire cell and then dynamically varied, timestep to timestep, for the entire cell.
All of this is perfectly obvious when one compares the actual climate trajectories produced by climate models. From tiny perturbations of initial conditions, they generate whole families of future climates, some warming, some actually cooling. The variance is enormous, and utterly non-physical. The autocorrelation times within the models themselves aren’t close to the actual autocorrelation times of the climate (how could they be? They have the wrong relaxation dynamics on nearly all time and length scales!) The fluctuations in the [simulated] climate are several times larger than the actual fluctuations in the real climate. They get the temperature of the troposphere egregiously wrong. They fail to predict floods or droughts anywhere near accurately. They cannot predict large-scale, self-organized, phenomena like ENSO that dominate discrete Hurst-Kolmogorov steps in the actual climate state and, thus, are just plain wrong almost everywhere, almost all of the time, …
Two different climate models produce completely different results even if run from the same initial state. Our knowledge of initial state is nonexistent (because the real climate is highly non-Markovian, especially when coarse-grained). They cannot even pretend to capture the actual climate state over the decades to centuries needed to properly initialize the model, where heat swallowed by the ocean a century ago surfaces in the thermohaline circulation to affect climate in significant ways today.
And finally, nobody even tries to assess the climate models, reject the ones that perform the worst, and keep the ones that actually produce results that resemble the client, so we aren’t even optimizing on our limited set of climate model attempts to try to evolve one that sort of works.
Then, comes the greatest sin of all. Taking all of the non-independent climate models produced by the various agencies and research groups (with places like NASA ‘contributing’ roughly 1/5th of the final weight with 7 closely related variations of the same damn model), with all of their many and varied warts, without the slightest attempt to accept or reject a single model, and flat average them into a multi-model ‘ensemble’ mean that is supposed to magically be predictive because all of the flaws in all of the models will cancel one another out! …”
(https://wattsupwiththat.com/2015/02/20/believing-in-six-impossible-things-before-breakfast-and-climate-models/#comment-1864261 )
I just watched Christopher’s video. While I was already familiar with his excellent and highly relevant points, his presentation is awesome and I thoroughly enjoyed it. Treat yourself 🙂
The ending is delightful.
For anyone unfamiliar with “reproduce the past climate” versus “hindcasting:”
Hindcasting
When you ask the model to tell you, based on the assumptions it makes about CO2 and the like, ie., ask the model to try to GUESS (or project) “What did climate do in the past?” Climate models cannot do this with any reasonable accuracy or “skill.”
Reproducing
When you tell how, i.e., TUNE, the model to match the past, the model can mimic the past, i.e., “reproduce” past climate.
Conclusion:
The models cannot tell you ANYthing about the future.
Nothing.
This means: There is something MAJORLY WRONG with the models’ assumptions about CO2 (and other stuff). (iow: “unskilled”)
Thanks Janice for pointing out the difference between hindcasting and reproducing. I have learned to be highly wary of any small terminology discrepancies promoted by the political movements behind the warming hoax. On all other topics as well. For example, the replacement of two “sexes” by (initially two) “genders”. But one’s “sex” is defined to be biological dna makeup, “gender” is defined to be a style of social upbringing. Thus, they can write all kinds of “research results” about men and women (using their back-room sociological definitions of these words), confident that normal people will assume that their research applies to biological categories.
And haven’t we seen this in the GW field: global warming, climate change, climate change denier, climate science denier, science denier, … what next?
Ms. Moore:
Your post is a concise summary of climate “models”, except for one important point:
GCMs are not real models.
A model is a reproduction of a well understood process.
The global climate “models” are not real models because the specific causes of climate change are unknown.
The GCMs are actually ‘computer games’ designed to impress the gullible public by converting personal opinions (about the unproven greenhouse theory, and assuming CO2 is the climate controller) into a very complex story — with lots of math — hard to understand — a science-lite presentation.
Too complex for anyone to question.
So complex most people will assume the “scientists” must know what they are predicting.
Really big computers — how could they be wrong?
The GCMs can’t forecast the future climate simply because climate change is still a mystery … surrounded by a lot of unproven, and often contradictory, theories.
NCSE
???!!!? Are they CRAZY??
What. Caused. The. Warming. In. The. Past?
All those drivers are now just — *poooooFFFFFF*! — gone?
phlogiston: “There seems to be a shortening wavelength of oscillation between warm an cold periods:
‘warmest postglacial period:’ 5000 BC (7000 bp)
Warm period: 5500-2200 BC (7500-4200 bp)
Glacial re-advance: 2000-500 BC (4000-2500 bp)
— 3000-yr interval warm-cold—
Sub-Atlantic period, cold: 1200-500 BC (3200-2500 bp)
— 800-yr interval cold-warm—
Roman warm period: 500 BC-400 AD (2100-1600 bp)
—650-yr interval warm-cold—
Dark age cool period: 400-800 AD (1600-1200 bp)
—450-yr interval cold-warm—
MWP: 800-1300 AD (1200-700 bp)
—500-yr interval warm-cold—
LIA: 1300-1800 AD (800-200 bp)
—350-yr interval cold-warm—
Current warm period: 1800-2000 (200-0 bp)
….
(https://wattsupwiththat.com/2012/06/24/hh-lamb-climate-present-past-future-vol-2-in-review-part-i/#comment-1017181 )
For more on the (cough) mystery of what in the world could be driving climate shifts on earth, please see:
HH Lamb — “Climate: Present, Past, & Future – Vol. 2” – In Review — Part 1
“By Paul Homewood
….
Lamb goes on to describe how temperatures recovered in the period leading up to the MWP. There was a gradual fluctuating recovery of warmth in Europe over the 1000 years after 600 BC, particularly after 100 BC, leading to a period of warmth and apparently high sea level around 400 AD. [We would recognise this as the Roman Warming Period]. The Roman agricultural writer, Saserna, wrote that in the last century BC, cultivation of the olive and vine were spreading further north in Italy, where in the previous century, winters had been too cold for transplants to survive (WARNER ALLEN 1961). After some reversion to colder and wetter climates in the next 300-400 years, sharply renewed warming from about 800 AD led to an important warm epoch.
Medieval Warming Period — Lamb had no doubt that the MWP was real and global. Evidence already cited at various places in this volume suggests that, for a few centuries in the Middle Ages, the climate in most parts of the world regained something approaching the warmth of the warmest postglacial times. He cites many examples in Europe and North America which indicate warmer temperatures than now.
The northern limit of vineyards with a long history of cultivation lay some 300-500 km north of the limit of commercial vineyards in the 20thC. In many parts of England, there are traces of medieval tillage far above anything attempted in the present century, even in wartime: up to 350 m above sea level on Dartmoor and 320 m in Northumberland.
The tree line and upper limits of various crops on the hills of Central Europe were higher than today.
Mining operations at high levels in the Alps which had long been abandoned were reopened, and water supply ducts were built to take water from points which were subsequently overrun by glaciers and are in some cases still under ice.
In Central Norway, the area of farming spread 100-200m up valleys and hillsides from 800 – 1000 AD, only to retreat just as decisively after 1300 AD.
The Viking colonies in W and SW Greenland were able to bury their dead sheep in soil that has since been permanently frozen.
It was also a warm period generally from N Mexico to N Canada, where forest remnants between 25 and 100 km north of the present limit have been found, radio carbon dated between 880 and 1140 AD. [Recent studies, that have found evidence that Alaskan glaciers were smaller in the MWP than now, tie in with this North American conclusion.]
But as Lamb makes clear, the warming was not limited to the Northern Hemisphere. Holloway (1954) has reported evidence from the forest composition of a warmer climate in South Island, New Zealand, between about 700 AD and 1400 AD, than in the centuries before and after. On the coast of East Antarctica, at Cape Hallett, a great modern penguin rookery seems, from radiocarbon dating tests, to have been first colonised between about 400 and 700 AD, presumably during a phase of improving climate, and to have been occupied ever since.
Little Ice Age — Lamb has this to say about the extent of the LIA. …
(Source: https://wattsupwiththat.com/2012/06/24/hh-lamb-climate-present-past-future-vol-2-in-review-part-i/ )
Disgusting.
Far worse than incompetent — this is a deliberate attempt to lie to schoolchildren.
I don’t believe a second the authors were purposefully giving false information. CAGW meme is strong enough to have proponents that fully believe in it.
group of scientists, who often put their lives on the line to collect the data
OMFG they have GOT to be kidding.
Have you read Eric Hoffer’s ‘The True Believer’ where he describes the TBs and how they see themselves in their heroic struggles for their causes? These people would be just pathetic sideshows if they didn’t have access to gobs of taxpayer funds and designs on how the rest of us must live, think and speak.
davidmhoffer: I see an Indiana Jone’s type guy in the jungle with a rucksack full of sling psychrometers, rain gauges, thermometers, snake bite kit, an elephant gun, tree boring drill,… watching out for panthers and the ever present jungle shrieks “oo oo oo oo ee ee ee ee ah ah ah, etc”
News reporter make a huge fanfare of their putting their lives on the line to bring you the REAL news and make it very clear how important they are to the world and how they should not be doubted. Do you suppose this is the same thing?
In contrast, a scientific model is a conceptual representation, often developed with the help of com- puters, that uses known scientific laws, logic, and mathematics in an attempt to describe how some aspect of nature works.
Well, if they’re often using com-puters why would anyone doubt them?
/snark
Who are you snarking? That is just WUWT pasting from pdf and not fixing the hyphens at line break.
Forrest Gardener:
Y
May 3, 2017 at 8:12 pm
Not your best work Nick. Have a go at the question asked.
My arm did its own thing again. Sorry. This is an attempt to post what I intended.
Forrest Gardener:
You say to Nick Stokes
Whether it is his “best work” is a value judgement. However, it is certainly typical of his behaviour; e.g. see his wriggling above to avoid the hockeystick divergence problem.
Richard
Forrest,
“For your convenience is was”
The premise was
“Well, if they’re often using com-puters”
and without that the question makes no sense.
Yeah, I was kidding a bit about the somewhat amusing hyphenation/formatting that can appear every now and then. But more than that, the proponents of this hypothesis always seem willing to pay homage to the idols they’ve created, in this case the belief in their all-seeing, all-knowing computers.
> Today’s climate models are fantastically detailed, and they reproduce the actual climate of the past century with remarkable accuracy.
Now say that under oath.
Good one, Rob Dawg. 🙂
Note, though, the slimy little loophole they included in that crafty statement:
“reproduce.”
That is another word for tuning, or making the models mimic the past.
They hope an ignorant public will conflate “reproduce” with “hindcast” and be fooled.
Sickening.
Tuning a model to fit past observations is actually the best way to refine a model… Unfortunately, the method bybwhich they are “tuning” the climate models is exactly wrong.
Rather than dialing back the climate’s sensitivity to CO2, the keep dialing up aerosol forcing.
They are tuning the Global models to Reconstructed Global temperatures? Oh Dear.
How can they tune the models to the past when they keep changing the temperatures in the past? Its like North Korean News stations telling everyone that their team won the world cup or something.
When the predictive run starts after 2001, the models actually do a fairly good job of reproducing the actual climate of the past century.
However, the models fail with great precision within a few years of predictive runs.
The relatively accurate hindcasts are due to exagerrated aerosol flux adjustments to offset the climate’s relative insensitivity to CO2.
By “past century, ” I am referring to the 20th century.
David, Don’t think they haven’t looked at lower climate sensitivity, about which there can be no serious doubt, but when they do, the big problem disappears. No they are desperate to cling to high sensitivity at all costs. The big anxiety to get action going on CO2 has nothing to do with alarm. They want all this money spent so that they can say, good thing we took action in time because they know that left alone, the climate couldn’t warm 1.5C this century despite business as usual. I feel high confidence that 1C is a reasonable estimate from historical levels (and so do they).
My understanding is thar the climate sensitivity to CO2 is not directly programmed into the models.
However, you would think that 30 years of failed models, overwhelming evidence that the transient climate response is around 1 C and the equilibrium climate sensitivity is around 1.5 C.
Unfortunately, the so-called consensus keeps lying about the models being confirmed and brain-dead parrots (SkepSci, Desmog, NCCE, NRDC, Leonardo DiCaprio, Bill Nye, Democrat & some Republican politicians, etc) repeat the lies over and over again.
I caught a few seconds of something on TV news tonight (I forget which channel it was, maybe PBS) where they had a weather or maybe climate modeller onscreen talking about how awesome the technology is, blah blah, etc.
During the blah-blah, they were showing cool-looking, realistic animations which were obviously created with software like 3D Studio (or similar, used for movie special effects) as well as some engineering fluid dynamics real-time modelling animations.
Of course the visuals would make more of an impact on a layperson viewer than the blah-blah. I bet dollars-to-donuts they were trying to plant in those viewers’ minds how sophisticated and super-detailed weather/climate models are while actually showing no-substance Hollywood-style special effects. Great analogy for the whole Klimate Kult Katastrophists’ statistical prestidigitation.
Michael Mann was blown away by color graphs. Considering what a “genius” he is, I can only imagine what the computers and simulations do for the general public. Think what money a fortune teller could make if they incorporated a computer into their predictions.
“Today’s climate models are fantastically detailed, and they reproduce the actual climate of the past century with remarkable accuracy.”
More accurately and succinctly: Today’s climate models are fantasy.
Literally hundreds of papers were published since 2000 demonstrating the solar influence on the weather and climate, yet this outfit and so many others at warmist-ideologically leadership dominated journals and institutions of higher learning, the media, the government, and so on act like there aren’t any other scientific reasons for climate change, nor any other scientists out there that could challenge them.
My guess is they obfuscated the truth by relying on just sunspot numbers alone assuming there should be a directly immediate correspondence to temperature.
The earth is supersensitive to solar radiation variations. They know nothing of this, ie they’re ignorant.
When TSI goes up, temps go up, and when TSI falls, temps fall, and it doesn’t matter from what ‘level’ of TSI or temperature either.
The tropical ocean accumulates more heat in short to long time periods under rising and higher TSI conditions, and can lose that heat just as fast when TSI falls or is low.
These principles resulted from my own forthcoming research, where I independently & inadvertently confirm with unique methods most of Dr. David Stockwell’s solar accumulation and supersensitivity theory; going beyond with modelling & forecasting, the solar cause of the warming of the 20th century.
In order for warmists to be so self-deluded they have to believe the indefensible, they have to believe more heat from the sun during the modern maximum didn’t register in the temperature series. Fools!
Lower solar activity since 2004 caused ‘the pause’, interrupted only by the SC24 TSI-spike driven ENSO.
The cause of the pause was the cause before the pause! Solar activity.
The bottom line for the NCSE is they don’t know what they’re talking about and the kids will soon know it.
There is a TED talk (or TEDX) by Gavin Schmitt where he argued that the climate models were “artful”. OK, but art is not science, however, art can be used to help explain what science does or explain results. Propaganda on the other hand is designed to get people to accept a certain viewpoint, or “facts”.
This NSCE primer looks like pure propaganda.
Artful, indeed!
art·ful ˈärtfəl/ adjective
1. [this is the primary definition!]
(of a person or action) clever or skillful, typically in a crafty or cunning way.
“her artful wiles”
synonyms: sly, crafty, cunning, wily, scheming, devious, Machiavellian, sneaky, tricky, conniving, designing, calculating; canny, shrewd; deceitful, duplicitous, disingenuous, underhanded; informal: foxy, shifty;
archaic: subtle
“artful politicians”
antonyms: ingenuous
In the real world, not even Michael Mann wants to defend his hockey stick graph. If he did, then he would take steps to speed up the process of meeting Mark Steyn in court. But he knows that the legal intimidation ploy has backfired.
Mann has a cadre of lay supporters who are not yet well informed. The grunts have been left holding the gate to the fort, not realizing that the general has already scuttled out of the back door.
” … equations that describe how heat flows from one cube to neighboring cubes”
Yep , it’s all in the differential between voxels .
So show us that equation — one we can experimentally quantitatively verify — one based on classical physics .
I have yet to see even a 1 dimensional differential which causes thermal energy to be “trapped” on the side away from the source by some spectral , ie : greenhouse , phenomenon .
What complete and utter rubbish, an extremely low quality emotional appeal: “Keep in mind that every curve you see in figure 2.10 represents many years of fieldwork and careful research by a substantial group of scientists, who often put their lives on the line to collect the data in remote and dangerous locations.”
The scientists are fat?
Just their heads.
http://i47.tinypic.com/2i7mfex.jpg
Tiny Pics didn’t post the link correctly, Try again, Mann with HS around his head:
http://i47.tinypic.com/2i7mfex.jpg
Has Tiny Pics gotten political? The link for the picture I tried to post does not show up. They once banned a Gore as devil photoshop I had. I will re-upload the picture and get a different link to see if it will post.
Third try;
http://i67.tinypic.com/2rohk00.jpg
“The addi- tional heat and energy trapped in the atmosphere by the rising carbon diox- ide concentration…”
Stopped reading right there…
Science education? As Bender would say “My shiny metal adz”!
“Q: Still, shouldn’t there be some explanation for the slowing? [the pause]”
“Yes, there should be, and while scientists remain utterly clueless, we, in our omniscience and wisdom, will simply make something up. Look on our works, ye Mighty, and despair!”
If only we could sweep the Warmistas under the mat in the same way they sweep the inconvenient scientific facts under the mat.
Indoctrination, not education. *SMH*
North wind 25 mph
Temp 50 F
May 4 North East Texas
Looks and feels like an October “Blue Nirther”
Wet, cold, and bad for wheat crop.
Wheat booted out late due to cold
Now the wheat seed should be growing but the cold has slowed development.
So the wheat will be late getting ripe allowing weeds and things like Johnson grass and other trash to grow and-cause harvest problems.
It’s right in front of them but the cult mentality has them blind to the lies they tell themselves.
Mother Nature is going to kick them in the teeth!
“Let us hope the NCSE have the integrity to apologise for and correct their unbalanced assessment, once they realise what they have done.”
________________________________________
The NCSE will be or will NOT be.
As long as there’s a NCSE it can defend realising their deeds.
The fact is that a radiant greenhouse effect has not been observed on any planet in the solar system with a thick atmosphere, including the Earth.. The radiant greenhouse effect is hence fiction as is the AGW conjecture which depends upon the existance of such a radaint greenhouse effect. If CO2 really affected climate then the increase in CO2 over the past 30 years should have caused at least a neasureable increase in the dry lapse rate in the troposphere but that has not happened.
The climate simulations they are talking about have harded coded in the an increase in CO2 causes warming which begs the question which renders the climate simulations useless. The simulations are programed to show warming so they show warming. They are a form of fantasy. There is also concern that the numerical techniques are really unstable so that at least part of the results are more a matter of the inharent numerical instability then of any physical phenomenon. Others have provided models that show that the climate change we have been experiencing is caused by the sun and the oceans. There is plenty of science to support the idea that the climate sensitivity of CO2 is really zero.
What are Eric’s qualifications that justify him taking up so much space here ?
If he has so much evidence he should submit it to some real scientists for review.
Oh look; a drive-by climate troll. Haven’t seen one of those in a while.
Asking basic questions is not trolling, you guys need to submit credible evidence if you want scientific discussion.
It’s not a credible question.
It’s an attempt to deny that those who aren’t members of the club are qualified to comment on the activities of those in the club.
At it’s heart it’s anti-science, but then, so are most members of the club.
I don’t generally like to be this rude, but it was a dumb question. Albert Einstein was a patent clerk when he wrote many of his early groundbreaking papers. Should they have been thrown in the bin just because he wasn’t a professor at a university? Many great scientific discoveries over the centuries were made by laypeople. Critique the content or go away.
MarkW
As you young Einsteins have not submitted any credible evidence, then I am justified in asking why and floating the wacky notion that it may have something to do with your lack of scientific understanding.
The burden of proof is with you.
WTF,
The only burden that matters in science is not “proof”, but confirmation or falsification.
Science is not “proven” by submission to “real scientists” but to nature itself.
In fact, more than 90% of the added heat and energy is expected to warm the water in the oceans
I have still seen no explanation as to how the atmosphere can heat the deep ocean
Paul, I can certainly see how such a claim COULD be right, although like yourself I’ve never seen, or been pointed to, a proper exposition of it. Doubtless somewhere models have been produced which claim to show the effect, and perhaps to try to quantify it (difficult!)
The skin of the ocean will become warmed (or tend to give up less of its heat) by contact with the air or by direct insolation, but ocean overturning, or even simple wave and current action, will continously be reclaiming that warmed/less cooled water and replacing it with cooler water to be warmed in its turn. The observation than warm water rises because less dense is to my mind an insufficient refutation. Over a long period the almost limitless heat capacity of the ocean does seem to have the potential to buffer changes to atmospheric temperatures, and over even longer periods, to potentiate those changes in an opposite direction.
Some kind of explanation in this direction, properly validated, may go a little way to salvaging the AGW story.
That aside, I agree with many here that the propaganda piece that prompted this thread is quite, quite appalling.
Yes, you can tell they know they’re lying from the tone of desperation throughout.
“Tractor production is higher than ever!”
“Oceania has always been at war with Eastasia!”
Again, I don’t see any reason to believe the authors were thinking their stuff is somehow incorrect. In 1984, the propagandists know they are developing lies, but I think these people truly believe the whole 97% of the CAGW belief system.
It seems that AGW propoganda is pervasive at all levels. Prince Charles`s little book on `Climate Change` is aimed at young schoolchildren. Among the reviewers he thanks are the usual suspects including a `scientist`, who certainly knows that ice cores show that carbon dioxide lags behind temperature. What`s he after, a knighthood?
” In fact, more than 90% of the added heat and energy is expected to warm the water in the oceans ”
As I keep pointing out [this] is impossible. IR [from] CO2 cant penetrate more than ~0.006 cm of [the] surface and is trapped in the cool layer.
Their “thinking” on this is convoluted nonsense. First, they have this mysterious “added heat and energy”. Added to what? Where? They don’t say, because they can’t, having made it up out of whole cloth. Then, this mysterious “heat and energy” somehow, magically is “transferred” via teletransportation I guess, into the deep oceans where it can’t be measured (how convenient), where it will, at some point, via magic, come out and say boo! This is the sad state of what they call “science” today.
See mothcatcher above. Besides, I believe the IR is a fallacy here. You need welling water to take heat down.
Napolean is always right
Not always as poor Marengo discovered to his cost.
http://www.dailymail.co.uk/news/article-4462252/Hoof-belonging-Napoleon-s-stallion-Marengo-found.html
Waterloo 20 June 1815
Jardin Ainé; Equerry to the Emperor Napoleon
At last after he had left the town, he found in a little meadow on the right a small bivouac fire made by some soldiers. He stopped by it to warm himself and said to General Corbineau,
“Et bien Monsieur, we have done a fine thing.”
General Corbineau saluted him and replied,
“Sire, it is the utter ruin of France.”
I meant the pig in Animal Farm.
OT.
I would like to personally thank China and friends for IGNORING the AGW scam
WELL DONE CHINA. 🙂
https://notalotofpeopleknowthat.wordpress.com/2017/05/04/chinese-firms-to-invest-15bn-in-pakistani-coal-fired-power/
https://notalotofpeopleknowthat.wordpress.com/2017/05/03/chinas-production-of-electricity-from-coal-surges-to-record-levels/
..Wheres Griff hiding ???
In the deep ocean?
His Mom’s basement.
He’s at the SKS to update his talking points?
‘climate models. . . Reproduce the ACTUAL climate of the past century with remarkable accuracy’
Since when is ‘climate’ described completely and accurately by the single metric of ‘global temperature’?
What about the other factors, some of which they mention(rainfall, cloud, sunshine hours, wind speed & direction, min and max temps rather than an average, night-time & daytime temps etc)?
And ‘climate’ is surely REGIONAL (climatic zones etc).
So how do these models perform on ALL climate metrics REGIONALLY compared to actual data?
Can they still be described as ‘remarkably accurate’?
I’m amazed at how reasonable it all sounds. This seems to be the main technique of the climate change establishment at the moment; no new findings, just spinning what they’ve got as hard as they can, so that a fail actually looks like a win. It works, because the believers believe so *hard* – a bit of verbiage calms them down, and they don’t have to think. This seems to apply even to the scientifically literate.
The bit about Mann’s hockey stick curve is a case in point. If you look really hard, you can see that they actually *admit* that it was debunked! – but then lots of clever scientists came up with other data that said the same thing, so that’s all right then. But, if his data was insufficient and his statistical methods were useless, *how did he know*? How did he do everything wrong, and still get the right answer?
I should nail my colours to the mast here. I am not a “denier”. I find it hugely unlikely that a trace gas like CO2 governs the whole planetary climate, but I’ll follow the data. That’s exactly why the present level of bullsh makes me so angry.
It is informative to review the membership list of NCSE’s advisory council.
What is going on with this site? I try to read the articles and I keep getting scrolled down to the ads every 30 seconds or so. Incredibly annoying. Is this a new WordPress ‘feature’?
Clear your history, then refresh the page
Or get AdBlock Plus
‘…Today’s climate models are fantastically detailed, and they reproduce the actual climate of the past century with remarkable accuracy. Indeed, the modern models work so well that scientists can use them to conduct “experiments” in which they ask what would happen if this or that were different than it is’
That’s just curve fitting. As John von Neumann famously said, With four parameters I can fit an elephant, and with five I can make him wiggle his trunk.’
The only experiment that is worth a tinker’s dam is how well do the models predict the future; Do they do any better than the simplistic method of predicting the coming year will be just like last year?
The answer is ‘no’.
https://wattsupwiththat.com/2012/06/14/climate-models-outperformed-by-random-walks/
“We’ve discussed two sets of observations that definitively rule out the Sun as the cause: (1) solar energy input has been falling while the temperature has been rising; and (2) the upper atmosphere has been cooling while the lower atmosphere warms, which is consistent only with greenhouse warming, not warming due to the Sun.”
I am pretty sure that if the sun blinked out, it would not take very long for the earth to cool.
kivy10: “if the sun blinked out, it would not take very long for the earth to cool”
Like during a total eclipse? I’m curious if ‘back radiation’ is measured during an eclipse. If the eclipse happens in the middle of the day, I would assume that ‘back radiation’ levels would be highest once the direct radiation of the sun has been blocked fairly quickly. The rate of cooling of the Earth’s surface should be predicted and then verified with actual measurements.
No need to wait for an eclipse, just wait for the sun to set, it happens once a day.
Regardless, compared to the total sunlit surface area, the area shaded by an eclipse is pretty small
MarkW – I expect better from you:
“No need to wait for an eclipse, just wait for the sun to set”
You find these two things to be equivalent?
The point is what happens when the sun stops shinning.
The two are equivalent, with the single exception is that sun down covers a larger area.
When needed to explain lack of warming, the thermal lag of the oceans fits the bill nicely.
However when a short term drop in solar output occurs, the fact that the earth doesn’t immediately cool is proof that CO2 is causing the earth to warm.
MarkW – “the fact that the earth doesn’t immediately cool is proof that CO2 is causing the earth to warm.”
Are you being serious? Not sure what you mean by ‘immediately cool’, or why you think that is a ‘fact’. When a cloud moves in front of the sun on a summer day you definitely feel the difference immediately. Ergo, I’m skeptical of your ‘fact’. But, why don’t you design a test to prove your point during the next eclipse. Secondly, how does ‘not cooling immediately’ equate to ‘warming’?
Please re-read, this time aim for comprehension.
That’s the problem with being sarcastic. One gets those he or she disagree with approving of his post, and people he or she agrees with criticizing the post.
Here is an exchange I had with Freeman Dyson two years ago.
E-mail 4/7/15
Dr Norman Page
Houston
Professor Dyson
Saw your Vancouver Sun interview.
I agree that CO2 is beneficial. This will be even more so in future because it is more likely than not that the earth has already entered a long term cooling trend following the recent temperature peak in the quasi-millennial solar driven periodicity .
The climate models on which the entire Catastrophic Global Warming delusion rests are built without regard to the natural 60 and more importantly 1000 year periodicities so obvious in the temperature record. The modelers approach is simply a scientific disaster and lacks even average commonsense .It is exactly like taking the temperature trend from say Feb – July and projecting it ahead linearly for 20 years or so. They back tune their models for less than 100 years when the relevant time scale is millennial. This is scientific malfeasance on a grand scale. The temperature projections of the IPCC – UK Met office models and all the impact studies which derive from them have no solid foundation in empirical science being derived from inherently useless and specifically structurally flawed models. They provide no basis for the discussion of future climate trends and represent an enormous waste of time and money. As a foundation for Governmental climate and energy policy their forecasts are already seen to be grossly in error and are therefore worse than useless. A new forecasting paradigm needs to be adopted. For forecasts of the timing and extent of the coming cooling based on the natural solar activity cycles – most importantly the millennial cycle – and using the neutron count and 10Be record as the most useful proxy for solar activity check my blog-post at http://climatesense-norpag.blogspot.com/2014/07/climate-forecasting-methods-and-cooling.html
The most important factor in climate forecasting is where earth is in regard to the quasi- millennial natural solar activity cycle which has a period in the 960 – 1020 year range. For evidence of this cycle see Figs 5-9. From Fig 9 it is obvious that the earth is just approaching ,just at or just past a peak in the millennial cycle. I suggest that more likely than not the general trends from 1000- 2000 seen in Fig 9 will likely generally repeat from 2000-3000 with the depths of the next LIA at about 2650. The best proxy for solar activity is the neutron monitor count and 10 Be data. My view ,based on the Oulu neutron count – Fig 14 is that the solar activity millennial maximum peaked in Cycle 22 in about 1991. There is a varying lag between the change in the in solar activity and the change in the different temperature metrics. There is a 12 year delay between the activity peak and the probable millennial cyclic temperature peak seen in the RSS data in 2003. http://www.woodfortrees.org/plot/rss/from:1980.1/plot/rss/from:1980.1/to:2003.6/trend/plot/rss/from:2003.6/trend
There has been a cooling temperature trend since then (Usually interpreted as a “pause”) There is likely to be a steepening of the cooling trend in 2017- 2018 corresponding to the very important Ap index break below all recent base values in 2005-6. Fig 13.
The Polar excursions of the last few winters in North America are harbingers of even more extreme winters to come more frequently in the near future.
I would be very happy to discuss this with you by E-mail or phone .It is important that you use your position and visibility to influence United States government policy and also change the perceptions of the MSM and U.S public in this matter. If my forecast cooling actually occurs the policy of CO2 emission reduction will add to the increasing stress on global food production caused by a cooling and generally more arid climate.
Best Regards
Norman Page
E-Mail 4/9/15
Dear Norman Page,
Thank you for your message and for the blog. That all makes sense.
I wish I knew how to get important people to listen to you. But there is
not much that I can do. I have zero credibility as an expert on climate.
I am just a theoretical physicist, 91 years old and obviously out of touch
with the real world. I do what I can, writing reviews and giving talks,
but important people are not listening to me. They will listen when the
glaciers start growing in Kentucky, but I will not be around then. With
all good wishes, yours ever, Freeman Dyson.
For more recent forecasts see my Energy and Environment paper at http://journals.sagepub.com/doi/full/10.1177/0958305X16686488
and an earlier accessible blog version at http://climatesense-norpag.blogspot.com/2017/02/the-coming-cooling-usefully-accurate_17.html
Here is the abstract for convenience :
“ABSTRACT
This paper argues that the methods used by the establishment climate science community are not fit for purpose and that a new forecasting paradigm should be adopted. Earth’s climate is the result of resonances and beats between various quasi-cyclic processes of varying wavelengths. It is not possible to forecast the future unless we have a good understanding of where the earth is in time in relation to the current phases of those different interacting natural quasi periodicities. Evidence is presented specifying the timing and amplitude of the natural 60+/- year and, more importantly, 1,000 year periodicities (observed emergent behaviors) that are so obvious in the temperature record. Data related to the solar climate driver is discussed and the solar cycle 22 low in the neutron count (high solar activity) in 1991 is identified as a solar activity millennial peak and correlated with the millennial peak -inversion point – in the RSS temperature trend in about 2004. The cyclic trends are projected forward and predict a probable general temperature decline in the coming decades and centuries. Estimates of the timing and amplitude of the coming cooling are made. If the real climate outcomes follow a trend which approaches the near term forecasts of this working hypothesis, the divergence between the IPCC forecasts and those projected by this paper will be so large by 2021 as to make the current, supposedly actionable, level of confidence in the IPCC forecasts untenable.”
The paper was published in E&E on line at DOI: 10.1177/0958305X16686488
Proof that afternoon warming is not caused by the sun: “solar energy input has been falling while the temperature has been rising.”
Nope, and it doesn’t apply to seasons either, or to whatever temperature effects a grand maximum of solar-magnetic activity may have, so add NCSE to my list of dozens of scientists, scientific groups, including the IPCC, who claim that a body stops warming, not when the heat applied falls below the heat it gives off, but when the heat applied passes its maximum.
The two are only the same if the body has no (or little) thermal mass so that its temperature equilibrates instantly (or rapidly) when forcings change. That is NOT the earth, which continues to warm well beyond the point when a cyclical forcing passes its peak.
We see this with solar forcing each day, over the change of seasons (where the maximum solar forcing is on the first day of summer), and if changes in solar activity have a substantial forcing effect the same pattern will occur on the time scales over which solar activity varies.
Solar activity was at least high, and by some estimates at grand maximum levels, from roughly the 1920s through the end of the century. Our peuedo-scientific climate alarmists are in lockstep in claiming that any temperature effect from this peak in solar activity would have turned negative when solar activity passed its peak, perhaps sometime around 1980. Pure lunatic anti-science.
The best argument against solar activity being a substantial driver of climate is the one Willis has made many times: the absence of any clear 11year or 22yr temperature signal corresponding to the 11yr solar cycle (22yr if polarity is included), but just because we can’t discern such a signal doesn’t mean it isn’t there.
Temperature fluctuations on this time scale are dominated by ocean oscillations, the mechanisms and timings of which remain mysterious. To discern a solar-cycle temperature signal we would have to first be able to identify the effect that ocean oscillations are having on temperature, subtract it out, and see if there is a solar signal in what remains. We would have to be able to control for a variable (ocean oscillations) that we can’t control for. An 11yr temperature signal may well be there. We just don’t know how to separate it out yet.
I quote: “Today’s climate models are fantastically detailed, and they reproduce the actual climate of the past century with remarkable accuracy. ”
Abject nonsense. You have had 29 years to do your ” trial and error” modeling and so far you have failed to produce pone model that accurately describes future climate. Thar i enough expensive super computer time wasted, Just close the operation and save us from any further imaginary climate disasters.
“Today’s climate models are fantastically detailed, and they reproduce the actual climate of the past century with remarkable accuracy.”
Which “actual climate” are they referring to, I wonder? Would that be the actual climate before or after the adjusters got their hands on the data and used it to promote their CAGW narrative?
What does reproducing bastardized, bogus surface temperature data say about your climate model? It says to me that your model reproduces bogus data so your model must also be bogus.
Alarm was well underway by the time MBH98 came out. Up until then, as I understand it, received wisdom(paradigm) was that the MWP and LIA existed, with many proxy studies showing this.
And then MBH98 was accepted without question, and suddenly several other studies came out claiming to support it.
So what was wrong with all those previous studies? Why had nobody noticed the hockey stick before? What changed to make it so ‘obvious’ after MBH98?
Sorry, Nick, Simon et al, it all sounds rather suspicious to me.
Oh, and PS: Why were Soon and Baliunas slaughtered so when their study confirmed the pre-MBH findings?
Summat not quite right here. . .
These ‘studies’ are sooo obviously explicitly commissioned to reinforce any given message, narrative or objective while today’s Guardian is running two more articles, each hailing ‘studies’ that support their climate hysteria. I trust them about as far as I can throw Greenland.
ARE YOU FREAKING KIDDING ME? !!!!!
YES
I refer to Nick Stokes’ comment of May 3 2017 at 11.13 pm.
I have seen this plot countless times over the last ten or more years, and no doubt almost everyone who reads this blog (and others that are connected with climate affairs) has too.
What I have NEVER seen, and what I’ve asked about often enough, is not the graphic but // the actual numbers \\ that were used to to derive it.
I have all Mann’s data from the 1998 paper, Who else that reads this blog has those – 112 columns andd I seem to remember 583 rows representing what Mann chose to present as climate (temperature!) related data from many sources. Some (13) were actual temperatures or closely related to actual temperatures, though not necessarily correctly labelled. Others were rainfall or precipitation, others ice core data, and yet others “principal components”.
Mann operated on this bizarre assortment of scientific data in a way that few understood and which he proved somewhat hesitant to publicise, but which was eventually unravelled by McIntyre and Mcitrick.
What is evident, if you even cursorily examine the data columns, is that their scales differ by orders of magnitude. Any trivial but reasonable examination of the data is defeated unless you decide to re-scale them to sensible sizes – so that averages over columns have a real meaning and are not dominated by those columns having large absolute values.
This is a very simple operation. “Standardise” every column to means zero, variance one. Only now can one legitimately combine the columns and hope to be able to spot what has happened over time.
Without the numerical data, that I have repeatedly requested access to, that forms the basis of Nick Stokes’ plot, it is impossible to comment sensibly on the apparent hockey stick shape.
SO, PLEASE, SOMEONE, can you supply the actual data, NOT the plot. I can do all my own plotting perfectly well! Then I know that it it reliable.
What I wish to do is to see whether a hockey stick arises naturally from the /original, published/ data.
I cannot produce one from the data that I have available.
Robin
Recognize this for what it is:
Propaganda: noun; Information, especially of a biased or misleading nature, used to promote a political cause or point of view.
How much wind would a screen block if the openings were 1″ squares and the wires were 0.0004″ thick? Or is that not a valid model for comparing the effects of atmospheric CO2?
Not valid. A more appropriate analogy would be how much SUN would a mesh as you describe block if it was three dimensional and filled the whole troposphere? IR is just going the other direction.
The answer is “a lot.” The effect of more Co2 is to lower the average altitude at which IR gets caught, keeping the warmth closer to the surface, which warms the surface more.
…WRONG…The CAGW “theory” claims the heating takes place in the Troposphere (the hot spot, which doesn’t exist)
I had some 50 swg dcc (double cotton covered) wire once and that was 1 thou’ i.e. 0.001″, thinner than a human hair. A wire 0.0004″ diameter would be even trickier to handle but you would get many kilometers of it on a 8 oz spool.
WOW, you guys are still at it ?? Awesome !!
+ 100 E
“Today’s climate models are fantastically detailed, and they reproduce the actual climate of the past century with remarkable accuracy. ”
Astrologers also tell your past with remarkable accuracy, (after they have found out about it by various means).
Where they fail is to tell your future.
Climate scientist saving a polarbear
http://i1.ytimg.com/vi/4E91yMMLljI/hqdefault.jpg
Well, the NOAA, NASA and Hadley Center druids do advocate child sacrifice to the climate gods. What better way than helping to feed allegedly endangered polar bears?
This was during “hug a polar bear week” I believe. That poor polar bear was on the brink of extinction, but saved in the nick of time by that kind climate scientist. After she jumped in, it was back to Darwin’s survival of the fittest. The polar bear appears to be fitter than the climate scientist.
Indeed, absent high-powered rifles, polies are fitter than humans.
In the state of nature Arctic food chain, polies outrank Eskimos, a fact acknowledged by pre-firearms Eskimos.
The sacrifice has more fat than even a well fed seal.
“Here is my most recent post if you’d care to respond:”
No, if it comes down to haggling over whether ordinary smoothing (as clearly stated) is somehow a “horizontal shift”, I’m out of it.
We are at the top of an interstadial period. CO2 has essentially caught up but is just riding on the back of a larger oceanic/atmospheric teleconnected multi-millennially long oscillation. We are supposed to be warm with micro-trends up and down while at the top. These trends can be safely ignored as a threat. It’s the larger down slope that we need to learn about and prepare for. This is so blatantly obvious yet ignored by the current crop of climate research starlets and their fan clubs. Idiots.
Looking at the temperature charts, it appears the top of the interstadial was about 3 to 5 thousand years ago.
Depends on which proxy you are using. Which one is your favorite?
Save the children, close this shop down. Only way to stop their BS.
This club has the wrong name.
They are brainwashing young people. We don’t want that do we.
No need to explain anything to them or spend any time or effort to make a point.
These people are completely entrenched in their mission.
Once a commie always a commie.
Shut the place down.