Guest post by David Middleton
Introduction
When debating the merits of the CAGW (catastrophic anthropogenic global warming) hypothesis, I often encounter this sort of straw man fallacy:
All that stuff is a distraction. Disprove the science of the greenhouse effect. Win a nobel prize get a million bucks. Forget the models and look at the facts. Global temperatures are year after year reaching record temperatures. Or do you want to deny that.
This is akin to arguing that one would have to disprove convection in order to falsify plate tectonics or genetics in order to falsify evolution. Plate tectonics and evolution are extremely robust scientific theories which rely on a combination of empirical and correlative evidence. Neither theory can be directly tested through controlled experimentation. However, both theories have been tested through decades of observations. Subsequent observations have largely conformed to these theories.
Note: I will not engage in debates about the validity of the scientific theories of plate tectonics or evolution.
The power of such scientific theories is demonstrated through their predictive skill: Theories are predictive of subsequent observations. This is why a robust scientific theory is even more powerful than facts (AKA observations).
CAGW is a similar type of theory hypothesis. It relies on empirical (the “good”) and correlative evidence (the “bad”).
The Good
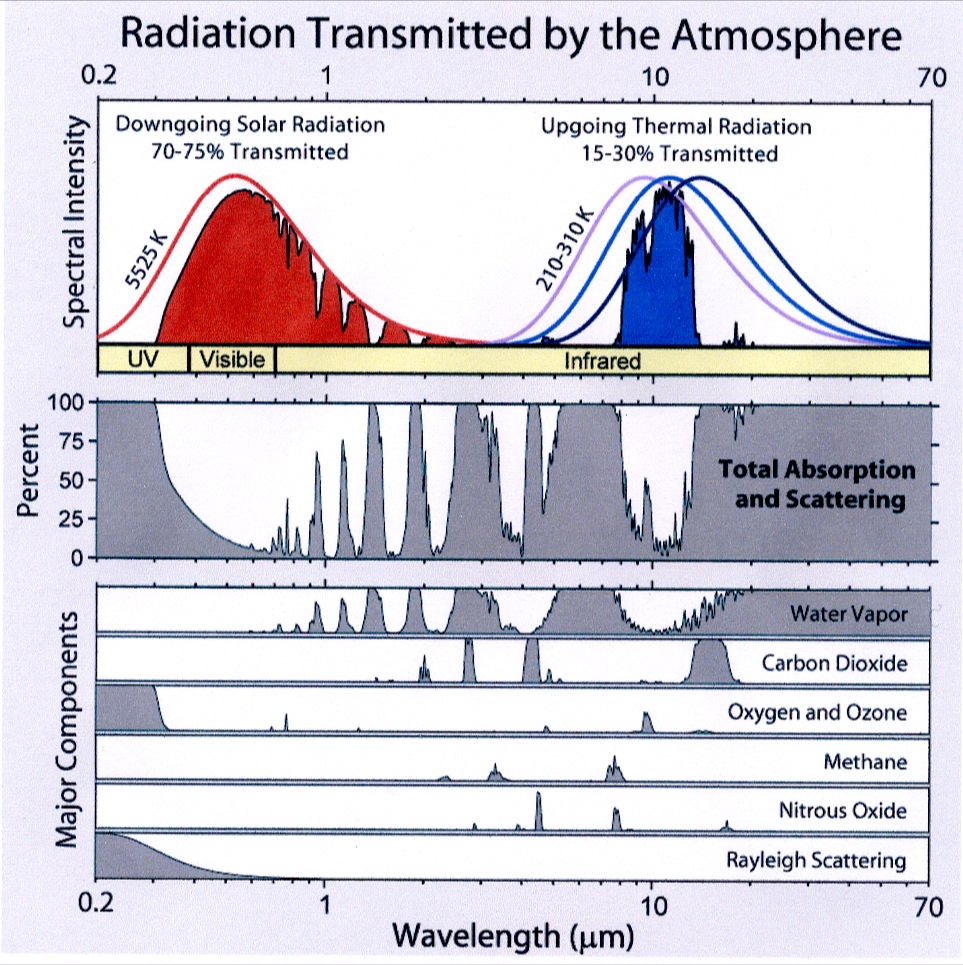
Carbon dioxide is a so-called “greenhouse” gas. It retards radiative cooling. All other factors held equal, increasing the atmospheric concentration of CO2 will lead to a somewhat higher atmospheric temperature. However, all other things are never held equal in Earth and Atmospheric Science… The atmosphere is not air in a jar; references to Arrhenius have no signficance.
Atmospheric CO2 has risen since the 19th century.

Humans are responsible for at least half of this rise in atmospheric CO2.

While anthropogenic sources are a tiny fraction of the total sources, we are removing carbon from geologic sequestration and returning it to the active carbon cycle.

The average temperature of Earth’s surface and troposphere has generally risen over the past 150 years.

Atmospheric CO2 has risen and warming has occurred.
The Bad
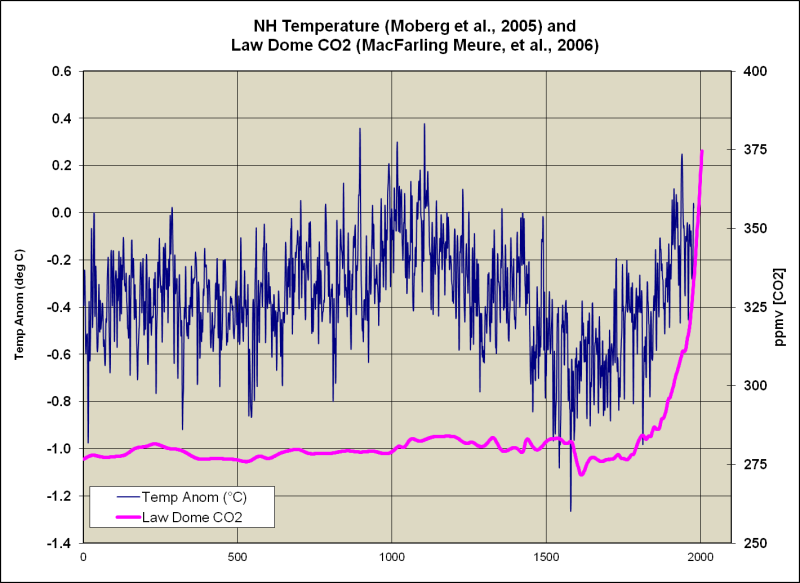
The modern warming began long before the recent rise in atmospheric CO2 and prior to the 19th century temperature and CO2 were decoupled:
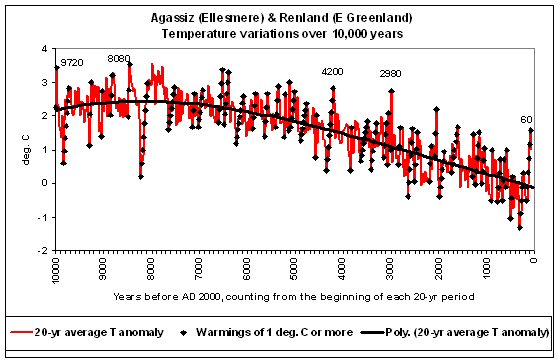
The recent rise in temperature is no more anomalous than the Medieval Warm Period or the Little Ice Age:

Over the past 2,000 years, the average temperature of the Northern Hemisphere has exceeded natural variability (defined as two standard deviations from the pre-1865 mean) three times: 1) the peak of the Medieval Warm Period 2) the nadir of the Little Ice Age and 3) since 1998. Human activities clearly were not the cause of the first two deviations. 70% of the warming since the early 1600’s clearly falls within the range of natural variability.
While it is possible that the current warm period is about 0.2 °C warmer than the peak of the Medieval Warm Period, this could be due to the differing resolutions of the proxy reconstruction and instrumental data:

The amplitude of the reconstructed temperature variability on centennial time-scales exceeds 0.6°C. This reconstruction is the first to show a distinct Roman Warm Period c. AD 1-300, reaching up to the 1961-1990 mean temperature level, followed by the Dark Age Cold Period c. AD 300-800. The Medieval Warm Period is seen c. AD 800–1300 and the Little Ice Age is clearly visible c. AD 1300-1900, followed by a rapid temperature increase in the twentieth century. The highest average temperatures in the reconstruction are encountered in the mid to late tenth century and the lowest in the late seventeenth century. Decadal mean temperatures seem to have reached or exceeded the 1961-1990 mean temperature level during substantial parts of the Roman Warm Period and the Medieval Warm Period. The temperature of the last two decades, however, is possibly higher than during any previous time in the past two millennia, although this is only seen in the instrumental temperature data and not in the multi-proxy reconstruction itself.
[…]
The proxy reconstruction itself does not show such an unprecedented warming but we must consider that only a few records used in the reconstruction extend into the 1990s. Nevertheless, a very cautious interpretation of the level of warmth since AD 1990 compared to that of the peak warming during the Roman Warm Period and the Medieval Warm Period is strongly suggested.
[…]
The amplitude of the temperature variability on multi-decadal to centennial time-scales reconstructed here should presumably be considered to be the minimum of the true variability on those time-scales.
[…]

The climate of the Holocene has been characterized by a roughly millennial cycle of warming and cooling (for those who don’t like the word “cycle,” pretend that I typed “quasi-periodic fluctuation”):


These cycles (quasi-periodic fluctuations) even have names:

These cycles have been long recognized by Quaternary geologists:

Fourier analysis of the GISP2 ice core clearly demonstrates that the millennial scale climate cycle is the dominant signal in the Holocene (Davis & Bohling, 2001).

The industrial era climate has not changed in any manner inconsistent with the well-established natural millennial scale cycle. Assuming that the ice core CO2 is reliable, the modern rise in CO2 has had little, if any effect on climate.
The Null Hypothesis
What is a ‘Null Hypothesis’
A null hypothesis is a type of hypothesis used in statistics that proposes that no statistical significance exists in a set of given observations. The null hypothesis attempts to show that no variation exists between variables or that a single variable is no different than its mean. It is presumed to be true until statistical evidence nullifies it for an alternative hypothesis.
Read more: Null Hypothesis http://www.investopedia.com/terms/n/null_hypothesis.asp#ixzz4eWXO8w00
Follow us: Investopedia on Facebook
Since it is impossible to run a controlled experiment on Earth’s climate (there is no control planet), the only way to “test” the CAGW hypothesis is through models. If the CAGW hypothesis is valid, the models should demonstrate predictive skill. The models have utterly failed:


The models have failed because they result in a climate sensitivity that is 2-3 times that supported by observations:

From Hansen et al. 1988 through every IPCC assessment report, the observed temperatures have consistently tracked the strong mitigation scenarios in which the rise in atmospheric CO2 has been slowed and/or halted.
Apart from the strong El Niño events of 1998 and 2015-16, GISTEMP has tracked Scenario C, in which CO2 levels stopped rising in 2000, holding at 368 ppm.

The utter failure of this model is most apparent on the more climate-relevant 5-yr running mean:

This is from IPCC’s First Assessment Report:

HadCRUT4 has tracked below Scenario D.

This is from the IPCC’s Third Assessment Report (TAR):
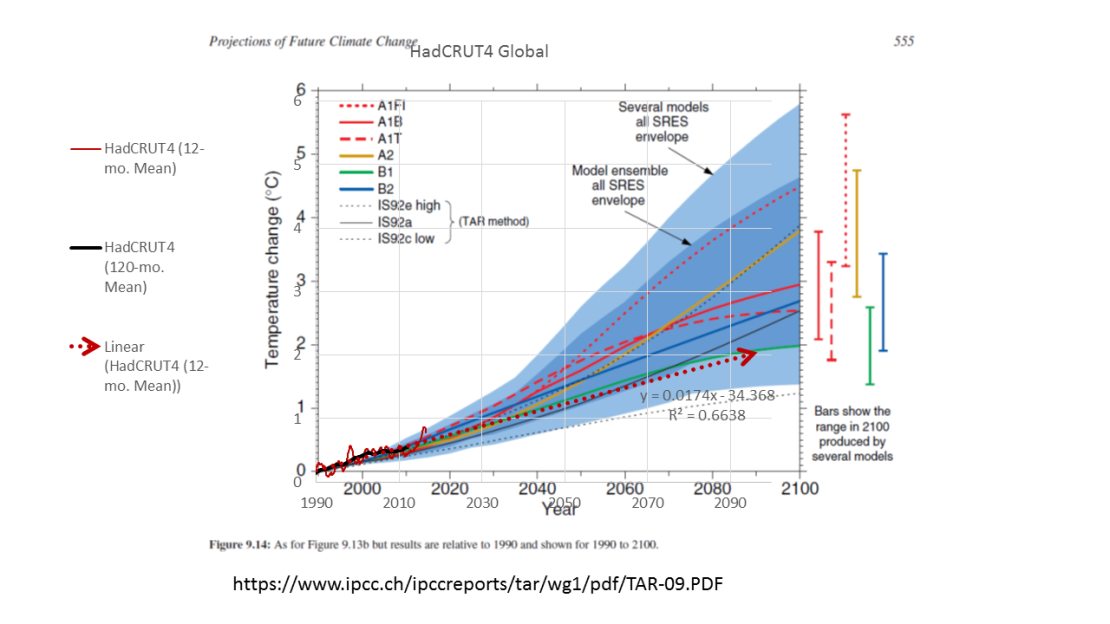
HadCRUT4 has tracked the strong mitigation scenarios, despite a general lack of mitigation.
The climate models have never demonstrated any predictive skill.
And the models aren’t getting better. Even when they start the model run in 2006, the observed temperatures consistently track at or below the low end 5-95% range. Observed temperatures only approach the model mean (P50) in 2006, 2015 and 2016.

The ensemble consists of 138 model runs using a range of representative concentration pathways (RCP), from a worst case scenario RCP 8.5, often referred to as “business as usual,” to varying grades of mitigation scenarios (RCP 2.6, 4.5 and 6.0).

When we drill wells, we run probability distributions to estimate the oil and gas reserves we will add if the well is successful. The model inputs consist of a range of estimates of reservoir thickness, area and petrophysical characteristics. The model output consists of a probability distribution from P10 to P90.
- P10 = Maximum Case. There is a 10% probability that the well will produce at least this much oil and/or gas.
- P50 = Mean Case. There is a 50% probability that the well will produce at least this much oil and/or gas. Probable reserves are >P50.
- P90 = Minimum Case. There is a 90% probability that the well will produce at least this much oil and/or gas. Proved reserves are P90.
Over time, a drilling program should track near P50. If your drilling results track close to P10 or P90, your model input is seriously flawed.
If the CMIP5 model ensemble had predictive skill, the observations should track around P50, half the runs should predict more warming and half less than is actually observed. During the predictive run of the model, HadCRUT4.5 has not *tracked* anywhere near P50…

I “eyeballed” the instrumental observations to estimate a probability distribution of predictive run of the model.
Prediction Run Approximate Distribution
2006 P60 (60% of the models predicted a warmer temperature)
2007 P75
2008 P95
2009 P80
2010 P70
2011-2013 >P95
2014 P90
2015-2016 P55
Note that during the 1998-99 El Niño, the observations spiked above P05 (less than 5% of the models predicted this). During the 2015-16 El Niño, HadCRUT only spiked to P55. El Niño events are not P50 conditions. Strong El Niño and La Niña events should spike toward the P05 and P95 boundaries.
The temperature observations are clearly tracking much closer to strong mitigation scenarios rather than RCP 8.5, the bogus “business as usual” scenario.
The red hachured trapezoid indicates that HadCRUT4.5 will continue to track between less than P100 and P50. This is indicative of a miserable failure of the models and a pretty good clue that the models need be adjusted downward.
In any other field of science CAGW would be a long-discarded falsified hypothesis.
Conclusion
Claims that AGW or CAGW have earned an exemption from the Null Hypothesis principle are patently ridiculous.
In science, a broad, natural explanation for a wide range of phenomena. Theories are concise, coherent, systematic, predictive, and broadly applicable, often integrating and generalizing many hypotheses. Theories accepted by the scientific community are generally strongly supported by many different lines of evidence-but even theories may be modified or overturned if warranted by new evidence and perspectives.
This is not a scientific hypothesis:
More CO2 will cause some warming.
It is arm waving.
This is a scientific hypothesis:
A doubling of atmospheric CO2 will cause the lower troposphere to warm by ___ °C.
Thirty-plus years of failed climate models never been able to fill in the blank. The IPCC’s Fifth Assessment Report essentially stated that it was no longer necessary to fill in the blank.
While it is very likely that human activities are the cause of at least some of the warming over the past 150 years, there is no robust statistical correlation. The failure of the climate models clearly demonstrates that the null hypothesis still holds true for atmospheric CO2 and temperature.
Selected References
Davis, J. C., and G. C. Bohling, The search for patterns in ice-core temperature curves, 2001, in L. C. Gerhard, W. E. Harrison, and B. M. Hanson, eds., Geological perspectives of global climate change, p. 213–229.
Finsinger, W. and F. Wagner-Cremer. Stomatal-based inference models for reconstruction of atmospheric CO2 concentration: a method assessment using a calibration and validation approach. The Holocene 19,5 (2009) pp. 757–764
Grosjean, M., Suter, P. J., Trachsel, M. and Wanner, H. 2007. Ice-borne prehistoric finds in the Swiss Alps reflect Holocene glacier fluctuations. J. Quaternary Sci.,Vol. 22 pp. 203–207. ISSN 0267-8179.
Hansen, J., I. Fung, A. Lacis, D. Rind, Lebedeff, R. Ruedy, G. Russell, and P. Stone, 1988: Global climate changes as forecast by Goddard Institute for Space Studies three-dimensional model. J. Geophys. Res., 93, 9341-9364, doi:10.1029/88JD00231.
Kouwenberg, LLR, Wagner F, Kurschner WM, Visscher H (2005) Atmospheric CO2 fluctuations during the last millennium reconstructed by stomatal frequency analysis of Tsuga heterophylla needles. Geology 33:33–36
Ljungqvist, F.C. 2009. N. Hemisphere Extra-Tropics 2,000yr Decadal Temperature Reconstruction. IGBP PAGES/World Data Center for Paleoclimatology Data Contribution Series # 2010-089. NOAA/NCDC Paleoclimatology Program, Boulder CO, USA.
Ljungqvist, F.C. 2010. A new reconstruction of temperature variability in the extra-tropical Northern Hemisphere during the last two millennia. Geografiska Annaler: Physical Geography, Vol. 92 A(3), pp. 339-351, September 2010. DOI: 10.1111/j.1468-459.2010.00399.x
MacFarling Meure, C., D. Etheridge, C. Trudinger, P. Steele, R. Langenfelds, T. van Ommen, A. Smith, and J. Elkins. 2006. The Law Dome CO2, CH4 and N2O Ice Core Records Extended to 2000 years BP. Geophysical Research Letters, Vol. 33, No. 14, L14810 10.1029/2006GL026152.
Moberg, A., D.M. Sonechkin, K. Holmgren, N.M. Datsenko and W. Karlén. 2005. Highly variable Northern Hemisphere temperatures reconstructed from low-and high-resolution proxy data. Nature, Vol. 433, No. 7026, pp. 613-617, 10 February 2005.
Instrumental Temperature Data from Hadley Centre / UEA CRU, NASA Goddard Institute for Space Studies and Berkeley Earth Surface Temperature Project via Wood for Trees.
The theory–we are changing the chemistry of the atmosphere and therefore we are changing the rate of heat exchange, contributing to an average temperature that is different from what it would be without our activities–seems perfectly plausible, if useless. But I can’t get past these temperature estimates that claim precision in global average to a 10th of a degree not only during periods when 99% of the planet wasn’t within 100 miles of a thermometer, but before even the invention of the thermometer.
Quite who are we to believe, invented temperatures or Brughel’s paintings? I believe the paintings because he had no reason to lie.
It continues to astonish me the way even most “skeptics” accept claims of precision that are obviously bogus. Prior to weather satellites, no claim can be made as to the average temperature of the earth. Period.
I could paint a snowy day right now, late at night in mid spring. I just have to find the leftover Christmas cards, to copy.
A rich patron is not going to buy a painting of snow when there is plenty of the stuff to see through your window for free. No, you pay for something different. The same with hills, or the Tower of Babel. These are things that you order for your gallery if you don’t already have them.
Robert Carnegie – I’ve a cheap van Gogh painting of a starry night if you’re interested.
Can I see the actual night sky looking like the van Gogh one before I speak to my bank? 🙂
And I’ll have to hide under my bed for a while first to see if the world ends or not… it looks like it.
White paint is cheap…
A simple observation belies the entire question. As human CO2 emissions have gone up exponentially, atmospheric CO2 ppm has gone up linearly and even at a slightly lower slope recently. Thus, if we are having no effect on atmospheric CO2 concentration, we cannot be thus affecting the climate through our emissions.
It’s a simple observation that does not require arguing or thrashing about the science.
You, obviously have not read many WUWT articles and the comments following, tim maguire.
Skeptics may have to use the absurd impossible accuracies and claims of precision that NOAA uses in bluffing the world; but that does not mean we believe NOAA’s bluffs.
By the way, Mankind is not changing the chemistry of the atmosphere. Alarmists claim CO2 was 280ppm ‘before’ man’s influence.
Current CO2 levels are around 400ppm.
Where over a hundred years ago, CO2’s atmospheric component represents 2.8 molecules of CO2 per 10,000 molecules of CO2.
Currently, CO2’s atmospheric component represents an increase of 1.2 CO2 molecules per 10,000 molecules of atmosphere.
A 1.2 molecule increase per 10,000 molecules over one hundred years represents a miniscule increase per year.
What is interesting is all of the ranting and frothing alarmists perform over a 1.2 molecule CO2 increase.
Predicting every thing from hell on Earth to people fleeing the coasts.
It is a wonder that alarmists still believe their own CO2 fantasies and nightmares, even after thirty years of abject failure.
The null hypothesis for determining the climate sensitivity is that Joules are Joules, COE dictates linearity in the energy domain and that the 1.6 W/m^2 emitted by the surface that arises from each W/m^2 sets the surface emission sensitivity of 1.6 W/m^2 per W/m^2 of forcing. When 1.6 W/m^2 is added to the current surface emissions of 385 W/m^2 at the current average temperature of about 287.5K, and then converted back to a temperature, the temperature increases by about 0.3C corresponding to a sensitivity of 0.3C per W/m^2 which is below the lower limit of the range claimed by the IPCC of 0.8C +/- 0.4C per W/m^2.
The linearity is confirmed here where surface emissions across the planet are plotted against the post albedo incident power from the Sun where the temperature is measured.
http://www.palisad.com/co2/sens/pi/se.png
+10 × 1,000,000
Thank you !!
Note: I will not engage in debates about the validity of the scientific theories of plate tectonics or evolution.
Very wise to note that, David. Unless preempted, the “E” word exponentially increases the probability of thread hijacking.
What, by bringing religion into “science”. Surely not? 😉
I thought climate science was currently all about belief in an unprovable hypothesis, AKA consensus, with no control planet etc. , so infinitely arguable, while the phoney net grid CO2 increasing in fact renewables coin in their wholly regressive subsidies on every measure of their claims – that are justified in the name iof the uprovable belief?
Pay or burn! Sound familiar?
The hijacking of unprovable climate modelling in denial of the long term evidence, soo Vostok Core at end. is all about exploiting irrational human fears and belief for profit using what makes the supposed problem worse in science fact.
Good old time religion, nothing changed through our scientific EVOLUTION since the Moche. Those who want a fast buck from whatever populist belief they can create in the hard of science from the larger problems du jour – the troughing ministers, officials, academics who live off our taxes, etc. – are the modern equivalent of priests, tributes and sacrifices are the subsidies, the iconic pyramids windmills, solar farms, tidal barrages, etc. Like the Moche’s mud pyramids, all are technically unnecessary to deliver the desired result of maximum CO2 reduction and long term affordable and sustainable electrical supply at the increaing levels required to maintain a developed civilisation.
On the established climate record we will need a adeqaute response to the next major long term climate state of the ice age, FAR longer than the short planetary hot flush we are currently enjoying, while our orbit is circular and we are slowly returning to the steady state high albedo ice age, as we have many times before.
In fact you could say the evangelists are right about the length of history, if you limit your definition of history to modern humans and forget every other living thing on Earth, including the Neanderthals. . We may only last this warm snap before the slowest ever ice Armageddon finishes off our unprepared post industrial society as it regresses into science denying superstitious beliefs in thermal runaway (see Vostok core re that again), and we become Neanderthal 2.0, waiting to thaw out of one of the glaciers that Al Gore said would disappear some time ago. Another priest who has done well from the promotion of false science that doesn’t work as he claimed, because, most likely, it can’t and won’t. Bad Science – AGBS.
The real science denial is the dishonest support for the actual malfeasance of the supposed remedies, of course. Climate will most probaly do what it did the last few ice ages, with a bit of noise on the main cycle from the briefly “civilised” but ultimately insignificant and puny organic froth (see Vostok core again, unable to adapt its society to the reality of relentless and cyclic natural change..
FUTURE: Get real or be Neanderthal 2.0. Who knew? We did. But believed otherwise for selfish and fast human lifetime related buck..
The only serious climate question in fact is what kicks our short warm snaps off? I suggest they end naturally as the 100.000 year impulses degcline to the stable ice age condition. I am going to post on a development of that, already suggested here, but in a hopefully clearer and more evidence based way than the first “two state binary switching idea”. The evidence says it’s not quite like that, but the two state limits idea clearly has merit, our warm spell already hit its high limiting condition 10,000 years ago, with a bit of noise over those 10,000 years relative to the major change. The warming change occurs very fast, over hundreds of years, leading CO2 rises, not following them, as we know, then decays gradualy over thousands of years as the ice advances towards the equator, until solar radiation balnces out in a new equilibrium that locks in the next stable long term ice age, what I would suggest is the planet’s natural climate, based on solar radiation alone.
That remains stable with some further cooling, until the next major heat injection into the global climate system, on the MIlankovitch cycle period ….. go figure …… to be continued……
 ?dl=0
?dl=0
Good Job! Thoroughly Debunks CAGW. In simpler terms It’s impossible for 1 molecule of Anthropogenic CO2 to significantly affect the average Temperature of 62,500 molecules of atmosphere.
Actually it isn’t.
The reason why more CO2 has very little impact on temperature is because the only region where CO2 absorbs energy that is within the envelope in which the earth is radiating IR energy, is just about saturated.
If CO2 levels were at 25ppm and increased to 50ppm, it would have a substantial impact on temperatures.
CO2 works by absorbing a photon with certain frequencies. It almost immediately transfers the energy gained to other molecules in the atmosphere, then is ready to absorb the next photon that comes along.
This gives one molecule of CO2 the ability to transfer heat to many other molecules.
Nonsense!
Physics is nonsense.
Interesting take there.
Right . Beer’s Law .
And the equilibrium temperature of a body of any particular spectrum is easily calculated . And apparently the lumped surface + atmosphere spectrum as seen from the outside actually causes that equilibrium to be about 23 degrees below that of a gray ball in our orbit .
“This gives one molecule of CO2 the ability to transfer heat to many other molecules”.
I’m not quite sure what you are saying here. Are you saying that one CO2 molecule has the ability to transfer the total amount of ‘heat’ to many other molecules each, or that some fraction of the ‘heat’ is distributed among many other molecules?
I’m saying that one molecule of CO2 transfers energy to the molecules around it over and over and over again. Thousands to millions of times per second. Depending on how often it is hit by a photon with the right energy levels.
The thermalization (collision with other molecules dominating re-radiation) is only true in the lower troposphere. In the upper troposphere in the tropopause where atmospheric pressure is much less, greenhouse gases are able to radiate energy to space (and downward as well). But CO2 in the tropopause is still subject to that logarithmic function of rapidly diminishing performance above 50 ppm.
Bob Armstrong April 17, 2017 at 12:24 pm
Beer’s Law: the warmer the beer, the faster it releases CO2 to the atmosphere.
So… The trick is to drink it faster than it warms… 😉
David.
Yes, that would be the ecologically responsible thing to do, but could lead to subsequent outgassing.
Robert, it’s still true in the troposphere, it just that since there is a longer period between collisions there is a greater chance that the CO2 molecule will radiate before it collides with something.
Then there’s Cole’s Law: Thinly sliced cabbage that when consumed can cause release of greenhouse gases. 🙂
And lets not forget Bean’s law. I believe it is associated with methane and known for its room clearing properties.
Not quite accurate. It can transfer the absorbed energy through a collision to only one other molecule. It may then absorb another photon and subsequently transfer energy to another molecule. On the other hand, another molecule may transfer that energy back to it through another collision and it won’t happen to absorb another photon. It’s a complicated process.
Your statement meant to me that, when I first read it, one CO2 could continuously transfer heat to many other molecules after just absorbing one photon. Not true.
Doesn’t this work out to one molecule of CO2 per 2500 other molecules? This has always seemed like a HUGE number of other molecules to energize with just one molecule. I’ve never quite understood how this is supposed to work at the atomic/molecular level, given such numbers.
Wouldn’t there be some sort of accumulating damping effect throughout all those collisions, progressively weakening the next molecule’s share of the transferred energy? Wouldn’t there be some sort of cumulative damping effect from molecules vibrating in one direction, while other molecules vibrated in ways to cancel some of those vibrations?
Nonsense, while what you say is in theory correct, the amount of energy able to be transferred to other molecules (or reradiated) is strictly limited to the availability of photons at the right wavelength. No photons, no warming. Those photons are representative of a very narrow slice of the EM spectrum there is not much power in that narrow band.
” the equilibrium temperature ” Nonsense. The atmosphere is not at equilibrium.
“of a body of any particular spectrum is easily calculated” Nonsense. There are bodies that are not at equilibrium and do not have a grey body spectrum. For those you cannot ‘easily calculate’ such delusion.
Looking at figure 1, CO2 only has one peak that is in the region where the earth is emitting most of it’s IR energy.
1) The peak is almost completely saturated already.
2) If the earth did warm, the region of peak emissions would move away from the CO2 peak, making CO2 have even less impact than it does now.
MarkW, this seems to be correct despite the brick-bats being thrown at your comments, although your language is somewhat imprecise. There is a good explanation of the basic physics of the Greenhouse Effect in this link :
http://acmg.seas.harvard.edu/people/faculty/djj/book/bookchap7.html
It says quite explicitly that once a gas concentration reaches a point where the atmosphere becomes highly opaque, to the Earth’s IR radiation, increasing the concentration further has a rapidly diminishing effect.
I see many comments to the effect that the Greenhouse effect doesn’t exists. It seems quite obvious to me. It’s just that it is not necessarily the dominant effect.
Good review of the basic issues.
The greenhouse effect of CO2 doesn’t need disproving in order to disprove the alarmists’ case. It’s been well understood for over a hundred years that it has a logarithmic shape which means that further increases will have only small effects. Indeed, the problem is for the alarmists to somehow find a way to negate the effect of that logarithmic relationship.
Meanwhile, as for the ‘record temperatures’ I could offer an analogy that a man climbing a hill with a steady slope will always be ‘at a record height’ which is higher than any point he has previously been at. That says absolutely nothing about how high he is, how fast he is climbing or how long it will take him to reach the summit, though.
Bottom line to both of these arguments is that science is based on measurements, not on hyperbole. With no actual figures the statements are meaningless.
+ 1
Agreed. Nor does the theory really address WHY this relatively minor increase in temperature is so bad.
Not to mention that the minor increase is a figure pulled out of thin air.
The other way to debunk the surface heating by back-radiation nonsense (another of the GHG pseudo-hypotheses) is simple maths. If 1 unit of energy is radiated away from the surface and half is ‘reflected’ back, the net change in surface energy is -1+0.5 = -0.5, i.e. COOLER. That is of course a very simplistic model, but it illustrates the point.
The only way the atmosphere could heat the surface is if it were a heat source, which clearly it isn’t.
By your logic, blankets do nothing to keep people warm, since they aren’t heat sources.
Mark W: and ilma630 is correct: blankets do not warm people. “Keep people warm” is a wonderfully imprecise term: blankets reduce the rate at which people lose heat, and they do not do it by capturing long wave IR in excited wool molecules.
Or the height of the summit!
I keep coming back to one thing – climate sensitivity. That is almost certainly an arm-waving number, an approximate guess. How could it be otherwise? There is not even proof that this number is a positive value. Yet to get catastrophic warming that number not only has to positive, but has to be absurdly large.
Given the climate of the Earth has been relatively stable for millions of years, a large value for climate sensitivity is highly unlikely. Sensitive systems are rarely stable. Stable systems tend to be massively buffered. It would take some truly extraordinary evidence to prove otherwise.
Exactly. The IPCC made a wild guess about the magnitude of the climate sensitivity where the main criteria was that it had to be large enough to justify their formation. They will never acknowledge the actual sensitivity as it would preclude their reason to exist and self preservation is a prime driver of any bureaucracy, especially when there’s trillions of dollars at stake. This is why conflicts of interest are a problem where this one arose as the IPCC maneuvered itself to become the arbiter of what is and what is not climate science based on what they published in their reports.
chimp:
I have twice attempted to post a long reply to your latest post but both attempts have vanished (I hope they are in moderation and one may reappear but I don’t know that). This is a pity because I think our debate could be productive for each of us.
Richard
Kristian:
You need to escape from your American culture of ‘try, try and try again’ so you can accept reality. You are behaving like one of the rejected contestants who when told their singing is rejected doesn’t walk off the stage but starts to sing again.
I repeat, I do “see your point” and I disagree with it.
I have repeatedly told you I stand by my view that the 10 (n.b. TEN) different methods to measure climate sensitivity which I have cited and linked do not use the same procedures so cannot be using the same set of assumptions and they are obtained from different source data, but they each provide a similar determination of climate sensitivity being ~0.4°C for a doubling of CO2 equivalent.
It is a stretch to suggest their similar determinations are a coincidence.
Your response is to say to me
But that IS your opinion because people have measured it in the 10 different ways I have told you.
If you choose to ‘sing again’ I will ignore it.
Richard
Tenn:
You say
No, climate sensitivity can be and has been measured. i.e.
.
Empirical – n.b. not model-derived – determinations indicate climate sensitivity is less than 1.0°C for a doubling of atmospheric CO2 equivalent. This is indicated by the studies of
Idso from surface measurements
http://www.warwickhughes.com/papers/Idso_CR_1998.pdf
and Lindzen & Choi from ERBE satellite data
http://www.drroyspencer.com/Lindzen-and-Choi-GRL-2009.pdf
and Gregory from balloon radiosonde data
http://www.friendsofscience.org/assets/documents/OLR&NGF_June2011.pdf
And the low measured value of climate sensitivity indicates that feedbacks are negative so – as you suggest – the system is stable.
Indeed, because climate sensitivity is less than 1.0°C for a doubling of CO2 equivalent, it is physically impossible for man-made global warming to be large enough to be detected . If something exists but is too small to be detected then it only has an abstract existence; it does not have a discernible existence that has effects (observation of the effects would be its detection).
Please note that this indication of negligible climatic effect of emissions of CO2 from human activities assumes the above article is correct when it asserts
but that assertion is probably wrong (ref. Rorsch A, Courtney RS & Thoenes D, ‘The Interaction of Climate Change and the Carbon Dioxide Cycle’ E&E v16no2 (2005) ).
Richard
Huh? In what way is “climate sensitivity” ever measured? It is always just assumed.
Climate sensitivity can be calculated from the observations of temperature and CO2…
https://judithcurry.com/2016/04/25/updated-climate-sensitivity-estimates/
The problem is that the calculations yield a much lower sensitivity than the models do.
Other things are measured and climate sensitivity is calculated.
True.
I agree that we can theoretically calculate an ECS from Stefan-Boltzman or other first principles, but my simple argument would be that it’s never going to be repeatedly observed thanks to our chaotic, multi-variate, non-linear climate system. Meaning, regardless of what you calculate from first principles, or through endless data gathering and back-fitting, we have a system that is responding to multiple inputs. So, you’re unlikely to see it respond predictably with only the change in a single variable. This, of course, has been flogged to death long before by many others… But, it should be noted that we usually fail to consider the full implications of this. Meaning, we regularly point to the failure of temps to correlate directly with CO2 as evidence that CO2 isn’t the main forcing. But, knowing that we have this chaotic system, we have to acknowledge that the many variable inputs could also be masking a higher sensitivity to CO2 than the current temperature records indicate. Not saying it is…just saying that it’s a possibility that should be acknowledged.
rip
Kristian:
You ask and say to me
No! I wrote
I stated source data and the links are to the actual papers so if you use the links you can read all the details of the methods.
The Idso paper was published in 998 and lists eight different ‘natural experiments’ that each provides a similar result. Its abstract says
The other two papers are much more recent (2009 and 2011) and they also derive a climate sensitivity of ~0.4°C for a doubling of atmospheric CO2 concentration. These three papers use completely independent source data (i.e. surface measurements, ERBE satellite data, and balloon radiosonde data), and different methods conducted by completely independent analysts.
Richard
1998 and not 998. Sorry
Richard
commiebob:
You say of climate sensitivity measurements
That is only true in the same way that measurements of density are obtained by other things being measured and density being calculated.
Richard
Richard,
The concept of density exists and is valid. We can’t be so sure about the concept of ECS. It might not be valid or exist at all.
That trivializes the problem beyond all belief.
The reason why the true value of the ECS is hard to determine is because it’s definition was purposefully designed to obfuscate the underlying truth.
1) Forcing is defined as an instantaneous difference in flux at TOS which excludes the cooling effect from cloud albedo.
2) Sensitivity is defined in the non linear units of degrees per W/m^2 of forcing rather than in the demonstrably linear units of W/m^2 of surface emissions per W/m^2 of forcing, which under current conditions is 1.6 W/m^2 of surface emissions per W/m^2 of post albedo solar forcing.
3) The definition of forcing considers 1 W/m^2 of instantaneous incremental solar energy the same as a 1 W/m^2 instantaneous decrease in surface emissions owing to the increase in absorption by the atmosphere upon instantly doubling Co2 which assumes that the entire W/m^2 of extra absorption is ultimately returned to the surface as is the case with 1 W/m^2 of incremental post albedo solar input.
4) The definition of ECS is further obfuscated by expressing it as the effect of doubling Co2, ignoring the fact that ECS actually operates on solar forcing and the 3.7 W/m^2 of forcing claimed to arise from doubling Co2 is not actual forcing, but that doubling Co2 is EQUIVALENT to a 3.7 W/m^2 increase in post albedo solar forcing.
5) Sensitivity is defined ‘incrementally’ which allows them to ignore the current steady state of 1.6 W/m^2 of surface emissions per W/m^2 of forcing giving them the wiggle room to claim that it’s 4.4 W/m^2 per W/m^2 of forcing.
6) They claim that the current steady state of 1.6 W/m^2 of surface emissions per W/m^2 of forcing is the ‘zero feedback’ effect, when in fact, it’s the final result after all positive, negative, known and unknown feedback like effects have been accounted for. If this is the ‘zero feedback’ response, then the net feedback must be zero.
7) The claim that it is incrementally 4.4 W/m^2 of emissions per W/m^2 of forcing was arm waved into existence by asserting positive feedback amplifies the ‘zero feedback’ response, where Bode’s analysis simply doesn’t apply to a passive system like the climate.
8) Chaos is invoked as making the ECS less predictable, where chaos is only relevant in the transition from one state to another (it’s called weather), but has no bearing on what the next state (temperature) will be.
Apparently, the many layers of obfuscation work and has bamboozled many people, including ostensibly intelligent scientists from many disciplines.
chimp and commiebob:
Mass can be measured. Volume can be measured.
One divided by the other is density.
And
Change to radiative forcing can be measured. Change to temperature can be measured.
One divided by the other is climate sensitivity.
So
There is no difference in principle.
I listed three papers that use different analysis methods of different source data analysed by different people at different times. Each of those papers concludes that climate sensitivity is ~0.4°C for a doubling of CO2 equivalent. If you have a dispute with any of those papers then please explicitly state it: arm waving about the existence of climate sensitivity and the complexity of determining it ‘doesn’t cut it’.
Richard
Like this
https://micro6500blog.wordpress.com/2016/05/18/measuring-surface-climate-sensitivity/
co2isnotevil:
Thankyou for that excellent summary.
You say
Yes!
And when climate sensitivity is measured the result is a value that incorporates the combined effects of all the feedbacks both known and unknown.
Richard
I have no trouble at all with the papers. The first line in Lindzen and Choi reads:
They do not assert, as you have done, that they have measured climate sensitivity.
It could be wrong, Humans are probably responsible for 40-60% of the rise in CO2. It could be less than half.
Richard,
Mass and volume can be measured. It’s not at all clear that change to radiative forcing and change to temperature can be measured in anything like the same way. Mass and volume are physical constants more or less independent. They are the only factors in determining density.
Not so the possibly mythical ECS. Change to temperature is not solely as a direct result of radiative forcing. There are feedbacks that can vary. Even if ECS should exist, it won’t be the same at all times under all conditions.
IMO equating such a dubious, nebulous (clouds!), possibly nonphysical concept as ECS with the arithmetic concept of density is a stretch, to say the least.
David Middleton April 17, 2017 at 6:13 pm
CO2 ppm might have been as high as 330 during the Eemian, depending upon which proxies you credit. Thus, I’m guessing that some 70 out of the 120 ppm increase since c. AD 1850 might be man-made, ie 58%.
That’s a very reasonable interpretation.
Although the Eemian was naturally warmer than now, so the human contribution could be higher than ~60%.
commieBob:
All measurements are estimates from observations.
Lindzen & Choi were saying they measured climate sensitivity when they wrote
Richard
chimp:
You say to me
All parameters are defined by humans.
And many parameters are NOT “the same at all times under all conditions” (e.g. electrical resistance can vary with temperature) but that does not prevent them being measured under specified conditions.
The specified condition for climate sensitivity is the existing climate state when measurements are taken. That is why I think it important that the three papers I cited are from times two decades apart and I said they were from different times. Their similar indications imply variation in climate sensitivity has not been significant in recent decades.
Of greater importance is that I keep talking about climate sensitivity but you keep talking about ECS (i.e. equilibrium climate sensitivity). I don’t think the two are significantly different because the predicted “committed warming” has not happened.
The lack of discernible “committed warming” suggests there is negligible difference between climate sensitivity and equilibrium climate sensitivity.
The explanation for “committed warming” is in IPCC AR4 (2007) Chapter 10.7 which can be read at
http://www.ipcc.ch/publications_and_data/ar4/wg1/en/ch10s10-7.html
It says there
In other words, it was expected that global temperature would rise at an average rate of “0.2°C per decade” over the first two decades of this century with half of this rise being due to atmospheric GHG emissions which were already in the system because equilibrium had not been reached.
This assertion of “committed warming” should have had large uncertainty because the Report was published in 2007 and there was then no indication of any global temperature rise over the previous 7 years. There has still not been any significant rise and we are now less than three years short of the “first two decades of the 21st century”.
So, if this “committed warming” is to occur such as to provide a rise of 0.2°C per decade by 2020 then global temperature would need to rise over the next 3 years by about 0.4°C. And this assumes the “average” rise over the two decades is the difference between the temperatures at 2000 and 2020. If the average rise of each of the two decades is assumed to be the “average” (i.e. linear trend) over those two decades then global temperature now needs to rise before 2020 by more than it rose over the entire twentieth century. It is estimated to have risen by ~0.8°C over the entire twentieth century.
Simply, the “committed warming” has disappeared (perhaps it has eloped with Trenberth’s ‘missing heat’?).
Additionally, and incidentally, this disappearance of the “committed warming” is – of itself – sufficient to falsify the AGW hypothesis as emulated by climate models. If we reach 2020 without any detection of the “committed warming” then it will be 100% certain that all projections of global warming are complete bunkum.
Richard
Chimp:
My first attempt to provide this reply to you has vanished. This is a second attempt.
You say to me
There is nothing special about climate sensitivity being a physical parameter. All physical parameters are defined by humans. And physical parameters often vary with the conditions at the time they are measured; e.g. electrical resistance varies with density.
The conditions at the time of a measurement are important and that is why I pointed out that the measurement sets I cited were obtained at “different times” which were two decades apart. The fact that they obtained similar value for climate sensitivity implies that variation in climate sensitivity has been negligible over recent decades.
Of greater importance is my consistently stating climate sensitivity and you mentioning ECS (i.e. equilibrium climate sensitivity).
The lack of discernible “committed warming” suggests there is negligible difference between climate sensitivity and equilibrium climate sensitivity.
The explanation for “committed warming” is in IPCC AR4 (2007) Chapter 10.7 which can be read at
http://www.ipcc.ch/publications_and_data/ar4/wg1/en/ch10s10-7.html
It says there
In other words, it was expected that global temperature would rise at an average rate of “0.2°C per decade” over the first two decades of this century with half of this rise being due to atmospheric GHG emissions which were already in the system because equilibrium had not been reached.
This assertion of “committed warming” should have had large uncertainty because the Report was published in 2007 and there was then no indication of any global temperature rise over the previous 7 years. There has still not been any significant rise and we are now less than three years short of the “first two decades of the 21st century”.
So, if this “committed warming” is to occur such as to provide a rise of 0.2°C per decade by 2020 then global temperature would need to rise over the next 3 years by about 0.4°C. And this assumes the “average” rise over the two decades is the difference between the temperatures at 2000 and 2020. If the average rise of each of the two decades is assumed to be the “average” (i.e. linear trend) over those two decades then global temperature now needs to rise before 2020 by more than it rose over the entire twentieth century. It is estimated to have risen by ~0.8°C over the entire twentieth century.
Simply, the “committed warming” has disappeared (perhaps it has eloped with Trenberth’s ‘missing heat’?).
And, incidentally, this disappearance of the “committed warming” is – of itself – sufficient to falsify the AGW hypothesis as emulated by climate models. If we reach 2020 without any detection of the “committed warming” then it will be 100% certain that all projections of global warming are complete bunkum.
Richard
chimp:
This message appeared in the wrong place but hopefully this copy of it is where intended.
I have twice attempted to post a long reply to your latest post but both attempts have vanished (I hope they are in moderation and one may reappear but I don’t know that). This is a pity because I think our debate could be productive for each of us.
Richard
richardscourtney says, April 17, 2017 at 2:48 pm:
Exactly. And they are all based on ASSUMPTIONS about physical cause-and-effect relationships and nothing else.
There is absolutely NOTHING in the ERBS and CERES ToA radiation flux data suggesting a climate sensitivity to a rise in atmospheric CO2 above ZERO. There is simply nothing going on:
https://wattsupwiththat.com/2017/04/17/the-good-the-bad-and-the-null-hypothesis/#comment-2478392
https://wattsupwiththat.com/2017/04/17/the-good-the-bad-and-the-null-hypothesis/#comment-2478917
https://wattsupwiththat.com/2017/04/17/the-good-the-bad-and-the-null-hypothesis/#comment-2478924
THEORETICALLY, there is a “climate sensitivity” to +CO2_atm. In the real world we have yet to spot one. We are simply unable to establish the causal link +CO2_atm => +T in the real Earth system.
Stay cool 😎 Richard, and stay well!
Richard,
Sorry WordPress or M0ds made it so hard on you. I try to remember to copy before posting, but often forget, with prompt regret.
Couldn’t agree more that there is little to no difference between ECS and CS, if such a thing exist.
Kristian:
I wrote
and you have replied
The 10 (n.b. TEN) different methods do not use the same procedures so cannot be using the same set of assumptions and they are obtained from different source data, but they each provide a similar determination of climate sensitivity being ~0.4°C for a doubling of CO2 equivalent.
It is a stretch to suggest their similar determinations are a coincidence.
And I add that in this thread we have pseudoscientists claiming there is no scientific null hypothesis and you claiming independent measurements are merely assumptions. This is not good.
Richard
Richard,
You appear not to get my point. It doesn’t matter what method they use. They ALL start out with the basic assumption that there IS indeed a direct causal link between some “radiative forcing” from an increase in atmospheric CO2 (and/or H2O, CH4 or whatever) and an absolute net rise in surface temperature. Most likely straight from some lab result. But this is completely circular. They’re begging the question. What we want to find out is what CAUSED an observed rise in temperature. In the REAL EARTH SYSTEM. Then we can’t start out by concluding that we already know, BEFORE we start investigating. If you, say, observe some rise in DWLWIR somewhere over a specific time period and you simultaneously observe a rise in T_s, you have absolutely NO reason to assume that the rise in T_s was CAUSED by that rise in DWLWIR. You don’t know. ESPECIALLY if the rise in DWLWIR that you observed were restricted to Clear-Sky conditions and to a tiny section of the full IR spectrum. You have no way of knowing. The same goes for OLR at the ToA. If you observe that the Clear-Sky OLR emitted specifically within the narrow CO2 part of the full spectrum has gone down over some time interval, while the T_tropo/T_s went up, you cannot conclude that this specific reduction in CO2 emission to space is what CAUSED the rise in T_tropo/T_s. It doesn’t work like that. First of all you need to look at All-Sky, and second of all you need to look at Earth’s TOTAL OLR flux to space.
Again, THEORETICALLY, there would be a “climate sensitivity” to +CO2_atm. ALL ELSE BEING EQUAL (or just feedbacks to original “forcing”), there would be a “climate sensitivity” to +CO2_atm. In reality, we haven’t found one. We have no way of saying, empirically, that there is an actual “climate sensitivity” to +CO2_atm in the real Earth system discernibly different from ZERO. In fact, real-world observations (ERBS+CERES vs. UAH) strongly suggest there isn’t one.
If they really looked, they would see an increase in the forcing from co2, but they would also see a reduction in the forcing (spectrums) from water vapor.
The use of the word estimate is an admission that they don’t have sufficient information to call their process a measurement.
Honesty is important. Real scientists are honest. Alarmist ‘scientists’ insist that they have precisely performed measurements which are, in fact, not even wild-ass guesses. We shouldn’t stoop to the level of the alarmists.
Kristian:
It is obvious that we have a difference of opinion. All I can do is iterate my view for clarity.
I stand by my view that the 10 (n.b. TEN) different methods I cited do not use the same procedures so cannot be using the same set of assumptions and they are obtained from different source data, but they each provide a similar determination of climate sensitivity being ~0.4°C for a doubling of CO2 equivalent.
It is a stretch to suggest their similar determinations are a coincidence.
Richard
Chimp:
Thanks for your message that says to me
I admit to some disappointment because I had hoped we had disagreement which may have enabled us to have a useful debate from which I could learn.
Richard
Richard,
I must say I find your position on this subject peculiar. Are you suggesting that you have referenced ten different ways of actually measuring “climate sensitivity” in the real Earth system that all somehow independently lead to a similar result?
Do you not agree with “Climate Science” that “climate sensitivity” (λ) is simply ΔT_s/RF (K/(W/m^2))? And do you not agree that all of these different “methods” or “procedures” will still in the end have to have this relationship as their basic – and common – theoretical/mathematical premise when estimating their “climate sensitivity”? If so, can you really not see that the giant ASSUMPTION being made here simply resides in that formula. You ASSUME a priori that the calculated “radiative forcing” from an increase in e.g. CO2_atm is the direct CAUSE behind some observed absolute rise in temperature. It doesn’t matter what method you use to get there. You HAVE TO go through that equation. And you HAVE TO assume a direct causal link between your observed temperature rise and the “radiative forcing” from a concurrent rise in CO2_atm. There is no escape. “Climate sensitivity” to +CO2_atm in the real Earth system is but a circular idea. Until it has actually been SHOWN empirically – in the real Earth system – that there’s an actually traceable and consistent causal link from +CO2_atm to +T. It hasn’t been shown, Richard. Not anywhere. Not even remotely so. It is ONLY ever assumed. But the data doesn’t support the assumption. The data refutes the assumption.
Kristian:
You say to me
There is nothing “peculiar” about my position.
I am “suggesting” nothing.
In this thread I have repeatedly referenced and linked to three papers which between them provide reports of ten different ways of actually measuring “climate sensitivity” in the real Earth system using different data sources, and they each result in a determination that climate sensitivity is ~0.4°C for a doubling of atmospheric CO2 concentration. It seems you have failed to read the papers I have referenced and linked.
Richard
No, Richard. You simply refuse to see my point. It doesn’t matter what method you use. Ultimately, you need to go through the ΔT/RF = λ equation to get to an actual “climate sensitivity” estimate. That means at some point in your analysis you will HAVE TO ASSUME that the RF is in fact directly responsible for an observed rise in T. You can’t.
This implies you think the sum of all of the forcing is what matters, how do you know they all stay the same and sum? Hint, they don’t.
Kristian:
You say to me:
Absolutely not!
I do “see your point” and I disagree with it.
However, you are metaphorically putting your fingers in your ears and shouting ‘Lah! Lah! Lah!’ to what I have said to you.
So, I again repeat what I have said to you.
It is obvious that we have a difference of opinion. All I can do is iterate my view for clarity.
I stand by my view that the 10 (n.b. TEN) different methods I cited do not use the same procedures so cannot be using the same set of assumptions and they are obtained from different source data, but they each provide a similar determination of climate sensitivity being ~0.4°C for a doubling of CO2 equivalent.
It is a stretch to suggest their similar determinations are a coincidence.
Richard
richardscourtney says, April 20, 2017 at 1:05 pm:
Richard,
No, it is obvious that you do not see my point. Because my “point” is not a matter of opinion. “Climate sensitivity” to +CO2_atm IS fundamentally ASSUMED. No one has ever “measured” it, Richard.
INVARIABLY what everyone’s doing is first to ASSUME a direct causal relationship in the real Earth system between some calculated value of the isolated rise in RF from an increase in CO2_atm and an actual observed rise in T, and THEN they “estimate” the magnitude of this assumed sensitivity from various observations. But the causal link between the observations themselves are ALWAYS simply assumed, Richard. Frankly, I don’t understand why you’re so stubborn on this issue. It is so obvious.
I have read through your sources, and ALL of them start out by ASSUMING the original causal link. Two quick examples follows.
Craig Idso’s “Natural Experiment 7”:
“The same result may also be obtained from the standard resolution of the paradox of the faint early sun (…) Most of the people who have studied the problem feel that the answer to this question resides primarily in the large greenhouse effect of Earth’s early atmosphere – which is believed to have contained much more CO2 than it does today (…) – with a secondary contribution coming from the near-global extent of the early ocean (…). Consequently, based on the standard assumption of a 25% reduction in solar luminosity 4.5 billion years ago, I calculated the strength of the greenhouse effect required to compensate for the effects of reduced solar luminosity at half-billion year intervals from 3.5 billion years ago (…) to the present; and I plotted the results as a function of atmospheric CO2 concentration derived from a widely accepted atmospheric CO2 history for that period of time (…).”
You see the problem right here. Exactly what I’m pointing out to you. Idso starts out by taking for granted that the standard resolution of the “faint early Sun paradox” (what most “of the people who have studied the problem feel” is the answer) is more CO2 in the atmosphere (“the large greenhouse effect of Earth’s early atmosphere”).
You can’t do this, Richard.
Lindzen & Choi (2011) (couldn’t find the 2009 paper, but this is a direct update):
http://www-eaps.mit.edu/faculty/lindzen/236-Lindzen-Choi-2011.pdf
“However, warming from a doubling of CO2 would only be about 1 C (based on simple calculations where the radiation altitude and the Planck temperature depend on wavelength in accordance with the attenuation coefficients of wellmixed CO2 molecules; a doubling of any concentration in ppmv produces the same warming because of the logarithmic dependence of CO2’s absorption on the amount of CO2) (IPCC, 2007).”
As you can see, the 1 degree from a doubling of atmospheric CO2 doesn’t have ANYTHING to do with the REAL Earth system. It is a purely calculated value from purely theoretical considerations, and/or controlled lab experiments. It is ENTIRELY dependent on the ALL ELSE BEING EQUAL prerequisite to be true. We know it’s not. We know it from empirical observations in the real Earth system.
This is a consistent pattern, Richard. They ALL make these initial assumptions on causal links between calculated RF and observed increases in T.
It is a pseudo-scientific endeavour.
Kristian:
This is a repost of a post that appeared in the wrong place. Hopefully this one is in the right place.
You need to escape from your American culture of ‘try, try and try again’ so you can accept reality. You are behaving like one of the rejected contestants who when told their singing is rejected doesn’t walk off the stage but starts to sing again.
I repeat, I do “see your point” and I disagree with it.
I have repeatedly told you I stand by my view that the 10 (n.b. TEN) different methods to measure climate sensitivity which I have cited and linked do not use the same procedures so cannot be using the same set of assumptions and they are obtained from different source data, but they each provide a similar determination of climate sensitivity being ~0.4°C for a doubling of CO2 equivalent.
It is a stretch to suggest their similar determinations are a coincidence.
Your response is to say to me
But that IS your opinion because people have measured it in the 10 different ways I have told you.
If you choose to ‘sing again’ I will ignore it.
Richard
richardscourtney says, April 22, 2017 at 8:40 am:
No, Richard. That is NOT my “response” to you. My response is to show you two examples of those “ten different ways of measuring climate sensitivity” that really aren’t and how they distinctly ASSUME the +RF=>+T causal relationship before they start “measuring” some hypothesized “climate sensitiity” to +CO2_atm.
You ignore this and rather just “try, try and try again” to repeat the same talking point of “ten different methods”, in order to avoid addressing my point. Either because you don’t understand it, or because you do understand it, but simply don’t want to admit that you’re obviously wrong about this.
No, it is NOT my “opinion”. Because it’s the TRUTH. It seems you haven’t even read about your “ten methods”, because if you had, you would’ve realised that I’m right. They ALL assume the original causal link before they start “measuring”.
Same for me. These days when challenged by alarmists on any given topic I generally first request evidence in support of the claim that there exists a large and +ve feedback to carbon dioxide climate sensitivity from water vapour amplification. Until that single factor is reliably quantified everything else is pure theology it would seem.
cephus0 April 17, 2017 at 12:24 pm
Even as a layman I get that point. The fact is there’s a HUGE hole in AGW theory that cannot explain how bit-part human CO2 can overwhelm the contribution from orders-of-magnitude more abundant water vapour. To side-step this otherwise fatal flaw they parachute positive feedbacks and amplification into the mix, yet there’s scant evidence of either at the levels required for AGW theory to be valid. This really should be the death knell for AGW theory, or am I missing something?
Since there are bands in which CO2 absorbs where H2O doesn’t, overpowering doesn’t come into play.
An increase in CO2 will cause a decrease in the transparency of the atmosphere.
MarkW: why does that matter? Most would accept that it is indeed possible to quantify the expected CO2 sensitivity in isolation – but it isn’t in isolation. As mentioned many times on this site, the atmosphere isn’t an Arrhenius experiment in a jar. What are the feedbacks, if any, what are their mechanisms and what are their signs and magnitudes? What is the justification for claiming a large positive feedback from water vapour? If this cannot be supported with solid evidence then surely that is the end of CAGW – isn’t it?
At night, water vapor negative feedback cancels out most if not all of any additional dat time warming. That is what is shown by these measurements.
https://micro6500blog.wordpress.com/2016/12/01/observational-evidence-for-a-nonlinear-night-time-cooling-mechanism/?preview=true
I would also ask them to do the calculation of human emitted CO2 as a proportion of the atmosphere. I once did, and the annual production rate is 3-4% of total CO2. As the JAXA satellite has also confirmed, non-industrialized regions, i.e. nature, emits far more CO2 than humans, it can be taken that natural CO2 emissions overwhelmingly dominate man’s.
The CAGW claim that man’s CO2 is the driver is pure arm-waving and ‘finger on the air’ guesswork.
cephus, I might also add that feedbacks have a temporal dimension, they take time yet ECS is treated as a scalar as if all the positive feedbacks can be added. The idea that there can be 4.4Watts extra surface emission for 1W forcing also violates energy conservation at the surface. Now its almost possible to get 1.6Watts per watt with the 0.6 coming from gravitational friction, bio energy and other non radiative energy sources, but 4.4 per watt… not in this universe
Tenn you are spot on with your comment.
Climate Sensitivity is the foundation on which all CAGW claims rest. If that metric is lower than what the alarmists claim then their hypothesis collapses in a heap.
Would really appreciate a paper on the current work being done on determining the value of climate sensitivity and what is the best empirical value to date.
Lawrie Waller:
You say
Please see my above comment that provides links to three papers that each measures (n.b. MEASURES) a climate sensitivity of ~0.4°C for a doubling of atmospheric CO2 concentration. These three papers use completely independent source data (i.e. surface measurements, ERBE satellite data, and balloon radiosonde data), and different methods conducted by completely independent analysts at different times.
Richard
Tenn, many people have noted the stability of the earth’s climate and how it is unlikely to be easily perturbed by the addition of a few ppm of CO2. Prokaryotic life probably evolved around the beginning of the Archaean eon about 4 billion years ago, and has been here ever since.
It isn’t a wild guess. it can be calculated or it can be deduced from empirical records. The issues is that the alarmists take it to be a constant, so the rate of warming is independent of actual temperature and actual greenhouse gas concentration. It is useful only within a very small range of changes in other factors affecting temperature.
great piece!
“The climate of the Holocene has been characterized by a roughly millennial cycle of warming and cooling (for those who don’t like the word “cycle,” pretend that I typed “quasi-periodic fluctuation”):”
I find “episodic” works well.
“Episodic” definitely works.
I’ve tried “episodic” too, but “cycle” keeps popping up like and evil weed.
The “greenhouse gas” nomenclature, including cycle, is stupendously stupid.
See Einstein, regarding stupid vs the universe.
Very nice article, Dave. I can’t find anything wrong with it. You are sticking to the evidence. Of course Northern hemisphere temperature reconstructions are not a strong argument either way, and different reconstructions have different supporters, as we know. But the burden of proof is clearly on those trying to demonstrate unusual climate. I sincerely don’t think we have clear evidence to compare which one of the previous and present warm periods was warmer. My opinion is that the distinction goes to the Roman WP on account of being so long. I believe our modern WP could get an honorable second place for the past 3000 years. So warmest in over a millennia could be true.
But reducing climate to temperatures is impoverishing. Climate is a lot more. I have looked long and hard through the scientific bibliography for clear evidence that something unusual is going on with the climate. A clear strong evidence (beyond the usual unsupported claims) on which most experts would agree. I think I found it on glacier extent. Nearly all glacier experts find that the current glacier retreat is unusual for several thousands of years, and essentially has undone all glacier progress for the Neoglacial period of the last 5000 years in most places of the planet. Perhaps that is the evidence of the climatic effect of CO2. It might not affect temperatures as much as the current hypothesis needs, but it seems to affect glaciers more than other indicators of the climate system.
In any case it is good and positive that the Neoglacial trend has been broken, even if only temporarily. Most good periods to humankind are associated to warm periods.
Javier,
This is very-well stated:
And it is a fact most people overlook.
Javier,
IMO there is abundant evidence that the hottest intervals of the Holocene were during its Climate Optimum, ie about five to eight thousand years ago. The next toastiest was the Minoan Warm Period, ~3 Ka, followed by the Roman WP, ~2 Ka, and Medieval WP, ~1 Ka. The Current WP has yet to equal peak balminess of the Medieval WP, let alone the even warmer intervals which preceded it.
The worrisome long-term trend is cooling.
Without a doubt, the Holocene Climatic Optimum was the hottest interval of the Holocene. This is very clear in ice and sediment cores and the Holocene Highstand is recognized globally; sea level was about 3 m higher than it is today.
It also appears that the Little Ice Age may have matched the 8.2 KYA Cooling Event for the coldest interval of the Holocene.
The intervening period, Neoglaciation, was marked by a general advance of glaciers.
Chimp,
Leaving aside the HCO for which ample evidence exists, your classification is hard to defend in the absence of decent global temperature reconstructions for those periods, right?
Are you going to defend it based on Greenland temperatures that show periods of temperature inversion compared to Northern European temperatures?
You cannot defend that the MWP was warmer than now based on anecdotal evidence, and most proxies will not extend to the present nor have enough resolution to give you a clear answer. Of course you are welcome to your opinions. I rather be prudent and say we don’t know.
David,
The 8.2 kyr event was complex, multifactorial, part global and part North Atlantic. One has to be careful before extrapolating it to global climate. I would say that without doubt the LIA was the coldest period in the entire Holocene.
A very nice dissection of the 8.2 kyr event is
Rohling, E. J., & Pälike, H. (2005). Centennial-scale climate cooling with a sudden cold event around 8,200 years ago. Nature, 434(7036), 975-979.
http://www.academia.edu/download/46240278/nature0342120160604-24868-1ho1vi1.pdf
As they say:
“The listed evidence for a multi-century climate deterioration, with an onset well before the meltwater flood of about 8.3kyr ago, indicates that it would be erroneous to attribute all anomalies in climate proxy records around 8 kyr BP to the 8.2-kyr-BP event, in an attempt to map the global impacts of a slowdown in NADW production. Proxies for changes in the meridional extent of major atmospheric circulation features (polar vortex, ITCZ) seem more likely to reflect the underlying deterioration of about 8.5–8.0 kyr ago. In addition, this broad anomaly seems especially evident in summer-biased proxies, and the sharp 8.2-kyr-BP event more evident in winter-biased proxies.”
The meltwater pulse at 8.3 kyr had a huge impact in Greenland cores and the North Atlantic region. The LIA was global in nature, even if it was also stronger in the North Atlantic region. Globally, glaciers point to the LIA as the lowest point so far since the start of the Holocene.
Javier April 17, 2017 at 11:43 am
Yes, I can defend the proposition that globally the HCO was warmer than the Minoan WP, which was warmer than the Roman WP, which was warmer than the Medieval WP, which was warmer than the Current WP so far.
Maybe you know of some proxy data which argues against this finding. All that I’ve ever seen supports it. You name it. Ice cores. Sea and lake sediments. Sea level. Stalagmites. Oceanic isotopes. Pollen. Insects. Precipitation proxies. Those spring to mind.
Possibly some local glaciers might beg to differ, but local and regional differences can mask their signal. Even today, some are advancing while others retreat.
Chimp,
That’s not how it works. The one that makes the claim has to provide the evidence.
And the problem is that for every proxy that shows a warmer MWP, there is another one that doesn’t. For example if you go to Greenland ice cores, this is one of the best available because it has been corrected for uplift, for ∂18O sea levels and calibrated to multiple borehole temperature records.
You see? To get significantly warmer you have to go 2000 years back. And the same problem occurs for other type of proxies. For one that shows a warmer MWP you get another one that doesn’t. That’s why when you analyze not your favorite reconstruction, but a bunch of them, the matter is everything but clear.
http://i.imgur.com/Vg59Mh7.png
But if you practice proxy selection, and reconstruction picking, you can obviously support any belief. Although any claim can be made and supported on part of the data, when most of the data is examined without bias, it is clear that it is unclear. We cannot tell with any degree of certainty if the MWP was warmer than now or not. My opinion from looking at the data that way is that probably we are slightly warmer now, but not by much, but we cannot be sure.
Javier,
Please cite every proxy which you think shows the Medieval WP cooler than now.
In the CET reconstruction, it isn’t even close. There has not yet been a single 50-year interval in the Current WP as warm as three, four or more of them in the MWP, even with the Met’s blatant book-cooking.
The fact is that there is not the least basis whatsoever for imagining that any warming in the past century, if any, can compare to that during previous centuries in prior warming cycles.
Javier,
I think that decreased cloudiness is a better explanation for alpine glacier retreat because north-facing ice fields and glaciers are relatively stable. That probably explains why not all glaciers are reported to be in retreat. They are sensitive to insolation! If it was ambient air temperature alone that was responsible for retreat, then one would expect all glaciers to be in retreat, regardless of their aspect. Additionally, the retreat would be predictable by the regional lapse rate. Retreat should stop when the elevation of the snout get to the level it which it is normally below freezing. However, the bottom line is that glaciers are complex dynamic systems where there are things more important than air temperature and can thus override increasing air temperatures. That is to say, if snow is accumulating rapidly enough in a large enough zone of accumulation, a valley glacier might still move forward even with increasing temperatures at the snout.
I don’t know about that, Clyde, but you never get all the glaciers in the planet going in the same direction since 10,000 years ago, so that is not a criterion. Glacier experts generally agree on the current retreat being one in a several millennia event. That makes this period pretty unique in glacier studies.
I agree with Clyde. As some one who has been snowed on during every month of the calendar year in the rocky mountain west I will attest to the fact that snow is possible any time clouds encounter elevated terrain where precipitation will arrive as snow or hail. Glaciers depend upon precipitation to grow, the lack there of will cause retreat.
Javier,
Those experts are dead wrong. The current average retreat, if it’s happening, is clearly not a once in several millennia event.
Glaciers all around the world show the same result as in Alaska, ie current retreat is uncovering remains of forests and other artifacts occurring at about millennial intervals, ie from c. 1000 years ago, ~2000 years ago, 3000 years ago and 5000 years ago. The Egyptian WP, c. 4 Ka, was perhaps less warm than the preceding HCO and the following Minoan WP, or about the same.
Chimp,
So you say, but they are the ones doing the field work on moraines and glacier remnants, Since I ignore your credentials in glacierology, I will go with their expert opinion, and the evidence they show in their publications.
Javier,
I’ve seen the stumps in Alaska and the Alps. I’ve seen the artifacts collected in Switzerland from the Medieval, Roman, Minoan WPs and the HCO. So I’m going with my eyes rather than experts whose funding is based upon the “climate change” bandwagon.
A pretty good discussion on the Alpine pass finds, from 12 years ago:
https://climateaudit.org/2005/11/18/archaeological-finds-in-retreating-swiss-glacier/
On waxing and waning of Alaskan glaciers to the rhythm of the natural millennial-scale and other cycles:
http://juneauempire.com/outdoors/2013-09-13/ancient-trees-emerge-frozen-forest-tomb
But, hey, go with the alleged consensus experts, if that floats your boat. But bear in mind that the consensus has existed to be shown false since 1543. That’s science!
As Feynman taught us.
Chimp,
Ah, consensus doesn’t mean wrong. This is not a consensus of people who have not studied the evidence and are trusting other’s findings. Your eyes don’t mean much on this. Precisely the uncovering of organic remains that are 3000-6000 years old and have been continuously frozen for that time is evidence of unusual glacier retreat.
Relevant bibliography
1. J. Oerlemans. Holocene glacier fluctuations: is the current rate of retreat exceptional? Annals of Glaciology, Volume 31, Number 1, January 2000, pp. 39-44(6)
http://www.ingentaconnect.com/content/igsoc/agl/2000/00000031/00000001/art00008
“Integrations for a 10 000 year period, driven by random forcing of a realistic strength, show that the current retreat cannot be explained from natural variability in glacier length and must be due to external forcing.
2. Johannes Koch, John J Clague and Gerald Osborn: Alpine glaciers and permanent ice and snow patches in western Canada approach their smallest sizes since the mid-Holocene, consistent with global trends. The Holocene 2014 24: 1639
http://kochj.brandonu.ca/ho_2014.pdf
“Glacier retreat in western Canada and other regions is exposing subfossil tree stumps, soils and plant detritus that, until recently, were beneath tens to hundreds of metres of ice. In addition, human artefacts and caribou dung are emerging from permanent snow patches many thousands of years after they were entombed. Dating of these materials indicates that many of these glaciers and snow patches are smaller today than at any time in the past several thousand years.”
“The global scope and magnitude of glacier retreat likely exceed the natural variability of the climate system and cannot be explained by natural forcing alone. This departure is best explained by the ascendancy of another forcing factor – the increase in carbon dioxide and other greenhouse gases in the atmosphere.”
3. Goehring, B. M. et al. 2012. Holocene dynamics of the Rhone Glacier, Switzerland, deduced from ice flow models and cosmogenic nuclides. Earth and Planetary Science Letters 351–352, 27–35.
http://academiccommons.columbia.edu/download/fedora_content/download/ac:152773/CONTENT/j.epsl.2012.07.027.pdf
“After 5 ka, the Rhone Glacier was larger than today, but smaller than its LIA maximum extent. The present extent of the Rhone Glacier therefore likely represents its smallest since the middle Holocene and potential climate warming will lead to further rapid retreat of the Rhone Glacier.”
4. B. K. Reichert, L. Bengtsson and J. Oerlemans: Recent Glacier Retreat Exceeds Internal Variability. Journal of Climate 15 (2002) 3069.
http://www.meteo.psu.edu/holocene/public_html/Mann/courses/EVAT795/Reichertal-JClim02.pdf
“Preindustrial fluctuations of the glaciers as far as observed or reconstructed, including their advance during the Little Ice Age, can be explained by internal variability in the climate system as represented by a GCM. However, fluctuations comparable to the present-day glacier retreat exceed any variation simulated by the GCM control experiments and must be caused by external forcing, with anthropogenic forcing being a likely candidate.”
5. O. Solomina, W. Haeberli, C. Kull, G. Wiles Historical and Holocene glacier–climate variations: General concepts and overview. Global and Planetary Change 60 (2008) 1–9
“The finding of the Oetztal ice man in the uppermost part of a small glacier in the Austrian Alps clearly illustrates that Alpine glacier volumes (not lengths!) have become smaller now than during at least the past about 5000 years.”
6. Bakke, J., Lie, Ø., Dahl, S.O., Nesje, A., Bjune, A.E., 2008. Strength and spatial patterns of the Holocene wintertime westerlies in the NE Atlantic region. Global and Planetary Change 60, 28–41
http://folk.uio.no/joh/GEO4011/Bakke_07GPC.pdf
“The retreat of maritime glaciers along western Scandinavia over the last century is unprecedented in the entire Neoglacial period spanning the last 5200 yrs.”
This is evidence that cannot be faked. They are not going to go downhill with the stones to move the position of a moraine. They know what they talk about and the names there include many of the best glacierologists in the world. They are honest people that defend the influence of solar forcing on glacier extent, because that is what they see, even if it goes against dogma. There is no reason to doubt what they see, and I am sorry if it goes against your beliefs. I don’t have any. I am agnostic about the causes of climate change. Whatever fits the evidence.
Javier,
They are not honest. The Thompsons are a fine example. They didn’t archive their data because, like Jones, they didn’t want to have to defend their conclusions.
“Climate science” is thoroughly corrupt. That alone is reason enough to scoff at your alleged “experts”. That the facts contradict their conclusions only drive nails in their coffins.
But, as I said, please feel free to be suckered by these con artists. I prefer to do my own survey of unbiased evidence from glaciers all around the world, which show that we are still well within normal waxing and waning, on balance.
There is zero evidence in support of the hypothesis of unusual warming or net glacial retreat now.
Better to look for papers by scientists not on the CAGW gravy train, such as those finding alpine glaciers today the same size or larger than during prior warm intervals:
http://notrickszone.com/2014/10/30/more-glacier-studies-confirm-roman-and-medieval-warm-periods-were-just-as-warm-as-today/#sthash.mp0NRVtb.dpbs
You know they’re honest because they’re willing to buck the Borg.
As you must know, glaciers are so variable that anyone could find a selection of them to show today warmer or colder, wetter or drier, windier or calmer than at some point in the past.
But my conclusion is that the preponderance of evidence shows net glacial retreat greater than now globally c. 1000, 2000, 3000 and 5000 years ago. Not to mention during the Eemian.
Glaciers today offer no support whatsoever for the hypothesis that manmade GHGs have altered earth’s climate measurably globally. Locally, yes. But those localities don’t show up in the worldwide picture.
Your bias is so humongous that you think scientific honesty depends on scientists agreeing with your beliefs. Bias doesn’t get any worse than that. But that is your problem. There is no point in discussing science with somebody that has made out of a bias a guiding principle.
Javier,
No, I think it exists based upon what so-called scientists are paid to publish.
Anyone can do a global survey of glaciers and conclude that they are on balance advancing, retreating or staying the same. Honesty comes from fair sampling, which is not evident in your linked papers.
I’m familiar with glaciers on North and South America, Europe and New Zealand, thus sampling the eastern and western NH and SH. They all show the same pattern. As do proxy data from the same areas.
Javier,
It’s not because of my bias toward valid science, but because anyone bucking the consensus is more likely to be practicing science than those cherry picking to try to support it and profit thereby. OTOH, those managing to publish contrary to orthodoxy risk much.
Javier on April 17, 2017 at 10:59 am
But reducing climate to temperatures is impoverishing. Climate is a lot more. I have looked long and hard through the scientific bibliography for clear evidence that something unusual is going on with the climate.
…
Nearly all glacier experts find that the current glacier retreat is unusual for several thousands of years, and essentially has undone all glacier progress for the Neoglacial period of the last 5000 years in most places of the planet.
A very good comment. But I’m not quite sure everybody here reads and interprets it exactly as intended.
Perhaps that is the evidence of the climatic effect of CO2. It might not affect temperatures as much as the current hypothesis needs…
Javier, you certainly know about Joseph W. Chamberlain’s work he did end of the 1970’s, especially
hdl.handle.net/2060/19790010343
concerning the effect of even tiny amounts of trace gasses in the atmosphere.
Do you mean something in that direction?
Not necessarily. The enhanced effect of CO2 on glaciers could be due to something so simple as its absorption band being less saturated over glaciers due to the cold air being drier. A simple physical effect could explain it. The same effect is used to explain that CO2 is acting mainly over high latitudes, during the winter, and at night, that is when most of the warming is taking place.
Javier,
You said, “The enhanced effect of CO2 on glaciers could be due to something so simple as its absorption band being less saturated over glaciers due to the cold air being drier.”
OK, I understand that you are offering a possible cause, and not THE cause for glacier retreat. However, I’d still like to remark that your example MIGHT be applicable to a high-altitude ice field, or a bunch of alpine glaciers. However, in the case of larger systems that coalesce into valley glaciers, they exhibit wasting at the snout until such time as the zone of accumulation fails to provide additional ice and the whole system becomes stagnant and essentially melts in place. Glaciers are such complex systems that they really make poor ‘coal mine canaries,’ particularly with respect to the single parameter of temperature.
I think that what needs to be done is compare the behavior of glaciers on the north slope of E-W trending mountain ranges with that of the glaciers on the south slope. That should give an indication of the importance of insolation versus ambient global temperatures or CO2.
Javier on April 18, 2017 at 2:12 am
I understand your idea, but I have some difficulty to accept temporally and spatially effects of this CO2 guy. Until now, for my little (!!) understanding, it works only over longer time intervals and above greater surfaces, if not even only globally.
The remaining problem is that if CO2 is responsible for glacier retreat as you propose, should it then not a fortiori be responsible for Arctic sea ice decline?
But then: why does this not show similar above the Antarctic, where cold dry air is massively present? I know, this region experiences actually very unexpected sea ice decline
http://fs5.directupload.net/images/170418/yxxv8j3z.png
(source: https://s3-us-west-1.amazonaws.com/www.moyhu.org/blog/polview.html)
but to invoke CO2 as its origin is imho somewhat strange, as this decline is very recent in comparison with Arctic and glacier regions.
Surface warming after all can only occur when Earth’s LWIR reaction to SW insolation cannot sufficiently escape to outer space.
But if (!!) I have well understood the process, this in turn can only occur if the absorption / reemission chains within the atmosphere elevate the IR escape altitude up to levels where it is far less efficient than when IR escapes directly trough the atmospheric window. The higher the altitude, the colder the reemission level, the less efficient it is.
And here is my problem with your proposal: why should CO2 build such thin, high columns exactly above the glaciers?
Actually, I don’t think this is an issue, it’s radiating to 3K , doesn’t matter that it’s radiating at -70F, its still 380F warmer. The flux is just higher, same W/m^2. sure it’s not 70F, but the surface only see 80 to 110F colder sky temps anyways. If I remember I’ll do the calculations in the morning.
Well, while I don’t have my pc handy, I can share my excel file if anyone wants it.
https://micro6500blog.files.wordpress.com/2015/06/radiationtransfer.xlsx
micro6500 on April 18, 2017 at 5:28 pm
Actually, I don’t think this is an issue…
… and you are plain right. Google Desktop Search is an amazing tool, but it will upwell you all the deprecated nonsense you stored even 5 years ago.
What I actually read and try to understand is the very slight increase of the atmospheric IR opacity due to an increase of CO2 and consecutively of H2O in the lower atmosphere.
If IR is emitted to outer space directly from the surface, the heat exchange will be more effective than if IR is partly absorbed by H2O or CO2, as the reemission by these molecules does not solely take place up to space, but randomly in all directions, down to surface included (up and downwelling then would form a tiny part of the reemissions’ total).
Maybe you have a better idea…
That’s an unfounded supposition. In fact what is happening is that as IR feedback from Co2 goes up, there’s less from water vapor.
Water vapor emissions at night are dew point temperature regulated, and as air temps near dew point the surface radiation drops to almost nothing, and if continues to cools when the days get longer, it nearly stops. All co2 does is slow this a little, but it is still ultimately limited by water vapor.
https://www.boundless.com/physics/textbooks/boundless-physics-textbook/thermodynamics-14/the-second-law-of-thermodynamics-118/carnot-cycles-413-5630/images/pv-diagram-for-a-carnot-cycle-b0107d64-0aa9-4b8f-b8be-2a39dc64f9cf/
What work does people think the lapse rate is doing?
Javier: You omitted the largest climate change catastrophe of the Holocene: desertification of the Sahara.
The end of the African Humid period is related to the southward displacement of the Intertropical Convergence Zone and associated monsoons due to the shift in summer insolation from the northern to the southern hemisphere with the progress of the 23,000 years precession cycle.
If you are interested I am writing about it around next week at Judith Curry’s blog, Climate Etc.
Javier: I’m interested in this phenomena because it does represent the type of catastrophic climate change that credible AOGCMs should be able to predict. Why should I trust AOGCMs to predict lower rainfall in the Western US or the Amazon being converted to savanna if they can’t hindcast desertification of the Sahara with typical Holocene GHGs and changing solar precession. I understand the concept that a shift in the ITCZ follows precession, but I’m not aware that it was a global phenomena. Rumor has it that a green Sahara in climate models remains green and a brown Sahara remains brown, but I haven’t mastered this subject.
(Hopefully your article will show more wisdom than your comments below on ISIS.)
Excellent, thank you very much for this.
Excellent synthetic post David. You know of course that the reward for a job well done is more work… right? Could you or someone else add the driving mechanisms to this? My – limited – understanding of the mechanisms proposed for CAGW were:
— the mid-topical/mid-troposphere heat bands driving warmth North
— the latent heat in the oceans melting ice caps and stopping the oceanic convective mixing currents
— the feedback from the first driver causing more water vapor to accumulate in driving an ever more reflective heat-trap in the atmosphere
— that the three above would somehow cause the world to dry and increase albedo (although how that worked with the increased cloud cover I never understood).
It would seem that CAGW not only violates the null hypothesis as you have so magnificently laid out in the article above, but that since the ‘iris effect’ has been seen, the mid-tropic/mid-tropo heat has a feedback control and doesn’t exist. It seems like that would mean that not only is the postulated CAGW positive feedback cycle undercut by the null hypothesis, but it also lacks a viable physical mechanism at this point and lives only in table-driven (and therefore self-reinforcing) models.
But I don’t have the skills to nail that down. Is that exo-atmospheric level view correct? If so, wouldn’t coupling a narrative of the same powerful grounding as your article pretty much kill any rational support for CAGW?
In any event, thanks for the article above… I will spend quite a bit of time parsing and pondering it.
In the oil patch, we calculate a probability of geological success (Pg) when preparing probability distributions. A geological success gets you “on the curve” (P99). AGW barely gets “on the curve.” CAGW resides at the opposite end of the curve (P10 to P01).
I like it. I publish a short letter to Editor each month and I just appreciate good information. I see two problems in the neighborhood. Kids talking about escaping Earth to live on Mars. Seriously, too.
The second problem is the hypothesis of Man-Made Global Warming is so screwed up in peoples head that they forget, all global warming is solar. Without our Sun, there is no base to warm up our Earth. Sunspots, act more like a thermostat for our solar system, the difference in our Space and Time as Sir James Jeans puts it, mini ice age or another warm day here in Florida. Thus, the man-made warming hypothesis is the production of green-house gases, that retain heat as stated above. How do we explain water vapor and control it.
By the way, there have been over 240 set fires here in Florida since the new year and routinely smell the smoke.. What ever the alarmists hope to gain in CO2 conservation just went up in smoke.
Claims that AGW or CAGW have earned an exemption from the Null Hypothesis principle are patently ridiculous.
You can prove the the claimed relation between the variation in CO2 and temperature is null all you want, the Science and the Main Stream media have moved on. If you read the news, Methane is 86 times more potent than CO2. California has already written regulations based on that fact. There is a methane clathrate bomb ticking and it’s about to go off. And if you prove that’s null, they will find something else!
There is no such ticking bomb.
When methane clathrate bombs have gone off in the past, climate was far warmer than it could possibly ever get under even two doublings of our currently extremely low CO2 levels.
What has caused such rare events in the past, a hot house climate was associated with lowered sea levels, such that clathrates formed under higher pressure were released under lower.
Worrying about methane releases is a waste or time and resources.
Yep… https://wattsupwiththat.com/2013/12/13/defusing-the-arctic-methane-time-bomb/
Yes but methane is 86 times more powerful than CO2. Scientific American tells us so:
https://www.scientificamerican.com/article/how-bad-of-a-greenhouse-gas-is-methane/
Chimp April 17, 2017 at 11:18 am
There is no such ticking bomb.
https://www.google.com/#q=methane+ticking+time+bomb
About 29,000 results (0.49 seconds)
Methane: The ticking time bomb – Before the Flood
Methane Burps: Ticking Time Bomb – Resilience
Methane: The ticking time bomb | The Hartmann Report
Methane, A Ticking Time Bomb – Curiosity
Evidence Continues to Mount for Ticking ‘Methane Time Bomb …
Methane gas: A ticking time bomb – About us | Allianz
Seven facts you need to know about the Arctic methane timebomb …
The best geological evidence for the Arctic methane time bomb being a dud can be found in the stratigraphy beneath Lake El’gygytgyn in northeastern Russia. The lake and its mini-basin occupy a 3.58 million year old meteor crater. Its sediments are ideally suited for a continuous high-resolution climate reconstruction from the Holocene all the way back to the mid-Pliocene. Unlike most other Arctic lakes, Lake El’gygytgyn, has never been buried by glacial stage continental ice sheets. Melles et al., 2012 utilized sediment cores from Lake El’gygytgyn to build a 2.8 million year climate reconstruction of northeastern Russia.
The data from Melles et al., 2012 are available from NOAA’s paleoclimatology library. And it is clearly obvious that Arctic summers were much warmer than either the Eemian/Sangamonian (MIS-5e) and the Holocene (MIS-1)…
MIS-11 peaked a full 5°C warmer than the Holocene Climatic Optimum, which was 1-2°C warmer than the present.
Referring back to Vaks et al., 2013, we can see that there is no evidence of widespread permafrost melting above 60°N since the beginning of MIS-11…
Since we know that the Arctic was about 5°C warmer during the Eemian/Sangamonian (MIS-5e) than it currently is and that there is no evidence of widespread permafrost melt above 60°N, it’s a pretty good bet that the MIS-11 Arctic was 6-10°C warmer than the Holocene Climatic Optimum.
The lack of evidence of permafrost melt during MIS-5 tends to indicate that MIS-11 may have been more than 5°C warmer. So, the notion that we are on the verge of a permafrost meltdown is patently absurd.
https://wattsupwiththat.com/2013/12/13/defusing-the-arctic-methane-time-bomb/
You are sadly correct. Even if there was significant multi-decadal cooling, that would only change the name of the eternal enemy as in 1984, and the fight against man-made climate change would simply march on. They already perfected the method in the nutritional wars. It doesn’t matter what is the enemy “de jour”. New evidence will show that we have to persevere against new enemies. Ten years ago it was Al-Qaeda, five years ago the Taliban, and now it is ISIS or DAESH. Surprisingly they all live in the same caves at the same place that need more bombing. Orwell, how damn prescient you were.
The coolest thing about Jihadis hiding in caves…
I wonder if they could come up with a version of the MOAB with a tougher casing. With the idea that it would penetrate the ground before detonating, in order to better transmit all of the explosive energy into the ground. All the better to collapse underground structures.
Mark,
No. The whole idea behind the MOAB is that it’s a fuel air explosive (FAE) bomb. It packs more power per unit weight because its explosive agent doesn’t need an oxidizer. Hence, its energy derives from access to O2 in the air. Its rapid detonation also consumes oxygen, which is one of the ways in which it kills enemies hiding in caves or tunnels. MOAB, like all FAEs, needs a thin aluminum jacket to work, allowing its explosive agent to disperse before ignition.
The US does however have the MOP, an even bigger bomb designed to penetrate before exploding. But it relies on a conventional explosive with an oxidizer. It does however have a very thick jacket.
https://en.wikipedia.org/wiki/Massive_Ordnance_Penetrator
Unlike MOAB, it is delivered by a bomber rather than a cargo plane.

Between Specter gunships and MOAB’s, C-130’s have taken out a lot of bad guys over the past 15 years.
David,
Yup. Now the BC-130 can be added to the AC-130!
Javier April 17, 2017 at 11:31 am
Except that isn’t how it happened.
The Taliban arose at about the same time as Qaeda, in the early ’90s. They made common cause, which is why bin Laden returned to Afghanistan after being booted from Saudi Arabia and the Sudan.
ISIS started as a Qaeda subsidiary, “al Qaeda in Mesopotamia”, but splintered away from its parent organization to set itself up first as the Islamic State in Syria (or the Levant), then just IS, globally.
I heard a retired Air Force general say yesterday that the American B-2 Stealth Bomber can carry several MOAB’s at a time.
Trump can hit North Korea’s “Artillery Line” with multiple MOAB’s as he launches his strikes against North Korea’s nuclear and missile test sites.
North Korea supposedly has about 15,000 artillery pieces sitting within range of Seoul and could give Seoul a terrific pounding if uninterrupted, but the MOAB’s would put an immediate halt to anything within its blast range, so the North Korean’s might not have much time to wreak havoc with their close-in artillery.
China better step up and stop that little tinhorn North Korean dictator or they are liable to have a tremendous mess on their hands. They stop him or Trump is going to have to do it.
It’s too late in the game for the U.S. to kick this particular can down the road any farther. Trump doesn’t have the option to punt because North Korea is going to get these dangerous weapons on Trump’s watch.
Yeah, you appease and appease and appease and then comes the time when you have to take action because your previous appeasement has not made things better, it has made things worse. That’s where we are today.
Off topic but interesting… here’s another tidbit. The other point to ponder about the delivery of unpowered airborne ordnance is the ‘lob toss’. Many NATO aircraft, properly equipped and with a trained pilot can cling to altitude invert relative to the horizon then release their ordnance which will continue on a ballistic arc from the point of release.
That means that the delivery vehicle can stand off from the intended point of impact. Obviously if the weapon has some guidance then the ballistic arc is not merely ballistic but guided, with the ballistics just giving it range.
North Korea also has a veritable rabbit warren of tunnels. 50 years ago they wee secure from air power and were seen as a major benefit to NK planning. With the advent and testing of the thermobaric ordance, those tunnels are a nice place to bury permanently the extra gear and any unfortunate DPRK troops caught in the expanding blast wave(s). the value of the thermobaric material is that it is not a point source for the target square wave… it expands along the confines of the enclosure delivering a new source of the shock at the forefront of the material. It has shown itself to be amazingly effective at rendering harmless the occupants (both personnel and equipment) inside the enclosure.
The really fin part that the DPRK should think about is that there are many, many ways to deliver it and that their tunnels – visible to several types of detection – are very vulnerable to counter-mining. But if it worked in the Great Patriotic war, then it has to still work now… right?
Since ISIS exists due to the US invasion of Iraq that was started based on propaganda about nonexistent weapons of mass destruction, I’d say it is all working nicely not to have a safer world, but to have a permanent war to an ever changing global enemy, then Al-Qaeda, now ISIS/Daesh. Innocent civilians all over the world are paying the price.
According to Einstein “The definition of insanity is doing the same thing over and over and expecting different results.” Apparently lots of people think that more bombs/bigger bombs are going to solve the problem that started with bombs.
Those 15K artillery pieces are scattered along the entire NK/SK border and are all dug in. It’s going to take a lot more than 2 MOABs to take them all out.
Javier, ISIS existed as a branch of Al Queda long before the Iraqi invasion.
ISIS was contained until Obama decided to pull out, so it was your boy Obama who is responsible for the rise of ISIS.
Weapons of Mass Destruction were just 1 of 23 justifications for resuming the Gulf War.
WMDs were found.
MarkW,
According to Iraqis, Syrians and analysts who study the group, almost all of ISIL’s leaders—including the members of its military and security committees and the majority of its emirs and princes—are former Iraqi military and intelligence officers, specifically former members of Saddam Hussein’s Ba’ath government who lost their jobs and pensions in the de-Ba’athification process after that regime was overthrown.[140][141][142] The former Chief Strategist in the Office of the Coordinator for Counterterrorism of the US State Department, David Kilcullen, has said that “There undeniably would be no Isis if we had not invaded Iraq.”
So yes, after supporting the Talibans to fight the Soviets, the US has boosted ISIS with the invasion of Iraq. Good job on increasing Yihadism in the world. And Obama is not mine as he has never been the president of my country. Never voted for him, never thought greatly of him. But frankly, it is not as if the presidents of the US are great world leaders as of late, are they?
TA,
B-2 can just barely carry two MOABs. Nork artillery is protected by tunnels with blast doors and ventilation which might survive the O2-consuming FAE explosion. But once they started to roll out their guns, yes we could hit them. Many are out of range of Seoul, but 15,000 implies 2500 six-tube batteries. That is a lot of target aimpoints.
However, Seoul is covered by counter-battery radars, so that return fire could be on its way while the Nork arty rounds are still in the air. Many would get only one volley.
The Nork leadership would be targeted in the first wave of allied attacks, along with command, control and communication centers. Hence it would be up to local commanders surviving along the DMZ to decide whether they should risk attempting bombardment and invasion.
I think they missed a great opportunity over the weekend, kinetic rounds dropped on his viewing stand, Job Done!
Javier,
Here is what happened.
The US didn’t support the Taliban during the Soviet War. It didn’t exist yet. Some Pashtun muj leaders did later become associated with the Taliban, but the fact is that we supported the Taliban’s opponents in postwar Afghanistan. The Taliban were created by Pakistan and Saudi Arabia after the Soviet defeat, as part of the neo-Great Game between Iran and India on one side and Pakistan and China on the other.
ISIS, as noted, is an offshoot of al Qaeda. AQ started in Saudi Arabia in opposition to the Saud dynasty, ie bin Laden was biting the hand that had so well fed his family. Bin Laden opposed the Saudi’s acceptance of US aid in defeating Saddam, who sought to capture the oil-rich Eastern Province of their kingdom, as he had overrun Kuwait. Bin Laden had delusions of grandeur and illusions of military competence, after his experience in Afghanistan.
After the US and its allies liberated Iraq and killed off the leadership of AQ in Mesopotamia, ISIS took its place, with some of its leaders unwisely released from US POW camps in 2009. Then Obama ordered us precipitously to pull out of Iraq (prematurely!), without obtaining a status of forces agreement. Many wiser heads at the time predicted exactly what would happen as a result, and did occur.
Without the moderating influence of a US presence, a Shia-dominated, Iranian puppet regime in Baghdad oppressed the Sunni Arab minority, creating an opening for jihadis to return, regroup and reorganize. Had we kept even a single Brigade Combat Team in Iraq, IS would have had to stay in Syria, where after 2011 it was enlarged by Assad and Putin in order to counter Turkish-backed secular and moderate Sunni rebels against the mass murderous Alawite regime. Assad released radicalized political prisoners and Putin let thousands of Russian Muslim fighters travel to Syria.
Alawites are 11% of Syria’s population, with a few percent more in other Shia groups. The vast majority are Sunni Arabs, Kurds and Turkmen, with some Druze. So of course the Assad regime has had to murder tens of thousands in every prior decade and hundreds of thousands now.
Given the weakness of the Iraqi army without allied support, ISIS was able rapidly to capture Fallujah, Ramadi and Mosul. As noted, this wouldn’t have been possible with even a modest US presence. Obama had to know this, which makes him look like an Iranian stooge.
Now Assad is kept in power only by massive foreign assistance. There is no Syrian national army any more. His fighters are mostly Iranian, Lebanese Hezbollah and Iraqi Shia militia, backed by Russian air, ground combat and service support troops.
If you want to blame outsiders for the disaster in Syria and the subjugation of parts of Iraq, go ahead and castigate Obama for stupidity or worse, but don’t forget Russia, Iran and Turkey. And maybe Britain and France for drawing such idiotic boundaries after WWI. You can blame Bush, too, for not keeping the Iraqi army intact in 2003, if you want.
But it’s not as if the West created ISIS on purpose, as conspiracy theorists charge. Don’t assume nefarious plots when simple incompetence and mistakes suffice. The West didn’t need ISIS as a wedge into the Tehran-Baghdad-Damascus Shia axis. We had that after the Surge turned local Iraqi Sunnis against the jihadis. But Obama cut and ran.
micro6500 April 18, 2017 at 10:56 am
After the debut of US smart weapons in Vietnam, the Norks quit holding their Party congresses. Under Obama, they started them up again, so sure were they that he wouldn’t attack them, despite such an inviting target for laser-guided, 2000# bombs.
Good points, Jim Hodgen. Yes, caves are no longer a good place to hide.
Well, if we could (or have) developed the “Hammer of Thor”, there’d be no need for big (including nuclear) bombs:
https://en.wikipedia.org/wiki/Kinetic_bombardment
MarkW is correct about the origins of ISIS, and you are incorrect, Javier.
Iraq was in good shape after the Iraq war. Bush left Obama a pacified country in Iraq. Obama and Biden bragged about how well Iraq was doing “after the war” in 2011. Then, Obama pulled all U.S. combat troops out of Iraq in early 2012, and ISIS saw its chance to reenter Iraq. The first carbomb in Baghdad since the end of the war in 2008, was detonated two weeks after Obama pulled U.S. troops out.
ISIS rose, and Obama sat back and fiddled while Iraq and the Middle East burned, and Western Europe was overwhelmed with refugess from the fighting in Iraq and Syria. Then Obama destabilizes Libya and adds to the trajedy. The worst president Evah!
“B-2 can just barely carry two MOABs. Nork artillery is protected by tunnels with blast doors and ventilation which might survive the O2-consuming FAE explosion.”
Good comments, Chimp.
If the people in the caves have access to outside air, then they are subject to the overpressure a big bomb creates. B-52’s would carpet bomb North Vietnamese tunnel complexes with 500 lb. bombs, and they would go into the tunnels afterwards, deep tunnels, and find dead bodies with no marks on them. If you are not sealed away from the outside atmosphere, you will not survive such an attack. If the air can get to you, then the overpressure can get to you.
“I think they missed a great opportunity over the weekend, kinetic rounds dropped on his viewing stand, Job Done!”
I was watching that parade and thinking exactly the same thing. One MOAB would get them all ! It sure would make a mess of that parade ground.
“After the US and its allies liberated Iraq and killed off the leadership of AQ in Mesopotamia, ISIS took its place, with some of its leaders unwisely released from US POW camps in 2009. Then Obama ordered us precipitously to pull out of Iraq (prematurely!), without obtaining a status of forces agreement. Many wiser heads at the time predicted exactly what would happen as a result, and did occur.”
Yeah. Read George W. Bush’s 2007 State of the Union speech where he lays out exactly what would happen if the U.S. pulled its troops out of Iraq too early. He perfectly described just exactly what did happen in Iraq after Obama bugged out in 2012.
Btw, by the end of the Iraq war in 2008, Bush had reduced the Al Qaeda in Iraq/ISIS forces to less than 100 fighters, including al Baghdadi, and they all ran away to hide in Syria until 2012.
TA April 18, 2017 at 5:22 pm
No need to carpet bomb North Korea. Take out the leadership and nuclear infrastructure, including subs, command, control and communications nodes and, if surviving military chain of command rolls out the DMZ guns on standing orders, then cluster munitions on 2500 aimpoints, one per battery, solves that problem. Neither carpet bombing with dumb bombs nor 2500 MOABs required. BTW, the number of GBU-43/Bs reported built is 15.
Steve point beyond mentioning methane is that the media is continually trumpeting some scary thing and attributing it to global warming\climate change. Beat down the claim with reason and facts, and another pops up. It truly is a game of Climate Whack-A-Mole. It doesn’t mean you give up, but you have to be ready.
https://rclutz.wordpress.com/2016/07/28/climate-whack-a-mole/
Most media people are dumb but wish to appear smrt, so they align themselves with the noisy sophists (you know – the ones who are more likely to attack them if they don’t go along). Plus, the climatastrophe angle is just too irresistible to journalists – it makes them feel important and virtuously caring. I mean, just look at these morons on CNN congratulating each other for “being first to ‘break’ a story”. What – they are to be admired because they repeat what someone else told them? That’s an accomplishment?
Yes, and this comment from Adler applies to such journalists:
“Any teacher will tell you it is much easier to teach a student who is ignorant than one who is in error, because the student who is in error on a given point thinks that he knows whereas in fact he does not know. . .It is almost necessary to take the student who is in error and first correct the error before you can teach him. . .The path from ignorance to knowledge is shorter than the path from error to knowledge.”
Mortimer Adler
https://rclutz.wordpress.com/2017/01/12/yellow-climate-journalism/
@Ron,
My high school football coach put it this way: “There’s a difference between dumb and stupid. Dumb doesn’t know any better. Stupid knows better, but continues to make the same mistake.”
As Ron White says…
The places with methane clathrates are in the ocean were it is deep and cold.
The oceans would need to warm by 5 to 10C before it warmed enough to impact methane clathrates.
1) Even if the surface were to warm that much, it would take hundreds to thousands of years for the heat to get all the way to the bottom of the ocean.
2) If the world warmed that much, the oceans would get deeper, which would increase the pressure meaning the oceans would have to warm even more to release the methane.
3) Even if the oceans did warm up enough to release the methane in the clathrates, the release would be so slow and the journey to the surface so long that all of the methane would be consumed by biological activity long before it could reach the surface.
3a) The recent oil spill deep in the Gulf of Mexico never made it to the surface, it was all consumed before it could reach the surface, and that spill was 5 or six magnitudes greater than any possible release from clathrates.
“they will find something else!”
And in the process undermine the rule of law.
A few years ago, the premier of British Columbia (Glen Clark – New Democratic Party ) said that (paraphrasing) since he was in power he could do whatever he wanted. The following election, the once ruling party held only 2 (two) seats grand total.
David,
Both plate tectonics and evolution are scientific facts as well as bodies of theory to explain those facts, ie observations.
And both are indeed subject to experimentation. In the case of plate tectonics, the observations are the experiments. The theory (and fact) of tectonics predicts that continents and oceanic plates can be observed moving, and that processes such as subduction will be observed (and inferred from observations). Thus the hypothesis of tectonic plate movement is confirmed. It is always confirmed and never shown false.
In the case of evolution, both lab and field experiments testing its predictions can be made, some of which are, as with tectonics, themselves observations. Again, the predictions are confirmed and not shown false. Predictions made upon the basis of hypotheses from religion rather than science have repeatedly been falsified.
Genetics are directly observable and can be empirically tested. The evolution of the modern diversity of species from earlier species relies on the integration of genetics with correlative evidence from the fossil record. This facet of the theory cannot be empirically tested. It can only be tested through observations.
Yes, the observations are the experiment in plate tectonics and much of geology. That was one of my main points. I may not have made it clearly enough.
Evolution and plate tectonics are “concise, coherent, systematic, predictive, and broadly applicable” explanations of the observations. They are robust scientific theories which are based on combinations of empirical and correlative evidence.
David,
The evolution of new species from old is observed frequently both in the lab and in the wild. New species and genera have been created in the lab. Observations of speciation events in the wild have also been recreated in the lab. Thus speciation is a scientific fact, ie a repeated observation.
Much, probably most, speciation occurs in a single generation, so is readily observable. For organisms with rapid reproductive cycles, even gradual evolution is also directly observable.
For the evolution of higher classifications, ie new families, orders, classes, phyla and one domain (Eukaryota), science does rely on inferences from genetics, fossils and every other source of evidence. But there is no alternative scientific conclusion possible from these overwhelming mountains of evidence except the evolution of these new categories from their ancestors.
When we observe a mosquito evolving into something other than a mosquito, we will have observed the true evolution of a new species.
Most, if not all, of the reported observations of speciation at the multi-cellular level depend on the weakest possible definition of species.
I agree that there is no alternative working hypothesis. However, the lack of an alternative isn’t evidence to support a theory.
One of the things that drives me crazy about the C vs E debates is the misconception of the word “theory.” One side says evolution is *just* a theory and the other insists that it is a fact. There is no hierarchy here. Facts aren’t superior to scientific theories. Theories don’t get promoted to facts; although some are elevated to the status of “laws.” The power of a theory is in its ability to predict as yet unobserved facts. In this sense, scientific theories are much like the “unreasonable effectiveness of mathematics.”
Evolution and plate tectonics are very robust, very powerful scientific theories.
From Wikipedia:
https://en.wikipedia.org/wiki/Speciation
Based on this definition of “species,” Rosie O’Donnell and I are of different species.
David,
In biology, evolution refers both to a fact and to a theory. There is no elevation involved. It is a fact explained by a body of theory. You’re right of course that saying evolution is “just a theory” is to misunderstand what a theory is. But there is no scientific debate between the cult of creationism and the physical reality of evolution.
Before the theory of evolution in the 19th century, the fact of evolution was called “development”. This fact was evident then from the fossil record, comparative anatomy, the geographic distribution of species and other lines of evidence. What is now called “evolution” was then known as “transmutation” and denounced as heretical. But long before 1858 it was obvious to any honest observer, including churchmen, that “development’ had occurred. The favored hypothesis to explain it was serial creation.
Now however we, including myself, observe the evolution of new species and genera in real time. These are often not “weakly defined” species but robust, to include even indisputably new genera, not just species. I suppose that speciation via hybridization sometimes produces “weak” species, still capable of reproducing with their parental species, but not doing so in the wild. However hybridization can and does produce true species, by any definition.
More important than hybridization however among quick and dirty evolutionary processes is polyploidy, ie duplication of all or part of a genome. This is more common in plants than animals (not sure about fungi), but observed in all three multicellular kingdoms. Some 30 to 80% of plant species have arisen via polyploidy, ie in a single generation, and are incapable of interbreeding with their genomically-impoverished mother species.
Defining species as you know is harder for microbes, but when a single point mutation turns a sugar-eating bacterium into a nylon-eater, then evolution has occurred.
Your definition of “species” is way too broad, if it includes family-level differences, as your mosquito example suggests. As noted, new genera have been created in the lab, as long ago as the 1930s, if not earlier. No example of creating a new family comes to mind, but Hawaiian flies alone show how easy such an evolutionary step is in an isolated environment with available niches.
Mosquitoes are members of the family Culicidae. As above, evolution of new families usually has to be inferred rather than observed, but the conclusion is inescapable. We have observed the evolution of culicids from their ancestral flies preserved in Mesozoic amber samples. Analysis of fly genomes also shows from which lineage the family is derived, along with details of anatomy and other lines of evidence.
We have also observed other flies switching from sucking nectar to sucking blood, creating new species in the process, so the transition is not surprising.
David Middleton April 17, 2017 at 12:05 pm
There is no scientific definition of species under which you and Rosie would be considered members of different species.
The short version is that a true species is incapable of reproducing fertile offspring with its maternal species or any other. The only exceptions are in some cases where fertile offspring are possible under artificial conditions, but mating doesn’t occur in the wild due to physical isolation or behavioral differences.
The classic example is of two species in the genus Equus, ie horses and donkeys, which can produce (almost always) infertile offspring, ie mules, so are considered different species.
Thus, for sexually reproducing species, the definition is clear. As noted, it’s harder for unicellular microbes and asexually reproducing multicells.
Your Wiki citation barely scratches the surface of lab creation and recreation of species.
Rosie and I are definitively of different species according to this definition:
https://en.wikipedia.org/wiki/Species
David,
It should be obvious on its face that that passage describes a type of species; it doesn’t define the fundamental concept of species itself. As I noted, there are instances of speciation in which reproduction is possible, but doesn’t usually occur, for whatever barrier. But for the vast majority of sexual species, the standard definition applies.
And even by that definition, you and Rosie don’t count. With insects, mate choice isn’t subject to whim. If you and Rosie were flies rather than people, you would mate with her.
I can’t tell if you’re being serious or jocular.
Darwin’s book was titled “On the Origin of Species”. At that time the standard definition already applied. To him and to his readers educated in natural science, what was understood by “species” was capability of producing fertile offspring together.
Lumping species into genera was then somewhat subjective. We can now rely on genetics and chromosomes. Linnaeus wanted to lump Homo and Pan into the same genus, but knew he would catch holy hell from the churches if he did that.
If I have to tell you when I’m being jocular (a sarcastic smart @$$), there’s no point in being jocular… 😉
David,
There might be a point. Maybe I’m just a slow audience for your blog stand up routine.
To quote George C. Scott from Patton:
“It’s not important for them to know [when I’m acting]. It’s only important for me to know.”
😉
One thing that has always fascinated me is the vehemence with which some people react to the notion that the mutations that drive evolution need not be 100% random in nature.
To them, even suggesting that God may have had used loaded dice when it comes to these mutations is the logical equivalent to claiming that God created everything 5000 years ago.
>>
One of the things that drives me crazy about the C vs E debates is the misconception of the word “theory.” One side says evolution is *just* a theory and the other insists that it is a fact. There is no hierarchy here. Facts aren’t superior to scientific theories. Theories don’t get promoted to facts; although some are elevated to the status of “laws.”
<<
One of the things that drives me crazy is the idea that “laws” are proven “theories” or “elevated theories.” When arguing Evolution many years ago on Compuserve, we’d get individuals who’d say “Evolution is ONLY a theory.” Our reply was usually, “So what? Theories are what science is all about.” Then they’d say, “But Evolution hasn’t been proven.” It soon dawned on me (at least) that these individuals thought that the scientific method involved the sequence: hypothesis–theory–proof–law.
I don’t know who is teaching this nonsense, but laws are not proven theories. Laws usually come first, and then theories explain those laws. Kepler’s three laws of planetary motion were all derived from Tycho Brahe’s data. There were no theories or proofs that predated these laws. Later Newton came along with his three “laws” of motion, his gravitational “law,” conservation of momentum and angular momentum, and his invention of Calculus to derive Kepler’s laws. Even so, Kepler’s third law is only an approximation. Einstein’s General Theory of Relativity explains these laws more accurately.
Any geologist should know that the law (principle) of faunal succession was formulated in the early 19th century. Darwin’s Theory of Evolution came decades later. Darwin’s theory explains why the principle of faunal succession is true.
Jim
David,
“Evolution and plate tectonics are “concise, coherent, systematic, predictive, and broadly applicable” explanations of the observations.”
Are you excluding the evolution of inanimate matter into living/reproducing living organisms in that statement?
If not, what is the “concise” explanation for that “step”?
If yes, then in combination with the other unobserved aspects you mention, I don’t understand how the “theory” is anything more than an idea . . Much like treating the possibility that a monkey could type out this comment, as a scientific theory for how it came to be . . ; )
PS ~ For an idea to be considered a scientific theory, doesn’t it have to be falsifiable? . . How could the Evolution theory be falsified?
>>
JohnKnight
April 17, 2017 at 9:11 pm
Are you excluding the evolution of inanimate matter into living/reproducing living organisms in that statement?
<<
Evolution is the wrong theory. Evolution does not deal with the origin of life. Theories, hypotheses, and ideas on the origin of life would fall under Abiogenesis. So I would say David is excluding Abiogenesis from that statement as he said nothing about it.
Jim
Jim Masterson April 17, 2017 at 9:03 pm
Yup. Geologists and paleontologists noted succession in their studied strata long before Darwin’s theory of natural selection provided the first clue to evolutionary processes. Prior hypotheses, like Lamarck’s, attempting to explain the observed changes in fossils from period to period in the rocks, weren’t convincing.
The Permian mass extinction event stood out so starkly when discovered in the 1840s that a whole new creation was suggested to explain it.
MarkW April 17, 2017 at 1:38 pm
For your conjectured divine mutations to be a scientific hypothesis, you’d have to show some evidence for them, then make testable predictions about them. Since that can’t be done, it’s not a scientific hypothesis, so of course scientists should reject unsupported imaginary divine intervention out of hand.
Completely natural processes adequately explain observations. Predictions made on the basis of totally natural evolution are confirmed. The God hypothesis can’t even to tested, but all predictions by creationists are found false.
JohnKnight April 17, 2017 at 9:11 pm
As you’ve repeatedly been told, biological evolution is different from abiogenesis, ie the origin of life from its constituent chemical parts. At present there isn’t a single hypothesis or theory for the origin of life, but great strides have been made in understanding how chemical evolution led to the first living things.
Evolution, as noted, is not “just a theory”, but also a scientific fact, observed over and over and over again. Besides of course, a scientific theory isn’t like the commonplace use of that term.
Evolution can easily be falsified, but never has been, nor can it be, since it’s a fact, ie an observation, as well as a body of theory explaining those observations.
As Haldane said, a rabbit in the Cambrian would falsify the theory of evolution. But instead, the fossil record, along with every other possible line of evidence, all show that phyla, classes, orders, families, genera and species of living things have evolved from their ancestors. There is no evidence in support of any possible competing scientific hypothesis.
If you want to go by the Bible, it’s a lot easier to read the fact of evolution into the text than it is modern astronomy, geology, hydrology, you name it. Does an immobile earth literally supported by pillars and a foundation personally laid by God? Does earth have four corners? Is it covered by a solid dome? Do stars fall to earth? Do they sing? Does God sit on the edge of the earth and look down on people who seem to Him to resemble insects?
If you take the irreconcilably contradictory creation myths in Genesis as literally true, then how about God walking on the vault of heaven, personally opening and closing the levers controlling the storehouses of rain, hail and snow? How do you read the hydrological cycle into those passages, in which also God distributes lightning and sends clouds and winds?
Deuteronomy 28:12
“The LORD will open for you His good storehouse, the heavens, to give rain to your land in its season and to bless all the work of your hand; and you shall lend to many nations, but you shall not borrow.
Job 22:14 (NLT)
“For thick clouds swirl about him, and he cannot see us. He is way up there, walking on the vault of heaven.
Job 38:4 (NLT)
“Where were you when I laid the foundations of the earth? Tell me, if you know so much.
Job 38:22
“Have you entered the storehouses of the snow, Or have you seen the storehouses of the hail,
Psalm 135:7
He causes the vapors to ascend from the ends of the earth; Who makes lightnings for the rain, Who brings forth the wind from His treasuries.
Jeremiah 10:13
When He utters His voice, there is a tumult of waters in the heavens, And He causes the clouds to ascend from the end of the earth; He makes lightning for the rain, And brings out the wind from His storehouses.
Jeremiah 51:16
When He utters His voice, there is a tumult of waters in the heavens, And He causes the clouds to ascend from the end of the earth; He makes lightning for the rain And brings forth the wind from His storehouses.
I should have said “could” easily be falsified.
Cultists have tried for almost 160 years to show the theory and fact of evolution false, but with no success.
MarkW April 17, 2017 at 1:38 pm
Inserting antiscientific conjecture into science based upon religion is at least as bad as doing the same for ideological reasons, a la CAGW. That’s why both mixings of belief systems with science should be vehemently rejected.
Jim,
“Evolution is the wrong theory. Evolution does not deal with the origin of life.”
Yes, I know I’m ignoring that (to my mind somewhat) arbitrary (yet extremely convenient) division of the . . monkey’s hyper-monumental, yet still hypothetical achievements ; )
I’m a bad boy . .
Chimp,
“As Haldane said, a rabbit in the Cambrian would falsify the theory of evolution.”
Can’t go to the (hypothetical) Cambrian to check for rabbits . . please try to avoid silly talk . . you surely meant something along the lines of finding a trilobite fossil next to a rabbit skeleton (in the present ; )
Thing is, your “silly talk” there is potentially indicative of extreme prejudice, as in an inability to stop “seeing” that imaginary past, that’s been assembled over time (which I am quite familiar with, and did not question for most of my life) by people . . not infallible or disinterested super-duper honest gods of some sort. Breaking the habit of assuming that what appears to us (internally) as a result of years of authoritative voices telling us what happened in the distant past, is difficult, but necessary I believe, in order to objectively consider the possibility that we’ve . . been conned, essentially.
In the present, I believe, we face a world of people being conned in a similar fashion to what I am proposing may have happened to us, in regard to evolution. Basic logic pretty much dictates that if it can happen now, it could have happened before, ya know?
PS ~ betcha can’t find a rabbit skeleton on the bottom of today’s ocean, Chimp . . but that hardly demonstrates they don’t currently exist, ya know?
>>
JohnKnight
April 18, 2017 at 2:00 pm
Yes, I know I’m ignoring that . . . .
<<
I appreciate the heads-up–thanks. I’ll ignore your comments from now on.
Jim
Aw, special snowflake Jim got triggered by my not pretending I think it’s logical to assume living things coming into existence, and being able to replicate, are unrelated ; )
John,
The distinction between biological evolution and abiogenesis could not possibly be less arbitrary. What a silly thing to say. As even you must realize, biological evolutionary processes can only operate on living things.
Thus it should be obvious that biological evolution first requires life to arise. Chemical evolution must have played a part in that process.
What is silly is your imagining that we don’t sample the Cambrian all the time. Some of the highest resolution fossils ever found come from Cambrian layers. That’s how we know so much about life in that distant period. We have sampled Cambrian land surfaces as well as the oceans in which multicellular organisms then lived. And so far, no rabbits.
There are plenty of other ways to falsify evolution, and creationists are always trying, but they fail miserably. They’re so steeped in lies however that they know no shame, no matter how often they’re publicly embarrassed. Behe, the guy who hatched the hare-brained old creationism in a new bottle scheme to sneak it into science classes, which he called “ID”, was forced to admit under oath on the witness stand that evolution is a fact.
What is imaginary is your alternative universe in which evolution doesn’t occur. It’s a consequence of reproduction. Sooner or later, it cannot not happen. Even “living fossils”, which appear superficially unchanged for millions or tens of millions of years, thanks to stable environments, probably couldn’t produce fertile offspring with their seemingly similar ancestors.
John,
Here are plenty of opportunities for you to falsify evolution, listed by geologic period. Find fossils out of this succession sequence, which is what has actually been discovered and what is predicted by the theory of evolution:
Cryogenian: Colonies of unicellular choanocytes forming protosponges.
Ediacaran: Poriferans (sponge phylum) with choanocyte feeding cells and calcareous and siliceous spicules.
Cambrian: Larger animals with hard, calcareous body parts, to include the first tiny vertebrates.
Ordovician: Fish with jaws.
Silurian: Bony fish. First vascular plants and arthropods invade the land.
Devonian: Lobe-finned fish evolve into tetrapods. First forests.
Carboniferous: Tetrapods evolve into amniotes, enabling the vertebrate conquest of the land.
Permian: Synapsid amniotes become increasingly mammal-like.
Triassic: First proto-mammals, with both the “reptilian” and mammalian jaw joints.
Jurassic: True mammals with only the mammalian jaw joint and the other jaw bones forming the middle ear.
Cretaceous: Placental mammals.
Paleogene: Primates diversify, including apes.
Neogene: African great apes evolve into chimp and gorilla lines, then humans, chimps and bonobos emerge from the chimp lineage.
Do you suppose that God planted these fossils in this order and made the rocks seem old to mislead us and test our faith?
Two important mutations occurred in the Pliocene Epoch of the Neogene Period leading to modern humans. Early in the epoch, two standard, small ape chromosomes fused, a genetic event associated with upright walking, producing Genus Australopithecus. Toward the very end of the epoch, a single mutation enabled brain growth, leading to Genus Homo.
During the Pleistocene, Homo species grew larger and their brains gradually bigger. The rocks do not lie. Neither does our genome nor any of the other superabundant lines of evidence so vividly displaying human evolution.
Chimp,
“The distinction between biological evolution and abiogenesis could not possibly be less arbitrary.” What a silly thing to say. As even you must realize, biological evolutionary processes can only operate on living things.”
You’re loading the question, so to speak, by inserting the term “biological” like that (It means living order, basically). It amounts to an assumption that there was no non-living process(es) going on, that resulted in things that resembled what we see as life being produced, which at some point produced a simple self replicating version of some sort. Along the lines of an “RNA world” beginning, as opposed to a “whole cloth” style abiogenesis event, along the lines of the “Boltzmann brain” mold. I see no reason to make that sort of assumption . . That said, speaking just within the “naturalism” world-view . .
What I see in the insistence on treating the two aspects as independent, is an extremely handy way to keep the hype-unlikely times hyper-unlikely probability problem at bay. You know, the one that got “solved” by the multi-verse idea? ; )
“What is silly is your imagining that we don’t sample the Cambrian all the time.”
I will not go insane with you guys . . we can ONLY sample things in the present. Looking at a photo of your dead great grandma, is not going back in time . .
John,
You’re being willfully obtuse and trying to distract from the obvious point.
Obviously, Haldane was talking about a fossil rabbit, not actually going back in time 540 million years. It doesn’t have to be a rabbit. It could be a dolphin.
Your cult has deranged you.
Chimp,
“Obviously, Haldane was talking about a fossil rabbit…”
Of course, but they would first have to be a fresh skeleton, down where they could be buried alongside a trilobite. Virtually certain never to occur . . Yet, you sited someone giving that as a falsification means . . Think he might have failed to use his mind objectively in that moment? I do . .
And, when I’ve asked people wed to the Evolution idea how come we don’t see creature lines gradually changing in the fossil record (as Mr, Darwin himself pointed out was a problem for his theory), guess what they tell me? We are only seeing a tiny slice of all the creatures that ever lived in those fossils, so it’s no big deal that we haven’t caught a good example of it happening .. . despite it having to have gone on for many millions of years with regard to virtually all living and extinct creature lines! Yet, I’m told finding a rabbit down there where the trilobites lived is a means of falsifying the “theory”, and that lame idea echoes down into this thread . . amazing.
In a global flood (you know, that “myth” so remarkably ubiquitous among ancient human societies ; ) one would expect bottom dwellers with little capacity to swim, to be buried early (down in the “Cambrian” layers, as you imagine them to be (and they might be, I’m not arguing it’s impossible, just that it’s not a “scientific fact”, but rather a belief.)) . . and that’s just not where one would expect to find dolphin remains either under those circumstances. And they couldn’t later get into that layer, so, your replacement “falsification” means is also rather . . unrealistic. If the global flood happened, one would not expect to find rabbit or dolphin remains in with trilobites.
So, got any logical ways to “falsify” the idea?
John,
Geologic layers are not at all as you imagine them to be. Marine and terrestrial layers alternate. This would not be the case if they were laid down in a global flood, for which there is zero evidence and all the evidence in the world against it.
Animals from all other periods would be mixed up with similarly-sized Cambrian creatures, all in the same layer under your fantasy of size sorting. All the dead animals would fall to the bottom, so that dolphin fossils should indeed lie next to trilobite fossils. Your belief is absurd.
Of course flood myths are common because floods are common. There might even be instances in which local people could see only water for a while, making them think that the whole world was flooded. But its a physical impossibility for the whole world to have flooded higher than the tallest mountains. There is not enough water, obviously, and where could it have come from and where did it go?
As for RNA and proteins, here’s a recent study important in origin of life research. It shows that polypeptides (amino acid stands shorter than proteins) could have helped catalyze the formation of ribozymes, ie RNA strands with enzymatic functions, to include promoting synthesis of themselves. The ribosome is an RNA structure which makes proteins in cells. It also has some non-functional protein coating, but it’s active site is all RNA.
https://www.nature.com/nchem/journal/v9/n4/full/nchem.2739.html
The extent to which peptides and RNA worked together during the origin of life has been a subject of debate. This paper elucidates that part of the process.
And, on the chemical evolution, ie abiogenesis, which preceded biological evolution:
https://www.sciencedaily.com/releases/2017/03/170313135048.htm
https://phys.org/news/2013-12-scientists-closer-rna.html
https://www.nature.com/subjects/origin-of-life
Every year brings us closer to making replicating protocells in the lab.
Noah’s flood was probably the flooding of the Black Sea basin during the Holocene highstand.
Thank you for the continuing education. Well presented information like this enlightens the vast majority of lay persons trying to understand the science or just science in general. Green cultists get the ridicule and contempt them so richly deserve.
ha, David, you weren’t joking around when you said that posting graphs is one of your hobbies 😉
But aren’t you engaging in some debate fallacies yourself? (i.e. there is someone on the internet saying something dumb, therefore I hereby prove that everyone in that group is dumb as well). I’m quite sure that when I was taking my atmospheric physics/chemistry classes the content was very much more specific and falsifiable and thermodynamically valid than what you are talking about here. So I’m not very much convinced by this, since it doesn’t correlate to my experience of how science works.
Cheers,
Ben
(by that I refer to ‘some CO2 will cause some warming’)
I have actually encountered people who think that is the theory and that the models confirm it.
I don’t think I made the generalization that his entire group was dumb… Although Lovejoy, 2014 and some of the other nonsense about AGW being exempt from the Null Hypothesis sometimes makes be wonder if there is a prevalence of dumbness in that group.
The comment and several like it prompted me to put together this post. Much of it was taken from prior posts and comments of mine.
The world is a big place, you’ll find weird things if you look for it. I think a more interesting issue is that WUWT (I read it every other day and I have my students look at it as well. Very educational, albeit not in the sense you think) just completely misses the mark with respect to talking about things that the scientific community is actually working on. Science is made of theory – experiment – observation. All you guys focus on is comparing some (but not all) of the observations with some (but not all) of the computer experiments. As if the world consists of Mann and a couple of graphs. It just doesn’t work outside the confines of the WUWT comment section.
Cheers,
Ben
You say that like you believe there are observations that actually match any of the models.
Well, if you look at figure 21 you see that the observations fall within the uncertainty range of the models, so clearly the models are correct by their own standards. It’s just that at WUWT you guys pretend that models need to be 100% accurate before they can be useful. So by the WUWT standard they are failing, by the standard of their use case they are doing just fine. Just a matter of perspective.
For example, are the computational models used in airplane design 100% accurate? No, that is why we still use wind tunnel models. Still being widely used, and I don’t think you’d blink twice about flying an airbus or boeing.
Note that David has not included the uncertainty range of the observations, or disclosed the exact source of the observations (a favourite WUWT trick is to compare land temperature models with satellite temp observations, which do not measure the same thing
Cheers,
Ben
Ben,
Barely falling within the uncertainty range for 30+ years is not a nullification of the null hypothesis. It is a reinforcement of the Null Hypothesis.
The instrumental data over the past 30 years, both surface and satellite have a relaitvely narrow error range.
RSS does provide an error range for the models and their satellite temperatures:
http://images.remss.com/figures/climate/RSS_Model_TS_compare_globe.png
http://www.remss.com/research/climate
Climate Fail… QED.
and don’t forget, computational experiments are just one arrow in the quiver of science: theory – experiment – observation. The main reason why climate change has such support in the scientific community is because it is backed by over a 100 years of very convincing theory, coupled with plenty of observations (I haven’t been ice skating in my country for over a decade!)
Benben,
The models produce such a range of outputs and have such wide error bars, that they are meaningless, worse than worthless GIGO.
The clearly anti-physical high-ECS runs are kept in just to make the outputs look scary. Any model producing an ECS over two–the upper limit of barely physically possible based upon actual observations–should be thrown out. But then there would be no scare.
The whole modeling enterprise is hopelessly corrupt and corrupting on all of science.
benben, the models are all over the map when it comes to predictions.
Regardless, the actual temperature have been below even the levels predicted for complete cessation of CO2 production, despite the fact that CO2 has been increasing at the upper end of the prediction spectrum.
Beyond that, the mere fact that the models are all over the map despite 40 years of trying to improve them is evidence that none of the models are able to accurately model the climate.
benben: If the models used by airplane designers were as bad as climate models, 99 out 0f 100 planes would crash on take off.
I love the way you warmistas try to claim that if any model is good, all models must be trusted.
The evidence shows that the 1930’s were warmer than today, and that’ before the big run up in CO2.
The evidence shows that the Mideival, Roman, Minoan warm periods were all a degree to as much as 5 degrees warmer than today, with no change in CO2 levels.
None of your models are able to model any of those periods, or the Little Ice Age for that matter.
The world has warmed a tiny bit is hardly surprising since for the last 30 years we have been on the warm side of the PDO.
benben,
If the models were to have any validity at all, all the control knobs would have very precise physical meanings. You can not roll everything up into a couple of knobs and say, “look I matched the wiggles for the last quarter century. If the values on the knobs have no physical meaning, than you don’t have a scientific model. It isn’t that they are wrong (though they are on many important aspects – including the easy one – TEMPERATURE!) but that they have no physical meaning for the parameterizations of the control knobs.
When I model something like photon scattering on an aluminum atom, the knobs have real meaning – charge of the nucleus, charge of the electron field, radius of the nucleus and radius of the electron field (rather fuzzy that one), and energy of the incoming photon. From that a fairly accurate (from a predictive power standpoint) model can be generated that allows one to narrow in on the radii of the electron cloud and the nucleus. This model can then give us some way to go to the laboratory and determine which value for the radii control knobs are correct by the measured distribution of the results. Or they can disprove the whole concept of photon scattering. (of course those radii are only valid for aluminum atoms bound in a thin foil layer, but that is picking nits.)
Models are great and powerful – when used correctly, but can be badly abused when non-physical extra controls are placed for the purpose of wiggle matching. AGW skipped the “theorize what all the controls mean” step and went straight to the “take control of world energy policy to impoverish the masses and depopulate the planet” step.
you see that the observations fall within the uncertainty range of the models,….
So the hurricane is traveling west in the Bahamas…..the cone of death is from Rio to Maine…and everyone in Houston should evacuate
MarkW April 17, 2017 at 3:07 pm
My ballpark summary of the paleoproxies, worldwide, +/- 0.5 degrees C:
Medieval: +1.0
Roman: +2.0
Minoan: +3.0
HCO: +4.0
Eemian peak: +5.0
David, I appreciate you engaging with me without becoming overly hostile or mocking!
That being said, look, you’re doing something that is just disingenuous. You know that satellites measure +5km in the atmosphere while models model the earths surface. I know that. So why bother? Just for once, make a real graph: all the ground based global temperature datasets (there are at least 6) that runs until spring 2017. Take a FAIR sample of the models (e.g. only models that have been published in the past 5 years, only the scenarios that track the real world CO2 emissions pathway). Make a graph with ALL relevant error ranges. And then, just for WUWT, make another one with the uncorrected datasets. And just for fun, try finding an uncorrected dataset for the satellite data. Ha.
@Owen in GA: look, firstly, I’m assuming you have an academic background as well, so you should be able to very easily look into the code for many of the models yourself: http://www.cesm.ucar.edu/models/register/register.html
Second, it is true that global models are more aggregate than a model that does individual electrons. That doesn’t mean it has no physical meaning. But again, please just look at the models yourself instead of relying on the disinformation here on WUWT.
Cheers,
Ben
Most of the model comparisons are with surface temperature data.
From the post:
HadCRUT4 has tracked the strong mitigation scenarios, despite a general lack of mitigation.
The climate models have never demonstrated any predictive skill.
And the models aren’t getting better. Even when they start the model run in 2006, the observed temperatures consistently track at or below the low end 5-95% range. Observed temperatures only approach the model mean (P50) in 2006, 2015 and 2016.
 ?w=680
[caption id="attachment_3142" align="alignnone" width="680"] Figure 21. Climate Lab Book. Comparing CMIP5 & observations.[/caption]
The ensemble consists of 138 model runs using a range of representative concentration pathways (RCP), from a worst case scenario RCP 8.5, often referred to as “business as usual,” to varying grades of mitigation scenarios (RCP 2.6, 4.5 and 6.0).
 ?w=680
[caption id="attachment_3143" align="alignnone" width="1024"] Figure 22. Figure 21 with individual model runs displayed.[/caption]
SOURCE
When we drill wells, we run probability distributions to estimate the oil and gas reserves we will add if the well is successful. The model inputs consist of a range of estimates of reservoir thickness, area and petrophysical characteristics. The model output consists of a probability distribution from P10 to P90.
P10 = Maximum Case. There is a 10% probability that the well will produce at least this much oil and/or gas.
P50 = Mean Case. There is a 50% probability that the well will produce at least this much oil and/or gas. Probable reserves are >P50.
P90 = Minimum Case. There is a 90% probability that the well will produce at least this much oil and/or gas. Proved reserves are P90.
Over time, a drilling program should track near P50. If your drilling results track close to P10 or P90, your model input is seriously flawed.
If the CMIP5 model ensemble had predictive skill, the observations should track around P50, half the runs should predict more warming and half less than is actually observed. During the predictive run of the model, HadCRUT4.5 has not *tracked* anywhere near P50…
 ?w=680
[caption id="attachment_3144" align="alignnone" width="680"] Figure 23. Figure 21 zoomed in on model run period with probability distributions annotated.[/caption]
I “eyeballed” the instrumental observations to estimate a probability distribution of predictive run of the model.
Prediction Run Approximate Distribution
2006 P60 (60% of the models predicted a warmer temperature)
2007 P75
2008 P95
2009 P80
2010 P70
2011-2013 >P95
2014 P90
2015-2016 P55
Note that during the 1998-99 El Niño, the observations spiked above P05 (less than 5% of the models predicted this). During the 2015-16 El Niño, HadCRUT only spiked to P55. El Niño events are not P50 conditions. Strong El Niño and La Niña events should spike toward the P05 and P95 boundaries.
The temperature observations are clearly tracking much closer to strong mitigation scenarios rather than RCP 8.5, the bogus “business as usual” scenario.
The red hachured trapezoid indicates that HadCRUT4.5 will continue to track between less than P100 and P50. This is indicative of a miserable failure of the models and a pretty good clue that the models need be adjusted downward.
In any other field of science CAGW would be a long-discarded falsified hypothesis.
Lovejoy14 did not exempt AGW from the null hypothesis – I thought your comment could be interpreted as meaning that so I wanted to clarify. It actually showed that AGW was outside natural variation and rejected the Null Hypothesis. He uses statistics and you have not shown him to be wrong.
You reasons for thinking him wrong are themselves wrong. 1) It is more than 99% certain that it will be warmer here in July than in January. 2) Misunderstanding of climate variability cannot be a real complaint because it is a statistical analysis. No understanding is necessary. 3) ECS is a separate conclusion that derives from the analysis. It is not itself necessary for the rejection of the null hypothesis.
Lovejoy may be flawed, but your reasons for doubting it are not valid.
Lovejoy’s 99% solution fails to quantify or even accurately describe the patterns of natural variability of the Late Holocene climate. Therefore, his conclusion that the warming since 1880 (~0.4 °C per century) cannot be natural is unsupported in his analysis.
https://wattsupwiththat.com/2014/04/27/a-geological-perspective-on-lovejoys-99-solution/
Hi David,
Ah, so you are an engineer in the oil business. That explains a lot 😉 I find that the vast majority of skeptics with quantitative skills are engineers in more strictly defined fields (oil, chemistry). Global models for policy support are just going to be more fuzzy than what you are used to, just because the aggregation level is so much higher.
CAGW is not discarded because the fundamentals are very strong. If you look into the physics and chemistry you seen that there must be some effect of CO2, and that this effect will probably be detrimental. The models are a bit flabby if you insist on putting them in the worst light (as WUWT does). But for policy support, is the science strong enough? I say yes, the vast majority of scientists say yes, and the vast majority of governments say yes.
And anyway, since renewables are becoming incredibly cheap and we don’t want to be overly dependent on the oil/gas countries – just because of national security – there really shouldn’t be any debate about forging ahead with renewables until everyone is at ~30%, which won’t be for another decade or two.
Some comments: CIMP5 is pretty old by now. Models have improved, if only because of vastly increased computational power. CIMP is always just a management summary, the real meat and potatoes of science is in publications. 2nd, the 8.5 scenario is just a scenario. Currently the world is clearly not on that track (as evidenced from flat CO2 emissions in the past couple of years). A scenario is never ‘bogus’. It’s just a what-if scenario. Comparing observations to a not-realized what if scenario is basically lying (to yourself in this case).
hmmm I’m sure there is more but gotta do some work!
Cheers
Ben
I’m a geologist/geophysicist, not an engineer.
benben April 18, 2017 at 11:37 am
Must be detrimental? Why? Please explain.
The effect of enjoying four instead of three molecules of CO2 per 10,000 dry air molecules has so far been entirely beneficial. Earth has greened.
The first proponents of AGW also considered it beneficial. Arrhenius and Callendar both welcomed more CO2 in the air and overestimated its effects.
Better than the present alleged 400 ppm of CO2 in our air would be 800 ppm, but best of all would be 1200 ppm, for plants, children and other living things. That’s the level maintained in real greenhouses, to promote plant growth.
Ah, my apologies David. In essence, the mistake WUWT makes is that it wants to see 100% proof of climate change, while the rest of the world is looking at it through the eyes of risk analysis. Are the models good enough to show that there is a risk? Does the theory show there is a risk? Yes. Therefore we work on risk abatement. Nothing more, nothing less.
benben
AH, yes, the well-done “risk aversion” theory of CAGW.
Let us GUARANTTEE 100% economic harm to billions for 100 years, and death by disease, starvation, bad food, bad water, no heat, and no light for millions for 100 years, in the 1-5% CHANCE that a “little harm” “might” come to a few (unnamed!) hundreds of people IF this religious CAGW THEORY that CO2 levels control global average temperature is correct (which it has NOT occurred at all yet after 52 years of steadily increasing CO2 since 1945); and IF the world’s CO2 does continue to increase at today’s rate for 100 years, and IF controlling man’s release of CO2 actually affects meaasureable levels of CO2 in the atmosphere.
SO, with NO evidence of harm at all, and with 100% of the actual trends and evidence showing NOTHING but good coming from the wider use of fossil fuels to benefit people worldwide, you DEMAND the right to CAUSE HARM to billions for 100 years just because you “fear” some harm “might” come?
you are aware that this type of reaction just makes all skeptics look bad? I’m not joking, you’re doing David a great disservice.
BenBen, the coming of the 2nd Little Ice Age would not convince Alarmists like you !! IMHO….
Excellent article. Thanks!
Question in regards to the RADIATION TRANSMITTED chart…..
Does anyone have a link / source to where the wavelength can be compared to the surface temperature of the body (in this case the earth) that is radiating?
Hell …
Wein’s displacement tells us the temperature dependent wavelength where the peak emissions are for an ideal black body and which can be derived from Planck’s Law.
https://en.wikipedia.org/wiki/Wien%27s_displacement_law
https://en.wikipedia.org/wiki/Planck%27s_Law
For the case of the radiation emitted by the planet, it’s not an ideal Planck spectrum as seen from space, but the ideal Planck spectrum of surface or cloud emissions with regions of wavelengths attenuated in which case Wein’s displacement tells us the color temperature of the radiation which in the ideal BB temperature of the emitting surface below before attenuation by the atmosphere.
It’s with great reluctance that I submit this comment. I’ve followed the debate on CAGW for 14 years and studied the arguments that CO2 is a driver of our climate and found no reason to believe it has any substantial effect on our climate. The best model of the Greenhouse Effect (GE) is the US Standard Atmosphere model which no one references. It clearly demonstrates that the GE is a function of atmospheric mass/gravity/pressure and not radiative forcing from greenhouse gases. The attached link offers a succinct explanation. http://hockeyschtick.blogspot.com/2014/12/why-us-standard-atmosphere-model.html
No need for reluctance, George. If you , or indeed anyone, finds something of relevance in this debate about CAGW please throw it into the mix. There are few closed minds here and we can all have a sensible scientific discussion about it.
I personally tend to agree with the gravity induced explanation for planetary surface temperatures not least because it is elegant and simple, explains both Earth and Venus surface temperatures and explains the centrifugal effect in the vortex tube apparatus used to produce a cold and hot air stream from compressed air at ambient.
As I see it there are 2 competing explanations here, Radiative Forcing due to GHE and Gravity induced temperature gradient. Both look, at first glance, as if they explain the often touted +33C difference (compared to bare earth no atmosphere). Clearly only one can be true, otherwise if both are we would have +66C !!!
I think I might have an experiment to verify the gravity induced theory but I am going to let this thread cook for a bit and see what emerges before revealing it.
I agree that this hypothesis has at least as much scientific basis as the GHE hypothesis, but IMO its discussion was b@nned from this bl0g because its Skdrgn Sl@yer advocates made such obstreperous equine posteriors of themselves.
OEPs are present in any field, I had one last year in a discussion about cooking paella. Anyway Feynman had something to say about considering the science and not the messenger so surely the correct course of action would be to ban those who cannot discuss things in a nice polite manner not ban the topic because of the way some advocates talk ? I suggest we resume discussing it even if we eventually reject it because in discussing it we might reveal further insights into GHE anyway. Of course we are not so arrogant as to think we already know everything there is to know about our own position(s) on the science of climate are we? There is always more to learn.
Badger,
It appears that our esteemed host and m0derators do indeed allow proper discussion of alternative hypotheses, just not by known Sl@yers.
If it were up to me, I’d ban any discussion of creationism or so-called ID, since this is a science blog, not a religious site. As there is no scientific evidence in favor of either of those cultic dogmas, and all the evidence in the universe against them, they have no place on a science site, IMO. Promoting those blind faith doctrines here just gives the Warmunistas more ammo in equating CAGW skepticism with evolution d@nial.
But, happily, this blog belongs to and is managed by those with a high tolerance for antiscience, if not for bad behavior.
Chimp, it’s hardly sporting to declare that only your side gets to make pronouncements since the other side clearly isn’t science.
You are starting to sound like a warmista.
Whether the ID’ers are right or the 100% random side is right is a question that can never be answered scientifically.
ID leaves open the possibility of a “not God” origin, otherwise it’s just creation. In either case they are making the claim aliens are responsible for humans. But aliens too, had to come from somewhere, whether inside or outside our Universe.
Their argument is lacking logic.
Chimp, please present the evidence that all mutations that have ever occurred are the result of random chance.
MarkW April 17, 2017 at 3:10 pm
The question not only can be settled but has been done. There is not a single valid ID argument.
Behe’s “irreducible complexity” has already been shown false. The pathways by which bacterial flagella evolved have been reconstructed.
ID was found antiscientific in federal court. It’s an open and shut case, since ID requires punting, throwing up your arms and saying that some observations cannot possibly be explained. A more antiscientific attitude is not possible.
MarkW April 17, 2017 at 3:11 pm
You fail to understand evolution. Some mutations are in effect random, such as the passing cosmic rays which convert sugar-eating bacteria into nylon-eaters in a single point mutation. However, that such mutations will occur is statistically nearly certain, given GCR flux, and more often during heightened periods.
Other mutations result from the process of reproduction itself, so, while each individual instance could be considered random, that there will be mistakes in mitosis and meiosis is part of the process. Polyploidy is also built into the system, that is duplication mutations.
Others arise because of the very environmental changes to which the organism is adapting.
But more importantly, a great deal of the variation upon which evolution works can only remotely be called random mutation. It results from the incorporation of other organisms’ genomes into those of others.
Now, if you want to suppose that God sometimes gets involved in the process, by ordering some mutations, you’re free to do that. But that’s a fundamentally un-, or anti-scientific conjecture. The God hypothesis, as in divinely directed evolution, is not subject to experimental test of its predictions, because it can’t make any predictions. It’s therefore not science but religion.
There is no need to presume divine intervention in evolution, hence no need for me to prove that not all mutations are “random”. Surely the burden of proof is upon you, to show that some mutations have arise by divine intervention.
In so twisting the null hypothesis, it’s you who has joined the Warmunista camp. Creationism and ID are anti-scientific, while CAGW is perhaps best seen as unscientific. Or if also antiscientific, then less so by far than ID, which has no scientific basis whatsoever, being actively against the scientific method.
In science you need to be able to support your hypothesis with evidence. For divine intervention in evolution, none exists. But if you think you can display some, please, by all means, trot it out.
Mark,
Hope you’ll excuse the long response.
The short answer is that there are not two sides. Evolution is scientific fact. ID is religious faith. There is no scientific debate between fact and faith.
Truth fears no question, Chimp. What are you so afraid of?
And please stop perpetuating the tired myth that religion and science are incompatible. The conflict isn’t between religion and science, it’s between science and naturalism–the philosophy (belief system, really) that claims nothing exists beyond the physical universe, and that all things can ultimately be explained by the physical sciences.
I fear nothing. I actually enjoy educating cultists.
As I said, to what I object is creationism polluting a science blog and giving ammo the skeptics’ opponents.
There are plenty of blogs where cultists can learn about reality. IMO this needn’t be one of them.
While science and religion can coexist, its wrong both scientifically and theologically for believers to try to justify their faith on the basis of science. There is no science in the Bible and little to none in any other holy book or religious belief system with which I am familiar.
Also, traces of soft tissue have been found in dinosaur fossils, one example being a triceratops horn excavated by Mark Armitage. This opens up the intriguing possibility that some species of dinosaurs may have survived on the planet for much longer than previously believed. But just the possibility of it becoming a “smoking gun” against the Darwinian paradigm was too much for establishment science, so instead of collecting a Nobel Prize or at least a research grant, Armitage got canned from his university job after he was overhead discussing his results with some of his students.
Then you should be happy to entertain any question someone may have about this topic, and either give as straight an answer as you can, or have the intellectual courage to say you can’t answer. Right? Only someone afraid of the truth seeks to silence or exclude the questioner.
Also, I think you’re only seeing the science that you want to see.
But last reply to this for me, don’t want to be here all night.
Dred,
Fossilized soft tissue in no way invalidates the geological, chemical and physical dating of the remains. Mary Schweitzer, discoverer of the first dinosaur “soft tissue” fossil, acknowledges that her finding contributes nothing in support of the myth of Young Earth Creationism. She thinks that iron provides an answer for this rare preservation phenomenon.
Armitage’s horn has been reliably dated to the Maastrichtian, last age of the Late Cretaceous Epoch. He was let go because his position was temporary. He had freely discussed his religious beliefs with students and staff at CSUN, without prejudice.
Your comment shows why I advocate barring creationism from this site. Repeating lies by the ICR and Discovery Institute here can only bring the blog into scientific ill repute.
There is no evidence for a young earth and all the evidence in “creation” against it.
drednicolson April 17, 2017 at 4:37 pm
I do just that as a contributor to other blogs and in my classes.
Along Mark’s lines, I’ve always told my fundamentalist students that they’re free to inject God into Earth history wherever they want, but that it’s just not scientific to do so.
“Truth” in science isn’t the same as in religion. As I said, I fear no question, but science advances by a time-honored method, which religion doesn’t share. Indeed, it can’t share it, since religion is based upon faith in the absence of evidence, while science is based upon doubt, requiring testable evidence.
Creationism, whether YE, which is easily shown objectively false, or Old Earth, which is merely unscientific, is not science. OEC is OK as long as it is understood that it’s just a personal belief, since there is no evidence in its favor. YEC however not only has no evidence in its favor, but is clearly as false as false can be. It’s both bad religion and no science at all.
Evolution is a reality-based fact. Creationism is a faith-based fantasy.
It is still defensible to argue that the universe was created 13.7 billion years ago, but even that is not a scientific hypothesis, since it doesn’t make predictions which can be tested and shown false.
I use the term “cult” because most denominations which d@ny the fact of evolution are indeed small cults. The one possible exception is the Southern Baptist Convention, which nominally boasts 15 million adherents. I was raised American Baptist and know many Southern Baptists who also accept the validity of evolution, so despite this large denomination, I consider that YEC is a cultic belief, contrary to true Christianity.
Chimp, you are taking possibilities as fact.
Perhaps because you are desperate to prove that God has no place in science.
I’m still waiting for you to prove that every mutation that ever occured was due to chance and chance alone.
I never asked you about irreducible complexity or any of the other things in your long and totally irrelevant response.
Please answer the question asked, or admit that you can’t and admit that evolution must always remain a theory.
PS: Your willingness to denigrate those who disagree with you as “cultists” indicates that your motives are not scientific but rather cultural.
Mark,
As I’ve tried patiently to explain to you, under the scientific method, the onus is on you to find an instance of a mutation requiring divine intervention. You can imagine that such a thing has happened if you want, but to make a scientific case, you have to have evidence supporting your assertion that God actually has caused a mutation Himself. You can’t do that, so your religious-based conjecture is not a scientific hypothesis.
I’m not the least bit desperate. I’m just explaining science to you, who however desperately wants to believe in something without any scientific basis, because it fits your cult’s faith. If there is no evidence, it’s a matter of faith, not facts.
So, if you want to demonstrate the God has actually caused mutations in order to advance evolution, please present an instance of such divine intervention and defend your analysis of it.
Since God has a hard-on for humans, I suggest you look at human evolution. Two key mutations merit your attention. I’ve cited them previously. Early in the Pliocene, two standard, smaller ape chromosomes fused to produce human chromosome #2, which gross chromosomal mutation is associated with upright walking, leading to Genus Australopithecus. At the end of that epoch, another, simple mutation permitted our ancestors’ brain size to increase dramatically, leading to Genus Homo. Either or both of those mutations would be great candidates for you to find divine intervention. How you will test this hypothesis, I don’t know. Good luck, though.
Cult is precisely the right term, since the denominations to which the vast majority of Christians belong officially accept the reality of evolution. The largest sect which doesn’t, as noted, is the Southern Baptist Convention, but many of its adherents also recognize reality. The modern anti-evolution movement arose among Jehovah’s Witnesses and Seventh Day Adventists. So “cult” is the right term.
All mainstream Protestant denominations teach that evolution is a fact, with the possible exception the small fundamentalist Lutheran and maybe Southern Methodists confessions. So roughly one percent of Christians (~20 million out of ~two billion) belong to denominations officially opposed to evolution, whatever might be the opinion of individual believers.
+1 .. good reference George.
It’s all good and interesting BUT I think we need to start with a solid foundation before stacking all these elaborate (but pretty) graphs on it. The foundation I refer to is the basic premise that there is such a thing as a greenhouse effect in the first case and that CO2 is one of the gases which exhibits it.
Can we explain the observations of historical and present earth climate, temperature, etc without the need for a greenhouse effect? Can we explain the measurements taken on Venus (96.5% CO2) without the need for a greenhouse effect? There seems to be a plausible argument that we can, therefore I think we need to actually find out the truth of the matter. Is there or is there not such a thing as a greenhouse effect in a planetary atmosphere? Some experiments to look at this would be useful. Would anyone like to suggest how we can construct an experiment to look at this?
Let me be clear about what I mean by a greenhouse effect. I mean some special effect which is not just thermal insulation. Obviously any gas, like any material, will have insulating properties but what a greenhouse effect is will be something extra in addition to the insulation figures you can compute from the known properties of the gas.
You can actually calculate the radiative effects of so-called “greenhouse” gases. Translating the radiative effects to temperature changes has been elusive.
Which radiative effects can you calculate ? Is not the only one of relevance the radiative flux (output) for a given radiative flux (directional) input? So you need the emissivity and absorbtion coefficients of the gas plus the physical arrangement, volume, length, density/pressure/temperature. Hasn’t a lot of this already been done in the 1950s or before when gases were studied for use in things like aircon units, refrigeration, combustion, etc ?
Well done, David!
The IPCC AGW Hypothesis is that human-emitted CO2 will cause a change of warming of 3.2 K/ doubling of CO2, with large uncertainties. It also predicts a heat ‘blob’ in the Lower Tropical Troposphere.
The NULL Hypothesis is simply that human-emitted CO2 won’t cause this rise nor the blob. No other mechanism needs to be proposed (although Svensmark and Shaviv propose one based on the Sun).
When the Scientific Method is used and observations (from independent satellite and balloon datasets) the rate of warming and ‘blob’ predictions of the IPCC AGW Hypothesis are NOT seen (difference between observation and prediction statistically rejected as due to measurement uncertainties at the 95% confidence level). Hence the IPCC AGW Hypothesis MUST be rejected in favor of the Null Hypothesis. Eventually another hypothesis can be proposed, but at the moment the IPCC AGW Hypothesis must be rejected if one follows the Scientific Method.
Now, the proponents of the IPCC AGW Hypothesis claim that surface measurements match the predictions and ignore the satellite and balloon datasets. It turns out that the surface measurements have major problems, including:
– nearly half of the surface measurements in USHCN (which feeds GHCN) are marked ‘E’ for Estimate and these introduce warming and all analysis based on this will predict warming due to the Estimate data and not the real data.
– the Urban Heat Island (UHI) Effect results in local warming of surface measurement stations that are not representative of the rest of the globe. Anthony Watts, et al. (2012) did an excellent study on this.
Hence, if one follows the Scientific Method the IPCC AGW Hypothesis must be rejected for the Null Hypothesis based on the superior satellite and balloon observations. Anyone who clings to the IPCC AGW Hypothesis is not only wrong but they are being anti-scientific !
It’s actually simpler than this.
Until such time as a statistically significant correlation of CO2 and temperature is presented, the Null Hypothesis is “presumed to be true.”
A predictive model run of at least 30 years with temperature observations tracking the model mean would nullify the null hypothesis. However, in order to do this, they would have to construct models that resulted in a much lower climate sensitivity… And this would “stick a fork” in the climate “crisis.”
In my masters research, I found many statistically significant correlations and they were all meaningless – mathematically true and behaviorally useless.
It is not that I am too heavy; it is that I am too short for my weight.
Me too! And my shortness is not related to my behavior… 😉
A fine article. But I think you missed an opportunity to introduce an even more basic argument.
The accepted theory (for the most part by both sides) is that doubling of CO2 has a direct effect equivalent to 3.7 w/m2. This translates into just over 1 degree of warming (sans feedbacks). That needs to be put into the context of our current timeline which can be directly confirmed by direct observations, namely that:
o We are currently at ~ 400 ppm
o CO2 concentration is increasing at ~ 2 ppm per year
That means, to experience just one degree of direct warming from CO2 increases will take two hundred years. To get to two degrees of direct warming from CO2 at present rates of increase would take six hundred years.
Of course there are feedbacks which are controversial. But if they were large, they would be easily observable in the current data. They aren’t. If they exist at all they are swamped by natural variability. So, we are left with a problem that based on both theory and observable data is not only small, but moving so slowly that it will take centuries to appear in any meaningful fashion. All the rest is hype.
CO2 is logarithmic. The catastrophe argument should have died on that fact alone.
A correlation of the high resolution DE08 ice core and Moberg’s reconstruction yields a climate sensitivity of 1.5 to 2.0 °C.
http://i90.photobucket.com/albums/k247/dhm1353/LawMob3.png
However, this assumes that all of the warming since 1830 was driven by CO2… At least half of that warming was clearly not related to CO2.
David, I think although admittedly well-argued, your article ignores some well-established science that climate change will lead to 1) higher beer prices http://www.citizen-times.com/story/news/politics/elections/2016/01/27/noaa-global-warming-may-affect-your-beer-and-its-price/79400280/ , 2) more hookers http://dailycaller.com/2013/04/30/democrats-global-warming-means-more-hookers/ , and mutant frogs https://wattsupwiththat.com/2012/10/25/now-its-the-frogs-affected-by-climate-change-again/ — I could go on…
I gave up beer for bourbon and red wine a long time ago.
More hookers and mutant frogs could be a problem in some neighborhoods.
David,
Scotch might have fewer calories, given bourbon’s sweetness and derivation from corn rather than barley. That’s not why I prefer it, but it might become and excuse.
If the mutant frogs have larger legs, I’m all for them.
If the hookers stay off the streets and indoors cooking frogs’ legs and taking antibiotics, the problem is greatly reduced.
Chimp, be careful hat you wish for !!
 &sp=5163d006c945bf2f3c45fb19a1fda082
The population dynamics of Adélie and emperor penguins are strongly influenced by the Antarctic environment and climatic variation. Based on the heterozygous sites identified in the penguin genomes, we used the pairwise sequentially Markovian coalescent (PSMC) method [30] to infer fluctuations in the effective population sizes of the two penguins from 10 MYA to 10 thousand years ago (KYA). From 10 MYA to 1 MYA, both species had relatively small and stable effective population sizes of <100,000, and the populations expanded gradually from ∼1 MYA (Figure 1B). The effective population size of the Adélie penguin appears to have increased rapidly after ∼150 KYA, at a time when the penultimate glaciation period ended and the climate became warmer. This expansion is consistent with the prediction in a previous study based on mitochondrial data from two Adélie penguin lineages [31] and with the recent observations that Adélie populations expanded when more ice-free locations for nesting became available [32]. Notably, at ∼60 KYA, within a relatively cold and dry period called Marine Isotope Stage 4 (MIS4) [33] in the last glacial period, the effective population size of Adélie penguins declined by ∼40% (Figure 1B and C). By contrast, the effective population size of emperor penguin remained at a stable level during the same period.
https://academic.oup.com/gigascience/article-lookup/doi/10.1186/2047-217X-3-27
Climate is controlled by natural cycles. Earth is just past the 2004+/- peak of a millennial cycle and the current cooling trend will likely continue until the next Little Ice Age minimum at about 2650.See the Energy and Environment paper at http://journals.sagepub.com/doi/full/10.1177/0958305X16686488
and an earlier accessible blog version at http://climatesense-norpag.blogspot.com/2017/02/the-coming-cooling-usefully-accurate_17.html
Here is the abstract for convenience :
“ABSTRACT
This paper argues that the methods used by the establishment climate science community are not fit for purpose and that a new forecasting paradigm should be adopted. Earth’s climate is the result of resonances and beats between various quasi-cyclic processes of varying wavelengths. It is not possible to forecast the future unless we have a good understanding of where the earth is in time in relation to the current phases of those different interacting natural quasi periodicities. Evidence is presented specifying the timing and amplitude of the natural 60+/- year and, more importantly, 1,000 year periodicities (observed emergent behaviors) that are so obvious in the temperature record. Data related to the solar climate driver is discussed and the solar cycle 22 low in the neutron count (high solar activity) in 1991 is identified as a solar activity millennial peak and correlated with the millennial peak -inversion point – in the RSS temperature trend in about 2004. The cyclic trends are projected forward and predict a probable general temperature decline in the coming decades and centuries. Estimates of the timing and amplitude of the coming cooling are made. If the real climate outcomes follow a trend which approaches the near term forecasts of this working hypothesis, the divergence between the IPCC forecasts and those projected by this paper will be so large by 2021 as to make the current, supposedly actionable, level of confidence in the IPCC forecasts untenable.””
Here is another excerpt from the paper;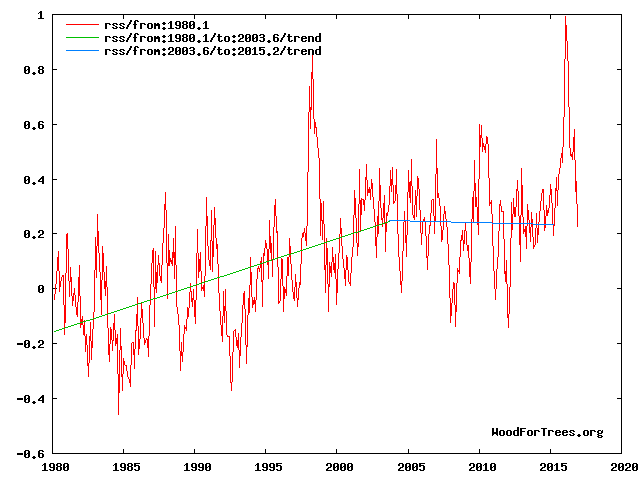
Any discussion or forecast of future cooling must be based on a wide knowledge of the most important reconstructions of past temperatures, after all, the hockey stick was instrumental in selling the CAGW meme to the grant awarders, politicians, NGOs and the general public.
The following papers trace the progressive development of the most relevant reconstructions starting with the hockey stick: Mann et al 1999. Fig. 3 (10), Esper et al 2002 Fig. 3 (11), Mann’s later changes – Mann et al 2008 Fig. 3 (12), and Mann et al 2009 Fig. 1 (13). The later 2012 Christiansen and Ljungqvist temperature time series of Fig. 3 is here proposed as the most useful “type reconstruction” as a basis for climate change discussion. For real world local climate impact estimates, Fig 3 shows that the extremes of variability or the data envelopes are of more significance than averages. Note also that the overall curve is not a simple sine curve. The down trend is about 650 years and the uptrend about 364 years. Forward projections made by mathematical curve fitting have no necessary connection to reality, particularly if turning points picked from empirical data are ignored.
Figure 4 illustrates the working hypothesis that for this RSS time series the peak of the Millennial cycle, a very important “golden spike”, can be designated at 2003.6
The RSS cooling trend in Fig. 4 and the Hadcrut4gl cooling in Fig. 5 were truncated at 2015.3 and 2014.2, respectively, because it makes no sense to start or end the analysis of a time series in the middle of major ENSO events which create ephemeral deviations from the longer term trends. By the end of August 2016, the strong El Nino temperature anomaly had declined rapidly. The cooling trend is likely to be fully restored by the end of 2019.
From Figures 3 and 4 the period of the latest Millennial cycle is from 990 to 2004 – 1,014 years. This is remarkably consistent with the 1,024-year periodicity seen in the solar activity wavelet analysis in Fig. 4 from Steinhilber et al 2012 (16).
A very good review of solid points. I question only one and not for its effect on the bottom line of your work.
“Humans are responsible for at least half of this rise in atmospheric CO2.”
If Salby, Humlum, Harde, and Hertzberg are right Our CO2 is not even controlling atmospheric content and the net AGW due to CO2 has to be small enough to make it indecipherable from the noise in the measurements. With CO2 following the integral of temperature (Salby) and temperature leading CO2 on short time scales (Humlum) I find the model based attribution statements of over 50% unconvincing. The IPCC position that all the increase in CO2 since the industrial age is from anthropogenic causes is not based on very convincing evidence. A very small variation in natural carbon sinks could completely mask the fossil fuel source.
I think that attribution studies need,at a minimum, to seriously consider these claims and a realistic and thorough analysis of the carbon cycle. For starters the residence time of CO2 from the nuclear test ban treaty is less than 10 years not 200 as used in the Bern model.
Atmospheric residence time is short. On the order of 5-10 years. However, the residence time of individual CO2 molecules isn’t very relevant. The “e-folding” time is what matters. We have been taking carbon out of geologic sequestration (coal, oil, natural gas) and putting it back into the active carbon cycle (atmosphere, oceans, soil, biosphere). It takes many decades to hundreds of years for the carbon to return to geologic sequestration (lime muds, etc.).
The geological sequestration time of 100y+ is not relevant. At the instant any single atom of carbon is taken out of the atmosphere by an animal or plant and sequestered into the structure of the plant then that atom of carbon is “off the list” with respect to any effect on the atmosphere. So what is relevant is the planet wide daily plant and animal extraction of atmospheric CO2. There will be some loss back to the atmosphere in plant/animal decay but a good proportion that has been “stuck” in the organic structures will stay there for a very long time. A careful study of the biosphere part of the carbon cycle might enable us to put some numbers on this. Keep remembering though it is not the moment that the carbon atom becomes coal/oil that is important but the moment the atom is “sucked” out of the atmosphere initially.
Your “e-folding” time is observed directly from the 14CO2 time curve starting at the 1963 atomic test ban treaty. The bomb 14CO2 was the pulse, and is measured very accurately in both hemispheres.
The 14CO2 of the atmosphere declined by one-half from the peak in 1964 to 1974.
That means that all atmospheric CO2 is removed to “permanent” geological sinks very rapidly.
This 10 year period is equivalent to a “tau” or “e-folding” time of 16 years. That is not a calculation, it is an observed fact.
CO2 never accumulates in the atmosphere on any time scale, from any source. Atmospheric CO2 is a transient stream from very deep sources to very deep sinks. Oceans, biological and geological.
And science still doesn’t know what all the sinks are or might be.
CAGW is anti-science, in the same class with ID, if not quite YE creationism. Yet.
But give them time. When earth starts dramatically cooling again, as in the ’40s, ’50s, ’60s and ’70s, despite rising CO2, then we’ll probably see lying of biblical proportions.
I wouldn’t classify GAGW as quite that bad… But it’s close.
David,
I’ll grant that CAGW is more science-y than YEC, but it’s still contrary to the scientific method.
That is the thrust of this thread.
For which I and so many others thank you.
@BW,
14C isn’t a stable isotope.
DMA,
And the OCO-2 satellite maps don’t make a compelling argument that the urban areas are the major source of CO2. It seems that the CO2 is largely biogenic and from outgassing in the tropical seas.
Outgassing is, by far, the largest source… As big as all the other sources combined… About 20 times that of anthropogenic emissions.
The difference is that we are taking a tiny bit of carbon out of geologic sequestration every year and putting it back into the active carbon cycle.
Clyde
If you check out Ole Humlum’s web site, http://www.climate4you.com/, you see in depth analysis of the CO2 variation over time with respect to temperature. He has demonstrated a clear lag and categorically states the atmospheric CO2 is “(6) CO2 released from anthropogene sources apparently has little influence
on the observed changes in atmospheric CO2, and
changes in atmospheric CO2 are not tracking changes in human
emissions.”
This aligns with Salby’s work and further reduces the acceptability of AGW along with the other valid points made in this article.
David,
You said, “The difference is that we are taking a tiny bit of carbon out of geologic sequestration every year and putting it back into the active carbon cycle.” I’m well aware that humans are accelerating the rate at which CO2 is produced from geologic materials such as fossil fuels and limestone.
However, the point is that, as you yourself remarked, these physical processes don’t proceed in a bottle in a laboratory. In the real world, there are numerous interactions — feedbacks — that control the overall impact.
As Robert of Ottawa has already observed, when humans produce CO2 one of the consequences is to increase the partial pressure of CO2 at the surface of the ocean, thereby reducing the diffusion rate of outgassing CO2. Therefore, humans may be shifting the location and magnitude of the sources and sinks, but not so much changing the balance. It matters not where the CO2 comes from, it matters only if humans are truly increasing the amount above what would be expected in a warming world. If the world is warming for other reasons, then one would expect outgassing to increase CO2 coincidentally with human production of it.
The AGW theory predicts that most of the warming should occur at night and in the Winter. However, in recent years, the diurnal highs have been increasing faster than the lows. That would appear to be a different process controlling that, but it would explain an increase in atmospheric CO2.
Cooling at night is regulated by water vapor to dew point temperature. Dew points went up when the amo cycle in 2000 positive, as well as the various positive pdo’s the last 20 years.
Min temp follows dew point.
micro6500,
I agree that dew point (and clouds) will impact night-time cooling. However, it is central to the AGW theory that CO2 plays a similar role.
Which is why it is wrong.
the partial pressure of CO2
===========
at the partial pressure of CO2 increases, it becomes harder for water to evaporate, reducing the amount of water in the atmosphere.
I have no quarrel with that part of the analysis. But I can’t find any error in Salbys carbon flux analysis and think that minor natural variations in CO2 sources and sinks, each 30 to 50 times the volume of anthropogenic sources, could just as easily explain the recent rise. If A CO2 was the only source of the rise why , in 2002 when it changed rate by a factor of 3 did the rate of change of atmospheric CO2 not change. Same for the last 3 years when A CO2 flattened out but had no measurable effect on rate of rise in the atmosphere. It is almost like we are saying the fossil fuel emission rate controls the natural sink rate in order to keep the growth in the atmosphere steady.
The sink rate has varied with the emissions. It actually appears to be increasing over time:
http://i90.photobucket.com/albums/k247/dhm1353/Law1600.png
During the mid-20th century cooling, the sink rate increased and “consumed” more than a decade’s worth of CO2 emissions.
http://i90.photobucket.com/albums/k247/dhm1353/Law19301970.png
https://wattsupwiththat.com/2012/12/07/a-brief-history-of-atmospheric-carbon-dioxide-record-breaking/
David M.
Salby shows that sink rate is a function of atmospheric CO2 content. It will rise as CO2 increases but is sensitive only to content not source. If the rise in CO2 is mostly natural the change of sink rate is mostly natural. The anthropogenic portion is proportional to the ratio of anthropogenic to natural atmospheric content. This calculation is where the residence time is important.
The CO2 sink rate should vary as a percentage of total CO2, because the sink cannot distinguish between human and natural CO2. But instead the sink rate remains a percentage of the increase in human emissions.
this suggests the CO2 sink is not a sink at all.
Fred, the amount of co2 that is missing from the official sources is enormous. From 1998 till now all of the co2 produced above the 1998 level is gone. The sinking is the base plus. This when 38 % of all anthropogenic co2 has been produced. If this rate continues, even with production, the co2 ppm per year will become negative. I am really surprised that 2016 came in at 3 ppm. It should have been 5 at the very least. I would have been ok at 4, but not 3.
Abstract
Environmental change drives demographic and evolutionary processes that determine diversity within and among species. Tracking these processes during periods of change reveals mechanisms for the establishment of populations and provides predictive data on response to potential future impacts, including those caused by anthropogenic climate change. Here we show how a highly mobile marine species responded to the gain and loss of new breeding habitat. Southern elephant seal, Mirounga leonina, remains were found along the Victoria Land Coast (VLC) in the Ross Sea, Antarctica, 2,500 km from the nearest extant breeding site on Macquarie Island (MQ). This habitat was released after retreat of the grounded ice sheet in the Ross Sea Embayment 7,500–8,000 cal YBP, and is within the range of modern foraging excursions from the MQ colony. Using ancient mtDNA and coalescent models, we tracked the population dynamics of the now extinct VLC colony and the connectivity between this and extant breeding sites. We found a clear expansion signal in the VLC population ∼8,000 YBP, followed by directional migration away from VLC and the loss of diversity at ∼1,000 YBP, when sea ice is thought to have expanded. Our data suggest that VLC seals came initially from MQ and that some returned there once the VLC habitat was lost, ∼7,000 years later. We track the founder-extinction dynamics of a population from inception to extinction in the context of Holocene climate change and present evidence that an unexpectedly diverse, differentiated breeding population was founded from a distant source population soon after habitat became available.
http://journals.plos.org/plosgenetics/article?id=10.1371/journal.pgen.1000554
David, you write:
No. It is pretty easy to test the validity of the AGW conjecture (it is not an hypothesis, it is mere speculation) against real-world data. All you need to know is what the idea of “global warming” as an effect of a so-called “enhanced GHE” is actually claiming as its “warming mechanism”. Here it is:
http://www.climatetheory.net/wp-content/uploads/2012/05/greenhouse-effect-held-soden-2000.png
The postulated “greenhouse warming mechanism” is a very specific one. It is the one about the “raised ERL” (Effective Radiating Level) of the Earth, Z_e in the figure above. In the words of Raymond T. Pierrehumbert:
https://geosci.uchicago.edu/~rtp1/papers/PhysTodayRT2011.pdf
“An atmospheric greenhouse gas enables a planet to radiate at a temperature lower than the ground’s, if there is cold air aloft. It therefore causes the surface temperature in balance with a given amount of absorbed solar radiation to be higher than would be the case if the atmosphere were transparent to IR. Adding more greenhouse gas to the atmosphere makes higher, more tenuous, formerly transparent portions of the atmosphere opaque to IR and thus increases the difference between the ground temperature and the radiating temperature. The result, once the system comes into equilibrium, is surface warming.”
What we want to look for, then, is the following:
Over time, T_s (and T_tropo) should be observed to go up while the T_e should either be observed to stay flat, or at least follow a significantly lower trend than the T_s/T_tropo.
We can track T_s and T_tropo over time, but how do we keep track of T_e? Well, T_e is directly associated with Earth’s average emission flux to space, that is the OLR at the ToA. T_e is, after all, not a real temperature, it is rather Earth’s average emission flux to space expressed as a temperature, via the Stefan-Boltzmann equation. Earth’s OLR to space (basically, its planetary heat loss (Q_out)) very nearly balances the average incoming heat flux from the Sun (Q_in), the ASR (TSI minus refl SW (albedo)), which is ~239 W/m^2.
239 W/m^2 translate into a T_e of 255K. So if T_e stays the same over time, it means that the OLR stays flat also. Or, if there is warming caused by other processes, such as increased solar heating, the OLR will be observed to go up, but we will still expect it to rise LESS over time than the corresponding surface and tropospheric temps. Actually, tropospheric temps (T_tropo) are a better gauge in this regard than surface temps (T_s), since ~85% of Earth’s outgoing long-wave radiation through the ToA to space originates from the troposphere, which means that the OLR flux is chiefly tied – at least over time – simply to the average tropospheric temperature.
Why exactly do we expect the OLR to rise less than the corresponding T_tropo over time? Refer again to the Held/Soden schematic above, plus take in what Pierrehumbert is saying here (same link as above):
“The greenhouse effect shifts [Earth’s] surface temperature toward the [Sun’s] photospheric temperature by reducing the rate at which the planet loses energy at a given surface temperature. The way that works is really no different from the way adding fiberglass insulation or low-emissivity windows to your home increases its temperature without requiring more energy input from the furnace. The temperature of your house is intermediate between the temperature of the flame in your furnace and the temperature of the outdoors, and adding insulation shifts it toward the former by reducing the rate at which the house loses energy to the outdoors.”
THAT’S the postulated “greenhouse warming mechanism” right there. At a given T_s (and T_tropo), making the atmosphere more opaque to outgoing surface IR, will REDUCE its heat loss to space (that’s the OLR at the ToA). And so, in order for the OLR to NOT reduce, but rather stay the same, still in balance with the heat input from the Sun, the T_s/T_tropo needs to RISE, because higher temps means more thermal radiation (IR) is emitted. That way, over time, T_s/T_tropo would be observed to rise gradually, while T_e (OLR) would stay quite unchanged. That’s the so-called “radiative forcing” in theoretical operation.
However, is this something we see in the real Earth system? Can we find this AGW signal anywhere?
The simple answer is: Nope. Everything seems to be working EXACTLY the way one would expect if there weren’t an “enhancement” of some “GHE” going on in the Earth system. The OLR at the ToA has simply gone up in step with the T_tropo over the last 32+ years, according to the available ToA radiation flux data (ERBS Ed3_Rev1+CERES EBAF Ed4, corroborated by HIRS and ISCCP FD):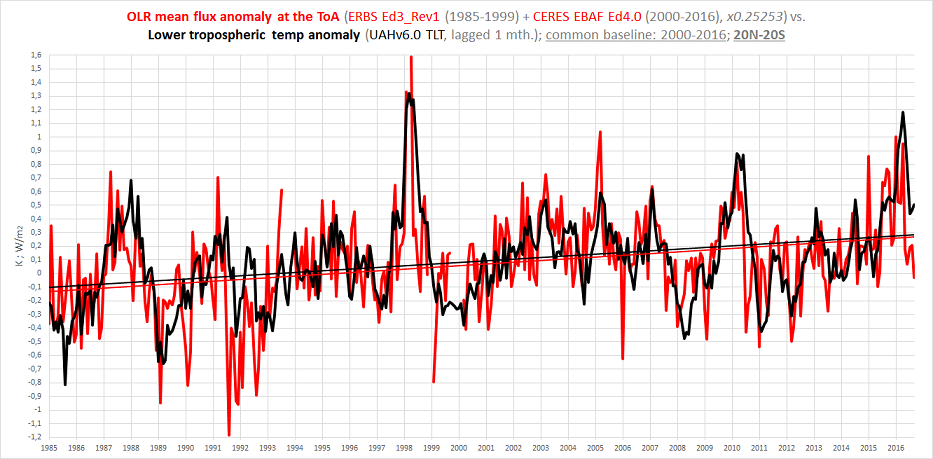
A controlled experiment would require two planet Earth’s. One planet would be subjected to an increase in atmospheric CO2 and the second Earth would be the “control” planet and not subjected to an increase in atmospheric CO2.
David,
I’m not sure I understand your position.
Our one planet HAS been “subjected to an increase in atmospheric CO2” over the last decades, and there are definite predictions made by the “enhanced GHE hypothesis” as to what we would expect to observe in the Earth system given such an increase. These are predictions we can test directly against the actual available observational data from the REAL Earth system.
Over the last 32 years, the total atmospheric content of CO2 increased by 17%, or about half (!!) of the entire rise since pre-industrial times. To make matters worse, during the same period of time, the total tropospheric content of water vapour (TPW) also increased substantially, by at least 1.5kg on average on top of each m^2 of surface (or about 5%).
This rather consistent and, quite frankly, remarkable rise (since 1985) in the overall atmospheric concentration of IR-active gases, so-called “GHGs”, should – in theory – have strengthened the so-called “greenhouse effect” immensely, by reducing earth’s radiative heat loss to space at any given (altitude-specific) temperature through the raising of our planet’s ERL (“effective radiating level”) to space, and thus constitute a clear cause of warming.
However, we do not observe ANY systematic reduction in OLR relative to tropospheric temps from 1985 to 2016. There is no trace of any “enhanced GHE”, theoretically assumed to be caused by the considerable increase in atmospheric “GHG” concentration, anywhere in the real-world radiation flux data. The OLR is simply found to track tropospheric temps over time, the latter clearly the cause and the former a mere effect.
And so there is an obvious problem with the ‘theory’ … It does not match the real-world observations. The warming is clearly natural. And we know (again from the real-world data) what did it. The Sun:


(ToA solar heat in (Q_in(SW), TSI minus refl SW (albedo).)
(ToA Earth heat loss to space (Q_out(LW)).)
(ToA net flux (Q_in(SW) minus Q_out(LW)).)
Our current positive radiative (heat) balance at the ToA is caused in full by an increase in Q_in(SW) and rather countered somewhat by a simultaneous increase in Q_out(LW), the obvious causal chain being:
+ASR => +T => +OLR
As we know that a 2 planet experiment is currently impractical (Magrathean delivery time too long) we have no choice but to look at the one we have got. So Kristian has exactly the right idea, look for an AGW/CO2 radiative forcing “signal” in something we can observe/measure. I do like the T-s/T-tropo consideration but for some reason at the back of my mind I feel we need to have a bit of a handle on the time constant involved here. How long, for a specific CO2 concentration, do we have to wait for the earth to heat up and restore the effective temperature i.e. get the outgoing radiation to space back up to the figure to match incoming? Not sure I have seen this time constant discussed on either side of the debate but I get the feeling the AGW crowd think this is a thing that happens over years. I suspect it is massively shorter, the red and black curves in Kristians graph match so well it suggests very little time lag and from experience the heating/cooling of land and oceans over the seasons seems pretty rapid too (otherwise you wouldn’t see different seasonal temperatures).
The Badger, you ask:
According to the “enhanced GHE hypothesis” and its “raised ERL” warming mechanism, there is no discernible time lag between “forcing” and “temp rise”. That is precisely why we do not expect to see a reduction in OLR (T_e) over time. It is supposed to stay – observably – constant while the T_s/T_tropo rises.
This is what people tend to “forget”. In the real world, the slow, gradual increase in atmospheric CO2 is specifically NOT supposed to result in a reduction in OLR over time, because it is all supposed to happen incrementally, and so as the extra increment of CO2 input reduces the outgoing IR a tiny bit, the temperature is rather at once forced to rise a tiny bit, and by that letting the Earth system rid itself of the energy that was initially held back, RESTORING THE HEAT BALANCE at each incremental step. The next increment of CO2 input arrives, forcing T to rise a tiny bit more, restoring the balance once again. And so on and so forth. What we will OBSERVE over time, then, is simply a stable radiative balance at the ToA (SW in = LW out) with NO net accumulation of energy inside the Earth system as a whole, but with steadily rising Earth system temperatures at each altitude-specific level (from sfc to tropopause) all the same. How is this? Earth’s “effective radiating level” (ERL) is raised, not in giant leaps (as if the atmospheric CO2 content were doubled overnight), but slowly and gradually over time, maintaining a constant Earth T_e to space, but forcing the T_s to rise (via the lapse rate). THAT’S the postulated “greenhouse” warming mechanism, after all:
http://www.climatetheory.net/wp-content/uploads/2012/05/greenhouse-effect-held-soden-2000.png
And so, observing a positive radiation imbalance at the ToA is specifically NOT a sign of an “enhanced GHE”, but of something else. And this “something else” is of course – as the ToA radiation flux data shows us – an increase in ASR (“absorbed solar radiation”), the solar heat input to the Earth system.
Law Dome CO2 vs instrumental records
The Law Dome CO2 is low pass filtered by diffusion and compression averaging out decades or more.
In contrast, the Keeling CO2 data is not. NOAA patches Law Dome to Keeling curve – to give a misleading apples/oranges curve implying very rapid recent rise vs slow ancient changes – when all fast paleo changes were filtered off.
The DE08 core at Law Dome actually has a fairly high resolution, possibly as good as 10 years.
So, as long as the Keeling curve is filtered with at least a 10-yr average, it can be directly compared to the DE08 core.
Now, the older, deeper cores, with record lengths clearly should never be spliced onto the instrumental data or the DE08 core.
https://wattsupwiththat.com/2017/03/28/breaking-hockey-sticks-antarctic-ice-core-edition/
David Middleton While you can see 10 yr resolution – there is still diffusion smoothing out the variations.
The delta between the ice and gas ages is 30 years in the DE08 core. At the very worst, the smoothing is 30 years. Firn densification models suggest that the smoothing could be on the order of 10 years. MacFarling-Meure present the data as a 20-yr spline fit.
It’s really difficult to pin down exactly what the gas resolution is.
without correlation you simply cannot have causation … period, full stop … 1940 – 1970 … CO2 Up, Temperature Flat or Down … no correlation … CO2 (alone) cannot be causation of rising temperatures …
There is some correlation over longer periods of time. The DE08 core (red curve) exhibits a fair correlation since 1830:
http://i90.photobucket.com/albums/k247/dhm1353/LawMob2.png
However, the natural variability of temperature changes dwarfs the CO2 effect.
And the high resolution DE08 ice core actually indicates a pause or possible drop in atmospheric CO2 in the 1940’s and 1950’s.
https://wattsupwiththat.com/2012/12/07/a-brief-history-of-atmospheric-carbon-dioxide-record-breaking/
http://i90.photobucket.com/albums/k247/dhm1353/Law19301970.png
The R squared value of 0.32 shown in your graph is way to low to indicate any possible correlation between CO2 concentration and temperature anomaly.
0.32 is actually a fairly strong R-squared. About 1/3 of the observations fit the trend. This would imply that up to 1/3 of the warming since 1830 could be related to the rise in CO2.
I was studying the ACS Climate Change tool kit sections on the single and multilayer theories (what I refer to as the thermal ping-pong ball) of upwelling/downwelling/”back” radiation and after seeing a similar discussion on an MIT online course (specifically says no transmission) have some observations.
These layered models make no reference to conduction, convection or latent heat processes which leads me to conclude that these models include no molecules, aka a “non-participating media,” aka vacuum. This is a primary conditional for proper application of the S-B BB ideal, i.e. ε = 1.0, equation.
When energy strikes an object or surface there are three possible results: reflection or ρ, absorption or α, transmission or τ and ρ + α + τ = 1.0.
The layered models use only α which according to Kirchhoff is equal to ε. What Kirchhoff really means is that max emissivity can equal but not exceed the energy absorbed. Nothing says emissivity can’t be less that the energy absorbed. If α leaves as conduction/convection/latent (net macro floes, non-thermodynamic equilibrium) than ε will be much less than 1.0.
These grey bodied layered models then exist in a vacuum and are 100% non-reflective, i.e. opaque, surfaces, i.e. just like the atmosphere. NOT!
So the real atmosphere has real molecules meaning a “participatory” media and is 99.96% transparent i.e. non-opaque.
Because of the heat flow participating molecules only 63 W/m^2 of the 160 W/m^2 that made it to the surface leave the surface as LWIR. (K-T Figure 10)
63 W/m^2 and 15 C / 288 K surface gives a net effective ε of about 0.16 when the participating media is considered. (BTW “surface” is NOT the ground, but 1.5 m ABOVE the ground per WMO & IPCC AR5 glossary.)
So the K-T diagram is thermodynamic rubbish, earth as a ball in a bucket of hot mush is physical rubbish, the Δ 33 C w/ atmosphere is obvious rubbish, the layered models are unrelated to reality rubbish, the ground losing 396 W/m^2 is rubbish.
The atmosphere is not in thermodynamic equilibrium and as a consequence neither Stephan Boltzmann nor Kirchhoff can be a used the ways the GHE theory applies them.
What support does the GHE theory have left besides rabid minions?
I see no reason why GHE theory gets a free pass on the scientific method.
https://www.acs.org/content/acs/en/climatescience/atmosphericwarming.html
http://web.mit.edu/16.unified/www/FALL/thermodynamics/notes/node136.html
http://writerbeat.com/articles/14306-Greenhouse—We-don-t-need-no-stinkin-greenhouse-Warning-science-ahead-
http://writerbeat.com/articles/15582-To-be-33C-or-not-to-be-33C
https://en.wikipedia.org/wiki/Kirchhoff%27s_law_of_thermal_radiation
The condition of thermodynamic equilibrium is necessary in the statement, because the equality of emissivity and absorptivity often does not hold when the material of the body is not in thermodynamic equilibrium.
https://en.wikipedia.org/wiki/Thermodynamic_equilibrium
In thermodynamic equilibrium there are no net macroscopic flows of matter or of energy, either within a system or between systems.
In non-equilibrium systems, by contrast, there are net flows of matter or energy. If such changes can be triggered to occur in a system in which they are not already occurring, it is said to be in a metastable equilibrium.
This is the “Multiple Rubbish” criticism. And I think you are entirely right. The whole CAGW edifice was built upon very dodgy foundations and as it progressed through the years it had to be seriously fudged in order to continue. It’s quite baffling to me too as to how it carried on like this for so long but I do remember things like multiple murderers (Harold Shipman) and think well, they got away with it for a few years so they just continue in the same tried and tested manner. You do get some really silly stuff come out like the Trenberth diagrams and this is a good area to attack whenever you see it. Graphs and diagrams are often used to convince school children and students and I find it a productive area to shine a light on. Try asking students as an exercise to produce , based on NASA’s Trenbeth diagram, two new diagrams showing the energy budget in daytime and in night time. It can be a bit cruel but sometimes reminds me of a shed full of headless chickens.
All we have to do is keep adding epi-cycles.
1. Atmospheric CO2 concentration does impact temperature. However, the logarithmic nature of the impact means that significant increases in CO2 concentration from current levels will only have a modest impact on temperature much of which will be lost in the noise from other temperature drivers (orbital physics of the earth being one).
2. The anthropogenic contribution to atmospheric CO2 concentration and is far outweighed by other contributors, particularly ocean outgassing cycles and the impact of changing ocean temperatures – the solubility of CO2 in water declines as the water temperature increases.
3. The notion that atmospheric CO2 levels were in equilibrium, up until about 50 years ago, and that the pre-industrial level was 280ppm for as far back as we can go is bunk. The IPCC decreed that accurate chemical measurements prior to the late 1950’s were not reliable and substituted results from ice core records for the pre late 1950’s period. Ice core records do not accurately reflect historic CO2 levels which are in packed by many ice core specific problems (Google it). Substituting a proxy (which has many problems in accurately reflecting CO2 concentrations) is the same approach as Michael Mann used in creating the “hockey stick.”
4. The most useful information provided by ice cores in this regard is that rising temperatures precede increases in CO2 concentration (see 2 above).
4. Accurate chemical analyses of CO2 levels in the atmosphere have shown that in the 200 years before the late 1950’s the CO2 concentration was around or over 400ppm on 3 seperate occasions (see Beck, 2007 report on over 90,000 chemical analyses).
5. In creating the CO2 hockey stick by appending actual recent measurements to an inaccurate proxy we rely largely on the CO2 readings from the side of the Muana Loa volcano in Hawaii for the actual readings. This, due to its location, has accuracy problems.
6. So, man influences CO2 levels in the atmosphere – bu not much. At current atmospheric CO2 levels, changes in the concentration will affect temperature but not much. The present levels of CO2 have existed 4 times in the past 200 years with no discernible impact on global temperatures.
7. It’s pretty straightforward isn’t it?
The chemical records are not accurate because of where they were taken.
They did accurately measure the CO2 concentrations of the place taken. However the place taken was not representative of the planet.
The problem is with thinking of plate tectonics and evolution as scientific theories, it makes the category too broad to be meaningful. Evolution by natural selection is a description of a process that is necessarily true in the mathematical sense, plate tectonics is the best available description of an observed phenomenon in terms of Occam’s razor. To call these theories is like calling Mount Everest a theory, or 1+1=2 a theory. It doesn’t make sense and leads people to make incorrect assumptions about the nature of scientific theories, what they should look like and how they should behave.
This is only a problem for the people who don’t understand what a scientific theory is. A scientific theory is not a guess. It is not a hypothesis. It is a systematic explanation of the observations.
Mount Everest and the rest of the Himalayan Mountains are observations which provide evidence for the scientific theory of plate tectonics.
There is no possibility that Mount Everest could be “modified or overturned if warranted by new evidence and perspectives.” It wasn’t modified when plate tectonics supplanted the geosynclinal theory of mountain building. Mount Everest was totally unaffected by the paradigm shift.
Well distinguished.
However today, what were once insights requiring evidence and inference, such as “continental drift”, “descent with modification”, germs, atoms and heliocentrism, are not just well-supported theories but also observable facts. Scientists can actually measure the plates moving and see subduction and mountain upthrust occur, not just infer it from indirect evidence, for example.
If plate tectonics and evolution were not subject to being “modified or overturned if warranted by new evidence and perspectives,” they would cease to be scientific theories. They would lose the quality of falsifiability and no longer fall under the realm of science.
The theories are indeed subject to confirmation or falsification. The facts however are not, unless shown to be faulty observations.
That tectonic plates move thanks to seafloor spreading is now an observation. “Continental drift” was a theory without a good explanation until the discovery of seafloor spreading. (As was evolution before the discovery of natural selection.) The fact of plate motion will remain whether the hypothesis of superplumes within the theory of tectonics be validated or not.
And how could an observation overturn evolution by means of natural selection? It is a mathematical necessity.
Your definition (and conception) of a scientific theory is wrong, at least in the Popperian terms to which I subscribe. A theory is most certainly not “a systematic explanation of the observations”, but rather a prohibition. A good theory is one with clearly defined failure mode.
We have already established that the theory of evolution cannot fail. But what of the theory of plate tectonics? Well, the problem is that theory doesn’t say, exactly, it is just a (particularly good) description of observation, not a theory as such. A similar question would be “What do you need to see in order to be convinced that Mount Everest doesn’t exist?” We are free to modify our notion of what it is for Mount Everest to exist or for plate tectonics to be at work without a prior clearly defined line at which point we are bound to abandon the notion.
A theory is the definition, in precise terms, of that boundary.
If evolution can’t be falsified, it isn’t science.
http://staff.washington.edu/lynnhank/Popper-1.pdf
The discovery of fossils, real fossils, which totally contradicted the scientific theory of evolution would falsify it.
“If evolution can’t be falsified, it isn’t science.”
There are lots of things IN science that can’t be falsified, math to name the biggie. Popper, incidentally, did hold that evolution did not constitute a theory as such. But you have to understand why. There are many theories that do employ the unfalsifiable PRINCIPLE of evolution by means of natural selection, and these are very falsifiable and properly scientific.
But thinking of evolution as a theory per se is not really commensurate with the Popperian definition of theories.
https://ncse.com/cej/6/2/what-did-karl-popper-really-say-evolution
Just to be clear, I think that article I link also misses the subtlety of Popper’s scheme. Yes, he was made to retract in the end, but I suspect it is simply because he felt the nuance of he saying was being missed in a political upheaval not unlike our present one with AGW.
“The fact that the theory of natural selection is difficult to test has led some people, anti-Darwinists and even some great Darwinists, to claim that it is a tautology. . . . I mention this problem because I too belong among the culprits. Influenced by what these authorities say, I have in the past described the theory as “almost tautological,” and I have tried to explain how the theory of natural selection could be untestable (as is a tautology) and yet of great scientific interest. My solution was that the doctrine of natural selection is a most successful metaphysical research programme. . . . [Popper, 1978, p. 344]”
Here is the key line:
“The theory of natural selection may be so formulated that it is far from tautological.”
Absolutely. But the PRINCIPLE of evolution by means of natural selection which Darwin tried to, and eventually did, establish, is. The problem is that that is what is commonly taught and communicated to laypersons and that is what causes the confusion. If you dig down into the meat of the matter you will find all sorts of very scientific, very falsifiable theories, which together constitute the THEORY of evolution by means of natural selection.
>>
Doug
April 18, 2017 at 2:02 am
There are lots of things IN science that can’t be falsified, math to name the biggie.
<<
Some statements stand out as pure nonsense. For example, there are many geometries (probably infinite). If you change the underlying postulates and axioms, then the geometry changes. The trick is to find the right set of axioms and postulates that describe our Universe.
Jim
Doug, your claim that math can’t be falsified is way too broad.
The lowest levels of “math” can’t be falsified.
1+1=2 is an axiom.
However the rest of math can be falsified if it can be shown that it does not follow from the axioms.
@MarkW > You have that backwards: Once you have established an axiom scheme like Zermelo-Fraenkel a substantial portion of math follows unfalsifably. The thing is that those axiom schemes are not provable within the axiom scheme itself. According to Quine, at least, math is empirical in principle, but in practice that amounts to little if anything. I would venture that math is little more than a conventional (if sometimes unwieldy) naming scheme for logically necessary relations. Whichever way you fall on this though, it is hard to even conceive of conditions under which the the mathematical principle of evolution by means of natural selection could ever be false. That inconceivable is enough for me to think it unfalsifiable too. But yes, it is a complex issue.
@jim > Yes, but I think that confuses math with the relation of math with the world. The multiple alternative geometries can’t be falsified as alternative geometries, but they certainly can be as descriptions of observation. In that case I think it is useful to distinguish between the principle (which is unfalsifiable) and the theory of the world which proceeds from that principle. So: The natural selection is a mathematical principle (unfalsifiable), but it is a (testable and falsifiable) theory that the natural selection acting in a certain way is responsible for a particular instance of speciation.
>>
Doug
April 18, 2017 at 4:12 pm
<<
Okay. Maybe someday I’ll be smart enough to understand your comment.
Jim
@jim It’s really not all that complicated. 1+1=2 is a mathematical truism from which follows the falsifiable theory that one object put together with another makes two objects (obviously false in the case of puddles of water).
1+1=2 is not a scientific theory, because it necessarily doesn’t talk about the world. Evolution by means of natural is also a mathematical truism, similar to the way that climate models are simple extrapolations from a numerical starting points. It only becomes a theory when you make testable predictions about the world.
>>
1+1=2 is a mathematical truism from which follows the falsifiable theory that one object put together with another makes two objects (obviously false in the case of puddles of water).
<<
I don’t see why it’s false in the case of puddles of water. If I’m just counting puddles, then 1+1=2 is valid. But you seem to be merging puddles when you find them. In that case you’re using the wrong math. Merging puddles is like “or-ing” them, and Boolean algebra works fine for that. The statement 1+1=1 is perfectly valid in Boolean. In fact, 1+1+1+1+ . . . +1=1 is also valid, and I can “or” as many puddles as I like.
Jim
The puddle isn’t a quantity.
1 oz. puddle + 1 oz. puddle = 2 oz. puddle
QED
What’s the length of the coast of England, if you use a mile long yardstick, vs a 12″ ruler?
A mile-long yardstick wouldn’t be a yardstick.
🙂 milestick? but that would just really confuse people, and they’d miss the point.
>>
The puddle isn’t a quantity.
<<
Sure it is. If you’re taking a census of puddles, there’s no need to measure their quantity and add them together. However, if you’re combining puddles and measuring the quantity in each case, then your example works too.
Jim
>>
What’s the length of the coast of England, if you use a mile long yardstick, vs a 12″ ruler?
<<
In this day and age, shouldn’t we be using a meter stick and a decimeter ruler? What if I used a 25′ tape measure instead?
Jim
lol Sure.
But not really the point. iirc when I read it, it was kilometers and grains of sand, and vastly different results.
The point is that the theory is that 1+1=2 applies in exactly that way to puddles however you treat them. The fact that finding that two puddles merge into one falsifies that theory under some conditions.
This is important because it relates exactly to the problem with using models as the basis for AGW: Starting with “settled” physics and then plug it into an algorithm does not constitute a theory. The theory is when you claim that that procedure can be read as a way to understand the world in such and such a way.
Let’s try this again: Of course you can interpret 1+1=2 to be correct in any given situation. That’s irrelevant. The only relevant point is that there is a conceivable situation wherein interpreting as 1+1=2 would be FALSE. That’s the point of falsifiability.
Within most axiom schemes of mathematics, though, there is no available interpretation under which 1+1=2 is false. Again the fact that you can conceive of an axiom scheme where it is false is irrelevant, going outside of a given scheme is changing the topic.
So, again, evolution, to the extent that it is a principle of mathematics within a given axiom scheme, is not a scientific theory, but a truism. Evolution, when applied to situations in which it could conceivably be false is a scientific theory.
The key point, the point Popper was trying to make, is that it doesn’t matter how much evidence you can muster in support of a theory, that is not the relevant test of a theories strength and status.
As I stated above, evolution and tectonics, like gravity, are both facts and theories explaining those facts, ie observations. The facts remain, while the theories may change to a greater or lesser extent.
Tectonics is a fact, ie an observation. Its presently measurable and its effects in the past can be inferred. We know that seafloor spreading is a proximate cause, but alternative hypotheses compete to explain ultimate causes, such as superplumes in the mantle driven perhaps by developments in the core.
Evolution is also a direct observation, plus an inescapable inference for some past events. However evolutionary theorists argue over the relative importance of “directional” evolution, ie driven by natural selection and similar processes, versus “stochastic” processes, such as genetic drift, the founder principle, reproductive isolation, etc.
The theory of universal gravitation was revolutionized by Einstein early in the 20th century, after not having undergone much refinement since the late 17th century. While the observations may remain valid, new hypotheses and theories may explain them better, along with new observations.
Chimp, your conversation with Mr. Middleton has been enjoyable and enlightening. One minor thing generates a source of occasional angst for me: the comparison of AGW with other theories, such as evolution, tectonics and in particular gravity. I would rather leave gravity out of the whole discussion, for several reasons. Many times I have seen the refrain “not believing in AGW is like not believing in gravity” and it sounds to me equivalent to “not believing lizard aliens live among us is like not believing the standard model of particle physics” – the two notions are completely different.
Having a little exposure to development of theories in physics (and some in the other “hard” sciences – biology and chemistry) I think a fairly useful paradigm is in use for the core concepts, of which gravity is one example. Feynman’s description of the development of physical theories is elegant and succinct: 1) articulate a specific, non-arbitrary, complete, mathematical expression (called a theory or model) of how a well-defined, observable physical phenomenon works, in terms of previously successful theoretical models such that 2) anyone can predict (and get the same result), by calculation with the specific expression, the result to be obtained from a controlled laboratory experiment in terms of observables that are non-arbitrary, well defined in physics, measurable by different methods, and different experimenters, and quantitative, with bounds that preclude other alternative expressions, and 3) the degree to which the theory predicts all quantities it should predict and the accuracy with which it predicts them is a measure of the success (or utility) of the theory. We could (but won’t here) talk about the process of modifying improvements of the theory, particularly Einstein’s, and also the successive accounting for deviations from the basic theory involving friction, dissipative forces, or rotating frames, as well as the shrinking error bounds on experiments such that alternative theories of gravity (to Einstein’s) are virtually excluded. They are excluded because of our ability to “control” the experiments so that all effects other than the gravitational effects are well predicted by other core theories. Further, the confirmations have been done using multiple phenomena to measure, i.e. lasers, atomic clocks, torsion balances, etc. so that confounding errors are essentially ruled out.
I think other analogies of climate science (or AGW) with physical theories might be more apt, such as cosmology, non-equilibrium statistical mechanics, thermodynamics of black holes, differing “interpretations” of quantum mechanics, etc. But I would much prefer to leave theories of the fundamental forces, e.g. gravity, out of the discussion. I like the analogy with evolution a bit more, but my preference would be to consider evolution more narrowly defined to be the change in gene frequencies in time (within specifically interacting reproductive groups), without worrying about whether we are descended from apes or what “caused” the A-T G-C structure of DNA to be so useful. We would still need to get specific about what we mean by “genes” in terms of the sub-units of whole genomes, frequency of occurrence, deviation, and other issues, but I think a theory analogous to physical theories is emerging. I would be interested in a similarly rigorous definition of the theory of AGW within a rigorous theory of climatology, but so far have not seen one I like.
In summary, I would much prefer to leave gravity out of the discussion as a comparison to AGW.
I isagree with fig 4. First, we do not have an accurate assessment of the carbon cycle but, second, the implication is that the sea gives up as much as it takes in. Well, wot abou’ ‘enry’s law?
If there is more CO2 in the atmosphere, then the oceans will give up less CO2. It’s all rather self-correcting. I’d say it’s the rise in temperature that causes the oceans to emit more CO2.
But hey, what do I know, we don’t have an accurate understanding of the Carbon cycle
I didn’t mean to imply that we have a comprehensive understanding of the carbon cycle. I think that the only part of it that has been relatively accurately assessed is our contribution to it.
My point was that our contribution is very small; but fundamentally different, because we are moving carbon from geologic sequestration back into the active cycle.
Per IPCC AR5 Figure 6.1 prior to year 1750 CO2 represented about 1.26% of the total biospheric carbon balance (589/46,713). After mankind’s contributions, 67 % fossil fuel and cement – 33% land use changes, atmospheric CO2 increased to about 1.77% of the total biosphere carbon balance (829/46,713). This represents a shift of 0.51% from all the collected stores, ocean outgassing, carbonates, carbohydrates, etc. not just mankind, to the atmosphere. A 0.51% rearrangement of 46,713 Gt of stores and 100s of Gt annual fluxes doesn’t impress me as measurable let alone actionable, attributable, or significant.
In some other words.
Earth’s carbon cycle contains 46,713 Gt (E15 gr) +/- 850 Gt (+/- 1.8%) of stores and reservoirs with a couple hundred fluxes Gt/y (+/- ??) flowing among those reservoirs. Mankind’s gross contribution over 260 years was 555 Gt or 1.2%. (IPCC AR5 Fig 6.1) Mankind’s net contribution, 240 Gt or 0.53%, (dry labbed by IPCC to make the numbers work) to this bubbling, churning caldron of carbon/carbon dioxide is 4 Gt/y +/- 96%. (IPCC AR5 Table 6.1) Seems relatively trivial to me. IPCC et. al. says natural variations can’t explain the increase in CO2. With these tiny percentages and high levels of uncertainty how would anybody even know? BTW fossil fuel between 1750 and 2011 represented 0.34% of the biospheric carbon cycle.
This is it in a nutshell.
They are not the same. Water vapor, at night self adjusts cooling based on the relationship between air temp and dew point.
I was going to bore all of you with an analogy with a leaky bucket, but changed my mind.
So I’ll just post what happens at night.
Oh, and how this all impact temperatures
Min temp follows dew point.
The cartoon on the WUWT main page, but not in this article, comes from XKCD. Here’s part of an explanation.
Although some commenters have rightly mentioned it, Dr Middleton’s article itsself doesn’t mention water vapour amplification and the alleged positive feedbacks – which as far as I am aware are the pivotal point of contention between the ‘alarmists’ and the ‘skeptics’. So, for me, this article is somewhat problematic.
Firstly, I don’t have a PhD, so I’m not a doctor.
Secondly, there is no evidence of a water vapor feedback and very little evidence of any positive feedback.
David,
You have just raised a notch in my esteem for you! 🙂
Agreed. But it’s nevertheless the main point of contention. Quoting Lindzen: “Here are two statements that are completely agreed on by the IPCC. It is crucial to be aware of their implications.”
“1. A doubling of CO2, by itself, contributes only about 1C to greenhouse warming. All models project more warming, because, within models, there are positive feedbacks from water vapor and clouds, and these feedbacks are considered by the IPCC to be uncertain.”
“2. If one assumes all warming over the past century is due to anthropogenic greenhouse forcing, then the derived sensitivity of the climate to a doubling of CO2 is less than 1C. The higher sensitivity of existing models is made consistent with observed warming by invoking unknown additional negative forcings from aerosols and solar variability as arbitrary adjustments.”
“Given the above, the notion that alarming warming is ‘settled science’ should be offensive to any sentient individual, though to be sure, the above is hardly emphasized by the IPCC.”
I don’t disagree. But it is nevertheless the main point of contention. Quoting Richard Lindzen (presentation to House of Commons): “Here are two statements that are completely agreed on by the IPCC. It is crucial to be aware of their implications.
1. A doubling of CO2, by itself, contributes only about 1C to greenhouse warming. All models project more warming, because, within models, there are positive feedbacks from water vapor and clouds, and these feedbacks are considered by the IPCC to be uncertain.
2. If one assumes all warming over the past century is due to anthropogenic greenhouse forcing, then the derived sensitivity of the climate to a doubling of CO2 is less than 1C. The higher sensitivity of existing models is made consistent with observed warming by invoking unknown additional negative forcings from aerosols and solar variability as arbitrary adjustments.
Given the above, the notion that alarming warming is ‘settled science’ should be offensive to any sentient individual, though to be sure, the above is hardly emphasized by the IPCC.”
Lindzen continues . . .
“Nothing [of the following are] controversial among serious climate scientists.
– Carbon Dioxide has been increasing
– There is a greenhouse effect
– There has been a doubling of equivalent CO2 over the past 150 years
– There has very probably been about 0.8 C warming in the past 150 years
– Increasing CO2 alone should cause some warming (about 1C for each doubling)
[None of the above] implies alarm. Indeed the actual warming is consistent with less than 1C warming for a doubling. Unfortunately, denial of the [above] facts has made the public presentation of the science by those promoting alarm much easier. They merely have to defend the trivially true points on the left; declare that it is only a matter of well-known physics; and relegate the real basis for alarm [i..e feedbacks] to a peripheral footnote . . .”
Good post, but wasted on Steve D I’m afraid. He never responds when he’s (so easily) shot down.
(Fingers in ears, la-la-la-la … etc.)
It’s simple really:
1. As the concentration of CO2 in the atmosphere increases the temperature increases. However, due to the logarithmic relationship between CO2 concentration and temperature, significant increases from current levels of CO2 concentration will only have a modest impact on temperatures. A good deal of any such impact on temperature is lost in the noise from other global temperature drivers such as the earth’s orbital physics.
2. The anthropogenic emissions of CO2 are minuscule compared to other emissions (about 4% of all emissions), particularly ocean outgassing and the impact of ocean temperature on CO2 concentration (water solubility of CO2 declines as temperature increases). Anthropogenic CO2 emissions are a fraction of the variability in emissions due to other sources (about 25%).
2. The IPCC promoted theory that atmospheric CO2 concentration was in equilibrium at around 280ppm prior to the Industrial Revolution and, due to anthropogenic emissions, increased at first slowly and then progressively faster to the current level of about 380ppm is bunk.
3. Atmospheric CO2 concentrations have been accurately measured by chemical analysis over the past couple of hundred years. These measurements show that on 3 prior occasions in the past 200 years (1825, 1857 and 1942) CO2 levels in the atmosphere were around or over 400ppm (See Beck, 2007 – “180 Years of Atmospheric CO2 Gas Analysis by Chemical Methods” which deals with more than 90,000 such analyses).
4. The IPCC decreed that chemical analyses of atmospheric CO2 prior to 1957 were inaccurate and the IPCC favored CO2 concentration curve is derived by appending actual measurements at Mauna Loa (Hawaii) since 1957 to the measurements of CO2 concentrations in bubbles of air trapped in ice-cores. The ice-core proxies suffer from significant interpretation problems and are not a reliable measure (see Middleton in WUWT 26 Dec. 2010 and many other references). Attaching recent actual measurements to inaccurate historical proxies to create a hockey stick is the same approach as adopted by Michael Mann and has the same degree of credibility.
So:
– Anthropogenic emissions do impact on temperatures but the effect is small,
– Anthropogenic emissions of CO2 are increasing but represent a very small proportion of total CO2 emissions,
– The CO2 levels in the atmosphere are not and never have been in equilibrium, and
– There is nothing new about levels of CO2 around 400ppm in the atmosphere in modern times
– There is no correlation between levels of CO2 in atmosphere in modern times and temperature.
Sorry, had to rewrite this because I thought my previous comment (George at 2:18pm) had got lost in the ether (or CO2)
“All that stuff is a distraction. Disprove the science of the greenhouse effect. Win a nobel prize get a million bucks. Forget the models and look at the facts. Global temperatures are year after year reaching record temperatures. Or do you want to deny that … (steve d April 16, 2017 at 3:58 pm).
==============================
Great graphic presentation; this is the sort of stuff fed to the steve d’s of this world:
http://www.realclimate.org/images//Marcott.png
(source: RealClimate — the HadCRUT temperature anomaly has risen about 0.3C since 1990 so we are definitely headed for the ‘stratosphere’).
Marcott’s reconstruction has a resolution of about 400 years. HadCRU should be depicted as a single point at a comparable resolution,
https://wattsupwiththat.com/2013/03/11/a-simple-test-of-marcott-et-al-2013/
Thank you Mr. Middleton. Short but important??..
Regarding the CMIP5 model ensemble vs the satelites and weather balloons grahic; is this comparing the models for the SURFACE, vs the troposphere?
This is very critical because if the satellites and weather ballons are recording tropospheric warming, and the models are estimating surface warming, then the models are WORSE then this graphic depicts, as the tropsphere as a whole, not just the tropical hot spot, is, per CAGW theory, suppose to warm 20 percent faster then the surface.
The global average temperature is pretty worthless, given that the overwhelming majority of the world has no temperature measurements feeding into it (surface temperatures, that is). But there’s another reason it isn’t worth anything.
In the chart showing absorption bands of various compounds against the Planck’s radiation law curves, note that the only band involving CO2 that is not completely dwarfed by water vapor is the 12 to 18 micron band. It is only partially dominated by water vapor. What this means is that below the tropopause, water vapor dominates global warming. Above the tropopause, there is no water vapor – that’s what defines the tropopause. All that is left is CO2, and it makes a relatively small hole in the total transmitted power. That power is what is radiated at the altitude of the tropopause, and is just to the right of the 210 K radiant curve that would best represent the atmospheric temperature at 3 km altitude. In other words, the only agent affecting radiation to space at 3 km (where the real radiation takes place) is CO2.
However, there are other places on earth where the influence of water vapor is absent from the surface to the top of the atmosphere. One is the Sahara desert. That is best approximated by the 310 K curve, where a very small amount of IR is absorbed by CO2. Most of that total absorption block disappears in the desert, which also radiates at a higher power level. The other locations are at the poles, where there is virtually no water vapor in the atmosphere most of the time. Again, they are dominated by CO2, this time more along the 210 K curve (the 310 K curve is the left-most one, the 210 K curve is the right-most), but it has a relatively small effect. Again, this is from the surface out to space, not from the tropopause out to space.
The extremes represented by the 210 to 310 curves are not trivial. The power emitted at 310 K per square meter per steradian is 4.75 times that at 210 K. The middle curve is equivalent to the global average of 288 K. The Sahara radiates 1.34 times as much as a world at that temperature. So though the Sahara represents 2.4% of the earth’s total surface area, it radiates the equivalent of 3.22 % of the earth’s total surface. That isn’t insignificant.
Yep, water vapor forcing changes during clear sky nights, regulating cooling. Same reason deserts cool a lot, and tropics do not at night.
You can see this in effect in these measurements.
OK, I’m trying to reconcile a few items mentioned above:
One, for a doubling of atmospheric CO2 there may be a warming increase of O.4 C which would mean that starting from the 250 ppm at around 1850 to when/if we get to 500 ppm there would be 0.4 C warming. Hold that thought.
Then, it seems to be agreed that humans are causing about 50% of the annual CO2 increase. But, is that since 1850 or more since around 1950? Doesn’t this mean that the first about 100 ppm of the increase was natural and humans will only be affecting the last 150 ppm (75 ppm of that).
Isn’t the effect essentially logarithmic? The first 100 ppm is more like half of the total effect, or 0.2 C leaving only 0.2C for the 50% that includes the human portion which then is only 0.1 C ?
Since we are over 400 ppm now, the remaining half (50 ppm) that may be attributed to humans when/if we get to 500 ppm is even less than that.
How can that small amount be causing such alarm?
It clearly shouldn’t be causing any alarm.
An excellent article – concise, a robust statement of the null hypothesis failure of CAGW with the most important supporting data nicely presented. And with a summarising conclusion at the end (rather than randomly stopping like many long technical posts here). All that is still lacking is an abstract at the beginning – every post should have one. Thanks Dave.
“Note: I will not engage in debates about the validity of the scientific theories of plate tectonics or evolution.”
Oh, go on. You know you want to, really.
Since we are told these models are based on physics, why does climate science accept/reject on a 2 sigma standard [ p value 0.05] rather than 5 sigma [p value 0.0000003] that is used for high energy physics? This isn’t a snark, I really wish I knew why. Even industrial quality control procedures require a 3 sigma process control [p value 0.003]. I suspect the answer will demonstrate some fundamental misunderstanding on my part, but I will be better off for learning what it is!
Hassling about 2σ p-levels isn’t a climate science preoccupation. It’s more a WUWT thing. But 2σ is the level used in many biological and other branches of science. It is a filter to say when a hypothesis that emerges from results can be taken seriously. That is not a common situation in climate science, where hypotheses emerge from physical reasoning. Deciding on a level to be used for the control of production processes, for example, is something quite different.
Translation: Climate science can’t meet the minimum standards required for all other branches of science so we declare ourselves to be an exception.
Choosing a fixed significance level is an element of a bad statistical practice known as the “null ritual”. RA Fisher, who is often credited as having invented null hypothesis statistical testing wrote
Essentially the proper significance level (and if we are doing this properly the required statistical power) depends on the nature of the problem, and especially issue such as the plausibility of the null and alternative hypotheses a-priori (unfortunately frequentist statistics can’t express these as probabilities, so the sort of subjectivity they hoped to eliminate from statistics creeps back in here, but in a hidden manner that is often missed/ignored).
This is illustrated very nicely by this XKCD cartoon:

The frequentist statisticians error here is following the “null ritual” and using a significance level of 0.05 without considering whether that is sensible. The probability that the Sun actually has gone nova is vanishingly small, so not rejecting the null hypothesis that it has gone nova on the basis of a 1/20 chance of observing the result if that were true is ridiculously credulous.
You are doing a lot better than most, by at least questioning, rather than just unthinkingly adopting the “Null ritual”, which is what most do.
>>
Sun actually has gone nova
<<
What are you (or the cartoonist) trying to say here? From an astronomy point of view, it’s nonsense. The model of most novae is that they are close binaries with one a compact object–such as a white dwarf. Obviously the Sun doesn’t have a companion star. If by “going nova” you mean “going supernova,” then that statement might make more sense. But type II supernovae (or type Ib/c) require stars with far more mass than the Sun.
In any case, I would bet billions or trillions of dollars, because the event would never happen. And if by some quirk of fate it did happen, then I’d only have to stall for about 9 minutes. The neutrino blast would kill all of us, and there would be nobody to collect.
Jim
Jim wrote “From an astronomy point of view, it’s nonsense. ”
of course its nonsense, it is a “humerous” cartoon, the purpose of which was probably to suggest Bayesian statistics are superior to frequentist statistics (which isn’t the case, both have their advantages and disadvantages). It does however provide a very good illustration of why you shouldn’t unthinkingly adopt some particular significance level without considering the purpose and nature of the experiment.
It is a bit like illustrating relativity with an analogy about a tram car approaching the speed of light. That is also obvious nonsense, but though experiments, analogies and cartoons are often like that, even when they are illustrating a perfectly valid point.
Of course taking a thought experiment/analogy/cartoon far too literally is a great way of evading/diverting the discussion of the central point it raises, which in this case was how to set the significance level. Well done.
Jim Masterson – my sincere apologies for being grumpy/rude, I should know better.
The point is the cartoon is about statistics not astronomy, and most people reading it won’t know the difference between a nova and a supernova or that the sun is too small to do something that interesting.
actually, perhaps the fact that the Sun is too small to go supernova and that it can’t go nova is part of the subjective prior knowledge that the Bayesian is including in his decision, that the frequentist ignores because he is following the “null ritual” (the cartoon is actually misrepresenting the proper fruequentist approach and it is actually a criticism of what Gergrenizer calls “mindless statistics”).
When people misuse terms, I don’t know if they know what they are doing or if they’re clueless. The idiot on the left is assuming that it did happen, because double sixes are rare. If the guy on the right knows that a “nova” can’t happen, then he knows the detector is lying (got double sixes). His stupidity is not betting more. If a real supernova occurred, the resulting neutrino blast would destroy the detector and all living things (no need to wait 9 minutes as I previously said).
In realty, no one knows the correct answer to scientific measurements and must make educated guesses at the truth. There’s no book with the answers in the back. These number games are sometimes just games.
Jim
Something is wrong with Fig 3. The “likely natural ranges” are a nonsnse. But the thick red curve is also wrong. FF emissions alone would create nearly 400 ppm rise. Details here.
The reason that the extrapolations are nonsense is that the pre-1900 rise is not “natural”. It was caused by land clearing, particularly in N America, Australia etc. That was well under way by 1850 – details here. And land clearing has continued, but not with exponential rise.
The investopedia definition of null hypothesis is completely muddled. The null hypothesis does not “propose” no statistical significance. You can’t even talk about statistical significance until you have formulated a null hypothesis and tested whether it could explain the observation. If it could, then you could say that the observations are not statistically significant, relative to an alternative hypothesis.
“AGW or CAGW have earned an exemption from the Null Hypothesis principle “
That is gibberish. There is no such principle. What you quote from Berkeley has nothing to do with the Null Hypothesis. They do give a standard statistical definition of the NH which has no suggestion of any “principle”.
And your claim that CO2 causes warming is not a scientific hypothesis is not true. Le Chatelier’s principle, say, is perfectly scientific, but doesn’t have numbers. The proposition that if you jump out of a plane you will hit the ground very hard does not have numbers, but is still worth taking note of.
“The reason that the extrapolations are nonsense is that the pre-1900 rise is not “natural”. It was caused by land clearing, particularly in N America, Australia etc. …”.
===========================
“Although there are no written documents describing the intentional, controlled burning of forests, it is believed that the cumulative impact of burning by Native Americans profoundly altered the landscape. When first encountered by Europeans, many ecosystems were the result of repeated fires every one to three years, resulting in the replacement of forests with grassland or savanna …” (Wiki).
“For thousands of years, Aboriginal Australians burned forests to promote grasslands for hunting and other purposes. Recent research suggests that these burning practices also affected the timing and intensity of the Australian summer monsoon …” (The ConversationJanuary 12, 2012).
“For thousands of years, Aboriginal Australians burned forests”
And CO2 remained stable. They didn’t start burning more forests in about 1850. That was the arrival of Europeans, who didn’t just burn forests (which recover). They obliterated them.
Post hoc ergo propter hoc.
The argument that there was a “natural” increase starting about 1850 that can be extrapolated is post hoc. It makes no sense to do that without looking for cause. And the mass clearing by Europeans is a matter of history, and can be quantified. That is done here, and is the basis for the plots in the above link. The land clearing emissions match (with the AF factor) the observed increase.
This is I assume one estimate of the net effect of land use change post 1850, I think from the same source in a graphic form, which indicates not much relative change 1850 — 1950 while the CO2 concentration went from ~275 — ~315 ppm:
http://appinsys.com/globalwarming/GW_5GH_CO2Sources_files/image007.jpg
Increasing CO2 can cause increasing temperature (ceteris paribus) and vice versa.
The hypothesis that land use change alone, in the absence of significant human emissions, can account for that CO2 concentration to increase which can in turn account for the temperature increase particularly 1910 — 1945 is implausible IMHO.
“indicates not much relative change 1850 — 1950 while the CO2 concentration went from ~275 — ~315 ppm”
It doesn’t need to change. From 1850-1900 it’s about 600 Mtons C/year. That equates to about 0.22 ppm/year. So that base rate would explain a 22 ppm change in a century, but the rate did go up. Anyway, the point here is that it would be a change of 11 ppm from 1850-1900, and fig 3 shows about a 15ppm change (and there was some FF emission). So you can’t say that the 1850-1900 change was natural and extrapolate it, which is what seems to be done in Fig 3.
Nick writes
From the reference, clearly that didn’t start in 1850 at 500Mtons. It must’ve been happening well before then and reached 500Mtons by 1850. So is there evidence of that?
Nick reasoned
If those figures are straight from the Houghton figures, then they probably dont include the effect of sinks…which could account for around half of the CO2 you’re suggesting may have accumulated earlier than thought.
dikranmarsupial writes
You’ve just jumped from GHGs warm the atmosphere to more GHGs warm the atmosphere more. That may well be the case but your jump isn’t part of the science you’re using to make the claim with.
The red curve is the cumulative anthropogenic emissions from cement production and fossil fuel use, converted to ppm CO2 and added to the CO2 value from the DE08 core at the start of the CDIAC emissions table.
 ?w=680
The CDIAC table has the total carbon emissions as 402,068 million metric tons C from 1751-2014. That’s 402.07 Gt C. 1 ppm by volume of atmosphere CO2 = 2.13 Gt C. 402.07/2.13 = 188.8 ppmv CO2 total emissions from cement production and fossil fuel use.
The CDIAC land use data start in 1850; so it’s kind of useless for estimating pre-industrial CO2 shifts. Humans living on this planet is a “natural” thing. We live by altering the landscape (agriculture). I should have characterized it as the pre-industrial rather than natural trend.
That said, all of the estimates of pre-industrial Holocene CO2 levels, not derived from Antarctic ice cores (Greenland ice cores and plant stomata), indicate that >300 ppm was routine.
The Null Hypothesis is the default position.
The Null Hypothesis (H0) for AGW is that there is no statistically significant correlation between CO2 and temperature which supports the assertion that CO2 emissions have caused most of the recent climate change. The models have not rejected H0 or supported the alternate hypothesis (a statistically significant correlation between CO2 and temperature which supports the assertion that CO2 emissions have caused most of the recent climate change).
Now, if the models were configured to yield a lower climate sensitivity to CO2, they probably would reject H0 and support the alternate hypothesis that AGW is relatively insignificant.
What I quoted from Berkeley is the definition of a scientific theory, particularly its predictive nature. I’m not sure why this confused you.
Trenberth clearly did assert that AGW merited an exemption from the Null Hypothesis by reversing the burden of proof.
The Law of Superpostion doesn’t have numbers either. But it is a “concise, coherent, systematic, predictive, and broadly applicable” explanation of sedimentary stratigraphy.
More CO2 will cause some warming, is not a “concise, coherent, systematic, predictive, and broadly applicable” explanation of an enhanced greenhouse effect.
A doubling of atmospheric CO2 will cause the lower troposphere to warm by ___ °C, is a “concise, coherent, systematic, predictive, and broadly applicable” explanation of an enhanced greenhouse effect.
Definition of “principle”…
https://www.merriam-webster.com/dictionary/principle
The Null Hypothesis is the fundamental assumption it is a principle:
http://www.statisticshowto.com/what-is-the-null-hypothesis/
It is commonly accepted that increasing atmospheric greenhouse gasses lead to increased global mean surface temperatures.
And common thinking is wrong.
Which is not a scientific hypothesis. It is a generality. It is arm waving.
dikranmarsupial writes
The IPCC says ” The best estimate of the human-induced contribution to warming is similar to the observed warming over this period”
Take a null of no warming. Show there is warming. Attribute it all to CO2 by building models that are tuned that way. Claim there is no other way we could have warmed. Simples.
“Which is not a scientific hypothesis. It is a generality. It is arm waving.”
No the greenhouse effect is a scientific hypothesis, there is a physical mechanism identified, observations to support it (e.g. that the Earth is over thirty K above its grey-body temperature), and it is falsifiable. You may not accept it, but that doesn’t mean it isn’t an accepted “fact” within the scientific community.
The “greenhouse” effect is a valid scientific theory. I stated this at the beginning of the post.
The assertion that anthropogenic CO2 emissions have significantly enhanced the “greenhouse” effect is the falsified hypothesis.
This is arm waving:
This is a scientific hypothesis:
dikranmarsupial writes
You’ve just jumped from GHGs warm the atmosphere to more GHGs warm the atmosphere more. That may well be the case but your jump isn’t part of the science you’re using to make the claim with.
“The assertion that anthropogenic CO2 emissions have significantly enhanced the “greenhouse” effect is the falsified hypothesis.”
Your shifting the goalposts noted – a physical hypothesis that has been falsified is by definition falsifiable, and hence would be considered scientific, at least by Popperians. To be a falsified hypothesis, then we need to have observations that the theory of the greenhouse effect forbids (taking into account all relevant sources of uncertainty). That has not happened. A lack of a statistically significant trend does not mean the alternate hypothesis has been falsified, especially if the statistical power of the test is low (because the magnitude of the expected trend is small compared to the magnitude of the noise, given the period usually considered – 30 years is the WMO guideline), especially if the start date has been cherry picked to coincide with ENSO, which is a principal source of “noise”.
Did you even read the post?
Why do you guys always accuse skeptics of cherry picking a start date? The comparison has always been backwards from today. Right now after the recent El Nino, there is a trend again and if it turns out to be a step increase it’ll likely persist.
appologies, I misunderstood your point, I’ll try again, now that I hopefully get it.
was phrased to match the definition of the null hypothesis that you cited:
The null hypothesis, H0 is the commonly accepted fact; it is the opposite of the alternate hypothesis.
except that I didn’t use the word “fact” because if one of your hypotheses is a fact, there is no point in performing the test in the first place. I could indeed have expressed it better, but that is just missing the point, which is that assuming no trend or no relationship between anthropogenic emissions and temperatures would violate the definition of a null hypothesis that you gave.
Of course I could indeed have said something along the lines of
however you can’t directly test that by looking at the observations we actually have because we also need to state the range of natural variability that is plausible under the theory. The models (which are implementations of the theory) show that a period of a decade or two with little or no warming is not unexpected, and a proper comparison of models and data (i.e. not making errors, such as using a single year baseline period) shows no model-observation inconsistency (the observations lie in the spread of the model runs). Nick is more expert on this topic than I am.
Either way, if you take what is generally accepted as being the null hypothesis, then that is inconsistent with using a null hypothesis of no warming.
However, the definition of a null hypothesis that you gave is actually little better than the previous one, as it assumes that you are trying to refute something that is generally accepted. That is not always the case, actually the null hypothesis should be essentially the opposite of whatever it is you are arguing for. So if you are arguing that there is no AGW, then your null hypothesis should be that the underlying rate of warming is what the models suggest it is. If you are trying to show that there is AGW, then your null hypothesis should be that there is no warming. Hypothesis tests are not symmetric, so it is perfectly possible to perform the test both ways and get a non-significant result on both occassions, which would just be an indication that the period is too short to give a reliable indication either way.
That is not the null hypothesis:
https://en.wikipedia.org/wiki/Null_hypothesis
The default position is “that there is no relationship between two measured phenomena.”
Actually when Ben Santer analysed the models back in 2011, he concluded that it was unlikely that a period of 17 years could pass without the AGW signal showing. But it happened. Did you guys re-evaluate your views of the models at that time?
TImTheToolMan wrote
Can you give me examples of where before the recent El-Nino climate skeptic blogs used a start date corresponding to Neutral/La Nina conditions instead of the 1998 El-Nino, to match the conditions of the finish date at that time? A better approach is just to use a time period long enough for ENSO not to make much difference, which is the 30 years that the WMO guidelines suggest.
TimTheToolMan wrote
no, that is not what the paper said, what the paper said was
So far from saying it is unlikely that a period of 17 years could pass without an AGW signal showing, it is saying that 17 years is the minimum window that you might reasonably expect to detect an AGW signal. An that is also for a randomly selected 17 year period, rather than a period selected after having looked at the data (i.e cherry picked), in other words if you look at the minimum sliding length window of 17 years, you wont have to look for very long before multiple hypothesis testing means you will find one without a significant trend.
You still don’t get it do you. You look backwards from today to see how far backwards you can go and get no trend. If it’s a few years it’s noise but at 18 or so years is became relevant. You’ll find lots of examples of people on both sides who cherry pick dates for their arguments but the strong skeptical argument doesn’t do that.
TimTheToolman wrote
I note you ducked the challenge. Looking backwards from today to see how far back you can go and get no significant trend violates the statistical assumption of the test (which assumes the period considered is a random sample) and introduces the multiple hypothesis testing problem (as you have tested the same data more than once), which is never corrected for in the analyses on skeptic blogs that I have seen.
If that’s your interpretation then Santer is saying nothing because how much time might you need? 30 years? 100 years? No. Santer’s analysis is what it is.
What test? The one that puts the models’ ability to forcast into doubt?
TimTheToolman wrote
Like everything in statistics, the more data you have the more reliable inferences you can draw, 17 years is the minimum, that is what “at least” means, which is what he actually wrote. If you have a longer period, then the more reliable the conclusions you can draw. 30 years is better, as I said it is the WMO guideline for reliable estimation of a trend, for precisely this reason.
TimTheToolMan wrote “What test?”
LOL. Perhaps you ought to actually read Santer’s paper.
David,
“402.07/2.13 = 188.8 ppmv CO2 total emissions from cement production and fossil fuel use.”
Yes, sorry, not sure how I wrote 400, I mean 188. But Fig 3 does not show a 188 rise. 188+277=465. It siws about 140ppm.
“The CDIAC land use data start in 1850; so it’s kind of useless for estimating pre-industrial CO2 shifts.”
It says that land use emission was about 0.55Gtons/year in 1850 and continued at about that rate to 1900. That would be .26 ppm/year, or 28.9 ppm from 1788 to 1900. Total rise in that time was about 35 ppm. Now the pre-1850 rate was probably less than .55 Gt/yr, but it’s still a stretch to say that the whole 35 ppm was natural, especially as FF use was also not zero.
“The Null Hypothesis (H0) for AGW is that there is no statistically significant correlation between CO2 and temperature which supports the assertion that CO2 emissions have caused most of the recent climate change. “
No, again that makes no sense. Statistical significance is a result of testing the NULL hypothesis; it cannot be part of it. You could say “no correlation”, but that is easily rejected. What you need is a hypothesis that says that past CO2 has fllowed some stochastic distribution independent of temperature. Then you can test subject to that distribution.
“What I quoted from Berkeley is the definition of a scientific theory”
It is quoted in support of some nonsense statement about the “Null Hypothesis principle”. There is nowhere else that any definition of what that “principle” might be.
Trenberth did not claim an “exemption”; you have not said what this is an exemption from. He said that the default assumption for statistical testing should be that there is warming as observed. If you could reject that, it would be interesting. Rejecting a hypothesis of no warming is no longer interesting. And a failure to reject that (or anything) is just a failure.
“More CO2 will cause some warming”, is not a “concise, coherent, systematic, predictive, and broadly applicable” explanation of an enhanced greenhouse effect.”
That is a straw man. People going back to Arrhenius have made a much more elaborate statement than that. But even “More CO2 will cause some warming” is predictive.
“The Null Hypothesis is the fundamental assumption it is a principle”
You haven’t said what the “principle” is. Your last quote says that the NH expresses “commonly accepted fact”. So what is the principle? “Commonly accepted facts” are always right? The whole point of the use of NH with statistics in science is that NHs are often rejected, and so science progresses. What Trenberth is saying is that yet another rejection of the hypothesis of no warming is not progress.
dikranmarsupial suggests
Newton’s laws of motion have no numbers associated with them, either. But they, along with the first and second laws of thermodynamics (which also have no numbers), are virtually the only actual laws of nature humans can claim to have discovered.
Newton’s law of motion, the first and second laws of thermodynamics are“concise, coherent, systematic, predictive, and broadly applicable” explanations of basic scientific principles.
More CO2 will cause some warming, is not a “concise, coherent, systematic, predictive, and broadly applicable” explanation of an enhanced greenhouse effect.
A doubling of atmospheric CO2 will cause the lower troposphere to warm by ___ °C, is a “concise, coherent, systematic, predictive, and broadly applicable” explanation of an enhanced greenhouse effect.
When the AGW crowd can fill in the blank, they will have rejected the null hypothesis and actually have a scientific theory.
Nick, in response to [“AGW or CAGW have earned an exemption from the Null Hypothesis principle “
That is gibberish. There is no such principle. What you quote from Berkeley has nothing to do with the Null Hypothesis. They do give a standard statistical definition of the NH which has no suggestion of any “principle”.]
The ‘AGW or CAGW…’ comment links to a paper by Trenberth [2011, AMS], not Berkeley Earth [where Trenberth wrote: “Given that global warming is unequivocal, the null hypothesis should be that all weather events are affected by global warming rather than the inane statements along the lines of “of course we cannot attribute any particular weather event to global warming”]. ie: I don’t believe the author said the Berkeley Earth called for the exemption from the null hypothesis test [rather than principle]. At least my reading of it was that he used the BE description as justification why no such ‘exemption’ is warranted [or whatever it is that Trenberth was calling for. I would call it inversion of standard null definition protocol].
What Trenberth said was:
“Given that global warming is unequivocal, the null hypothesis should be that all weather events are affected by global warming rather than the inane statements along the lines of “of course we cannot attribute any particular weather event to global warming”. That kind of comment is answering the wrong question.”
He’s not stating a “principle”. I have never seen a coherent statement of any NH “principle”. He is simply talking about the kind of statistical test that should be done – always an open question. The “null” in null hypothesis means that if it can explain the results, we haven’t learnt anything. He’s saying that if a result accords with AGW, that is no surprise (because it has happened so often). You may disagree, but that is his view. It’s the issue of “answering the wrong question”.
Nick Stokes:
You display your usual degree of veracity when you write
I have repeatedly explained the matter to you most recently on WUWT a week ago, but you try to pretend the scientific method does not include a null hypothesis and only the infinite variety of null hypotheses used by statistics exist.
The Null Hypothesis of the scientific method is a requirement that exists because the scientific method uses the principle of parsimony which is often called ‘Occam’s Razor’. This says that an explanation is not scientific if it adopts an assumption that is not needed to explain a phenomenon that is not in evidence. This principle is e.g. why the Laws of Physics are assumed to be the same everywhere and e.g. why the existence of God is not a scientific question.
So, I again post the “coherent statement” of the scientific Null Hypothesis which you say you have refused to read. It is as follows.
The Null Hypothesis of the scientific method says it must be assumed a system has not experienced a change unless there is evidence of a change.
The Null Hypothesis is a fundamental scientific principle and forms the basis of all scientific understanding, investigation and interpretation. Indeed, it is the basic principle of experimental procedure where an input to a system is altered to discern a change: if the system is not observed to respond to the alteration then it has to be assumed the system did not respond to the alteration.
In the case of climate science there is a hypothesis that increased greenhouse gases (GHGs, notably CO2) in the air will increase global temperature. There are good reasons to suppose this hypothesis may be true, but the Null Hypothesis says it must be assumed the GHG changes have no effect unless and until increased GHGs are observed to increase global temperature. That is what the scientific method decrees. It does not matter how certain some people may be that the hypothesis is right because observation of reality (i.e. empiricism) trumps all opinions.
Please note that the Null Hypothesis is a hypothesis which exists to be refuted by empirical observation. It is a rejection of the scientific method to assert that one can “choose” any subjective Null Hypothesis one likes. There is only one Null Hypothesis: i.e. it has to be assumed a system has not changed unless it is observed that the system has changed.
However, deciding a method which would discern a change may require a detailed statistical specification.
The Null Hypothesis has had profound effects. For example, Michelson-Morley Experiment (MME) was conducted in 1887 which was before statistics formulated its own version of null hypotheses. The MME failed to detect movement of the luminiferous ether. This failure of the MME to detect movement of the luminiferous ether required adoption of the scientific Null Hypothesis that there is no movement of the luminerous ether. And that conclusion that there is no movement of the ether led to most modern physics and our modern electronic communications. However, there is now some evidence that the MME was inadequate to detect movement of the luminiferous ether that may exist.
In the case of global climate in the Holocene, no recent climate behaviours are observed to be unprecedented so the Null Hypothesis decrees that the climate system has not changed: i.e. there is no reason to suppose that climate changes now happening have different cause(s) to the causes of similar climate changes in the past.
Importantly, an effect may be real but not overcome the Null Hypothesis because it is too trivial for the effect to be observable. Human activities have some effect on global temperature for several reasons. An example of an anthropogenic effect on global temperature is the urban heat island (UHI). Cities are warmer than the land around them, so cities cause some warming. But the temperature rise from cities is too small to be detected when averaged over the entire surface of the planet, although this global warming from cities can be estimated by measuring the warming of all cities and their areas.
Clearly, the Null Hypothesis decrees that UHI is not affecting global temperature although there are good reasons to think UHI has some effect. Similarly, it is very probable that AGW from GHG emissions are too trivial to have observable effects.
Empirical evidence indicates that net feedbacks in the climate system are negative and, therefore, any effect of increased CO2 will probably be too small to discern because natural climate variability is much, much larger. This concurs with the empirically determined values of low climate sensitivity.
As I state above, empirical – n.b. not model-derived – determinations indicate climate sensitivity is less than 1.0°C for a doubling of atmospheric CO2 equivalent. This is indicated by the studies of
Idso from surface measurements
http://www.warwickhughes.com/papers/Idso_CR_1998.pdf
and Lindzen & Choi from ERBE satellite data
http://www.drroyspencer.com/Lindzen-and-Choi-GRL-2009.pdf
and Gregory from balloon radiosonde data
http://www.friendsofscience.org/assets/documents/OLR&NGF_June2011.pdf
Indeed, because climate sensitivity is less than 1.0°C for a doubling of CO2 equivalent, it is physically impossible for the man-made global warming to be large enough to be detected (just as the global warming from UHI is too small to be detected). If something exists but is too small to be detected then it only has an abstract existence; it does not have a discernible existence that has effects (observation of the effects would be its detection).
To date there are no discernible effects of AGW. Hence, the Null Hypothesis decrees that AGW does not affect global climate to a discernible degree. That is the ONLY scientific conclusion possible at present.
Richard
“This failure of the MME to detect movement of the luminiferous ether required adoption of the scientific Null Hypothesis that there is no movement of the luminerous ether.”
The prior expectation was in fact that the experiment would detect motion relative to the ether. No particular assumption about there being no movement of the ether – whatever that means. And of course, the outcome was that there wasn’t an ether at all. None of that fits into the framework of a unique null hypothesis.
And it’s change relative to what that is the lack of coherence in our statement. But the basic problem is that despite a number of very loud posts, you haven’t produced any reference to back up your assertions.
richardscourtney writes “The Null Hypothesis of the scientific method says it must be assumed a system has not experienced a change unless there is evidence of a change. ”
On the other thread that richard mentions, I repeatedly challenged him for a verifiable reference to support the claim that there was a definition of the null hypothesis in scientific method other than the usual statistical definition), and he repeatedly replied with insults and a complete absence of a verifiable reference for such a usage. This strongly implies it is of Richards own imagination. I suspect Richard is just promoting a naive statistical misunderstanding (known as the null ritual) to an element of scientific method, and is too obstinate to accept his error, and so resorts to insults and ad-hominems.
Greenhouse gasses have strongly influenced planetary temperatures throughout geological time. It is a violation of Occam’s razor to suppose that greenhouse gasses don’t affect climate when they are released from anthropogenic sources, rather than natural ones.
Nick Stokes and his anonymous clack:
The lie I have refuted was that Stokes had seen no “coherent statement of any NH “principle” “.
I again provided the coherent statement of the Null Hypothesis which is irrefutably a basic principle of the scientific method.
Stokes is still telling lies in attempt to justify his pseudoscience.
Richard
anonymous troll who posts as dikranmarsupial:
Congratulations on your slaying of a straw man when you write
I know of nobody who has claimed “greenhouse gasses don’t affect climate when they are released from anthropogenic sources, rather than natural ones” and I am certain you cannot cite anybody who has.
Richard
richardscourtney wrote:
for which you are unable to provide a verifiable reference so we don’t have to accept it entirely on your authority. I did at least make the effort to look for such a reference, which is more than you are apparently willing to do. The OED only gives the standard statistical definition. Google book’s n-gram viewer finds no examples of the phrase prior to its introduction in statistics by Fisher. Google scholar indexes no papers that use the phrase prior to its statistical usage.
Richardscourtney wrote
richardscourtney wrote
Indeed, increasing levels of greenhouse gasses in the past have caused similar climate changes in the past (e.g. PETM, but most of the changes have been more gradual as the increases in GHGs have been more gradual). Thus if the null hypothesis is that the climate system has not changed, that includes its response to GHGs, so we would expect to see rising temperatures in response to our GHG emissions. Unless of course there is something different about anthropogenic emissions to natural GHG emissions.
dikranmarsupial: It is a violation of common sense to assume that all greenhouse gases have the same impact and that the level of greenhouse gases don’t matter in how much an increase in any of them will impact the climate.
Your logic boils down to this. Greenhouse gases keep the planet 33C above what it would be without them.
CO2 is a greenhouse gas. Therefore the models are correct.
dikranmarsupial: You claim that increases in greenhouse gases have caused increases in temperature in the past.
OK, show your evidence.
Every chart that I am aware of shows that there is little correlation between CO2 levels and global temperatures.
>>
The MME failed to detect movement of the luminiferous ether. This failure of the MME to detect movement of the luminiferous ether required adoption of the scientific Null Hypothesis that there is no movement of the luminerous ether.
<<
Unfortunately, I’ll have to agree with Mr. Stokes. I’ve read Michelson-Morley 1887 several times. They discuss the various possible theories for aberration including using water-filled telescopes and they discuss their experimental set-up. The purpose of MM 1887 was to measure the speed of the Earth through the “fixed” luminiferous ether. They produced a null result which means it made no difference what direction they pointed their light ray setup. Special Relativity actually explains the MM 1887 null result, aberration, and the speed of light appearing in Maxwell’s equations better than Lorentz’s theory and without the need for the “luminiferous ether.” Add to that the idea that light is a particle that sometimes acts as a wave, and there’s no need for light to have a medium in the vacuum of space to wave.
Jim
dikranmarsupial:
You write
So, we now have to add a lack of ability at reading comprehension to your other demonstrated failings; viz. stupidity and being a ‘useful idiot’ of Nick Stokes.
In this thread I have repeatedly cited empirical derivations of climate sensitivity being ~0.4°C for a doubling of CO2 equivalent: I state HOW MUCH temperature is expected to rise in response to a rise of atmospheric CO2 concentration In fact, I concluded the post your statement quotes by saying
It is not possible for a sane person to equate what I wrote with meaning “there is something different about anthropogenic emissions to natural GHG emissions”. Your assertion is as wrong as Stokes pretending there is no scientific null hypothesis.
Richard
Jim Masterson:
Your nit-pick agrees with what I wrote.
I used the MME as an illustration and not as a dissertation on that experiment. Your nit-pick in attempt to support Stokes says
But I cited the MME as illustration of my explanation that
I see no difference between your nit-pick and my statement that
an explanation is not scientific if it adopts an assumption that is not needed to explain a phenomenon that is not in evidence
which is formalised as being the scientific Null Hypothesis; viz.
The Null Hypothesis of the scientific method says it must be assumed a system has not experienced a change unless there is evidence of a change.
Richard
>>
Your nit-pick agrees with what I wrote.
<<
Yes, I agree it was a nit-pick. However, there is a difference between getting a null result in an experiment and the “null hypothesis.” I don’t consider MM 1887 as an attempt to test some null hypothesis. It was to measure the speed of the Earth through the ether. I might add that your original quote referred to the speed of the ether, which is definitely not what MM 1887 tried to measure. And it was Einstein that said we didn’t need the ether, not Michelson-Morley.
Notice that the purpose of the ether was to explain why the speed-of-light appears in Maxwell’s equations. Also, since light (electromagnetic radiation) was considered to be a wave, it needed something to wave.
>>
This principle is e.g. why the Laws of Physics are assumed to be the same everywhere
<<
The concept dates back to Galileo. It’s the basis of relativity, and why we believe that the laws of physics are invariant under various transformations. It’s interesting that people may believe in the invariance of physical laws, but don’t like the result–relativity.
Jim
Jim Masterson:
I replied to a comment you made about an explanation I provided to Stokes. My reply said
Your reply to that says
Yes, as you say, “The concept dates back to Galileo”.
This is one of many examples that – as I have told Stokes – the scientific Null Hypothesis predates the existence of statistics by centuries.
But I don’t know why you have implied I “don’t like” “rel@tivity”. That implication is untrue: I have never – not ever – given any suggestion of it and in this thread I have not mentioned rel@tivity.
Richard
>>
Your reply to that says . . . .
<<
You skipped over my reply which addressed your “null hypothesis” comment.
>>
But I don’t know why you have implied I “don’t like” “rel@tivity”.
<<
It was just a general comment. It wasn’t specifically addressed to you, but it was made in reference to your statement on invariance. My dad, for example, disliked relativity. I have run across others with the same opinion. I didn’t know your exact position on relativity–so ignore that part of my comment,
Jim
“Greenhouse gasses have strongly influenced planetary temperatures throughout geological time.”
When?
http://i90.photobucket.com/albums/k247/dhm1353/Phan_CO2.png
http://i90.photobucket.com/albums/k247/dhm1353/NEO_CO2.png
http://i90.photobucket.com/albums/k247/dhm1353/LawMob1.png
The industrial era rise in atmospheric CO2 doesn’t even break out of the Cenozoic noise level:
http://i90.photobucket.com/albums/k247/dhm1353/Cen_CO2_zps49992aaf.png
The “Anthropocene” CO2 level is almost indistinguishable from “sustained and severe carbon starvation” levels:
http://i90.photobucket.com/albums/k247/dhm1353/GeoCO2.png
David Middleton:
Upthread you say
No. I refer you to one of our 1995 papers.
(ref. )
It provides our analyses which show the atmospheric CO2 concentration would probably be the same if the CO2 emission from human emissions were absent; n.b. absent humans emitting CO2 the atmospheric CO2 concentration would probably be the same.
Those analyses show the short term sequestration processes can easily adapt to sequester the anthropogenic emission in a year. But, according to each of our six different models, the total emission of a year affects the equilibrium state of the entire carbon cycle system. Some processes of the system are very slow with rate constants of years and decades. Hence, the system takes decades to fully adjust to a new equilibrium. So, the atmospheric CO2 concentration slowly changes in response to any change in the equilibrium condition.
Importantly, each of our models demonstrates that the observed recent rise of atmospheric CO2 concentration may be solely a consequence of altered equilibrium of the carbon cycle system caused by, for example, the anthropogenic emission or may be solely a result of desorption from the oceans induced by the temperature rise that preceded it.
The most likely explanation for the continuing rise in atmospheric CO2 concentration is adjustment towards the altered equilibrium of the carbon cycle system provided by the temperature rise in previous decades during the centuries of recovery from the Little Ice Age.
This slow rise in response to the changing equilibrium condition also provides an explanation of why the accumulation of CO2 in the atmosphere continued when in two subsequent years the flux into the atmosphere decreased (the years 1973-1974, 1987-1988, and 1998-1999).
And this understanding is supported by the measurements made by the OCO-2 satellite. Stephen Wilde provides this plot of atmospheric CO2 concentration provided by the OCO-2 satellite together with his summary of what it shows.
The OCO-2 satellite measurements indicate that ALL the CO2 from human activities is sequestered by sinks local to its emission sites. Hence, it is observed that the CO2 from human activities is not overloading those local sinks and is not available to overload other sinks.
Richard
Ooops. The missing reference is
Rorsch A, Courtney RS & Thoenes D, ‘The Interaction of Climate Change and the Carbon Dioxide Cycle’ E&E v16no2 (2005)
Sorry
Richard
richardscourtney April 17, 2017 at 11:37 pm
The most likely explanation for the continuing rise in atmospheric CO2 concentration is adjustment towards the altered equilibrium of the carbon cycle system provided by the temperature rise in previous decades during the centuries of recovery from the Little Ice Age.
http://towardsthefinalhour.com/wp-content/uploads/2016/02/overview20220co2.jpg
Aha. Now I begin to understand the sense of the word ‘recovery’.
Thanks for the hint!
I would like to point out that your entire article is WRONG and INCOMPETENT because you incorrectly called “CAGW” a hypothesis when it is only a POSTULATE.
prjindigo,
Considering that your statement about “postulate” comes to a strong conclusion, I think that you should have defended how what appears to be a ‘distinction without a difference’ justifies such a condemnation. After all, common synonyms for the verb “postulate” include ” put forward · suggest · advance · posit · HYPOTHESIZE · propose · assume · presuppose · presume · take for granted.” You come across as just trying to demonstrate your superior command of English in a rather petty way. Please be so good as to explain just why “postulate” is so superior to “hypothesis” and why it really makes a difference.
I might not have wasted so many decades not carrying on studying physics, if the teachers had shown me how surprising it often is. AGW misses the vital point: that we are dealing with gases. These, to a man, are not tied down, by definition. Gravito-density eg lapse rate, may thwart radiation near the surface. But, as Maxwell noted in eg ‘Theory of Heat’, gases simply exercise bouyancy instanter and very vigourously on the touch of heat. Like I do from a hot seat. But all gases take the heat energy with them, and quickly, to the net-radiative point and also further, to the tropopause. Any ghg absorption, if not instantly re-emitted, is preemptively lifted up and away. Them is the Gas Laws, no exceptions folks. This process is only boosted and hugely by H2O phase-changes, Water Vapour starting out as a gas only half as massive as air, but with vast latent heat to supercharge the job. By about 80 percent. CO2 rather prefers to carry on as the basis of life. Some people should get wary of falsely accusing such a fine and caring gas, before they annoy it……
Ah yes, Airs; JAXA; now Nasa OCO2. Guess they are silent because they are busy eating their hats. Fries and salad with that, Sirs. More sauce?
Seems to me the null hypothesis is even simpler.
At the heart of CAGW hypothesis: more CO2 = more temperature
Therefore, if there was ever a time when there was significantly more CO2 in the atmosphere than now and the temperature was significantly colder than now, the hypothesis is wrong, no?
Poor Richard:
You say
It seems we agree. Above I wrote
The reason Stokes and his clack reject use of the Null Hypothesis is because it rejects their unsupported assertions of CAGW.
Richard
No, this is an extremely naive approach to statistical hypothesis testing known as the “Null ritual”. The null hypothesis should play the role of a devils’ advocate to enforce a degree of self-skepticism on the experimenter. Essentially speaking the null hypothesis should be the opposite of the argument the researcher wants to make. Most often the experimenter wants to claim that there is a difference, so usually the null hypothesis is that there is no difference, but assuming that this is always the case reflects a fundamental misunderstanding of the purpose of a null hypothesis statistical testing. So if you want to use the trend in global surface mean temperatures (GMSTs) to argue that there has been global warming, then the appropriate null hypothesis is that the trend is zero. However if you want to argue that there is no warming, or that there had been a slow down in the rate of warming, your null hypothesis should be that warming has continued at the same rate as before. Using the lack of statistically significant warming, with a null hypothesis of a zero trend (without considering statistical power of the test, which is what you need to do if you don’t use the devil’s advocate null hypothesis), is a serious misuse of statistical testing as it completely negates the mechanism for enforcing self skepticism as it is assuming you are right a-priori.
actually “A null hypothesis is a type of hypothesis used in statistics that proposes that no statistical significance exists in a set of given observations. ” doesn’t even make sense. The “null ritual” null hypotheses is that there is no difference, and the difference is said not to be statistically significant unless the probability of an effect at least as large as that actually observed is sufficiently unlikely if the null hypothesis is true. Clearly whoever wrote that definition has a rather poor grasp of statistical hypothesis testing.
dikranmarsupial :
What is a troll?
Any anonymous oik who posts untrue assertions (often as personal attacks) as a method to disrupt serious debate.
The scientific Null Hypothesis is as I explained above: it is an immutable scientific principle for the reason I explained. And, as you know, it is NOT the multiplicity of null hypotheses used in statistical hypothesis testing.
Richard
richardscourtney wrote
Someone who keeps making the same unsupported assertion and repeatedly responds to requests to provide a verifiable reference to support it with insults and ad-hominems?
I on the other hand have provided the OED for the definition of a null hypothesis, I have cited journal papers supporting my position, I have even gone out and searched for the reference to support your position that you were unwilling to provide (and not found one). I’d say that was decidedly un-troll-like, but normal behaviour for a scientific discussion. It is ironic that you accuse me of personal attacks in the same sentence in which you call me an “anonymous oik”. Note as I pointed out, I post here pseudonymously, rather than anlnymously, having revealed my identity here and elsewhere on more than one occasion. So if you must call me an “oik”, at least make it “pseudonymous oik” (who isn’t bothered by your insults as they demonstrate the paucity of your position, rather than mine ;o)
I frequently see comments on sites like Watts Up from people who say that there is no greenhouse effect.
Which is when the reply ‘well disprove it and collect a Nobel’ is an appropriate one.
One of the issues with the skeptic position – and arguing against it -is that it embraces a wide range of opinion on climate change from ‘the greenhouse effect physics is wrong’ through it is not warming to there is an ice age starting.
Really, scepticism needs a consistent thesis. Climate change has one.
Here you go.
Where’s my prize?
Oh, actually I just prove one GHG rules all the others, does that count?
Water evaporates into air because the air is dry not necessarily because it is warm. Warm air will hold more moisture, but the relative concentration is the primary motivator that moves the water not the temp.
I don’t necessarily disagree, but dew points went up, likely from ocean cycles, and not temp, as rel humidity has gone down some.
One constant with Griff, when he knows he can’t win an argument, he starts lying about what others have said.
Since the supposition of Griff’s claim is an easily provable lie, everything that follows from that supposition is nothing but nonsense.
Griff,
I take it that you have not read Chamberlain’s Method of Multiple Working Hypotheses. Entertaining more than one or two explanations can be productive.
Griff April 18, 2017 at 3:35 am
I have over 800 views of my papers on Writerbeat, copies posted on WUWT and to numerous engineering institutions and climate science “experts” and NO ONE yet has explained why I am wrong. CAN YOU!!!
http://writerbeat.com/articles/14306-Greenhouse—We-don-t-need-no-stinkin-greenhouse-Warning-science-ahead-
http://writerbeat.com/articles/15582-To-be-33C-or-not-to-be-33C
So what would the earth be like without an atmosphere?
The average solar constant is 1,368 W/m^2 with an S-B BB temperature of 390 K or 17 C higher than the boiling point of water under sea level atmospheric pressure, which would no longer exist. The oceans would boil away removing the gigatonnes of pressure that keep the molten core in place. The molten core would rupture flooding the surface with dark magma changing both emissivity and albedo. With no atmosphere a steady rain of meteorites would pulverize the surface to dust same as the moon. The earth would be much like the moon with a similar albedo (0.12) and large swings in surface temperature from lit to dark sides. No clouds, no vegetation, no snow, no ice a completely different albedo, certainly not the current 30%. No molecules means no convection, conduction, latent energy and surface absorption/radiation would be anybody’s guess. Whatever the conditions of the earth would be without an atmosphere, it is most certainly NOT!!!! 240 W/m^2 and 255K.
“The condition of thermodynamic equilibrium is necessary in the statement, because the equality of emissivity and absorptivity often does not hold when the material of the body is not in thermodynamic equilibrium.”
The atmosphere is NOT!!!!!! in thermodynamic equilibrium so GHE “back” radiation is NOT possible.
“In thermodynamic equilibrium there are no net macroscopic flows of matter or of energy, either within a system or between systems.”
Which means no conduction, convection or latent heat (net macroscopic flows) processes otherwise, as is the case with the real atmosphere, S-B and Kirchhoff ideal applications are null and void.
It’s the water vapour that does the warming! Not the CO2. I speed read this and think I know most of the arguments about the data and the models’ inadequacies. Inadequately complex. In spite of all the data the above nowhere seems to explain the core and basic assumption of climate models – that warming is caused by water vapour levels affected by the 400ppm CO2 that itself has no significant effect on global warming through the solar radiative balance. No other causes are seriously considered, as thsi one must be proved t justfy the fraud on the science fact that is renewable energy, supposedly the way to reduce the bad CO2 emissions (NOT carbon, which is required for all life, Carbon dioxide the natural gas that moves the relatively tiny amount of life giving carbon atoms around the massive rocky planet.
The models assume CO2 in the atmosphere causes a change in the amount of water vapour in the atmosphere, the major greenhouse gas, to create the much larger effects required to create any significant change, by an amplification or “forcing” assumtions put into the model as hypotheses, Feyman’s scientific “guesses” – which keep being denied and significantly reduced by experimental observations to make these models track reality. This appriach has been chosen as a smoking gun cartoon villain, as the amplificay tion of harmless on its own CO2 increase is large enough to create a disaster scenario if you exagerate the hypothetical linkage with the much greater effect of water vapour. Think over ampified band’s feedback.
But, as amply demonstarted above, these models do not predict statistically significant change as advertised, Rather Gaia seems to kick in, negtaive feedback, and “soon” the next ice age will gradually take care of “global warming” if the planet behaves as it has the last Million or so years, flipping beteen two stablish states of low and high aldedo. The smoking gun is clear and well documented, it’s variable planetary orbit eccentricity, plus axial tilt and precession in that orbit.
. Sometime in the next few thousand years. Plenty of hard evidence for the cause and periodicity. This brings me to the point. If not CO2 linked to water vapour, what else could cause such changes? No one wants to ask unfunded non PC questions like this in science as unquestionable religion we now have
I have no doubt there are other models that could use different assumptions to predict climate change , but they won’t get funding or objective science applied, because they don’t fit the rhetoric or funding that is only targetting the proof of CO2 related global warming. The opposite of science method that sets up a hypothesis then tries to disprove it, first by the authors before publication, then by independent experts anywhere after publication. They can’t do this. Very obviousl, as above. The very fact th such a approah is demoised by cimate change scientists is a smoking gun in itself. “Methinks they do protest to much” , as non cintist will wrote.
But that’s not the real fraud, its the fraud on the science fact it is used to justify renewable energy as deployed on the grid, that must make net CO2 emissions per unit energy worse.
STOP WORRYING ABOUT UNPROVABLE CLIMATE CHANGE “SCIENCE” AND FOLLOW THE MONEY. IF CO2 BASED CLIMATE CAHNGE IS CAUSING AGW, RENEWABLE SUBSIDIES IMPOSED IN ITS NAME ARE MAKING IT WORSE, VERSUS GAS REPLACING COAL AND NUCLEAR BOTH, CHEAPER, WHOLLY SUSTAINABLE AND ADEQAUTE FOR ALL OUR NEEDS AT ZERO CARBON, IN ENGINEERING FACT. NO CONSENSUS REQUIRED. CLIAMTE CHANGE= RENEWABLES IS A SNAKE OIL FRAUD, A CLIMATE CHANGE PROTECTION RACKET BY LAW. LEGALISED EXTORTION. MALFEASANCE. Based on unprovable either way fear of the unknowable. That clear enough? Do the arithmatic (Sir David MacKay, FRS)
Follow the money. CLimate change research is not open minded. It must justify and support the multi $Trillion renewables subsidy industry that makes insiders rich well before its effects can ever be known (we’re all dead, they got rich fast) based on a dodgy one cause climate hypothesis, whose cause renewables generally make worse per KWh – in energy science fact. That’s the real science denial, the energy fraud enacted in its name that can only make its supposed cause of CO2 emissions worse.
CAVEAT: I am not pro anything except science fact, and this is absolute in energy generation and emissions, no models or hypotheses required. BUT Climate change models are bad science, closed mind, single cause related (CO2) for a reason – to support the science fiction of snake oil renewable energy cures that simply can’t deliver in science fact. Why cliamte so called scientists seek proof for it in the noise of systems they simply can’t predict with their woefully simplified and under subscribed models. They might as well be priests casting Runes for real insight they can prove. But the fear of climate change and the ritual cures and sacrifices to the false renewable gods of CO2 make insiders rich at our expense so it’s a living for the people doing it, at the expense of a superstitious, fearful, scientifically illiterate hence easilly deceived population.
Other ideas? To me all this climate modelling is scrutinising noise on far too short a periodicity, human time scales not planetary, in the short warm spell, a few 10,000s of years, in which our civilisation and sciences have developed between very observationally predictable 100,000 year ice ages. THis real hange, still only between 10 degree K limits and 400 foot ocen level change. What price the great Barrier Reef then?No use for the Channel Tunnel, just walk/drive, etc. THWant a smoking gun, a real substantive one?
This may be caused by a massively increased annual 30% gravitational variation as our orbit around the sun changes, from near zero now, severely rattling the planets plates and molten core as well as causing 30% annual radiative variation (inverse square law and the orbital extremes gives that fact, not a model or guess) – this makes seasons more extreme ias we move from a circular orbit towards maximum eccentricity, and start to cool as the ice spreads, albedo increases until we gradually enter the stable state of the next ice age (Sun still ensures ice can’t get too near the equator, and their is still water vapour based warming, just less, etc.). Interestingly this ends very suddenly in geological record, in a few hundred years, so something FAR bigger than climate probably causes it, perhaps undersea volcanicity from increased tectonic shifts as the core gets rattled around more. Maybe a magnetic pole switch?nb: I calculate the Sun’s gravity to 180 times the moon’s, if you want scale the Sun’s gravity force on the earth is 3.6X10^22 Newtons vs, 2.04 X10^20 for the moon. Check it your self, its based on the masses, the orbital radii and F=Gm1.m2/r^2
Follow my name, I have proof you are right.
I know I am right, not because I am very bright, but because that’s how the IPCC models are predicated. But poorly reported so few people have any idea what they are talking about on this subject, at the most basic level, nor do they care, as long as they have the basis for an assertion.
Be that as it may, you did get it right, which is better than a lot of very bright people because they they don’t look past the assumptions they make or accept.
Or just look at the post above this one.
The best answer to a long comment is a short one.
http://hdl.handle.net/2060/19790010343
http://tinyurl.com/m2ad2r3
Ha, Ha. I think that says Yeh, probaly, but we can’t be sure – if I speed read it properly ;-). Doesn’t matter either way because, of course, the climate change hypothesis is an unprovable one whatever the reality, no control plant for a start. THis is a distraction away from the real agenda – the easy money being made with renewables in the name of CO2 reduction = climate change amelioration, when renewables net effect on the grid is to make CO2 emissions worse of course. The easy guaranteed renewable subsidy money industry is the real driver of climate change propaganda, not the real science. Never mind the climate, follow the money.
If one is look 👀 ing for a concise, robustly and parsimoniously argued statement refuting the basis for AGW alarm 🚨, then this article is the best I’ve seen in a while. It says simply and with authority, “climate changes, always has, live with it”.
What I would like to see is an in depth look at why biological indicators like pollen and midges give diametrically opposed temperature reconstructions compared to isotope ratio methods. Note the ice cores are not the only isotope methods, there are sea floor sediment cores that with isotopes give results similar to Greenland and Antarctica ice cores.
The isotope data shows big fluctuations over the Holocene such that the 20th century is not exceptional. Pollen and midges however show slower more smoothed changes such that the 20th century is exceptional. Some of these bio ondicators are so vague that they barely resolve the Holocene.
They can’t both be right. It makes no sense to blur them all together Shakun-style, unless your objective is to deceive rather than clarify. My money is with the isotope methods. Some input from Javier and others on this would be appreciated.
I am sorry, but you leave me wondering how populations capable of believing in AGW evolved? 🙂 Therefore a debate in Evolution is called for…
Again, it just amazes me that anyone thinks they can predict the behavior of a complex CHAOTIC behaving system (or even systems) of many variables by using only one of the variables. Its like trying to accurately predict the orbit of a star around its center of mass of an 3 or more star orbital system, using only the mass and velocity vector of the one star. You can ignore the aberrant orbital behavior all you want, but after a while the star isn’t where it should be according to your calculations. The first step to a more accurate model in this case is to recognize how many bodies are orbiting each other (or how many variables are there?) We have not even taken that step in climate prediction.
CO2 sensitivity is a factor, but it isn’t going to be the only one when dealing with climate. Good luck at trying to model the climate system with no understanding of how many variables are important.
The problem, as the author notes, is that as long as the focus is to keep tweaking the models to match what has already happened, it has near zero predictive value, and likely will always have near zero predictive value. For example, adding more sine waves to a signal can better match the data a function has produced, but may not have any value on understanding what the function WILL produce – that takes understanding (or sheer luck).
Robert of Texas on April 18, 2017 at 8:38 am
Good luck at trying to model the climate system with no understanding of how many variables are important.
Maybe you start here:
https://climexp.knmi.nl/selectfield_cmip5.cgi?id=someone@somewhere
http://cmip-pcmdi.llnl.gov/cmip5/data_getting_started.html
This is a very good report. BUT…
It is much too technical for 90% of the people who need to understand the topic.
What can you do for people with a lower level of technical capability?
Say… a high school education???
I can’t do much for them. I lack the patience to be a teacher.
TCE:
I suspect your requirement may be met by an updated version of my speech in 2008 to the St Andrews University Student Union Debate on the motion ‘This House Believes There is Need to Take Action to Prevent Global Climate Change’.
The motion was proposed by three speakers and was opposed by Neils-Axel ‘Niklas’ Morner, Viscount Christopher Monkton, and me.
Niklas, Christopher and me expected to lose the debate because the students had been subjected to pro-AGW propaganda throughout their young lives, but we consoled ourselves with the knowledge that we had all the evidence so would win the arguments. In the event we won both the arguments and the vote.
Each of the six speakers spoke for a strictly limited time of 3 minutes. A proposer spoke first, then me, then the second proposer, then Niklas, then the third proposer, and finally Christopher before debate was opened to the floor prior to taking of the vote.
I copy my speech below.
Richard
Address to St Andrews University Student Union Debate
Madam President, Friends:
Climate change is a serious problem. All governments need to address it.
In the Bronze Age Joseph (with the Technicolour Dreamcoat) told Pharaoh that climate has always changed everywhere: it always will. He told Pharaoh to prepare for bad times when in good times, and all sensible governments have adopted that policy throughout the millennia since.
It’s a sensible policy because people merely complain at taxes in good times. They revolt if short of food in bad times. But several governments have abandoned it and, instead, are trying to stabilise the climate of the entire Earth by controlling it.
This attempt at global climate control arises from the hypothesis of anthropogenic (that is, man-made) global warming (AGW).
AGW does not pose a global crisis but the policy does, because it threatens constraint of fossil fuels and that constraint would kill millions – probably billions – of people.
There’s no evidence for man-made global warming; none, not any of any kind.
The existence of global warming is not evidence of anthropogenic global warming because warming of the Earth doesn’t prove human’s warmed it. At issue is whether humans are or are not affecting changes to the Earth’s temperature that have always happened naturally.
The AGW-hypothesis says increased greenhouse gases – notably carbon dioxide – in the air raise global temperature, and anthropogenic emissions of carbon dioxide are increasing the carbon dioxide in the air to overwhelm the natural climate system.
But empirical evidence says the hypothesis is wrong.
1. The anthropogenic emissions and global temperature do not correlate.
2. Change to atmospheric carbon dioxide concentration follows change to global temperature at all time scales.
3. Recent rise in global temperature has not been induced by rise in atmospheric carbon dioxide concentrations.
Global temperature fell from 1940 to 1970, rose to 1998, and has fallen since. That’s 40 years of cooling and 28 years of warming. Global temperature is now similar to that of 1990. But atmospheric carbon dioxide concentration has increased at a near constant rate and by more than 30% since 1940. It has increased by 8% since 1990.
4. Rise in global temperature has not been induced by anthropogenic emissions of carbon dioxide.
Over 80% of the emissions have been since 1940 and the emissions have been increasing at a compound rate. But since 1940 there have been 40 years of cooling with only 28 years of warming. There’s been no significant warming since 1995, and global temperature has fallen since the high it had 10 years ago.
5. The pattern of atmospheric warming predicted by the AGW hypothesis is absent.
The hypothesis predicts most warming of the air at altitude in the tropics. Measurements from weather balloons and from satellites both show cooling at altitude in the tropics.
So, the normal rules of science say the AGW-hypothesis is completely refuted.
Nothing the hypothesis predicts is observed, and the opposites of some of its predictions are observed.
But some people promote the hypothesis. They’ve several reasons (personal financial gain, protection of their career histories and futures, political opportunism, and…). But support of science cannot be one such motive because science denies the hypothesis. So, additional scientific information cannot displace the AGW-hypothesis and cannot silence its advocates. And those advocates are not scientists despite some of them claiming they are.
Advocates promote AGW using three kinds of pseudo-science.
They use ‘argument from ignorance’. This isn’t new. In the Middle Ages experts said, “We don’t know what causes crops to fail: it must be witches: we must eliminate them.” Now, experts say, “We don’t know what causes global climate change: it must be emissions from human activity: we must eliminate them.” Of course, they phrase it differently saying they can’t match historical climate change with known climate mechanisms unless an anthropogenic effect is included. But evidence for this “anthropogenic effect” is no more than the evidence for witches.
Advocates rely on not-validated computer models.
No model’s predictions should be trusted unless the model has demonstrated forecasting skill. But climate models have not existed for 20, 50 or 100 years, so they cannot have demonstrated forecasting skill.
Simply, the climate models’ predictions of the future have the same demonstrated reliability as the casting of chicken bones to predict the future.
Avocates use the Precautionary Principle saying we should stop greenhouse gas emissions in case the AGW hypothesis is right. But that turns the Principle on its head.
Stopping the emissions would reduce fossil fuel usage with resulting economic damage. This would be worse than the ‘oil crisis’ of the 1970s because the reduction would be greater, would be permanent, and energy use has increased since then. The economic disruption would be world-wide. Major effects would be in the developed world because it has the largest economies. Worst effects would be on the world’s poorest peoples: people near starvation are starved by it.
The precautionary principle says we should not accept the risks of certain economic disruption in attempt to control the world’s climate on the basis of assumptions that have no supporting evidence and merely because they’ve been described using computer games.
So, global warming is not a global crisis but the unfounded fear of global warming is. It threatens a constraint of fossil fuel use that would kill millions – probably billions – of people.
Thankyou.
I’m willing to help.
A million dollars? Chump change. If one could actually predict climate with any sort of granularity you could be a billionaire. The fact they are not says a lot actually. They need grants because their science is not good enough to make money from on its own.
Does not have to be even year to year. Decadal scales are fine. Tell me with any useful and repeatable level of accuracy when the next California drought is going to be (sorry about your last one) and I will make you a billionaire (and you could probably get a Nobel too actually….). Tell me when the Northwest Passage will be open for shipping. Tell me where the greening of arid lands will happen fastest – you can be rich!
Of course we will start with your money in case you are wrong 🙂
No correlation between warming and emissions
https://papers.ssrn.com/sol3/papers.cfm?abstract_id=2956179
In the 1980s when I was involved in some double-blind testing of audio equipment, I found that the term “null hypothesis” was frequently misunderstood, and often led to confusion.
And the confusion was among people who were often engineers, or had other science degrees.
I don’t know why “null hypothesis” caused so much confusion, but I decided to never use it again (until today).
I have not read any of the comments here … and wondered if the word still causes any confusion.
Complicated words are not required for clear, understandable communications.
It’s confusing, in part, because the goal in science is to nullify the null hypothesis.