Guest Post by Werner Brozek, and Edited by Just The Facts
| Source | UAH | RSS | Had4 | Sst3 | GISS |
|---|---|---|---|---|---|
| JFM17ave | 0.277 | 0.399 | 0.517 | ||
| JFM15ave | 0.215 | 0.334 | 0.423 | ||
| JF17ave | 0.793 | 1.01 | |||
| JF15ave | 0.697 | 0.85 | |||
| diff | 0.062 | 0.065 | 0.096 | 0.094 | 0.16 |
| months | Aug | Sep | Oct | Nov | Dec |
| ENSO16 | -0.6 | -0.8 | -0.8 | -0.8 | -0.7 |
| ENSO14 | 0.0 | 0.1 | 0.4 | 0.5 | 0.6 |
| diff | -0.6 | -0.9 | -1.2 | -1.3 | -1.3 |
ENSO data above from NOAA.
Based upon NOAA’s methodology of defining La Niñas and El Niños, they have concluded that the last five months of 2016 were La Niña months. My understanding is that following on the heels of five La Niña months, anomalies should be below average as there is a certain lag between ENSO numbers and global anomalies. The bottom part of the above table provides ENSO numbers for the five months from August to December of 2016 as well as the ENSO numbers for the five months from August to December of 2014.
Additionally, the differences are provided for each month. Note that all numbers are negative, so the ENSO numbers for the last five months of 2016 were significantly below those of 2014. The top part of the table provides January to March averages for the two satellite data sets and HadSST3 that followed on the heels of the 2014 and 2016 ENSO numbers. As well, the January and February averages are given for two surface data sets. So these numbers are for the years 2015 and 2017. Then the differences are given. Note that all differences are positive! This is exactly the opposite that is expected to happen with the ENSO differences being negative for the preceding five months! What is going on?
Analyzing the numbers further gives more unusual information. The HadCRUT4.5 average for January and February is 0.793. This would set a new record if it stayed this way as it would beat the 0.773 mark for 2016. That is of course ignoring statistical significances for now. As well, the January and February anomalies are the second highest on record. These numbers would normally be expected to follow a very strong El Niño. The 2017 numbers for January and February are even higher than those for 1998 for HadCRUT4.5.
For GISS, the situation is similar. The GISS average for January and February is 1.01. This would set a new record if it stayed this way as it would beat the 0.98 mark for 2016. As well, the January and February anomalies are the second highest on record. The 2017 numbers for January and February are also even higher than those for 1998 for GISS.
The sea surface numbers are a bit more reasonable since 0.517 would put HadSST3 in third place. But even this would normally be expected after a few El Niño months.
The numbers for the satellite data sets are still a bit high, but much better than for the surface data sets. UAH6.0 would rank in fourth place if its three month average were to hold for the whole year. The 2017 numbers for January, February and March are lower than those for 1998, which is what one would expect. RSS would also rank in fourth place if its three month average were to hold for the whole year. The 2017 numbers for January, February and March are also lower than those for 1998, which is again also what one would expect.
In my mind, this brings up the question as to whether or not the criteria for deciding when to declare a La Nina is correct. Should a different part of the ocean be considered? Or should the threshold be lowered to -1.0 C rather than -0.5 C? If you wish, please give your answer to the multiple choice question in the conclusion.
In the sections below, we will present you with the latest facts. The information will be presented in two sections and an appendix. The first section will show for how long there has been no statistically significant warming on several data sets. The second section will show how 2017 compares with 2016, the warmest year so far, and the warmest months on record so far. The appendix will illustrate sections 1 and 2 in a different way. Graphs and a table will be used to illustrate the data.
Section 1
For this analysis, data was retrieved from Nick Stokes’ Trendviewer available on his website. This analysis indicates for how long there has not been statistically significant warming according to Nick’s criteria. Data go to their latest update for each set. In every case, note that the lower error bar is negative so a slope of 0 cannot be ruled out from the month indicated.
On several different data sets, there has been no statistically significant warming for between 0 and 23 years according to Nick’s criteria. Cl stands for the confidence limits at the 95% level.
The details for several sets are below.
For UAH6.0: Since December 1993: Cl from -0.009 to 1.776
This is 23 years and 3 months.
For RSS: Since October 1994: Cl from -0.006 to 1.768 This is 22 years and 5 months.
For Hadcrut4.5: The warming is statistically significant for all periods above four years.
For Hadsst3: Since May 1997: Cl from -0.015 to 2.078 This is 19 years and 10 months.
For GISS: The warming is statistically significant for all periods above four years.
Section 2
This section shows data about 2017 and other information in the form of a table. The table shows the five data sources along the top and other places so they should be visible at all times. The sources are UAH, RSS, Hadcrut4, Hadsst3, and GISS.
Down the column, are the following:
1. 16ra: This is the final ranking for 2016 on each data set. On all data sets, 2016 set a new record. How statistically significant the records were was covered in an earlier post.:
2. 16a: Here I give the average anomaly for 2016.
3. mon: This is the month where that particular data set showed the highest anomaly. The months are identified by the first three letters of the month and the last two numbers of the year.
4. ano: This is the anomaly of the month just above.
5. sig: This the first month for which warming is not statistically significant according to Nick’s criteria. The first three letters of the month are followed by the last two numbers of the year.
6. sy/m: This is the years and months for row 5.
7. Jan: This is the January 2017 anomaly for that particular data set.
8. Feb: This is the February 2017 anomaly for that particular data set if available, etc.
10. ave: This is the average anomaly of all available months.
11. rnk: This is the 2017 rank for each particular data set assuming the average of the anomalies stay that way all year. Of course they won’t, but think of it as an update 10 minutes into a game.
| Source | UAH | RSS | Had4 | Sst3 | GISS |
|---|---|---|---|---|---|
| 1.16ra | 1st | 1st | 1st | 1st | 1st |
| 2.16a | 0.503 | 0.574 | 0.773 | 0.613 | 0.98 |
| 3.mon | Feb16 | Feb16 | Feb16 | Jan16 | Feb16 |
| 4.ano | 0.828 | 0.995 | 1.070 | 0.732 | 1.32 |
| 5.sig | Dec93 | Oct94 | May97 | ||
| 6.sy/m | 23/3 | 22/5 | 19/10 | ||
| 7.Jan | 0.298 | 0.409 | 0.738 | 0.484 | 0.92 |
| 8.Feb | 0.348 | 0.440 | 0.851 | 0.520 | 1.10 |
| 9.Mar | 0.185 | 0.349 | 0.550 | ||
| 10.ave | 0.277 | 0.399 | 0.793 | 0.517 | 1.01 |
| 11.rnk | 4th | 4th | 1st | 3rd | 1st |
| Source | UAH | RSS | Had4 | Sst3 | GISS |
If you wish to verify all of the latest anomalies, go to the following:
For UAH, version 6.0beta5 was used.
http://www.nsstc.uah.edu/data/msu/v6.0/tlt/tltglhmam_6.0.txt
For RSS, see: ftp://ftp.ssmi.com/msu/monthly_time_series/rss_monthly_msu_amsu_channel_tlt_anomalies_land_and_ocean_v03_3.txt
For Hadcrut4, see: http://www.metoffice.gov.uk/hadobs/hadcrut4/data/current/time_series/HadCRUT.4.5.0.0.monthly_ns_avg.txt
For Hadsst3, see: https://crudata.uea.ac.uk/cru/data/temperature/HadSST3-gl.dat
For GISS, see:
http://data.giss.nasa.gov/gistemp/tabledata_v3/GLB.Ts+dSST.txt
To see all points since January 2016 in the form of a graph, see the WFT graph below.
 - 1979 to Present")
As you can see, all lines have been offset so they all start at the same place in January 2016. This makes it easy to compare January 2016 with the latest anomaly.
The thick double line is the WTI which shows the average of RSS, UAH, HadCRUT4.5 and GISS.
Appendix
In this part, we are summarizing data for each set separately.
UAH6.0beta5
For UAH: There is no statistically significant warming since December 1993: Cl from -0.009 to 1.776. (This is using version 6.0 according to Nick’s program.)
The UAH average anomaly so far is 0.277. This would rank in fourth place if it stayed this way. 2016 was the warmest year at 0.503. The highest ever monthly anomaly was in February of 2016 when it reached 0.828.
RSS
For RSS: There is no statistically significant warming since October 1994: Cl from -0.006 to 1.768.
The RSS average anomaly so far is 0.399. This would rank in fourth place if it stayed this way. 2016 was the warmest year at 0.574. The highest ever monthly anomaly was in February of 2016 when it reached 0.995.
Hadcrut4.5
For Hadcrut4.5: The warming is significant for all periods above four years.
The Hadcrut4.5 average anomaly for 2016 was 0.773. This set a new record. The highest ever monthly anomaly was in February of 2016 when it reached 1.070. The HadCRUT4.5 average so far is 0.793 which would rank 2017 in first place if it stayed this way.
Hadsst3
For Hadsst3: There is no statistically significant warming since May 1997: Cl from -0.015 to 2.078.
The Hadsst3 average so far is 0.517 which would rank 2017 in third place if it stayed this way. The highest ever monthly anomaly was in January of 2016 when it reached 0.732.
GISS
For GISS: The warming is significant for all periods above four years.
The GISS average anomaly for 2016 was 0.98. This set a new record. The highest ever monthly anomaly was in February of 2016 when it reached 1.32. The GISS average so far is 1.01 which would rank 2017 in first place if it stayed this way.
Conclusion
What is the most important thing that determines anomalies?
A. Changes in ENSO numbers
B. Changes in the sun
C. Changes in CO2
D. A thumb on the scale
E. Other (Please specify)
I am not comfortable implying that the RSS and UTI would have a ‘thumb on the scale’ but given any group it is always a possibility. But the lead up to Karl et al… tells me straight up collusion to create a ‘data product’ could be included.
Notably, the satellite data shown in the article are for 3 months Jan-March, and the surface data are for 2 months Jan-Feb. The satellite data tanked in March, at least UAH did. UAH was +.30 in January, +.35 in February, and +.19 in March. Considering only January and February like the surface datasets were considered, UAH came in at +.325 (average of the readings published at drroyspencer.com, where they are stated to the nearest hundredth of a degree). This is .11 degree C warmer than the JFM 2015 UAH, and .09 degree C warmer than JF 2015 UAH. That agrees well with JF HadCRUT4 warming .10 degree from 2015 to 2017, not so well with GISS having warmed by .16 degree C from JF 2015 to JF 2017.
You raise an excellent point! However you know how things are with the release of numbers and how slow Hadcrut is. Keep in mind that Hadcrut is partly based on Hadsst3 and this is out and it increased from 0.52 in February to 0.55 in March. As well, according to:
http://www.moyhu.blogspot.com.au/p/latest-ice-and-temperature-data.html#NCAR
March came in at 0.01 lower than February. While this does not necessarily mean Hadcrut4.5 will also be 0.01 lower in March, I am confident that the March anomaly will not fundamentally change the thrust of my argument.
Here:
https://wattsupwiththat.com/2017/03/31/march-2017-projected-temperature-anomalies-from-ncepncar-data/
Walter Dnes predicts the March Hadcrut to be 0.817. Should this be the case, its first place rank is further solidified.
I just checked UAH land and ocean. From February to March, UAH land went down .08 degree and UAH ocean went down .20 degree. While HadSST3 went up .03 degree? At this moment, I am guessing that HadCRUT4.5 won’t change much from February to March, and this may be an example of noise in the difference between the surface and the satellite-measured lower troposphere.
Something else worries me – how GISS is outwarming HadCRUT, especially 1999-onwards and 1950-onwards. GISS warmed .06 degree C more than HadCRUT did from JF 2015 to JF 2017. This is added on top of the GISS figure for the year 2014 (the last year to have a full year figure published with use of ERSSTv3b) being warmed by .06 degree C by the switch from ERSSTv3b to ERSSTv4.
On top of that, as I pointed out in this earlier article of mine here:
https://wattsupwiththat.com/2017/01/26/warmest-ten-years-on-record-now-includes-all-december-data/
If the globe is actually warming up in small increments, that’s good news — farther away from glaciation & CO2 starvation.
E: An agenda
or…
E: Funding
Ok, I know I’m a grumpy old cynic… 🙂
So your two reasons for E suggest you support D. Right?
In a way, although I was just trying to be be more specific about why the thumb was on the scale…!
E: Agenda meets E: Funding
Apparently water may not be the only thing that flows uphill towards money.
D….a thumb on the definition
..so they will claim a major La Nina offset by global warming
It was actually a weak and short lived La Nina. But even so, it should not potentially lead to new records.
Two considerations.
1) Low Arctic sea ice still has a large impact in the NH winter months. This will go away in the summer months.
2) Not really a La Nina in the entire Pacific. Only in the Nino 3.4 area. The eastern Pacific (Nino 1-2) saw very warm temperatures. This essentially negated the cooling of the central Pacific.
Perhaps the average of all regions should then be considered.
Werner, I think you are right. At least for looking at the affect on global temperatures. The real question is how much energy is being released by the oceans which is the real consideration with ENSO. I think we’ve seen some different patterns recently and the NOAA method of determining El Nino is based on patterns they had seen in the past. I think they need to rethink their process.
Werner Brozek on April 11, 2017 at 10:55 am
Perhaps the average of all regions should then be considered.
Indeed! When I have enough time to do, I’ll manage to buid averages of UAH6.0’s 2.5° grid for all NINO regions as described in
https://climatedataguide.ucar.edu/climate-data/nino-sst-indices-nino-12-3-34-4-oni-and-tni
i.e.
Niño 1+2 (0-10S, 90W-80W)
Niño 3 (5N-5S, 150W-90W)
Niño 4 (5N-5S, 160E-150W)
It will be interesting how far this average differs from
Niño 3.4 (5N-5S, 170W-120W)
For a beginning, here is a comparison of UAH6.0 data for the Globe, the Tropics (20S-20N) and for Niño 3.4:
http://fs5.directupload.net/images/170413/6o8hl2r4.jpg
Interesting: UAH’s response in the Tropics is higher than in ENSO’s backyard. This does not wonder me.
Many forecasters are predicting a return to El Nino by mid summer.
NASA says the satellites are a more accurate gauge of temperature than the surface temperature network. It looks like the surface temperature charts are WAY off, compared to the satellite charts. If you go by NASA, you must conclude that the surface temperature charts do not represent reality.
The surface temperature charts are a joke. A very expensive joke.
Nah, the satellites are usually worse than the ground measurements. You can’t calibrate them, we usually only have one measuring at a time, their orbits and sensor directions change over time, and they weren’t even designed to measure temperature. And they rely on computer models for key assumptions, to turn raw data into temperatures.
Honestly, it’s a surprise they can get any useful data out of the satellites whatsoever. New “adjustments” to the satellite temperature series show much bigger changes than the ones for the ground series, so they’re definitely not done yet. The conclusions are still kinda jumping around.
It’d be pretty useful if we had a couple satellites up there actually designed for the purpose of measuring temps. But… we don’t.
You mean they’re just as bad as the surface temperature readings that come from all those stations surrounded by AC units or at the end of runways that have seen traffic double over the past 10 years.
Maybe you should ask Roy Spencer for a proper introduction on the UAH data and satellite data in general.
The satellites are regularly calibrated against balloon measurements.
The satellites are re-calibrated every day. I’m surprised someone as expert as yourself didn’t know that.
It seems to me what we need is actually a group of satellites looking down at total energy across all wavelengths with orbits to cover the entire planet over time for overall comparison with input energy. Billions spent on climate crap and no one wants to know this fundamental, definitive fact? Ridiculous!
One has to wonder, given your excellent knowledge of satellite sensor technology, how weather and television satellites continue to operate using the same sensor technology.
@ john harmsworth:
NASA projects
ERBE – Earth Radiation Budget Experiment
CERES – Clouds Earth Radiant Energy System
So what was the purpose of putting those satellites into orbit at an expense of tens—if not hundreds—of millions of dollars if they don’t work?
They have been calibrated and confirmed via weather balloons AFAIK.
GISS had a big adjustment when it started using ERSSTv4. The last full year before the switch from ERSSTv3b to ERSSTv4, 2014, had its temperature anomaly as reported by GISS increased by .06 degree C from that change. This is just the greatest one of many changes to GISS, and the others mostly change recent times to be reported warmer than they used to be, and older times as cooler than they used to be. The same is the case with HadCRUT, although they seem less than half as overcooked as GISS – HadCRUT’s current sea surface dataset is HadSST3, which seems similar to ERSSTv3b rather than the outlier ERSSTv4. (Some of these changes are justified, for example to compensate for official weather stations for cities being moved from city centers to airports at the edge of the cities, and being moved more out of town as cities expand.)
As for adjustments to the satellite data: They don’t show a strong trend of moving in one direction as is the case with the surface datasets. UAH has had changes in both directions, and its greatest change to report less warming increased its agreement with RSS. The most recent change in RSS has it showing more warming (but still closer UAH 6 than to UAH 5.6), and another change in RSS to report more warming will occur if its lower troposphere dataset is changed to V.4.0.
Look for a correlation between sets of independent data. The UAH and RSS are very similar and correspond well to radiosonde, although using balloon measurements for calibration may cause the correlation. I don’t know how the data for GISS and HadCRUT can be as reliable when many measuring stations have become urbanized and when stations have been actually moved then their data ‘fudged’. It would seem that the best approach is taking the unadjusted data from rural ground stations, yet then the global coverage is poor and I always distrust global mathematical averaging. Always a temptation to control your data when you already know the right answer.
If we go by the El Nino 3.4 index, there was no La Nina because the anomaly never went below -0.5 at all, let alone stayed there for three months. link
Also the MEI-Index https://www.esrl.noaa.gov/psd/enso/mei/ did not see a LaNina but neutral conditions.
The ONI-index is allone with it’s LaNina in the end of 2016. One- index-syndrome?
Perhaps they need to change their definitions to make their status meaningful.
Perhaps that is a good clue! But it did reach the threshold according to:
http://www.cpc.ncep.noaa.gov/products/analysis_monitoring/lanina/enso_evolution-status-fcsts-web.pdf
How do we explain the difference between NOAA and the Australian BOM?
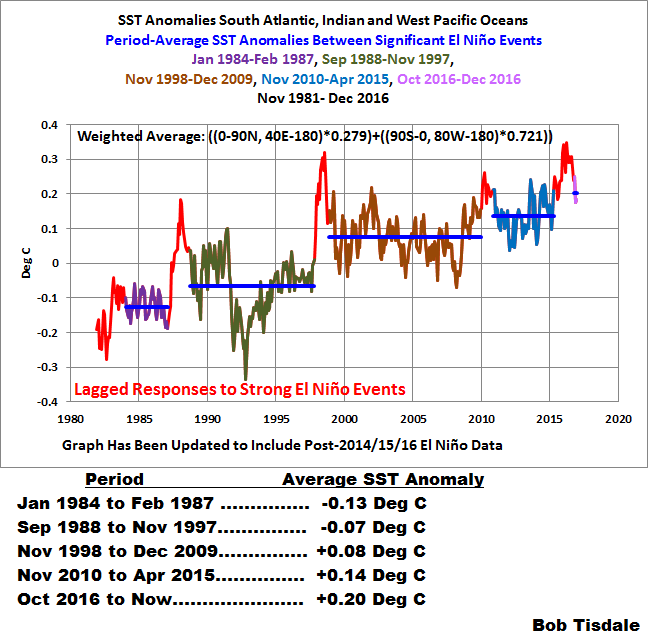
Hi, cBob — Bob Tisdale gives us a good idea of the answer to your question regarding:
Based upon NOAA’s methodology of defining La Niñas and El Niños, they have concluded that the last five months of 2016 were La Niña months. (above article)
Answer:
(Source: Bob Tisdale, https://wattsupwiththat.com/2016/12/05/early-december-2016-la-nina-update-mixed-signals-from-noaa-and-bom/ )
In other words:
There has not yet been a strong or durable enough La Nina to counter the 2014/15 El Nino. Any warming, now, is thus, STILL NATURAL.
*************************
Reminder: No matter WHAT warming is happening, there is still no evidence — not one piece of data — proving causation between human CO2 and climate shifts. None.
LOL — as you can see, I
(my comments begin again below the BOM quote which ends with the word: “INACTIVE.”)
Dr. Tucci, would be pleased (I hope)! 🙂
Or, perhaps, no….
Attenti! I can hear him shout. 🙂
“How do we explain the difference between NOAA and the Australian BOM?”
One has a bigger thumb?
@ Janice Moore:
{HTML} Tag! You’re It!
I am It! 🙂
http://0.media.collegehumor.cvcdn.com/39/91/785a50947e36eac841bfe937e92b4002.jpg
D. of course. Gavins’ and Karl’s thumbs on land and sea data are probably good for at least +0.4 K of the GISStemp anomaly.
…. from the Halls of Montezuma to the shores of Tripoli….
“This is exactly the opposite that is expected to happen with the ENSO differences being negative for the preceding five months! What is going on?”
Well, one thing that would fit the evidence is that the atmosphere is warming. That is why 2017 is warmer than 2014, even when conditions are closer to La Nina.
May be worth considering.
According to this study http://onlinelibrary.wiley.com/doi/10.1002/2017GL072908/abstract the heat release from ocean into atmosphere was roughly double in comparison to the 1997/98 event:
From the paper:
Heat release in 2014/15/16 (upper part) and 1996/97/98.
Key sentence from the study: ” During the prolonged warm conditions of 2014-2016 the heating of the tropical atmosphere persisted for over two years (Figure 1c), resulting in a total atmospheric heat release roughly double that during the 1997 El Niño (Figure 1f).” ( Fig. 1c and 1f are shown above.
Guess “Godzilla El Nino” might be a good description then.
So are you suggesting that five months of La Nina is not enough to wipe this out?
So why did so much heat make such a small impression on global temps relative to 1998? $64 question?
Bingo. That’s a giant question I’d like to see the so-called climate “scientists” answer up front and center.
Seems to me so many differing lines of evidence cannot even be resolved with itself, and yet somehow we’re being asked as John & Jane Q. Public to take the meme headlines as evidential proof positive that we’re to blame and something. must. be. done. now.
This … this kind of discrepancy which is glossed over and unexplained is precisely why I cannot trust the official record nor be anything but a skeptic. And for holding such scientific integrity, I’m labeled as a liar, crook, fossil fuel paid troll, and worse?
And a lot of that water vapor is blown out of the tropic where it cools as it move towards the poles. Think of the continental as cooling/drying plains for tropical air.
If we were talking about a time span of 30 years, that would have some relevance, but in my opinion, two years should not be enough to completely counteract a La Nina.
Werner: from Nino3,4 AND MEI there was no LaNina and the heat from the event also goes back into the ( other) oceans, so it could take some month more to wipe it out?
I guess we will have to wait a few more months to see. However the ENSO numbers have been going up since November so that might counteract this.
seaice1
Maybe you’re getting too far ahead of yourself and in the process of doing a “GISS”: for perspective, we are 11/04. 2017 “warmer than”… when we’ve just closed out Q1?
I was wondering why Darwin had a record cold day yesterday, and record early snow for the Oz Blue Mountains!
One or two record cold or record warm spots are relatively meaningless.
B
Are you suggesting the sun got so much stronger in only two years to completely overshadow the change in ENSO numbers?
The Sun Controls the Climate by Driving the H2O cycle, The Carbon Cycle, The temperature difference between night and day, Summer and Winter, Ice Ages and interglacial warming periods, Polar and equatorial Regions. The Sun is the Boss. DUH!
No one disputes that! The question is whether or not the boss changed its colours over the last two years.
“Are you suggesting the sun got so much stronger in only two years to completely overshadow the change in ENSO numbers?”
How on Earth did you infer that from “B”?
Sorry – it meant answer B, The Sun. I see now.
A. Changes in ENSO
numbers**Sometimes the numbers reflect reality, as in Hadsst3, UAH, and RSS — but, at other times, e.g., GISS and H-crut4.5, they reflect human influence, not ocean/atmosphere influence —
Expert testimony supporting that assertion:
(Source: Bob Tisdale, https://wattsupwiththat.com/2015/06/04/noaancdcs-new-pause-buster-paper-a-laughable-attempt-to-create-warming-by-adjusting-past-data/ ; See also Ross McKitrick, here: https://wattsupwiththat.com/2015/06/04/a-first-look-at-possible-artifacts-of-data-biases-in-the-recent-global-surface-warming-hiatus-by-karl-et-al-science-4-june-2015/ )
Reason for choosing A:
(Who Turned on the Heat, Bob Tisdale (quoted by Tisdale in Climate Models Fail at p. 283)
Reason for NOT choosing C:
(Climate Models Fail, Bob Tisdale, pp. 283-4)
Reason for NOT choosing B:
The sun IS an essential part of ENSO, but, changes in TSI (or like solar activity measures), per se, are too small to account for major climate shifts. While there is a plausible theory about UV/solar/atmospheric chemistry and climate shifts, at this time, nevertheless, it is: not proven.
So, Mr. Brozek and J. T. Facts — I’m going with A! 🙂
***********************************************************
Thank you for all your YEARS of dedicated, painstaking, work to promote TRUTH in science, Mr. Brozek and J. T. Facts!
You are welcome! And thank you for your detailed comments!
🙂
Noticed NOAA sea level data for the battery NYC and Wash DC have no data points later than Dec 2016. Unusual? Suspect this is similar for the rest of the stations.
Howard, When this happens, you see a new revised product come out showing enhanced results of warming. They’ve done this several times in the past with sea level and temperatures. Sea ice databases are quieter for about a year.
If you’re looking at my site, it’s my fault. I’m overdue updating the sealevel.info data.
The Battery (NYC) has data through February 2017, here:
https://tidesandcurrents.noaa.gov/sltrends/downloadMeanSeaLevelTrendsCSV.htm?stnid=8518750
Washington, DC has data through February 2017, too, but it’s missing August, 2016:
https://tidesandcurrents.noaa.gov/sltrends/downloadMeanSeaLevelTrendsCSV.htm?stnid=8594900
“This would set a new record if it stayed this way as it would beat the 0.773 mark for 2016. That is of course ignoring statistical significances for now.”
Well, then it actually does NOT beat the mark for 2016, does it? So why would you even make such a silly statement?
Proper treatment and acknowledgment of measurement statistics is the heart of scientific analysis.
It depends on how you look at it. For example if GISS goes up by 0.03 in 2017, then we might say that there is a 65% chance that a new record has indeed been set.
“What is going on?” (B).
GISS and HAD may have their thumbs on the scales too; GS is from the UK – all vested warmist activists.
UAH is dependable, and is following TSI nicely so far this year.
2017 1au TSI UAH
Jan 1360.7990 0.298
Feb 1360.8274 0.348
Mar 1360.7426 0.185
March TSI ended down sharply due to the recent passage of a large area sunspot group, and April TSI is starting out slow for the same reason. Overall TSI has changed very slowly since the big 2016 drop-off one year ago – all normal with several years to go until the minimum with only about a 0.2-0.25 drop left.
HadSST3 over the last 15 years or so has taken on a summer NH spike, something that may have always been there prior to then. Perhaps better data collection and methods have helped expose the daily solar insolation change that annually favors the NH at the spring equinox, and oppositely at the fall equinox.
http://climate4you.com/images/SunspotsMonthlySIDC%20and%20HadSST3%20GlobalMonthlyTempSince1960%20WithSunspotPeriodNumber.gif
Nino34 has recovered from the initial solar drop-off last year back to a point where the region may return to ENSO positive during the summer months into late fall simply from normal summer NH heating and due to the fact that ocean temps that were 0.3-0.4 all winter now only have a short trip upward to get into ENSO territory.
Warm water from the SH summer has collected near the SA west coast and appears to be circulating northward into the tropical equatorial zone.
http://www.ospo.noaa.gov/data/sst/anomaly/2017/anomnight.4.10.2017.gif
If there is an ENSO this year it’ll be like the 2006 situation. Compare the current image above to before the ’06 ENSO, @ /2006/anomnight.4.11.2006.gif, then just past the peak after the annual perihelion in January, @ 2007/anomnight.1.20.2007.gif, and after it quickly cools down along the equator within a month @ 2007/anomnight.2.20.2007.gif, and so on for the rest of 2007 into 2008.
The 2017 NH summer sun might boost temps into ENSO range that may well last until past the 2018 perihelion, that will certainly be followed by a deep La Nina into the solar minimum, until albedo changes from cold ocean surface low evaporation as it did in 2008, and temps rise again, until TSI takes off into the next cycle, driving the next big ENSO, just as the sun did in SC24 in 09/10.
Thank you!
E. other: the Eastern Pacific, from Chile to Alaska, cooled from 1980 to 2014. So people got used to a cold La Niña pattern aftermath. The Eastern Pacific has been very warm since 2014: 2014, 2015, and 2016 all set records as warmest years. So simply put, natural variation was offsetting AGW from ~1983 to ~2014, and has been accentuating it since then. How long will this go on? Could last for 10 years, and we’re 3 years into it. Or, it could end next month. Nobody really knows. One side tends to dismiss natural variation as it is used as a weapon against them, and the other side only likes natural variation when it cools. Right now it’s warming, and it’s very aggressive.
Long wavelength oscillations, perhaps even longer than PDO.
Aren’t you missing 1998?
@ JCH
April 11, 2017 at 9:22 am: AGW hypothesizing is unphysical. Show us your experimental evidence. The ‘Mylar balloon’ expt was one good refutation of AGW, backing up Woods, Maxwell, Kaufmann et al.
Conclusion
What is the most important thing that determines anomalies?
A. Changes in ENSO numbers
B. Changes in the sun
C. Changes in CO2
D. A thumb on the scale
E. Other (Please specify)
Perhaps the threshold should be lowered to -1.0 C instead of -.5 C, so that only meaningful changes in temps are recorded in one camp or the other, making for a larger neutral zone.
I would say A & B, and in that order. Notwithstanding any thumbs on the scale, but lets hope that will be more vetted in future and checked. CO2 doesn’t have a whole lot to do with things on the shorter time scales, so that is a non starter.
Changes in the ENSO numbers gives us our annual present tense weather, which is what is being measured to give us the data sets we are discussing. But longer term, at least a solar cycle or two, changes in the Sun is what begins to drive the ENSO cycle, and becomes climate. Along with a multitude of other factors, including chaos events out of left field, like vulcanism for example.
The La Niña will be back.
The land surface temperatures change rapidly in response to a change to cloud cover. The ocean surface temperature is slower to respond and hence is an integral of the forcing.
http://www.ospo.noaa.gov/data/sst/anomaly/2017/anomnight.4.10.2017.gif
The La Niña was interrupted (weakened) by solar wind bursts from coronal holes on the surface of the sun. The coronal holes are now starting to dissipate and/or move to the polar regions of the sun where the winds that they produce no longer affects the earth’s climate.
Solar wind bursts create a space charge differential in the ionosphere which in turn causes an electric current to flow from high latitude regions to the equatorial regions.
The flow of electric charge changes cloud properties and cloud amounts in both regions which in turn causes warming.
See this link. The variable Ap is proportional to the solar wind bursts and is provided as a daily value and a monthly average.
http://www.solen.info/solar/
The variable Ap is a measurement of disturbances in the geomagnetic field which is primarily caused by solar wind. The effect of a single solar wind burst lasts for 3 to 5 days.
The solar wind bursts cause a warming of about 7 watts/m^2 as compared to the incorrect estimated warming for a doubling of atmospheric CO2 of 3.7 watts/m^2.
http://sait.oat.ts.astro.it/MmSAI/76/PDF/969.pdf
See section 5a) Modulation of the global electrical circuit in this review paper, by solar wind bursts and the process electroscavenging.
http://gacc.nifc.gov/sacc/predictive/SOLAR_WEATHER-CLIMATE_STUDIES/GEC-Solar%20Effects%20on%20Global%20Electric%20Circuit%20on%20clouds%20and%20climate%20Tinsley%202007.pdf
I’m running Windows 8 and using Firefox.
The auto running ad on this page keeps moving the page to the ad. It won’t stay at the top for me to read it.
Anyone else having this issue?
I’m not having that problem with Chrome on Win10.
You also might try refreshing the page, to get a different ad. Press Ctrl-F5.
Try cleaning out your cookies also as you may have a stragler from prior to the wordpress changes that Anthony mentioned a few weeks ago to correct some of those type issues I believe.
Mr. Mesecke: I used to (it started about 8 months ago). Now, I have Adblock. When wordpress gets its act together, I’d be happy to look at the ads for Anthony’s sake. Until then, I need adblock to be happy even coming here!
I use AdBlock and don’t have many problems with pop-up ads.
It’s fine now. I didn’t refresh or anything. I think it was just that Reduced Sugar ad.
“Don’t mess with my Throwback Mt. Dew.”
As a technodinosaur I am running Windows XP Pro with Firefox and have no problems with ads.
Here’s the Golden Gate Weather Service graph, with a couple of pink circles added. To my untrained eye, it looks like the 2015-16 El Niño is likely to be followed by an anemic La Niña like the one which followed the 1982-83 El Niño, rather than a strong La Niña like the ones which followed the 1972-73 and 1997-98 El Niños.
http://www.sealevel.info/oni_2017-4-11_ann1.png
If so, then we won’t be getting our beloved Pause back anytime soon. To get our Pause back we need a long, strong La Niña. That’s looking less and less likely.
Well, our dearly beloved need not return. She/he accomplished all that God planned for her/him on this earth. S l a y AGW:
(Ignacio is the code name for “any run-of-the-mill AGWer”).
CO2 UP. WARMING STOPPED.
(Please also note the section on “statistically significant” warming in the above article. That is, the STOP in warming actually is.)
It will come back. A big El Nino will help it to come back sooner.
All depends on your definition of the pause. Might not get back Monckton’s definition but with my definition it never ended. What I do is track only ENSO neutral months (with a lag). Still no warming since 1997 with this definition.
It is already back – you just have to learn to love it at 20 months, or whatever it is.
MarkW “It will come back. A big El Nino will help it to come back sooner.”
I think I see why you say this. An El Nino causes heat to be lost from the Earth system as whole, as it transfers energy from the sea, where it does not lose much energy, to the atmosphere, where it radiates to space. However, a look back at recent events does not inspire much confidence that El Nino result in temperatures reducing.
Please correct me if I am wrong about why you say this.
There’s a lot of energy stored in the oceans. They are inhomogeneous temperatures, on a spinning globe with the equator moving about 1,000 miles per hour. El Nino’s are just heat driven pumps of water water, circulating warm water to the polar regions eventually to cool. And open water in the arctic cools more than it warms.
That is true. But calling anything under at least 5 years a pause is not worth mentioning and just invites ridicule.
I’m going with E. Show the general public the USCRN data, I know it’s not the world, but a snapshot of unbiased weather stations here in America would be nice.
E. Lack of long term high resolution, accurate, geographically comprehensive, and trustworthy observations for robust comparison and analysis to derive anomolies. i.e. What was the specific composition of TSI during the LIA or the RWP?
Werner, a look at the rest of the ocean which shows cold blobs where they used to be warm is a new factor. The heating of the atmosphere during an El Nino has been typically pretty reliable and the 2015/16 one was a good example. However, the atmosphere may not care where the anomalous warm and cold waters are and I submit that the abundance of cool blobs replacing formerly warm ones is now cooling the atmosphere on average without a lot of help from the ENSO region. There definitely is something weird going on. There is a cold equatorial stripe, but it is offset to the west and there is no west Pacific warm pool to blow across to the east Pacific. Surely the cold water equatorial strip will cool the atmosphere whether it or not it lines up with the traditional ENSO boxes There will NOT be a new El Nino developing under these conditions. Something new is happening and so far it looks like more broadly based ocean cooling. Is it a big task to calculate from the patches of warm and cool waters a general trend up or down? Maybe we have to change to using overall SST temperatures to tell where things are going. Look at the La Nina conditions in California for example. This looks like a strong La Nina flooding of the state.
Thank you! At this point it certainly does not look as if the ENSO numbers are as important as I once thought. That is at least if the numbers are between -1 and +1.
One possibility is the negative PDO is trying to reestablish itself after the strong El Nino. Time will tell.
The atmosphere (air temps) just follows dew points(min temp), and sunshine(max temp).
Calling Bob Tisdale…
It is not really surprising that there is no following La Nina now since the 2016 el Nino was el Nino Modoki (“the same yet different”). A Modoki el Nino as defined by Bob Tisdale is one where the warming was centered in the central equatorial Pacific, rather than the east Pacific off Peru, in the case of a “standard” el Nino. In the standard el Nino the Bjerknes feedback gives an east to west pulse of el Nino warming with Peruvian cold upwelling interrupted, followed by a cold La Nina east to west pulse when the upwelling comes back with a vengeance.
Warming of SSTs in the central rather than eastern Pacific in a Modoki el Nino means that the Bjerknes feedback was not engaged. For this meaning there will be no strong La Nina cooling. In my view 2016 was not a real el Nino, as there was no excursion of the Bjerknes feedback.
What will likely follow now will not be another el Nino but a long period of neutrality.
Sorry but the data does not agree with your analysis that the 2015/16 El Nino was of a Modoki type. The warm temperature anomaly stretched all the way from 80W to 180W which is the entire Eastern Pacific.
http://www.cpc.ncep.noaa.gov/products/CDB/CDB_Archive_html/bulletin_012016/Tropics/figt9.shtml
http://www.cpc.ncep.noaa.gov/products/CDB/CDB_Archive_html/bulletin_012016/Tropics/figt18.shtml
Now, the convection anomaly was centered around the Dateline (160W – 180W)
http://www.cpc.ncep.noaa.gov/products/CDB/CDB_Archive_html/bulletin_012016/Tropics/figt8.shtml
Remember, water temperature does not drive the convection anyway – upper atmosphere divergence does.
http://www.cpc.ncep.noaa.gov/products/CDB/CDB_Archive_html/bulletin_012016/Tropics/figt23.shtml
All your links are NOAA. That’s where they have rooms full of people busy adjusting the SST baselines to keep the global warming story going. I’m not quite decided as to whether that can be called “data”.
2016 was Modoki, I checked every week and the trades were never interrupted, let alone reversed as in 1997. I also kept an eye on Peruvian anchovy fishery landings which did not show the crash that a true interruption of upwelling would cause – as happened in 1997, 1982, and other big non-Modoki real el Ninos. Climagesterium talking heads had however hyped up the el Nino forcing the anchovy fishmeal industry to expect a big disruption. The failure of this to happen, the feeding to the market of false information, significantly disrupted the industry with one or two bankruptcies. AGW anticapitalists of course enjoy acting like a bull in a china shop in the real economy since it’s not their jobs that are threatened.
Remember, water temperature does not drive the convection anyway – upper atmosphere divergence does.
It always surprises me how many people think oceanography should be done without ever looking at the ocean, but the atmosphere only. If that’s so then why does oceanography have “ocean” in it? Ocean processes cause atmospheric ones at least as much as the other way round. As I find myself having to repeat endlessly, the oceans are not a passive puddle.
It’s a coupled system, but I know that this fact leads to forbidden 🚫 places, e.g. chaotic / nonlinear phenomena, thus the turgid silence on ocean-atmosphere coupling.
Gary Pearse said:
Sorry…what?? Quit looking only at anomalies & look at the actual water temperatures and the Pacific Warm Pool is right where it is supposed to be. It does not show in the anomaly charts because…it’s temperature is near *normal*.
http://www.cpc.ncep.noaa.gov/products/precip/CWlink/MJO/enso.shtml
I’m on phone. Please go to the ENSO page and look at The ocean anomalies or scroll up and see the map in a comment. Note the cold areas of the Pacific including an unusually cool western Pacific temps from Camchatka down through far east, Australia, to Antarctica without interruption! I’ve been pointing out this development for about a year. Also, perhaps I misunderstood your post but I think you had your E and W Pacific reversed. My point is if the rest of the Pacific is cool and the equatorial strip of cool water is shifted west of the usual ENSO boxes, the cooling will take place no matter what the ENSO boxes show. There is something different here and you are not going to see the return of a real El Nino very soon
What is the most important thing that determines anomalies?
A. Changes in ENSO numbers
E. Other (Please specify) _the calculated anomalies
E: Stadium Wave
To be honest I don’t know how to read this graph:
http://www.wyattonearth.net/images/392_stad_wave.png
Unfortunately Wyatt and Curry only presented data through 2000 from what I see, but as I see it the major global energy waves would have peaked around 1985 on average and have been headed down the last 30 years, thus offsetting AGW. Now the average energy from the Stadium Wave would have bottomed out and be starting on its way back up.
If so, we will have the effects of Stadium Wave + AGW for a couple decades starting soon.
Since I really don’t know what that graph is supposed to be telling us, can someone who understands it lay it out for us?
Also, if anyone knows of an update to the graph, that would be interesting as well.
FYI: The home page for all things Stadium Wave is: http://www.wyattonearth.net/, but there isn’t a lot layman’s updates there in the last 2 or 3 years.
The AMO did not go positive until around 1995 and should remain that way until about 2025. Not sure what your chart is showing but as far as the AMO and its rather large impact on global temperatures, we are still seeing a strong warming influence.
Richard, looking more at the background of the graph, it agrees with you.
== details
I have a lot of respect for Judith Curry. I’ve decided to familiarize myself with the Stadium Wave theory which she has pushed as a potentially important mechanism driving natural variation. The graph is Fig 3 from the 2013 paper:
http://www.wyattonearth.net/images/9Wyatt_Curry_2013_author-version_manuscript.pdf
They show it more clearly in Fig 7 (pg 57), but I don’t see that available standalone on the Internet.
In the 2013 paper they chose to graph ngAMO which is the inverted AMO. As I view the graph, the red diamonds representing ngAMO cross zero around 1991, so a few years before your stated 1995, but not drasically different.
I have read with interest the many comments on recent temperature observations/guesses/estimations/snapshots. Concentrating one’s attention on the most recent values of noisy time series is not necessarily the most reliable method for understanding how the whole series is behaving. I would recommend some patience before committing to “conclusions” in these circumstances. Atmospheric and Sea temperatures have been known to wobble about for reasons not understood. Let’s wait until July before discussing April’s data too seriously.
On the other hand, there is fun in giving our opinions now as to what will happen in the future and then waiting three months to see who was closest to the truth in this matter.
You just gave me an idea for a future post. I could title it “La Nina revisited (Now Includes July and August Data)”. Then I could ask all commenters on this blog post to either defend their comments here or admit they were wrong here.
I think we have to declare the numbers for 2017 are nothing but fake news. 2017 is the first year in maybe the last 25 that on April 11 there are no flowers in Canada or northern US. This was a very long winter and unless they have super hot days in Russia I don’t see how those numbers can be correct. Does anybody from WUWT follow the average flowering time of hyacinths??
I do not claim any expertise but it immediately strikes me as odd that one should assume that the timeline of any natural pattern should be based on the human calendar. Why compare figures for each month in 2014 and 2016. Why should the cycle – if it is a regular cycle in the first place – have a periodicity of a whole number of months? Suppose it is 24.7 months, or 23.6? Good starting point obviously, but if you get strange results shouldn’t that assumption be reviewed?
That is a good point. It just happens to be the case that the last 5 months of 2016 were all La Nina months according to NOAA.
Does any one have the ability to plot the ENSO numbers since 2000 versus RSS on the same graph? It may look interesting!
I haven’t read the comments closely or the post regarding La Niña questions. In Oregon we have a pretty smart fella who serves the agriculture community quite well. Without spending time waffling on cause, he gets right to the meat, telling farmers what to expect in the coming months. And he doesn’t use models.
https://www.oregon.gov/ODA/programs/NaturalResources/Documents/Weather/dlongrange.pdf
Pacific SST and SSTA are definitely different animals…

@Phil Salmon April 11, 2017 at 10:34 am and others: 2014-16 was definitely some sort of Modoki, plus the Blob. Two large-ish energy fluxes to space at 3K. It has been noted that the equator is cooling now, overall. Ridiculous claims of boiling at the polar regions are just that, and ignore Holder’s Inequality. By such means are false non-pauses maintained while the real pause was never breached. That is what honest statisticians say. And Mann has just lied again, before gimlet-eyed Texans at the Congressionals. Game is nearly up, sonny boy.
Bob Tisdale showed us how the kelvin waves flow, also charge and discharge sequences. I have been wondering if lowered input would bring that cycle to a near-standstill. That is, long Las Nadas, more or less. Are we seeing this, or could it be starting now?
One item that occured to me, re: the really warm northern winter…
* Reduced Arctic sea ice cover, at or near record low levels means…
* Arctic areas that would normally be covered by ice approx -23C or -33C in winter, instead are open water at approx -3C (the freezing point of salty water).
* Net result is that many areas of the far north are literally experiencing (sea) surface temperatures 20 or 30 Celsius degrees above their normal (ice) surface temperatures.
* thanks to the Stefan-Boltzmann law https://en.wikipedia.org/wiki/Stefan%E2%80%93Boltzmann_law energy is radiated away proportional to the 4th (yes; fourth) power of temperature in Kelvin degrees.
* Methinks Dr. Trenberth is looking in the wrong direction. His “missing heat” is not going down into the oceans, but rather is being radiated away into space. This is not rocket science. Compare heat loss for a bald guy with a tuque, versus the same bald guy without a tuque, outdoors on a really cold day.
You (correctly) identified one heat transfer mechanism (increased long wave radiation to the atmosphere, then into the cold of outer space) that is gretaer for an equal area of open ocean compared to an ice-covered ocean. The open ocean (surface temperature of +1 to +4 degrees C) will radiate more energy that an ice-covered surface that will approximate the air temperatures of -5 deg C to -25 deg C. This increased LW radiation loss occurs over the entire 24 hour day. But the (much-feared) short wave absorption of solar energy occurs during the daylight hours only, and the low solar elevation angles of the summer sun between 6:00 PM and 6:00 AM produce light, but very little heat energy that is absorbed.
But an open ocean will also lose more heat than an ice-covered surface through increased evaporation, through increased convection losses from the wind-blown sea, and through reduced conduction losses (no “insulating” sea ice between the 2 degree ocean water and the -25 degree air.
That then, in a round about way, can be used to explain why GISS is so much higher than all others, namely by how it treats the Arctic. Thank you!
Good point! And we cannot forget the Antarctic also had low ice cover recently.
Werner Brozek
What can be shown is that reduced Antarctic sea ice coverage means increased heat absorption into the Antarctic ocean water nine months of the year, which then flows north towards Chili and Peru and “feeds” the waters off of the more tropical coastal areas measured as El Nino’s.
On the other hand, reduced sea ice in Arctic waters means increased heat losses (8 months of the year) from the now-open Arctic waters, and (slightly) more heat absorbed in Arctic waters 4 months of the year (April, May, June, and July).
So, the question must be opened: Does the sudden decrease in Antarctic sea ice measured in August and September of 2015 “cause” the 2015-2016 El Nino to begin?
Or, once the ice loss begins, does the continued Antarctic ice loss “cause” the 2015-2016 El Nino to increase in intensity and duration?
Or the reverse? Did the increase in tropical surface water heat content “cause” the decrease in ice further south near the Antarctic ocean waters?
I guess that would depend on the direction of the ocean currents down there. And do these ocean currents change during the year?
Werner wrote: “On several different data sets, there has been no statistically significant warming for between 0 and 23 years …”
The absence of statistically significant warming for any period is not evidence FOR COOLING or FOR STATIONARY TEMPERATURE.
For example, mathematicians can’t prove the Goldbach conjecture, which states that every even integer can be written as the sum of two primes. That doesn’t mean that we know of any even integer than can NOT be expressed as the sum of two primes. The absence of proof is not proof of absence. Saying we can’t prove something doesn’t prove anything (except our ignorance about the subject).
The absence of statistically significant warming for a short period of time is evidence of our IGNORANCE about warming OR lack thereof. This ignorance is due to natural variability in climate. If you don’t want to be ignorant, look at warming over the last 40 or more years. It is statistically significant. Werner and WUWT WANT you to be ignorant, so they only tell what we aren’t sure about. That is like teaching your children to add by saying 2+2 is not 5 or less than 100. The statements are factually correct, but not useful for learning.
I beg to differ. It was climate scientists and neither me nor WUWT who came up with the 95% rule for statistical significance. And keep in mind that both Nick Stokes and “skeptical science” come up with very similar numbers here.
E other
i would refer to Bob tisdale’s magnificent research on el nino. He came with very interesting theories that match the data.
the word Oscillation in ENSO is actually a wrongly chosen word, as la nina is not the opposite of El nino.
In this context the la nina we see does not tip the scale it’s to weak.
you need to look at the “running sum” of El nino and la nina, and this latest el nino did push the last 20 years from equal el nino and la nina to “el nino dominated, thus a new “step rise on the ladder” hence the end of the pause
unlike the PDO or AMO index the heat doesn’t return to it’s original place with ENSO, it starts to linger around in the currents and gyres. the only “uncommon” part is that this hot water of el nino did go predominantly south instead of north.
the low in antarctic ice is the result of that.
here you see the start of that “new step” each huge el nino is marked in red
 ?w=640
What drives the warming of the el nino pool? the sun and changes in cloud cover there.
or in short: a weak nearly noticeable la nina won’t erase a back to back el nino. it would have cancelled out the weak 2014/2015 part only but not the 2015/2016 part.
A strong back to back la nina is the only answer to your equation, if that doesn’t come w’re on step up. so as long as there is no ENSO it will hoover around +0.3-0.4°C anomaly on RSS and UAH.
the big lull in tropical cyclone activity in the south didn’t help a lot to this neither: with an ACE of only 34% of the normal for the whole southern hemisphere the heat release pump didn’t do a good job there this year….
in fact if there won’t be a good strong hurricane there it will be the weakest southern hemisphere season since records begun there….
so that’s also heat that did stay, that didn’t release.
Thank you! You could be right, but that last point is very premature at this time.
when looking at tropical cyclones worldwide it’s too premature to say that, i agree. but not for the southern hemisphere. that cyclone season is in it’s last month. Why is that an important detail in the equation? This el nino was also unusual as most of the warm el nino waters deviated south instead of the usual north-south distribution;;;
i do agree that there is still one month to go in the southern hemisphere, and in that month, we still can have cyclones , but the cold indian ocean and warm southern pacific is generating an unusual wind shear in the southern hemisphere. so the chances are really small this year
but i see 2 main motions in the south: antarctic waters went from colder then normal with sea ice records to suddenly “hot” with record sea ice melt. and then unusually cold waters around first eastern australia which are now west.
all SST loops show that unusual cold patch moving around. in that region, but is it really coming from the antarctic? i would leave that question to someone that is more knowledged in SST and currents, all i know is: it would be interesting to see it investigated.
When I responded to your first comment, I was not aware of your reply to your first comment. What I thought was premature was the “0.20 C from Oct 2016 to now”.
sorry for the missunderstanding. you are right and i forgot to add that too: Bob tisdale also mentioned that this last point on his graph is still in “assumption stage” thus not entirely certain yet because it is too early.
he also uses there the words “it appears we see another uptick” which points to the fact it is a possibility, but not entirely sure yet, that it is only certain after a series of years.
Enso can indeed swing suddenly to a La nina dominated episode of 20-30 years and then we will see it go into a down-slope as then all the el nino heat can be released, and then the uptick will disappear in time or become a downslope
It hapened before from 1945 till 1975. So it can and will happen again in the future, we just don’t know when.
it are very interesting times ahead 🙂
Very true! I wonder what the situation will look like in 4 years when the next U.S. Presidential election is due.