By Andy May
This was my first climate change conference and I had a great time. So, here is a quick note sharing my most memorable take-aways from the conference. Most of the comments below are paraphrased, but if they are exact quotes, I’ve put them in quotation marks. To hear the full talk by any of the speakers go to the Heartland.Org site here.
The most memorable statement is from Myron Ebell. Three U.S. elections “have turned on climate issues.” These are 2000, 2010, and 2016. In 2000 Al Gore lost because he lost West Virginia. This “was due entirely because someone named Buck Harless put,” in every voter’s mailbox a study he commissioned showing the effect on West Virginia’s coal industry and economy of Al Gore’s proposed policies. The 2010 election was turned by the Waxman-Markey cap-and-trade bill, which caused the House Democrats to lose 20 seats and making the House of Representatives Republican. Finally, in 2016, climate change and the fossil fuel industry were explicit issues and Clinton and Trump were on opposite sides. The pro-fossil fuel side won the key fossil fuel states of West Virginia, Pennsylvania, Ohio, Tennessee and Kentucky.
Walter Cunningham, the famous Apollo astronaut, who also has a physics degree from UCLA, stated he had “never seen any evidence supporting the [climate] alarmist view” or “supporting man changing climate.” He, Pat Michaels, Steve Milloy, Jay Lehr and Myron Ebell all strongly support eliminating the EPA CO2 “endangerment finding.” The endangerment finding states that CO2 is dangerous to mankind. For more on this see Penny Starr’s article here. This clearly unscientific finding was upheld by the Supreme Court even though CO2 is essential for life on Earth and is a vital food for plants. Walt Cunningham noted that the alarm for excess CO2, in the Apollo spacecraft, was set at 3,000 ppm and on the space station it is set at 5,000 to 10,000 ppm. These levels will likely never be reached on Earth again, although the atmosphere has reached these levels in the very distant past (prior to 200,000,000 years ago). The current level is about 400 ppm, people can become dizzy if the CO2 level in a sealed room exceeds 40,000 ppm. Most plants die when the level goes below 150 ppm.
The endangerment finding will be used to destroy the fossil fuel industry, our economy and millions of jobs, if it is not eliminated, according to Michaels and Ebell.
Fred Singer is now 92 years old, but what a trooper. Everyone at the conference was inspired when he gave his outstanding presentation. He clearly explained why the evolving surface weather station network, which has been dominated by airport stations since 1990, has affected our temperature record. Airports are notorious for spurious high temperature readings for obvious reasons. They have too much pavement and too many hot airplane engines. He also explained how “correcting” ocean buoy temperature readings to ship water intake temperatures, as NOAA has done, is erroneous.
Willie Soon presented a paper he wrote with Ronan Connolly and Michael Connolly. They showed that arctic sea ice retreat since the 1970s was preceded by an arctic sea ice advance from the 1940s to the 1970s. This suggests that the current sea ice retreat may be a natural cycle and not due to man-made global warming, particularly when one considers that the Antarctic sea ice extent is at a record level.
Indur Goklany noted that, due to fossil fuels and modern farming technology, crop failures are a thing of the past. 70% of the recent greening of the planet is due to more CO2 and we are now “living in the best of times.” How true.
Roger Bezdek noted that “Fossil fuels are the driver of economic growth and jobs.” He added that “fossil fuels will continue to provide more than 80% of world energy for the foreseeable future.”
Craig Idso analyzed the effect of CO2 on the 45 most important food crops in the world and concluded that the recent increase in CO2 has provided trillions of dollars of additional food to the world’s population. This increase in food production has amounted to a $5/ton CO2 benefit to mankind. This $5 benefit should be subtracted from any calculation of the so-called “social cost of carbon,” but this has not been done. He noted that Norman Borlaug has shown that if all known fossil fuels on the planet were burned in one day, the level of CO2 in the atmosphere would increase to 1000 ppm to 2000 ppm. The data in Dr. Idso’s database shows that plant growth continues to increase in a linear fashion to, at least, 2000 ppm.
Dr. Pat Michaels made an impassioned plea to reverse the CO2 endangerment finding and quoted Eisenhower’s final speech from January 17, 1961:
“Today, the solitary inventor, tinkering in his shop, has been overshadowed by task forces of scientists in laboratories and testing fields. In the same fashion, the free university, historically the fountainhead of free ideas and scientific discovery, has experienced a revolution in the conduct of research. Partly because of the huge costs involved, a government contract becomes virtually a substitute for intellectual curiosity. For every old blackboard there are now hundreds of new electronic computers.
The prospect of domination of the nation’s scholars by Federal employment, project allocations, and the power of money is ever present – and is gravely to be regarded.
Yet, in holding scientific research and discovery in respect, as we should, we must also be alert to the equal and opposite danger that public policy could itself become the captive of a scientific-technological elite.“
I have added the emphasis. It is clear, at least to me, that what President Eisenhower predicted in 1961 has already occurred. Those of us, and there were many at the conference, who are “solitary inventors” or “independent researchers” struggling to understand climate change without using the assumption that man is causing it, are facing a public that has become the “captive of a [self-serving] scientific-technological elite.” The elite is publicly funded with our tax dollars by government bureaucrats with an anti-fossil fuel agenda. The bureaucrats are aided by environmental organizations that create pseudo-scientific nonsense to support the crusade and line their pockets.
Lamar Smith has fought this “pseudo-science” by attempting to require the EPA and other agencies publish the scientific studies used to create government regulations. This seems very reasonable, our taxes paid for these studies, the studies add costs to our factory production and they increase the cost of goods we buy. Why shouldn’t the science behind the regulations be fully published as Representative Smith’s “HONEST” act requires? His previous “secret science” act, which was very similar, was threatened with a veto by President Obama. Why would Obama want to keep scientific work, paid for by taxpayers, secret?
Susan Crockford showed that polar bears were classified as a threatened species, even though their numbers were increasing, because of a computer model. Unfortunately, for the modelers, the conditions they predicted for 2050 occurred early, in 2009, and the polar bear population still increased! Hmmm, it seems that legislation or rules based on computer models can be in error. Imagine that?
Scott Armstrong appropriately noted one of the iron laws of political economics:
“There is no form of market failure, however egregious, which is not eventually made worse by the political interventions intended to fix it.”
He also said:
“Government has no business in research.”
Jay Lehr was one of the five people who helped design and create the EPA from 1968 to 1971. He believes that they did some good work for the first eight years or so and improved the environment in the US. But, he also believes they have not done anything useful since 1980 and should be eliminated today. All 50 states now have their own environmental organizations (not true in 1971) and work like this should be done at the state level, in his opinion. What coordination between states is required could be handled by a commission composed of state appointed commissioners. The current US EPA is “a wholly owned subsidiary of the green movement” and its green agenda is harmful to the USA.
According to Ben Zycher the Ivanpah solar power plant in the Mojavi Desert of California is a huge failure. It only produces 65% of the power promised because “the sun didn’t shine as much as we predicted.” The power produced costs $180/mWh, versus natural gas costs of $60. And this doesn’t include substantial subsidies and a $1.6 billion loan from the U.S. government. Ivanpah has now requested U.S. grant money to use to pay back the U.S. loan.
James Taylor has calculated that renewable mandates cost electricity customers $130/year in Kansas, $190/year in Ohio, and $400/year in New Mexico. Obama said renewable energy would necessarily cause electricity prices to skyrocket. Obama got that one right. He should have added that wind and solar will kill 1.5 million birds and bats every year and that biofuels (especially algal biofuels) are an environmental nightmare.
Mary Hutzler computed a new levelized cost of electricity that corrects the serious errors made by the EIA and IEA. She includes the cost of backup and buffering required for solar and wind. She uses natural gas combined cycle backup systems because they were the cheapest. For a discussion of non-fossil fuel backup systems see here.
Steve Milloy notes that “Government has perverted science.” Like many other speakers, he thinks it is imperative that the CO2 endangerment finding be reversed. Steve Milloy was one of the members of Myron Ebell’s EPA transition team, created by Donald Trump when he was still a candidate.
The famous Professor Will Happer gave an excellent speech where he noted the following points:
- Climate models do not work.
- Climate changes regardless of CO2 levels.
- More CO2 leads to more benefits for mankind.
- It is immoral to deprive the world of fossil fuels.
- The social cost of carbon is negative.
As a special treat, I highly recommend that you listen to the wonderful speeches given by Lord Christopher Monckton and EU Parliament member Roger Helmer. The speeches are wonderfully worded and presented, as only they can. The speeches cannot be properly summarized and must be heard in full to be appreciated. Highly recommended.
I will conclude this conference summary here. It was a wonderful conference and I am very grateful to Joe Bast and his wonderful team for putting it on. The organization, the food and venue were excellent. It was very nice to meet the people whose papers and posts I’ve been reading for years, face to face. I realize everyone doesn’t have the resources or the time to attend a conference like this, but if you get the chance it is well worth it.
Griff, even Nick Stokes is starting to sound reasonable. When do you figure to POLAR BEAR! errr come around?
Reasonable? Last I saw, he was capable of finding “strong” and malicious trends where none existed statistically.
Hm! New infusion of cash?
Your skill at stats versus nick. Please.
Show your work or comment less
[this moderator reminds you that this is not your blog and that you can’t dictate to commenters about what they do -mod]
Good morning steve. No fun when the j’accuse! is pointed at your side, eh?
Has Nick ever claimed that an average can be made more accurate by taking multiple measurements? If so, then one would have to wonder about his statistical abilities.
[this moderator reminds you that this is not your blog and that you can’t dictate to commenters about what they do -mod]
Sure I can. I just did. They are free to ignore my suggestion. What is interesting is that you have no problem ignoring other people when they tell nick or Griff what to do. Are you afraid people might follow my suggestion and show their work.? That’s like science 101..you against that? Don’t answer.
Face it you run an echo chamber. You don’t dare post this without commenting . Don’t post this. I order you.
Stuck now huh?
[nope, not stuck at all -mod]
What an ego Steve has. Too bad he has nothing to back it up.
PS: Anyone who claims that in all cases, more measurements means more accurate data has proven he knows nothing about statistics.
Don’t forget irrational too.
Many of their drive by, one to three line cranky comments, remind me of the misanthropic shrieks road rage afflicted drivers hurl at other un-afflicted drivers.
It is not true that this election turned on climate change issues. The key issues in the election were jobs (including wages) and terrorism. If we are generous and presume that the category of environment mostly means climate change, it ranked 12th in importance to voters. http://www.people-press.org/2016/07/07/4-top-voting-issues-in-2016-election/
It’s the economy, Stupid.
That’s true.
But if the economic issues are out-ranked by the environmental issues for a certain candidate then…
The voters will not vote for them.
On the other hand, most voters who cared strongly about the environment, regardless of which side, were already solidly in one camp or the other.
But the climate change issue, in the form of the war on coal, presumably ranked higher in “the key fossil fuel states of West Virginia, Pennsylvania, Ohio, Tennessee and Kentucky” where “bhe pro-fossil fuel side won . . . .”
Yes. The Dumpocraps’ wars on coal and fracking had already handed the GOP KY and WV, but this time helped in OH and PA as well. Now if all those Damn Yankee bureaucrats would just leave northern VA for whatever hell hole they crawled out of, the Old Dominion would return to the pro-American fold, too.
Chimp and Roger, shale gas and shale oil are big and growing quickly in Penn. and Ohio, fyi.
Also immigration, which was of concern to Trump’s blue collar base.
Obama’s war on coal had a significant effect on the election, no question about that. It was very clear to me that Trump was going to win when I drove up through West Virginia, Ohio, and Indiana, to the Michigan line, two weeks before the election, and saw a thousand Trump signs to every Hillary sign. One convenience store had Trump and Hillary cookies for sale and had to move the Hillary cookies behind the counter because customers were smashing them!
Seems like northern VA and the Norfolk/Portsmouth area just hijack this state politically, makes my blood boil.
PMK
Immigration was not an election issue. America has always had legal immigration, and always will.
It is “Fake News” to say immigration was an election issue.
The big issue in the election was Illegal Immigration – the problems created by our government largely ignoring / looking the other way as individuals cross our southern border illegally.
H1B visa issue is not an immigration issue: someone coming in on H1B is not an “immigrant;” they are a guest worker.
Ban on refugees from trouble spots that have Isis and other organized-terrorism problems is not an immigration issue; that is a refugee issue.
I’ve tried suggesting to our representatives that they just give Arlington and Alexandria to Washington DC. Outside of a smile and occasional “I wish we could”, representatives don’t respond much.
What’s ironic, is that when they created the District, it was 100 sq mi. about half of it in Maryland and about half of it in Virginia. Congress decided that they didn’t need the Virginia part, so they gave it back to Virginia. Virginia is now stuck. They should have rejected the offer. I don’t blame them, though, for at the time the offer was made, it was a good deal.
Russian interference is merely an excuse for the losers not to blame themselves.
While I grant you she was a bad candidate, Clinton was not unelectable. She could have beaten most if not all of the other GOP primary candidates. Who among them could have won FL, IA, OH, PA, MI and WI? Rubio might have squeaked by in FL, NV and CO, but lacked appeal in the Rust Belt.
What turned the election is that the common man was fed up to here with the sanctimonious virtue-signalling and alt-universe “solutions” of self-proclaimed “elites” educated beyond their intelligence. Clinton thought she could cavort with Hollywood phonies and aged-out rockers while cashing pay-for-play checks that made Tammany Hall look like amateurs. Shovelling the lie that “climate change” is more dangerous than ISIS was just about the final basket of sh*t. It remains to be seen if Trump can herd cats well enough to get his own adopted party in line.
Doesn’t take much brains to understand that jobs and wages are being destroyed by foolish climate change policy.
While addressing climate change ranks near the bottom, addressing the catastrophic effects of addressing climate change ranks near the top for many voters.
Bingo!
And too few understand just how much money and how many jobs are truly at issue.
Many simply do not follow the relevant issues closely enough to make the connection.
Economic growth is antithetical to the green agenda on many levels.
What is your evidence to back up that statement?
Chris – March 26, 2017 at 11:18 pm
Well “DUH”, you are per se “live” evidence of the above stated fact,
Much of it was as far as I was concerned. That and terrorism/securing our borders
The election turned in Florida over the Palm Beach county ballot. If gore had agreed to a full state recount he would have won the election, and the country would be pin cushioned with wind turbines. On the other hand, it’s doubtful Gore would have invented the WMD baloney and got the USA into the Iraq blunder.
Simple questions ; were WMD found in Iraq? Had Saddam previously used WMD against his enemies and his own people?
Forget all the political posturing and thinking that you have the “real” answers and go with the physical evidence … Hmm sounds a lot like the reasonable people here trying to stop the AGW farce.
Trump won because he was the best candidate we had to choose from.
Yes, true dat Fernando!
Last November was only the second time the entire country dodged a bullet this millennium.
All the WMD comments and the mantra of “Bush lied, people died”, are so much political spin. Use any search engine you want and read public law 107-243. The PDF file is only about 5 pages and it is written at about an 8th grade level (8th grade of 30 years ago, probably pushing 12 grade comprehension today). It clearly lays out the case for military intervention in Iraq, and the fact that the US gov’t did not have verifiable proof of nuclear WMD’s, but did have a lot of circumstantial evidence of chemical weapons (I worked with a Marine in the reserves who served in the first gulf war whose unit guarded a chemical weapons depot in Iraq).
Anyone who voted for this law has no excuse for not understanding exactly what they were voting for and why. To claim to have been misled is an absolute lie or admission of almost unimaginable incompetence.
Weapons of Mass Destruction? Of course Iraq had chemical weapons. We know that because we sold them the chemicals! Iraq had been an ally prior to the war.
In fact, we bombed two of our allies, Iraq and Libya, forced out the leaders then watched in amazement as ISIS filled the gap. Who would have thought that extremists who objected to having their countries and fellow citizens bombed by a foreign power would rise up against those foreign powers?
Claiming that Gore would not have pursued the same route as Bush is just speculation. See how one ex-CIA asset claims the plot unfolded:
Every single recount conducted after the election had Bush winning Florida. And these recounts even used the rules that the Gore camp wanted.
What Gore wanted was to order recounts in only those counties where he was likely to garner extra votes. That is what the Supreme Court voted 7 to 2 against as a violation of equal protection. The 5 to 4 vote was on whether the SC should order a full state wide recount using the rules Gore wanted. The majority felt that there wasn’t enough time left before the constitutionally mandated cut off date.
We sold Saddam chemicals. Lots of chemicals. That a small fraction of these were diverted into chemical weapons programs is not the fault of the US. Like so many on the left desperately want to believe.
I should add that Germany, France and others were also selling these chemicals and equipment to Iraq.
That Saddam had a moth balled nuclear program has also been demonstrated, but you never hear about it, because those who want to pretend there was never a reason to invade Iraq don’t want to hear about it.
Not only were there WMDs, mostly chemical (likely not all of them), there were a number of 400,000 sq. ft. underground bunkers found (likely not all of them), so the ‘slam dunk’ was correct. This was confirmed. What couldn’t be confirmed and suffered from a lot of interference, was the total numbers. Also confirmed was a large and ongoing effort to get around the terms of the cease fire. *That* justified resumption of the war. Two more war declarations were not necessary, de jure, but were necessary, politically.
Among the records was confirmation of Saddam’s willingness to get atomic materials not allowed to him, from a number of African countries. Sure, sycophants will produce reams of paper telling the Emperor that he is fully clothed. Still, like the Venona stuff that showed how badly the US Federal government had been penetrated with Socialists (fascist and communist, which we knew but had limited confirmation of), some people want to keep ‘Joe Public’ blind to the truth. Also, Saddam was not our ally. Saddam was a Soviet ally. We really were in a bad place when Saddam took power in Iraq and the Mullahs did so in Iran.
” That a small fraction of these were diverted into chemical weapons programs is not the fault of the US.”
The chemicals used to make the poison gas were sold by the Dutch via a certain Frans Van Anraat, who is currently in prison having been sentenced at the Hague for crimes against humanity.
https://en.wikipedia.org/wiki/Frans_van_Anraat
“Among the records was confirmation of Saddam’s willingness to get atomic materials not allowed to him”
Such as 550 tons of yellowcake.
http://articles.latimes.com/2008/jul/06/world/fg-cake6
http://www.snopes.com/politics/war/yellowcake.asp
Goldrider, beautifully stated. You got the “root cause” right whereas all the other commenters couldn’t see the actual forest for the trees, ….. even though they did mention a couple key issues.
HA, shortly after Trump announced his POTUS run …. I began telling people that Donald Trump was going to …….. “awaken a sleeping giant among the voter eligible American populace” …… and by damn that is exactly what he did.
The last time that “almost” happened was when Ross Perot ran for POTUS.
Hillary got more votes, but if you subtract out those that were not legally eligible, she would not have.
If any one factor swung the election, it was an inability for the Ds to cheat big enough to steal the election.
Chris
it was the absence of climate change issues in this election that was significant. Democrats realized that their climate crazies were never going to vote for Trump and that the general public no longer believed in it — so they decided the best move was to avoid the issue. Public issues disappear when they no longer sway voters. Climate change is no longer a vote getter and probably a vote loser. The blue states that went for Trump certainly didn’t want to hear about climate change when they were losing jobs due EPA regulations on coal. Most Americans are aware of the true costs of “free energy” since every month they get an electric bill. The Democratic Party owns climate change and they decided that their best move was to shut up about it.
Eugene WR Gallun
” The Democratic Party owns climate change and they decided that their best move was to shut up about it.
Eugene WR Gallun”
Hillary lost the election when she stated she would end coal jobs.Coal state voters gave Bernie Sanders a protest win ,showing voter dissatisfaction.(even though Sanders is a stronger stance on AGW)
Tom Steyer ans support for AGW needs to get out of the Dem Party if we(lifelong Dem here) are ever to win back power.He helped lose the 2014 Congress and the 2016 Presidential.
Eugene, if climate is no longer an issue that sways voters, then it stands to logic that it cannot be a high ranking issue of importance to voters when making their decision on how they will cast their ballot.
Hard to prove something which has never been investigated, but one has to wonder why that is the case?
The US has a long and documented history of election chicanery, including ballot box stuffing, but this issue relates to the way our voter registration process is done…it is all based on the honor system.
We know there are over ten million illegal aliens residing in the US.
We know that in many places they are routinely issued driver licenses.
We know that one party has strenuously and repeatedly opposed every attempt to clean up voter rolls, and to fight voter ID laws whenever they are enacted.
We know that immigration was a hot button issue in the past election, with one side promising to end it and begin the process of deporting illegals, and the other side promising open borders and no restrictions and lots of free stuff for all comers.
So we have opportunity, we have motive, and we have the widespread perception that the risk of voting illegally is practically non-existent.
Human nature being what it is, only a dimwit or a jackass would pretend that there are not large numbers of illegals voting, and that most of them would vote a certain way.
https://youtu.be/nVR1ZrR0Iu4
I am living with it.
And, i might add, a whole more successfully so than most Hillary voters seem to be doing.
To those who say Hillary Clinton won the popular vote, I quote Vietnamese General Giap when an American general noted that the Vietnamese military had never defeated the American military in any battle: “That is true, it is also irrelevant”.
“It is not true that this election turned on climate change issues. The key issues in the election were jobs (including wages) and terrorism.”
I agree. Neither candidate promoted the issue. It wasn’t even on the political radar for the candidates.
“To those who say Hillary Clinton won the popular vote, I quote Vietnamese General Giap when an American general noted that the Vietnamese military had never defeated the American military in any battle: “That is true, it is also irrelevant”.”
General Giap said it was irrelevant because the American radical, anti-war Left, and the MSM, were on the side of North Vietnam, and that made all those American military victories irrelevant. And he was absolutely right.
Same thing happened in Iraq: The U.S. military defeats the enemy, withdraws and goes home, then the American radical Left abandons the country we just saved, to the communist, or radical Islamist wolves. It’s amazing how easily the Left can turn their backs on millions of innocent people. They profess to be so caring. But we see what their caring does: it gets millions of innocent people killed and displaced from their homes.
Yes, the MSM, along with their soulmates, the radical American Left, can lose wars for us. Depending on the lies they tell. And as you have probably noticed, the Left and the MSM are *very* good at lies, half-truths and disinformation. They have turned dishonesty into an art form.
TA
There were no radical Islamist,s in Iraq prior to the USA invasion. They had been kept out by Sadam very effectively.
“There were no radical Islamist,s in Iraq prior to the USA invasion. They had been kept out by Sadam very effectively.”
You are correct Saddam did keep the Islamists subdued, and the radical Islamists were kept out of Iraq as long as U.S. combat troops were there, too. Bush had reduced the radical Islamist (Al Qaeda in Iraq) numbers to around 100 by the end of the war and had run them all out of Iraq and into Syria.
The first Islamist carbomb to go off in Baghdad since Barack Obama took over the presidency in Jan. 2009, occurred a few weeks after the last U.S. troops left Iraq in 2012. From 2008 when Bush left until 2012 with Obama in charge, and U.S. combat troops stll in-country, there were no Islamist carbombs or any other kinds of Islamist attacks in Iraq. Things were going quite well in Iraq actually.
Obama pulled U.S. combat troops our of Iraq in Dec. 2011, and the Islamists in Syria saw their opportunity and they took it, and that would have availed them nothing either, except Barack Obama decided to sit back and let nature take its course and not intervene in preventing the Islamic Terror Army from capturing half of Iraq right under his nose.
Half the refugees generated in the Middle East are because Obama allowed half of Iraq to be taken over by maniacs. Obama could easily have smashed the Islamic Terror Army, but he chose to do nothing and watched while countless innocent civilians were massacred and millions were displaced from their homes. Nero comes to mind.
Vote fraud issue: if there is no vote fraud, then there should not be great concern for audit and overview in the suspected areas.
Many if not most, or all, of us get audited for business and legal reasons. We are simply used to this kind of quality and legality assurance.
In California, where the zeitgeist is to provide sanctuary for illegal immigrants, there is good reason to suspect that the moter-voter process for excluding illegal immigrants was not fully followed.
Until a respectable explanation of the process appears, and a respectable audit, we the populace have reason to wonder. If you are liberal or progressive and have the desired knee-jerk “racist” reaction to this, just consider how we howl when we learn that billions of military spending cannot be accounted for.
Same same.
I don’t remember who did the study, but one group found that amongst those who self-identified as illegal aliens and also admitted to voting in the last election was enough to account for about 800,000 Hillary votes.
Now note, this was a group that was willing to tell a complete stranger that they had committed two felonies.
How large was the actual number of illegals who voted for Hillary.
Second note, illegal aliens voting is just one of the categories of illegal votes that Democrats are famous for harvesting.
There has NEVER been a documented case of a person who was otherwise eligible to vote, being prevented from voting by voter ID.
It has always been a made up excuse by the Democrats to protect their lead in illegal votes.
A very nice and interesting summary. Thanks!
Thank you. Great review.
Al Gore lost his on State of Tennessee!
Win it. Election over!
“He noted that Norman Borlock has shown that if all known fossil fuels on the planet were burned, the level of CO2 in the atmosphere would increase to 1000 ppm to 2000 ppm.”
Actually, he was being very generous. If the partitioning of CO2 between water and air is recognized, changes to atmospheric CO2 are difficult. The ratio of CO2 in water to air is 50 to 1, which means that we would have to add 50 times the CO2 needed to raise the atmospheric CO2 any set amount. It appears that, of we burn everything we have and all th biomass, we might raise CO2 by 20-25%.
It is the heating of the oceans that outgassed CO2 and then cooling soaks it back up. However, outgassing is rather rapid, as CO2 can become bubbles and rise to the surface while absorption takes place only at the surface and the slight to mixing due to breaking wave action.
Thank you for clarifying. The full quote was “burn all known fossil fuels in one day.” I probably should not have left out the last bit.
Andy May,
Indeed that clarifies it, as the half life time of any extra CO2 injection above the (temperature controlled) steady state needs ~35 years to halve it back to equilibrium, the 50:1 redistribution of the extra CO2 between oceans and atmopshere needs time…
BTW, 3000 GtC (most oil and gas) and 5000 GtC (plus much coal) is what the Bern model used that the IPCC adheres to. As an extra the Bern model implies a saturation of the deep oceans (and vegetation), for which is not the slightest indication.
With saturation, part of the CO2 stays forever in the atmosphere…
Ferdinand Engelbeen: “BTW, 3000 GtC (most oil and gas) and 5000 GtC (plus much coal) is what the Bern model used that the IPCC adheres to. As an extra the Bern model implies a saturation of the deep oceans (and vegetation), for which is not the slightest indication.”
WR: Ferdinand, for what year does the Bern model implie a saturation of the deep oceans (and vegetation)? And a second question: In which year did they run the Bern model?
Wim Röst,
Ferdinand, for what year does the Bern model implie a saturation of the deep oceans (and vegetation)? And a second question: In which year did they run the Bern model?
In fact immediately: they expect a saturation whatever the amount of CO2 already absorbed as percentage of the extra injection. In all cases that percentage remains in the atmosphere for each compartment and all compartments together.
The original is from the University of Bern (Switzerland) and Furtunate Joos was the lead author:
http://unfccc.int/resource/brazil/carbon.html
Some discussion was at the late John Daly’s website here:
http://www.john-daly.com/dietze/cmodcalc.htm
and
https://www.john-daly.com/dietze/cmodcalD.htm
and for the linear model by Peter Dietze (which is what the sinks really do until now):
http://www.john-daly.com/carbon.htm
Where the Bern model is right is for the ocean surface: the change of all C species in the ocean surface is ~10% of the change in the atmosphere, due to the Revelle/buffer factor. That doesn’t count for the deep oceans, as the sinks are highly undersaturated when the waters sink to the depths and deep ocean waters are largely isolated from the atmosphere until they return at the surface some 1000 years later…
The oldest Bern model report I could find was from 1999, but the model anyway is older and originally based on much higher emissions.
http://citeseerx.ist.psu.edu/viewdoc/download?doi=10.1.1.833.8293&rep=rep1&type=pdf
“[A]bsorption takes place only at the surface and the slight…mixing due to breaking wave action.”
That’s what most people think. But the pH of rainwater is 5.6, so there’s additional adsorption whenever/wherever it is raining.
That’s actually a very interesting point which I had not thought about.
The water/air surface area during a rain storm is huge and the water is nice and cool with very little dissolved compounds (at least initially).
Does anyone know of a study into the magnitude of CO2 transportation from the atmosphere to the surface caused by rainfall?
Jorge,
Water vapor and CO2 are emitted where (sea)water temperatures are highest. They both get in the atmosphere and where water condenses into clouds CO2 is dissolved to the maximum content for the temperature at that level. That are very small amounts as the solubility of CO2 in fresh water is very low.
Thus while the amounts of water circulating through the atmosphere are enormous, the CO2 flux is relative small and mostly between oceans and oceans, thus a null-operation.
Where rains falls on land, that can dissolve carbonate rocks, but even that needs millions of years to form the beautiful caves everywhere…
BTW, CO2 outgassing is as fast as absorbing for the ocean surface (less than a year half life towards equilibrium with the atmosphere), but as slow for the main transport from and into the deep oceans (~35 years half life). Both are a result of wind and waves and direct in ratio to the CO2 pressure (pCO2) difference between water and atmosphere. For the deep oceans that is at limited areas: upwelling zones near (equatorial) land and sink zones near the poles. bubble formation is only at very high temperature (over 60°C) when you may expect a fast release of dissolved atmospheric gases…
Ferdinand Engelbeen – March 26, 2017 at 4:48 am
Oh mercy gawds, Ferdinand, …… the Keeling Curve graph is literal proof that there is absolutely, positively no such thing as “CO2 half-life in the atmosphere” …… or …… “atmospheric CO2 half-life”, …… regardless of how it is stated.
Claiming that part or all CO2 emissions have a “half-life” residency time in the earth atmosphere ….. is as asinine, silly, stupid and/or idiotic as claiming that ….. all rainwater has a “half-life” residency time in farm ponds and mountain lakes.
Given the literal fact that neither you nor anyone else knows what said CO2’s “full life expectancy” actually is …. then there is no way in hell you could possibly know or calculate what its “half life expectancy” is.
Iffen you all started conducting “real science” then you wouldn’t need to be wasting your time concocting up such foolishness as “half-life” thingys in a futile attempt to justify your “junk science” claims.
But “real science” doesn’t pay as good as government funded “junk science”, …… does it?
Samuel,
A little knowledge of process physics may be of help…
The seasonal half life is part of the residence time: what goes in and out of the atmosphere over the seasons is huge (~150 GtC in and out), but doesn’t change the mass of CO2 in the atmosphere with one gram (as long as ins and outs are equal). Average ~5 years half life time.
Quantities going in and out vegetation are known, thanks to the huge changes in δ13C and small changes in O2. Quantities going in and out the ocean surface are kown from the “thinning” of the δ13C “fingerprint” from human emissions and the rapid decline of 14C from the atomic bomb tests.
The decay rate for any surplus CO2 injection in the atmosphere is a simple, linear function of the extra CO2 pressure (pCO2) in the atmosphere above the steady state of the ocean surface vs. the atmosphere. For the current average ocean surface temperature, that should be ~290 ppmv. In reality pCO2 in the atmosphere is currently ~400 ppmv. The 110 ppmv difference is what pushes ~2.15 ppmv extra CO2 into the (deep) oceans (and vegetation). That cause-and-effect gives a linear e-fold decay rate of ~51 years or a half life time to remove the extra CO2 of ~35 years.
That is real science, based on real observations, not models…
Plus adsorption from the underwater volcanoes. It collects at great depth
and precipitates. The ultimate level in the ocean self corrects, as
Chatelier predicts.
Ferdinand Engelbeen March 26, 2017 at 9:36 am
Ferdinand, first: thanks for the clear explanation. A few words and a lot of clarity!
FE: “For the current average ocean surface temperature, that should be ~290 ppmv.”
WR: I conclude that to keep our vegetation (and agriculture) as prosperous as it is, we need to bring a lot more CO2 in the air, but perhaps at a moderate rate. 50 Out of every extra 51 particles CO2 will sooner or later be absorbed by the ocean. Unless the average ocean surface temperature raises (more outgassing) we will return to a level of only 290 ppm when we should stop burning fossil fuels. A level that is not very favourable for plant growth.
Ferdinand Engelbeen – March 26, 2017 at 9:36 am
Ferdinand,
What you stated in your above post is NOT real science …. and given the fact you think it is/was infers that you are quite delusional about the extent of your educational expertise regarding the Physical Sciences.
Ferdinand, the following is a prime example of your delusional thinking, to wit:
YUP, Ferdinand, …… shur nuff, ……. everything you stated above is/was “genuinely real science” ….. but only iffen …… the “half life” is part of the life …… and ……. “(as long as ins and outs are equal) ……. it doesn’t change the mass of CO2 in the atmosphere.”
Your “equal ins and outs” comment was truly a brilliant scientific deduction.
Ferdinand, …… I’ll say it again, …… iffen you ever begin conducting “real science” then you won’t need to be wasting your time concocting up such foolishness as CO2 “half-life” thingys in a futile attempt to justify your “junk science” claims.
If you cannot plot your long-term or seasonal CO2 “half life” claims on-top of or over-top of a Keeling Curve Graph of actual, factual atmospheric CO2 ppm averages ….. then it is obvious proof that you are touting your delusional claims that are little more than “junk science”.
I had not realized process physics was driven by assumptions and estimates.
Quantities are not known. They are extrapolated from comparatively miniscule samplings.
That is assumptions and bulls**t masquerading as science. Unconstrained.
Ferdinand; no matter what you try and foist on us; estimates, extrapolations, assumptions, samplings aimed at proving research biases, models etc etc are not science.
Science is the world of direct observation, theory, hypothesis, testing, independent replication until the facts are absolute.
All other pretenders to science are false. Nor should they ever be presented as ‘science’ because, it is really all we know right now.
Start with the basics!
&bull A) The actual quantity of water in the world is unknown.
&bull B) The actual amounts of land, carbonate rocks, etc is unknown.
&bull C) The actual amount of life on Earth is unknown.
&bull D) The actual amount of CO2 in the atmosphere, or oceans or Earth is unknown.
&bull D) E) “For the current average ocean surface temperature is unknown!!!
&bull a) All claims to knowing rates of CO2 between water-land-atmosphere are limited by lack of knowledge, lack of whole world understanding, lack of exacting long term whole world definitive physical measurement.
Estimates, extrapolations and narrow physically restricted tests, at best can accomplish is perhaps, and that is an extremely weak pathetic perhaps set upper and lower bounds at a gross level.
Stating or using said estimates and extrapolations should always be couched with caveats, concerns and limitations. Posing them as science is plain false.
Assumptions and minimalist research can be plainly stated as assumptions and entry level research, but not as known or proven science.
A couple of misspellings in this article: the father of modern, high-yield cultivars is Norman Borlaug, not Borlock, and it’s the Mojave Desert, not Mohavi.
Thank you Graemethecat, I fixed the spelling.
higley7 – March 25, 2017 at 2:46 pm
Higley7, I think you are absolutely correct about that “50 times” claim …… and “the proof is in the pudding”, …….. the “pudding” being the 58 years of the Mauna Loa CO2 ppm Record ……. which is noticeably ABSENT of any human emission “signature(s)”.
Great summary of an important conference, Andy! I heard you ask a question but was unable to actually meet you or Eric, which I regret.
I agree totally with your assessment of speakers and the conference in general. Heartland did an amazing job of pulling everything together and I was never bored by any of the presentations, even Dr. Mendlesohn’s impassioned plea to start throwing more money at the non-existent phantom of AGW.
All things considered, ICCC-12 was a bargain and I feel like I got way more than I paid for. I am looking forward to ICCC-13!
PMK
PMK: What a wonderful comment! Heartland works very hard to bring together the world’s most knowledgeable, honest, and BRAVE climate scientists and policy experts once or twice a year at these conferences. Reading your remarks does a lot for morale at Heartland … and encourages us to keep going!
If you and others at WUWT want to help ensure these conferences continue, throwing a few bucks toward our crowdsourcing campaign will help. No amount too small. We’d rather see 1,000 people give $20 than have four people drop in $5k … not that we’d turn that away. 🙂
It is the support, passion, intelligence, and engagement of fans of WUWT, ICCC-12 Speaker Steve Milloy’s JunkScience.com, ICCC-10 speaker Jo Nova, multiple ICCC speaker Marc Morano and Craig Rucker from Climate Depot, Roy Spencer’s site, James Delingpole, and Judith Curry, etc. that mean the most to us — and the movement as a whole.
https://www.indiegogo.com/projects/12th-international-conference-on-climate-change-environment#/
Jim Lakely
Director of Communications (and MC of ICCC-12 in DC)
The Heartland Institute
Jim you are so welcome! We never got the chance to formally meet but I am the gal Pierre was searching for on Thursday evening and we did smile and speak in passing a few times. I was not shy about telling your staff how great I thought ICCC-12 turned out either. I believe I was the only “Pamela” in attendance as well.
As for locations on the left coast go, I once helped put on a meeting in Paso Robles, NE of San Luis Obispo, smack on the 101. It was a few years ago but costs were reasonable. Or beard Governor Moonbeam in his den in Sacramento!
PMK
Pamela: Of course! I was glad to help connect you and Pierre from the dais during the conference. Totally worth it, from Pierre’s telling. Lots of great plans for more climate realism activity thanks to the connection. And thank you for taking the time to bolster Heartland’s staff. Planning and executing a Heartland climate conference creates a constant state of stress and worry that we’re pleasing the attendees — so every “atta boy” and “atta girl” in the moment goes a LONG WAY, and is not forgotten. For you to take the time to do so means a lot. Thank you.
As for West Coast locations … I have family from the San Luis Obispo area. It’s beautiful! I love it there. We’ll put it on the list. But, in general, we aim for larger metro areas. That’s why our 12 ICCCs have been held in New York City; Washington, DC; Sydney, Australia; Munich and Essen, Germany; Chicago; and Las Vegas. Those are easy cities to get to from just about anywhere in the world, and ease of travel is a big factor for such an event at which we plan to attract several hundred people … people like you.
Cheers!
Jim
As a Sustaining Member of Heartland for the last 5 years I can’t imagine a better investment of $250 for the cause of TRUTH. Joe Bast, Jim Lakely are the consummate professionals as demonstrated by the quality of speakers at each conference. My first in New York in 2009 where 800 of us gathered was electric and one I’ll always remember.
Thank you, Andy, for taking the time to write that. It was informative and inspiring to read. Glad you had such a good time! 🙂
Sure wish we could have had a December, 2017 AGU report by Anthony/Willis along those lines. The silence was not only disappointing, but, ominous. Perhaps, I missed it? Hope so! (that would be a relief to me)
December, 2016
At least Myron has this figured out. I guess it’s good that the other Party does not learn.
“particularly when one considers that the Antarctic sea ice extent is at a record level”
It’s at a record low level. The recent minimum was by far the lowest in the record, and it is still in that state.
Nick, Not quite. See 1993 and 1997. See the link: http://arctic.atmos.uiuc.edu/cryosphere/IMAGES/seaice.area.antarctic.png
In any case, short term changes are usually called weather, right? The long term trend has been up, see here: http://arctic.atmos.uiuc.edu/cryosphere/IMAGES/seaice.anomaly.antarctic.png
I wouldn’t take the dive at the end of the graph too seriously, unless it persists for a year or so. Looks pretty weird. And we are talking climate here, not weather.
Andy May
Your chart shows sea ice ‘area’. Your article and Nick’s quote from it specifically state ‘extent’, which is a different metric.
This chart from NSIDC shows Antarctic February extent from 1979-2017. (February being the month of minimum Antarctic sea ice extent.)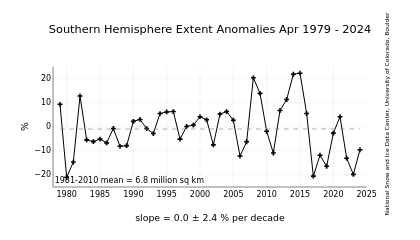
DWR54, You are quite right, thanks for the correction. But, either way the trend is up and we will have to see more to definitively say the trend has reversed. Especially since the 2016 El Nino was so strong. Climate and weather are different. I even acknowledge that point when we have a cool spell!
DWR54 March 26, 2017 at 12:00 am
DWR54, interesting in your graph is that the variance is growing as well. Without knowing what this means, it seems to reflect ‘less stability’.
You just have to love the various polar ice claims:
From “NOAA@NSIDC Releases Sea Ice Index Version 2.1” January 19, 2017
I changed the formatting only.
New code.
New adjustments to computations.
From the more detailed sub-file: “January 2017: Sea Ice Index Updated to Version 2.1”
Arctic: 23/453 = 5.08% monthly extent and area values changed
Antarctic: 26/453 = 5.74% monthly extent and area values changed
June 2016 and July 2016 changes:
New program code.
New computations.
New source of data.
New manual ‘adjustments’, for accuracy to satellite/code/computations.
Here is the latest graphical image:
http://nsidc.org/data/seaice_index/images/daily_images/S_daily_extent_hires.png
Here is an Antarctic image the U.S. Navy uses:
http://www.natice.noaa.gov/images/weekly_ant_con.png
Far from a record low level. It’s just an El Nino-driven divergence from the secular trend since specifically dedicated satellite observations began in 1979. That trend has been up, up and away.
Which shows that Arctic sea ice decline has nothing whatsoever to do with plant food in the air.
No, the “problem” isn’t the same.
All during the alleged decline in Arctic sea ice since 1979, the Antarctic has grown. This would not be the case if air temperature raised by manmade GHGs were the cause of Arctic sea ice decline.
Last year was anomalous in the Antarctic, clearly due to El Nino. The trend however is not the friend of Catastrophic Anthropogenic Climate Alarmists.
Not that lower polar sea ice is a problem. It’s a good thing, whatever the cause. We should be grateful for this natural opening for improved high latitude shipping.
Nope. Science makes value judgments all the time.
Find me a scientist who imagines that the greening of the earth due to more plant food in the air is a bad thing.
Also totally wrong about northern v. southern hemisphere response to more plant food in the air. IPCC and CAGW “theory” both state that ice should disappear globally under more plant food.
So-called “climate science” is especially fond of value judgments.
Also so-called “environmental science”. Such as Rachel Carson’s warped thought that peregrine falcons and anopheles mosquitoes are more valuable than humans.
Never mind that no connection between DDT and falcon reproduction has ever been shown.
Really, I’m surprised that you would raise the issue of value judgments, since fake “climate science” is nothing but false value judgments.
IPCC lies have repeatedly been shown false and falsified, in both the scientific and common senses of the terms.
I’m sure that I’m a lot more conversant with science than you are, both in its philosophy and practice.
The perversion and corruption of science is all on the side of phony “consensus” “climate science”, driven by government and academic rent seekers rather than real scientists.
Their “value judgment” is that humanity faces catastrophe unless we end civilization.
What is most relevant is that the whole manmade climate change enterprise is antiscientific, based upon emotion and not evidence.
Science based upon value judgments isn’t always wrong, as shown by the Allied Manhattan Project, based upon the desire to have an atomic bomb before the Nazis.
But pseudoscientific crusades like eugenics in the early 20th century and catastrophic manmade global warming in the late 20th century show that “scientists” are if anything even more subject to value judgments than their lay peers.
There is no scientific basis whatsoever for catastrophic manmade climate change, yet rent-seeking government and academic “scientists” try to sell it for their own financial, career or ideological reasons. It appears that you don’t know many actual “scientists”, who are no more dispassionate than reporters, lawyers, lobbyists or used car salesmen.
“JohnKnight, one question for you……is global sea ice at it’s lowest measured value since the advent of satellite measurements began in 1978?”
I doubt it, but don’t really care . . it’s sea ice . . sea ice varies . .
Is your home world really cold?
To Pia.
It is true that scientific facts do not make judgments.
However scientific facts are incapable of making judgement as they are not Human.
Those scientists who us data make judgments all the time to develop testable hypotheses, the process of science.
One of those hypotheses involves CO2,, the short term parts are testable, things like the tropospheric hot spot,global polar ice decline in a CO2 pattern of global atmospheric warming and the enhancement of water vapour triggered by CO2 rise.
The long term parts are not testable in many human lifetimes.
At the moment short term prediction ‘the dams will dry’ in Australia and Perth will be the first city abandoned because of climate change,the destruction of Polar Bears have been tested and found wanting.
Even the general public have wised up.
Scientists, as are most of the readers of this blog, make judgments about data.
Sometimes they are challenged to discuss eg Karl et al.
Others are confused also about these results.
So judgement is part of science.
In the Karl case the problems of the paper have been well covered on blogs and unfortunately are to be judged by inquiry.
https://science.house.gov/sites/republicans.science.house.gov/files/documents/02.14.17%20SST%20Letter%20to%20Acting%20Administrator%20Friedman.pdf
This may clear the air about this.
We may end up with a comprehensive study of natural climate change, so we have something with which to compare the CO2 hypotheses.
“Gloateus, when you say ” It’s a good thing” you have left the realm of science, because science does not make value judgements on any of the phenomena which comprises it’s subject matter.”
If that is the case, then it must also be true that the position taken by warmistas, that rising temps and declining sea ice are catastrophic extinction level events, must also be unscientific.
Considering that all historical evidence points to warmer times being good for human interests and life in general, this is the most egregious and baffling claim of warmista religion.
That it is also the one most overlooked as being obviously and demonstrably false, is doubly baffling.
How about we keep it relevant to the topic at hand.
Please restate your question, but this time use the equation or equations that show how CO2 raises the average temperature of the earth?
Troll all you want.
I have no idea what you are attempting to prove.
I doubt you can tell anyone here how your question is relevant to the subject of climate science, or why many billions of our tax dollars are being spent studying various aspects of the settled science of climate change.
Do you suppose anyone here thinks that atoms and molecules and equations have souls, and can be good or evil?
Santa Ana winds are sometimes hugely destructive events, and are a consequence of Boyle’s Law, as is the formation of clouds which give us the rain that makes life on Earth’s surface possible.
Is hot dry wind bad, and a gentle rain drop good?
CO2 is just a molecule, it is not the devil gas and is not the cause of all the ills that befall us, despite the claims to the contrary.
It is the base of the entire food chain of life on Earth (outside of deep ocean vents) and increasing the amount in the atmosphere is a net benefit to humans.
On a planet which is a perpetually frozen and deadly wasteland over large portions of it’s surface, and deadly cold over a far larger portion on a seasonal basis, warming is a good thing.
Trust me pal, if not for value judgements by so-called scientists and politicians to the contrary, we would not be here discussing this.
I have read the whole thread, as I have read a great many threads here and elsewhere for many years now.
I do not miss your point, and I do not think anyone else does either.
I wonder if you are as strident in making this same point when a warmista makes yet another prophesy of doom?
Somehow i doubt it.
It seems it is you who is missing the point, although I also think that you are doing so purposefully.
We would not be discussing this or even be here if the questions relating to CO2 causing global warming and all manner of other consequences were a matter of objective scientific inquiry and nothing more.
“Does chemistry say cyclohexane (C6H12) is good or bad? Does astronomy say neutron stars are bad? Does physics label a helium nucleus is good?”
This is one of my pet peeves: giving science human characteristics. You don’t think science gets given a human personality?
I see this happen all the time. Just the other day I was watching an astronomy program on the Science channel about super-sized black holes, and they kept describing the black holes as “ravenous” and “cannibals” and term after term that would make you think black holes are live, thinking creatures. The Astronomy world is especially bad about assigning human traits to the objects they study, but they are certainly not alone. Quit doing it!
Nick, our ‘Climate by observation’ report notes that the observed c.3-6yr polar cycles are both at their minimum, so will rise over the next few years. Also, as I have been observing, the ‘quiet sun/meridional jetstream’ effects are driving more ice shorewise. Our MacMurdo resupply ships noticed this very much. Much ice in the Beaufort, and off Siberia, including stuck Russians. Boiling hot poles – pull the other one, warmists But the weaker vortices are allowing more warm air to be refrigerated and energy lost to space quickly. Pity you are blind to the widespread vast areas of cold. Don’t worry, it will come to you in time.
Brett Keane
Dr Humlum’s commentary on Global, Arctic and Antarctic sea-ice extent in that report is less than 200 words long. He makes the following claim:
Sorry, messed up the blockquotes. The second paragraph is my question. Thanks.
http://www.woodfortrees.org/plot/nsidc-seaice-s/mean:12/plot/nsidc-seaice-s/mean:12/trend
Thanks. The WfTs data is a little out of date, ending in June 2016 (since the last NSIDC updates).
Ole Humlum says the SH periodic variation is about 4.5 years. The trough pre the latest spike is centred at June 2011. The 12 month running average is still falling as of February 2017 (centred at August 2016), making 5.25 years so far.
If Dr Humlum is right then the up-tick in the SH 12 month running average should be starting any time now. That looks unlikely though, given the current data – SH still sitting at record low sea ice extent levels. That’s set to be reflected in the running 12 month average for several months to come at least.
The Antarctic is an odd place as far as sea ice extent is concerned. Every monthly highest extent record was broken between 2007 and 2015 and it looked like the ice was running away with itself down there. Yet every month since November 2016 has set a new monthly lowest extent record. This coincided with the 2016 El Nino, but there wasn’t any similar response to the 1998 el Nino. It’s odd.
Most climate change is odd. It’s mostly a stochastic, if not chaotic, process.
Trending upwards, despite Monster El Nino.
According to NASA overall Antarctic ice mass is increasing.
Why bother discussing extent at all? Whether record max or min, the scammers and superstitious will continue to blame it on man-made global warming.
““What is disconcerting to me and so many of my colleagues is that these tools that we’ve spent years developing increasingly are unnecessary because we can see climate change” (Mann)
See?
OK. Good report. Very optimistic. BUT… Now what? Is there a mechanism for putting this information in the hands of the public?
Thanks for posting Andy.
I watched Monckton’s talk and thoroughly enjoyed it. He is a unique individual with deep understanding over a wide spectrum of science, mathematics and politics.
Probably less than 10% of the most committed skeptic community has a clue of what he is saying. His objective of convincing Obama, Gore and Ivanka of the obvious correctness of his analysis is a pipe dream however.
I am less worried about Rex Tillerson and very concerned about Ivanka and Jared.
Here’s a pic of Monckton I took from my seat as he delivered his great address the morning of March 24, 2017 at ICCC-12. Note the cap he’s wearing.
http://climateconferences.heartland.org/wp-content/uploads/2017/03/Monckton-at-ICCC12.png
Watch his speech at the link below. look in the left-hand column and scroll down — or just search for the word “Monckton” on that page.
http://climateconference.heartland.org/
This is an extremely important talk. Monckton and I have debated this matter several times before, on his previous posts here and on an ‘Irreducibly simple equation’ post of mine at Climate Etc (hint, it is mathematically further reducible). The math he presents in this talk is compelling and correct. He proves it, and then demonstrates it again on the bench. Moreover, the derived ECS estimates correspond extremely well with observational estimates using IPCC AR5 inputs (e.g. Lewis and Curry 2014, available at Climate Etc.).
It also points exactly to the two major failings in CMIP5: cloud feedback is neutral to slight negative, not positive as modeled; water vapor feedback is about half of modeled as evidenced by the modeled troical troposphere hotspot that does not exist observationally. The last to statements are covered in depth in essays Cloudy Clouds and Humidity is still Wet in ebook Blowing Smoke.
“This was my first climate change conference and I had a great time.”
Did you get to see the smoky room with all the fat guys twirling their Snidely Whiplash moustaches while cackling and evilly going “Muwahahaha!” as they plotted destroying the planet? I’ve hear that room is fun, it’s where they pass out all the d*nier suitcases full of cash.
That room, PiperPaul, is by invitation only, and BYOB. Andy (and others) can reserve space at ICCC-13 via my super-secret email: jlakely@heartland.org.
And they will agree to reverse their findings for…………………………….”ONE MILLION DOLLARS”…………!!!!!!!!!!!!
Fred Singer is now 92 years old, but what a trooper. Everyone at the conference was inspired when he gave his outstanding presentation. He clearly explained why the evolving surface weather station network, which has been dominated by airport stations since 1990, has affected our temperature record. Airports are notorious for spurious high temperature readings for obvious reasons. They have too much pavement and too many hot airplane engines.
##########
The only problem is that Fred is wrong. There are 19000 active reporting stations in the berkeley dataset. As and experiment you can test his hypothesis that airports warm more than non airports. That null is busted.
One of the issues is that he uses old small datasets where the meta data is not very good. Airports also come in many varieties.. Some sites listed at airports are actually not at airports but are kilometers away from the airport. Many airports are small single runway fields. Some are even grass. Some have been closed for years but the name still says airport.
It’s too bad Fred documents his work at mann or Jones level…
My suggestion is that you start to recruit some young scientists.
“some young scientists”
They’re all down at Berkeley Earth finding creative ways to excuse rampant data tampering.
Give it up.
“Steven Mosher March 25, 2017 at 5:19 pm
Airports also come in many varieties.. Some sites listed at airports are actually not at airports but are kilometers away from the airport. Many airports are small single runway fields. Some are even grass. Some have been closed for years but the name still says airport.”
Complete and utter drivel! Seriously, almost every HOT t-max day in Sydney is recorded at Sydney airport and reported as a record “since records began”. We had an airport in Sydney in the 19th century?
You are sure, paid to be, funny!
Say mosh, did YOU get a new infusion of cash? 😉
Good point, Steven. So, if all the “airports” that aren’t actually airports were removed from the data, and just real airport data was used, would the null still be busted?
+1 for “fairness.”
Mockton has an undergraduate working on the equations that disprove the IPCC approach and indicate that even using their (dubious) assumptions ECS is 1.3. Berkeley should dig into Mockton’s equations if you wish to continue an intelligent discussion. Either he is right or he is wrong, and it will fall to the math, not opinion,
While you’re at it, you can explain why the Schwarzschild equation used in radiative transfer models uses an emissivity of 1 for CO2 when the measured emissivity is .2.
Pure sophistry. Again. mixed in with some nice ageism – if only you were half as clever as Singer, even at his advanced age.
Singer says the record is “dominated” by airports. He doesn’t say every record labelled airport is an airport. So you have not in any way whatsoever shown how clever you are, merely either that you can;t understand pretty simple statements or you are happy to try and claim you are right when you know your point is not valid. Which one do you want to go for?
I wouldn’t bet the farm on that.
Right you are. If the Green Meanies manage to shut down FF electrical power generation, there goes irrigation over much of the globe.
Not to mention FF-based fertilizers and pesticides. The Green Shirt storm troopers would have us back in Sir William Herschel’s world, in which a billion impoverished people were at the mercy of their local weather.
They’d be happy to see the nearly seven billion of the rest of us starve in the dark.
How right Eisenhower was. We are overrun by ‘experts’, even some on our own side of the debate.
‘Scientist’s’ are crawling out the woodwork, safe in the belief that a ‘degree’ in a subject affords them an opinion that supersedes those of mere mortals.
Many are convinced the only people capable of conjecture, a hypothesis, or a theory are those with degrees. But that is nonsense, the best scientists are children who ask the questions that need asking.
Where would we all be without Kipling’s 6 honest men:
I KEEP six honest serving-men
(They taught me all I knew);
Their names are What and Why and When
And How and Where and Who.
I send them over land and sea,
I send them east and west;
But after they have worked for me,
I give them all a rest.
I let them rest from nine till five,
For I am busy then,
As well as breakfast, lunch, and tea,
For they are hungry men.
But different folk have different views;
I know a person small—
She keeps ten million serving-men,
Who get no rest at all!
She sends’em abroad on her own affairs,
From the second she opens her eyes—
One million Hows, two million Wheres,
And seven million Whys!
The Elephant’s Child.
The elephant’s child being Kipling’s daughter, who spent her days, asking her father questions.
A child.
So just what is a modern day ‘scientist’, when uneducated oafs like me can ask them questions, that can shake their core beliefs, but which they choose to ignore.
My single question is; what human induced catastrophe has rivalled the benefits of a 14% increase in plant life over the past 30 years thanks to increased levels of atmospheric CO2.
Indeed, does the culmination of all negative aspects of increased atmospheric CO2 even come close to a 14% impact on the planet. I think not.
So until the alarmists can do some arithmetic and prove all we sceptics wrong on that single subject, I remain a sceptic.
Then there’s all the other questions they have to answer after that.
HotScot, thank you, I enjoyed reading your comment very much. I remain a sceptic as well and damn well proud of it!
“My single question is; what human induced catastrophe has rivalled the benefits of a 14% increase in plant life over the past 30 years thanks to increased levels of atmospheric CO2.”
A very good question. Not wishing to be pedantic, but I think the now extensive published data is based on observed increases in plant ‘production’ (growth or yield) rather than ‘life’ – which is harder to quantify. When chasing info in this subject area I always include Graham Farquhar in my search engine. He has been a top plant carbon physiologist for the past 45 years or so.
Bill,
The following link to NASA’s study isolates human induced plant growth from natural growth and demonstrates that 70% of the 14% increase in plant life is directly attributed to increased CO2.
https://www.nasa.gov/feature/goddard/2016/carbon-dioxide-fertilization-greening-earth
HotScot,
Thank You, I often think that some scientists need the intelligent outlook of a 6 year old.
Thank you Andy, for a most interesting report. I am glad you had fun.
I guess the take home message is that the climate is not broken and our attempts to fix it are going to be costly.
Javier
It is just changing as it always will do. We just haven’t been able to record in such detail over such a wide area. The wonderful part is that humans will be in a very advanced positioned to record the descent into a colder period.
Ozonebust,
I don’t think we are going to see the descent into a colder period for the next century at least, as I believe we are riding the millennial cycle that should peak around 2100. Science and the general public will get bored of the issue long before that.
Pat Michaels was classic Pat Michaels.
Lamar Smith was fantastic.
+10!
Andy May, thank you for the report.
Andy: Thanks for the great report! I regret that we didn’t meet — a hiccup we must remedy at Heartland’s next climate conference. I wish I had more time to meet WUWT commenters, but I have to perform multiple jobs at Heartland’s climate conferences: Making sure the program runs on time, doing a little MC work, and dealing with the media (which is always fun), etc.
If the readers and commenters at WUWT want to support Heartland’s latest conference — and the next one we will put on this year or in 2018 — PLEASE CONSIDER making a secure donation to our crowd-source campaign at IndieGOGO. The goal of this campaign is $20,000 … but it takes at least 10 times that amount to provide these world-class conferences to the public.
https://www.indiegogo.com/projects/12th-international-conference-on-climate-change-environment#/
Best,
Jim Lakely
Director of Communications (And MC of ICCC-12)
The Heartland Institute
Jim, for what it’s worth, your housekeeping announcements were the best at the conference!
Very nice of you to say so, Frizzy! I do try to rise to the level of the outstanding speakers we are lucky enough to bring to Heartland’s climate conferences. I’m glad to read that you say I succeeded.
Our esteemed host might consider holding his own conference in sunny but now, thank the Christ Child, snowy northern CA.
We’d all have to pay our own way, of course, but why not?
A group Stick It to the Mann exercise.
Gloateus: Heartland has long considered going to the Belly of the Beast in California for one of our ICCCs. I’d have it in Peter Gleick’s backyard (literally) if we could swing it! But here’s something that might not shock you: California is a VERY EXPENSIVE PLACE to put on a conference. Heartland did go to Las Vegas in 2014 for ICCC-9 (http://climateconferences.heartland.org/iccc-9/) so we could better reach climate realists out West.
Where would you recommend an ICCC be “out West,” WUWT commenters?
Vegas!
Ask Hoover Dam and the coal-fired plants east of town to go balls to the wall max power to light up our world.
OK, maybe Utah, Idaho, Arizona, Montana, Wyoming (Coal Country!) or Alaska would be more welcoming.
But really, parts of CA aren’t all that expensive nor catastrophically climate-crazy.
Correct me if wrong, but IMO the honorable owner of this blog resides in a deep red county:

Much as I resent the MSM decision to color the GOP red instead of blue.
Gloat, if i’m not mistaken, i believe it used to be the other way around. The change being made circa 1980. (just be thankful it isn’t green… ☺)
We LOVED our experience in Vegas in 2014! Super-cheap to put on a conference — especially hotel rooms for staff, speakers, and attendees — and lots of fun activities for folks besides the event. That was our highest attendance ever (nearly 700) and had some great presentations. See them at the link below.
http://climateconferences.heartland.org/iccc-9/
And keep this between you and me, Gloateus, but there is talk at Heartland HQ about doing a second conference this year. And if that long shot comes through, Vegas is (appropriately) at the top of the short list.
Viva Las Vegas! Yeah, baby!
Sadly, Elvis has left the building. Thank you. Thank you very much.
Let’s generate some serious CO2!
I like it. Count me in. If I can make enough money producing planet-saving CO2 this year, maybe I’ll stay at the Bellagio.
(Not totally sure, Gloateus, but I think The Blogger here is in pink territory . . I’m a bit north in a red zone.)
(PS . . there’s no useful idiot factory in my county ; )
Andy
A wonderful summary, thank you
“I highly recommend that you listen to the wonderful speeches given by Lord Christopher Monckton and EU Parliament member Roger Helmer”
Where can we access these please?
OK, just saw the link just posted.
You can find Monckton’s speech at this link: http://climateconference.heartland.org/
Next week, Heartland will have the time to pull out just Monckton’s speech and post it on Heartland’s archive page for Monckton (http://climateconferences.heartland.org/christopher-monckton/), but you’ll have to make due, for now, with going here (http://climateconference.heartland.org), and look at the left-hand column while you scroll down to Friday, March 24 to play the video. Or, you could just go to that page and search for the word “Monckton.”
BONUS: Willie Soon introduced Monckton on Friday morning.
http://climateconferences.heartland.org/wp-content/uploads/2017/03/Willie-Soon-introduces-Monckton-at-ICCC-12.png
Thanks Jim. Got it!
Testing.
Testing. Can’t post over here: https://wattsupwiththat.com/2017/03/24/effect-of-atmospheric-co2-concentrations-on-early-human-societies/
engarbage@gmail: Don’t you know that accuracy is a fundamental tenet of science? You’ve used “it’s” instead of “its” repeatedly. However, there is a vast difference between their meanings. Once you’ve discovered this, I’m sure it will also improve your SCIENCE.
Heavens to Betsy, a typo!
Stop the presses and alert the media!
*rolls the eyes*
I noticed the same thing. However, nearly everyone makes that error these days. It’s really quite simple: it’s = it is (or sometimes, it has). Everyone, please spread the word!
It could be even simpler…lots of people use phones or iPads which have built in autocorrect which often makes incorrect changes to what is typed.
And then there is speech to text, which is likewise commonly used and is not always very accurate.
But the point is, there is no reason to believe that typographic or spelling errors are in any way correlated to a particular person’s comprehension of scientific issues or a person’s level of scientific education or acumen.
And then their is irony!
Not forgetting “it’s”, as in the possessive…
“It could be even simpler…lots of people use phones or iPads which have built in autocorrect which often makes incorrect changes to what is typed.”
One of the more irritating features of smart phones. They are a little too smart sometimes.
Thanks for the summary Andy. You must have been looking at my notes. Other highlights for me (watch the videos for the full contexts):
Jay Lehr stated in his opening remarks that in his “biased” opinion CO2 has NO role in causing climate change. The Paris Accord allows for other countries to sue the U.S. for alleged CO2 emissions that waft over them.
It was painful to see such a physically frail S. Fred Singer being helped to the platform. But then he started giving his presentation and you realized that his mental capacity is essentially undiminished.
Don Easterbrook – CO2 cannot be the cause of climate change as the record shows CO2 always lags temps.
Indur Goklany – Fossil fuels are nature’s battery.
Richard Trzupek – Sierra Club is beyond delusional.
J. Scott Armstrong – “Be conservative by adhering to cumulative knowledge”. Regulation has always failed to fulfill its intended purpose.
Steve Milloy – We must separate government from science.
If you have the time I highly recommend that you watch all the videos. Willie Soon crammed so much information into his allotted time slot that I’ll probably have to see that one 3 or 4 more times to take it all in.
Great comment, thanks! Good points.
Please find below two articles of mine published in The Hans India daily newspaper in March 2017 relating to global warming and water pollution aspects.
http://www.thehansindia.com/posts/index/News-Analysis/2017-03-24/Blaming-everything-on-global-warming/288704
http://www.thehansindia.com/posts/index/News-Analysis/2017-03-01/Rulers-least-bothered-about-environment-/284043
Blaming everything on global warming
THE HANS INDIA | Mar 24,2017 , 04:16 AM IST
________________________________________
.
Recently several articles related to global warming appeared in The Hans India and the recent one appeared on 5th March 2017. This type of surveys-observations from the air convey very little on the science of climate change. Ten year records become astonishing events, weather catastrophes of 50 or 100 years ago are forgotten.
It makes for good click bait but cripples our ability to prepare for the inevitable. In the last one year stories after stories were published internationally on the drought in California linking it to global warming. Now, California is reeling under heavy rain and snow falls. A 43-day storm that began in December 1861 put central and southern California underwater for up to six months.
Proverbs on climate with the reference to seasons [in Telugu] were built based on the experience of our forefathers and also they are part of Astrological Panchangas. In the last few days, the media is agog with the heat. In fact, the extreme temperatures are not new to this part of India. According to 1931-1960 Normal [Red] Book of IMD, Hyderabad reached 37.2, 42.2, 43.3 & 44.4 oC in February, March, April and May respectively.
Present conditions haven’t crossed these limits. Also clear skies present high diurnal variations and cloudy skies present low diurnal variations. These are controlled by local “climate system – atmosphere, hydrosphere, crystosphere, land surface, biosphere–” and “general circulation patterns – wind patterns –” at any given location and region. Pollution also influences the climate, particularly in winter with temperature inversion layer formations.
Earth’s climate is dynamic and always changing through natural cycles. What we are experiencing now is part of this system. Droughts and floods form part of natural variability in climate and form main part of the climate change. These are beyond human control. We need to adapt to them. Agriculture was adapted to such vagaries by our forefathers; they built location-specific technologies in terms of farming systems.
However, with the increased interference of humans on nature, the natural variations are being modified at local and regional scales. The combination of these is known as climate change. Also, meteorological parameters are inter-related and mutually interactive. Natural variability consists of irregular variations that include “intra-seasonal & intra-annual” variations and “systematic variations” expressed by fluctuations or cyclic variations of different durations. In the case of temperature, the man-induced variations have two components. They are changes through greenhouse effect and non-greenhouse effect.
Global warming is a part of greenhouse effect associated with the anthropogenic greenhouse gases. The non-greenhouse effect is termed as ecological changes associated with the changes in land and water use and cover, generally expressed by urban-heat-island effect and rural-cold-island effect. The human-induced change is expressed as trend. Thus, climate change is not global warming; but global warming is only one part of human-induced changes of climate change.
In the global (land and ocean) temperature anomaly of adjusted data series 1880 to 2010, the trend presented an increase of 0.6 oC per Century of which around 50% is the global warming component – 0.3 oC per Century. The satellite observational data series show half of this only [0.15 oC], as it considers urban-heat-island and rural-cold-island effects unlike ground- based measurements in a balanced way.
With all this, unfortunately, it has become a ritual, to attribute every weather event to El Nino or Global Warming without looking into weather and climate of the regions. In 2014, WMO Secretary General in his World Meteorological Day release attributed the 2013 drought and warm conditions prevailing in the Southern Hemisphere to global warming following the footsteps of IPCC and the Ethiopian drought conditions were attributed to El Nino by FAO Representative in Ethiopia. In fact, they are part of natural variations which was discussed in my book as back as 1993.
Nature is being destroyed by both natural disasters such as cyclonic activity, earthquakes, volcanic activity, tsunamis, etc; and activities to meet human greed such as wars, oil-gas-water extraction, physical destruction of ecologically sensitive zones and destruction of natural water flow systems, violation of acts or laws, etc are often attributed to global warming.
The flood disasters in Uttarkhand in June 2013; Jammu and Kashmir in September 2014; November-December 2015 in Chennai & Nellore; September 2000 in Hyderabad are the manifestations of human greed. Now governments are wrongly putting the blame on global warming. Indian institutions are making even Prime Minister to make false statements like “Chennai floods are associated with the Global Warming.” We must realise the fact that “ignorance is terrible but exaggeration is dangerous.”
Even at the recent 104th (2017) India Science Congress in Tirupati such statements were made by prominent people and also presented all-India Southwest Monsoon Rainfall is decreasing but on the contrary it presents a 60-year cycle wherein choice of data set in a sine curve define increasing or decreasing trend. It is like our proverbial saying “There is Tiger, here is the Tail” and in line with this “There is global warming, here is the impact.”
(Writer is Convenor, Forum for a Sustainable Environment, Hyderabad)
By Dr S Jeevananda Reddy
Continued——
Rulers least bothered about environment
THE HANS INDIA | Mar 01,2017 , 05:31 AM IST
________________________________________
.
Human societies’ impact on environment is a function of population growth, more particularly in urban areas with around present 30% concentration which may reach 60% by 2050, their consumption patterns and their innovative technologies-based lifestyles. We consume resources from healthy ecosystems and make it unhealthy ecosystem over time.
Unplanned urbanisation, population explosion, agriculture and uncontrolled sewage discharge into rivers and lakes/tanks are primary reasons behind the rise in surface water pollution. Gulf of Mexico turned into a dead zone spreading over thousands of square kilometers with runoff that contains residues of chemical fertilisers & sprays from agricultural farms carried through Mississippi River in USA. We are using groundwater indiscriminately but we are not taking any action on recharging the groundwater and thus causing water pollution. The surface polluted water also polluting groundwater.
Just before Paris climate meet in 2016, Pope Francis released a provocative encyclical on the environment – Laudato Si. Again a few months back, he emphasised that destroying the environment was a sin. He further noted that humans were turning the planet into wasteland of debris, desolation and filth, and called for urgent action. Pope Francis further emphasised that, “We must not be indifferent to the loss of biodiversity and the destruction of ecosystems, often caused by our irresponsible and selfish behavior.” He called for consumers to modify their modern lifestyles by reducing waste, planting trees, etc.
The same was emphasised by UN & US Presidents just before Paris meet. But this was not reflected in the Paris Agreement document. A report of UNEP (United Nations Environment Programme) warns about the rising water pollution in three continents, namely Asia, Africa and Latin America, placing hundreds of millions of people at risk of contracting life-threatening diseases and putting aquatic flora and fauna under extinction threat. It observed that, “The increasing amount of wastewater being dumped into our surface waters is deeply troubling.
Access to quality water is essential for human health and human development. Both are at risk if we fail to stop the pollution.” Stan Cox’s ‘Sick Planet: Corporate Food and Medicine,’ argues that corporate food and medicine industries are destroying environments and ruining living conditions across the world.
In twin cities, with the poor town planning more than 50% of lakes [952] and gardens [415] were replaced by concrete structures. We generate huge quantity (around 2000 million liters per day) of sewage and industrial effluents but we don’t have the capacity to treat at least 25% of such water and, as a result, Musi River and water bodies have turned into cesspools of poison. These in turn pollute groundwater. Reuse of that much water would have reduced the burden on bringing water from far-off places for drinking and other purposes.
We rarely look at precautionary principle; instead of prevention measures, we try controlling measures with which we rarely achieve the stated goal. Also, with isolated control measures, the scenario will not change. Take for example, will the Supreme Court order really improve the industrial pollution? The court needs to look into ground realities such as excess production and zero pollution. Without that, there will not be any improvement in reducing the pollution levels.
In the case of Musi river rejuvenation project or for that matter any other river including Ganga, isolated cleaning operations will not change the river condition except resulting in crores of rupees changing hands. In the case of Musi river, the government must start cleaning up of water bodies and water flow systems from the starting of catchment area and at the same time not allowing industrial effluents going out.
For the last two decades, several agencies studied the quality of groundwater in and around Hyderabad and presented the state of affair, little has been done by the government, except the media presenting those results. Even the Central Pollution Control Board (CPCB) presented its report in 2009. APPCB tried to show lower pollution potential through manipulation, which I countered and brought to the notice of MoEF and CPCB. The CPCB presented its next report wherein it showed increased levels of pollution index. Now it deteriorated further with government mooting Pharma City, a new point to dump both solid and liquid wastes generated.
Instead of controlling pollution from existing industries, the government is trying to increase them with new industrial estates/Pharma City and hospitals. As long as the government looks at health hazards in this direction, pollution will automatically grow by leaps and bounds.
(Writer is former Chief Technical Advisor to WMO & UN)
By Dr S Jeevananda Reddy
I thought the social cost of carbon was positive ! The deserts are greening , food production numbers keep improving so to me it’s a positive thing not negative .
Cost vs. benefit; if you don’t have to pay for a benefit, then its cost is negative.
“Dr. Pat Michaels made an impassioned plea to reverse the CO2 endangerment finding and quoted Eisenhower’s final speech from January 17, 1961:”
I’m glad to see Eisenhower’s quote is finally catching people’s attention. It highlights the logical outcome of the empowerment of government research over the policy makers. To discover that EPA research isn’t released to the public is truly shocking, and needs to be changed immediately. That is almost unbelievable. How can there be Gov’t watchdogs when you aren’t allowed to study the evidence? What is the EPA? A Mob run organization? Anyway, Eisenhower’s quote should be passed around. It was featured on my blog and in the documentary “The Changing Climate of Global Warming.” Be sure to pass it around.
Climate “Science” on Trial; The Prophet Eisenhower Warned Us About Climate Scientists
https://co2islife.wordpress.com/2017/02/09/climate-science-on-trial-eisenhower-warned-us-about-climate-scientists/
http://www.mayoclinic.org/drugs-supplements/chromium-supplement-oral-route-parenteral-route/description/drg-20070098
Chromium supplements are used to prevent or treat chromium deficiency.
The body needs chromium for normal growth and health. …. Chromium helps your body use sugar properly. It is also needed for the breakdown of proteins and fats.
wiki
In the United States, the dietary guidelines for daily chromium intake were lowered in 2001 from 50–200 µg for an adult to 35 µg (adult male) and to 25 µg (adult female).[
—
Cr(VI)[edit] wiki
The acute oral toxicity for chromium(VI) ranges between 50 and 150 µg/kg.[70] In the body, chromium(VI) is reduced by several mechanisms to chromium(III) already in the blood before it enters the cells. The chromium(III) is excreted from the body, whereas the chromate ion is transferred into the cell by a transport mechanism, by which also sulfate and phosphate ions enter the cell. The acute toxicity of chromium(VI) is due to its strong oxidational properties. After it reaches the blood stream, it damages the kidneys, the liver and blood cells through oxidation reactions
So chromium is essential for human growth but is also toxic and carcinogenic
CO2 is essential for humans and plants
but:
Occupational CO2 exposure limits have been set in the United States at 0.5% (5000 ppm) for an eight-hour period.[105] At this CO2 concentration, International Space Station crew experienced headaches, lethargy, mental slowness, emotional irritation, and sleep disruption.[106] Studies in animals at 0.5% CO2 have demonstrated kidney calcification and bone loss after eight weeks of exposure.[107] A study of humans exposed in 2.5 hour sessions demonstrated significant effects on cognitive abilities at concentrations as low as 0.1% (1000ppm) CO2 likely due to CO2 induced increases in cerebral blood flow.[102] Another study observed a decline in basic activity level and information usage at 1000 ppm, when compared to 500 ppm.
Perhaps my previous comment re intelligence does not occur at high CO2 levels was not such a joke after all – 1000ppm lowers information usage.
so are co2 and chromium Safe?
in the required concentrations – yes, but in excess – no.
That is true of everything.
Check out the LD50 charts of common substances.
Salt stands out as something we all need to survive and our bodies excrete continuously, but is deadly if eaten in a large amount.
Aspirin, caffeine, nicotine…all have LD50s extremely low compared to, say, glyphosate.
Glyphosate is so non-toxic that some studies were unable to force enough of it into the stomach of certain mammals to kill any of them, and yet is the singular villain in religion of an entire green horde of doom-crying professional worrywarts.
Go figure.
All things in moderation.
We are now moderating the excessively low levels of CO2 we found in the air when we found the collective wherewithal to measure and comprehend the significance of such things.
http://skepchick.org/wp-content/uploads/2015/04/LD50-common-chemicals.jpg

Dirty dishwater is unlikely to be very toxic either, but only a fool would drink some to prove that point.
Besides, Roundup, and other commercial herbicides which have glyphosate as an active ingredient, does not contain only glyphosate…it also has various surfactants and other adjuvants which may or may have equal toxicity to the glyphosate.
But hold on a second…are you refuting the science here?
Do you claim to have data at odds with the findings of the numerous studies which have investigated the safety of glyphosate?
Or are you engaging in a value judgement?
How much coverage in the MSM?
Surprisingly, it so far seems to have received less attention this year than in some prior years.
“particularly when one considers that the Antarctic sea ice extent is at a record level.”
er, no, it isn’t.
It is at a record low after just two exceptionally high years.
The arctic sea ice is STILL at a record low, having been like that for most of the time since late September.
and yes it looks like the arctic has cycles… except we’re now way below the low point of what is likely to have been the last one and still going down… and we’re overdue for the uptick.
As I suggested to Nick above, why talk about sea ice extent around Antarctica at all? It’s clear that either direction, the scammers will blame it on man-made climate change.
““What is disconcerting to me and so many of my colleagues is that these tools that we’ve spent years developing increasingly are unnecessary because we can see climate change” (Mann)
Agreed?
By whose calendar? I didn’t know nature had schedules.
I’m starting to think that predicting the end of the world is the only thing that makes you happy.
I tell it like it is.
If there’s something happening, why spend a lot of time persuading people ‘there’s nothing to see here’?
I’m beginning to think hiding from reality is the only thing that makes you happy…
“I tell it like it is.”
Bollocks.
You make it up as you go along.
Griff
**I tell it like it is.**
So tell us that you cannot find a paper that MEASURES the warming by CO2.
Tell us.
Waiting………………..
Also, antarctic ice isn’t at a record low. It’s bang on the average. Currently a little over it.
Archer if you are talking about Antarctic sea ice extent as being bang on the average, you must not know what 2 standard deviations below the average means. http://nsidc.org/data/seaice_index/images/daily_images/S_stddev_timeseries.png
“In the Southern Hemisphere, sea ice likely reached its minimum extent for the year on March 3, at 2.11 million square kilometers (815,000 square miles). This year’s minimum extent was the lowest in the satellite record, continuing a period of satellite-era record low daily extents that began in early November. ”
Lowest in the satellite record is a record low, isn’t it??
http://nsidc.org/arcticseaicenews/
“The arctic sea ice is STILL at a record low, having been like that for most of the time since late September.”
The arctic sea ice is only at record lows if you cherry-pick the time period. There was less arctic sea ice in 1972 than now. The year 1978 was a highpoint for arctic sea ice. So you ignore the 1972 low year and begin your calculation starting from the high point of the satellite era 1978, which skews the picture radically.
https://realclimatescience.com/2015/09/starting-graphs-in-1979-world-class-fraud/
Andy, I enjoyed meeting you at the conference. Great job on the summary.
Happer’s last point,
, is a very important one. At a reasonable discount rate, 7% as the OMB has suggested for public projects for a very long time, present value of near term benefits, which are easy to quantify, greatly outweight the long term costs, which are fairly nebulous.
There is an effort to replace the simple 7% guidance with a rate of 3% for “intergenerational transfers”. But this is just an exercise in circular logic. It is, in effect, discount rate shopping to find one that makes one’s current fantasy look reasonable.
There is an even worse effort being promoted by outfits such as “progressivereform.org” who appear to wish to eliminate benefit/cost ratio or net present value analyses altogether. It is interesting, and a bit disheartening, to see that some statutes, actually many, prohibit rational analyses of the benefit/cost ratio variety.
Omg Don’t these people have children/grandchildren? Go stick your head back in the sand, everything will be fine!
I wonder if they realise that corporations are ONLY interested in profits so the nearsighted executive can get a bonus. Really disappointing artical.
Nick
Record low ‘global sea ice’ so the Solomon Islands and Nauru should (finally) be disappearing, correct?
Inconvenient data — Solomon Islands’ mean sea level for Jan & Feb 2017 is lower than the mean for holy moly — 2000, 2001, 2006, 2008, 2009, 2011, 2012, 2014 and 2015.
Inconvenient data — Nauru’s mean sea level for Jan & Feb 2017 is lower than the mean for holy moly — 1997, 2002, 2004, 2014 and 2015.
Nick the ‘experts’ have been warning over a decade that melting sea-ice will drown us, so why is it having the opposite affect right now?
Who will lobby Solomon and Nauru to refund climate mitigation money fraudulently obtained over the past decade during which time their mean sea levels have been on a small down trend?
If you read the science, it rules out CO2, just look at Nature Magazine. I wish this was covered at the event.
Climate “Science” on Trial; Give a Climate Alarmist Enough Rope They’ll Hang Themselves
https://co2islife.wordpress.com/2017/03/26/climate-science-on-trial-give-a-climate-alarmist-enough-rope-theyll-hang-themselves/
Great conference. Naturally the speakers were superb. This has been the standard for the 10 U. S. Conferences I attended. The hotel also did an outstanding job. Meals were cleared fast after banquet sessions. Servers were very polite. Servings all appeared to be individually made for us.
As a side light, the Cure bar and restaurant staff were very friendly and efficient. The same can be said for the Concierge Office.
Overall, the conference was outstanding.
James H. Rust, professor of nuclear engineering (ret. Georgia Tech)
Just as when searching some climate topic on google the top entry will be ‘skeptical science [sic]’, on searching the names giving talks you’ll find the top, or sometimes second top (after Wikipedia), google entry will be the desmog hatchet-job website. — odd.
Having attended myself, I have to disagree about what are the key take-aways.
From a policy perspective, the single most important is to revisit and vacate the EPA’s endangerment finding. Pat Michaels put it very clearly that, if the EPA finding that CO2 is a pollutant is not nullified, any attempt to dismantle other green programs can – and will – be stopped in the courts. The very first order of business is remove CO2 as a regulated air pollutant. Period. Full Stop. All other initiatives follow on from there. Without it, there is little hope of achieving any other goals.
The second is to formally remove the United States from the United Nations Framework Convention on Climate Change. Why the UNFCCC? It’s the shortest route. Only 1 year’s notification is required and no explanation or justification is necessary. It can be done almost entirely in the Executive branch without legislative involvement except to confirm the fait accompli. It immediately obviates participation in the IPCC. It immediately withdraws the US from the Paris Treaty. I’m a fan of quick and easy.
I’m a bit late commenting on this great article but I hope someone will answer. On concentrations of CO2 that might be harmful to humans, has anyone estimated the rate of increase in concentration of CO2 inside a car with all windows closed and the air circulation switched to Recirc?
In my car when I am alone I start to feel drowsy after about 10 minutes. With more people in the car it’s faster.
Peter,
Maybe ten times the current level would be harmful, over time, but not much it seems . . consider how rarely people die when sleeping in cars or other enclosed situations . . I tend to get dozy too, but I’m pretty sure it’s from vibration.
I agree, there are many reasons for becoming drowsy in a moving car, vibration, boredom, not enough sleep. I sincerely doubt it has anything to do with the increased level of CO2 in a closed environment. I have frequently driven long distances going cross-country in a closed vehicle. Sometimes I get drowsy, that usually means it is time for the co-driver to take over! On my last trip, there were four other people with me, we all managed to stay awake.
PMK
Nearly forgot, Walter Cunningham told us that NASA had no problem with the Apollo astronauts breathing in 3-5K PPM and in the space station it is even higher.
PMK
Here’s WaPo’s Heartland story:
https://www.washingtonpost.com/politics/the-mercers-trump-mega-donors-back-group-that-casts-doubt-on-climate-science/2017/03/26/dc1fde86-109b-11e7-9b0d-d27c98455440_story.html?utm_term=.703c558e46eb
Interesting…I saw the Mercer father and daughter but had no idea who they were. I didn’t notice that they were being fawned over either.
PMK
@ferdinand meeus Engelbeen
I agree with your observation that the half-life of excess co2 in the atmosphere is ~35 years. The only caveat I would add is to call it an “apparent” half-life. It may not hold in the future, like many of the other relationships in climate science.
If Samuel would stop his name calling for a minute, he could do a simple calculation to show the relationship between the excess co2 and the proportion of co2 extracted from the atmosphere. Simply take the beginning value of the excess (e.g. 400ppm – 280ppm = 120ppm excess), add the emissions for the year (e.g. 5ppm), and divide this into the actual growth rate (e.g. 2.5ppm). It comes out to 2%. Using the rule of 72, the half-life is ~35 years.
This can be easily modeled in a spreadsheet and the relationship is fairly constant for the last 50-some years. If you exclude land-use emissions, the rate starts a little higher and levels off at 2%. If you include land-use emissions, the rate starts a little lower and again levels off at 2%.
This calculation would make for an interesting blog post.