Brought to You by SEPP (www.SEPP.org) The Science and Environmental Policy Project
THIS WEEK: By Ken Haapala, President
False Precision: In their early education, many students of science faced the problem of significant numbers (digits). A useful rule of thumb was that the chain was only as strong as its weakest link. In measurement, the less precise instrument making the measurements determines precision of any dataset representing the measurements. A mathematical operation does not add precision to the instruments, or the dataset. For example, as discussed in the January 21 TWTW, the widely used Automatic Surface Observing System (ASOS) instruments at airports have a precision of plus or minus 1 degree C (1.8 F, correctly, 2 F). Surface datasets using these measurements cannot be more precise than these instruments. Yet, routinely, some government agencies report data, after mathematical manipulation, with far greater precision – to one-hundredths of a degree C. Such precision is false.
Writing in the non-conservative Boston Globe, columnist Jeff Jacoby gives a simple illustration on how small errors in measurement can compound in a computer model with many small errors. Any assumption that the errors will cancel each other out needs to be demonstrated. However, in the reports of the UN Intergovernmental Panel on Climate Change (IPCC) and its followers, such cancellation of errors is not demonstrated.
As reported in the January 7 TWTW. Roy Spencer estimates that: “The resulting 2016 annual average global temperature anomaly is +0.50 deg. C, which is (a statistically insignificant) 0.02 deg. C warmer than 1998 at +0.48 deg. C. We estimate that 2016 would have had to be 0.10 C warmer than 1998 to be significantly different at the 95% confidence level. Both 2016 and 1998 were strong El Niño years.” See links under Challenging the Orthodoxy and Measurement Issues – Atmosphere.
###################################################
Quote of the Week. Accurate and minute measurement seems to the non-scientific imagination, a less lofty and dignified work than looking for something new. But nearly all the grandest discoveries of science have been but the rewards of accurate measurement and patient long-continued labour in the minute sifting of numerical results. Baron William Kelvin
###################################################
Number of the Week: 7,500,000 tonnes of lead acid batteries (8,250,000 tons)
###################################################
Avoiding Dogma: One is tempted to use Spencer’s analysis “to prove” that carbon dioxide (CO2) has no influence on global warming. For example, using December data to minimize seasonal variation, one can calculate that from December 1997 to December 2016, CO2 as measured at Mauna Loa Observatory went up 11%; yet, there was no significant increase in atmospheric temperatures. Then, one can assert that this “proves” that CO2 has no influence on temperatures. But such an assertion is as dogmatic as many used by the IPCC and its followers.
Two points provide insufficient data. The real issues are two-fold: 1) what will happen following the recent El Niño; and 2) are the frequency and severity of El Niños indicative of a CO2-caused warming?
To answer the first question, we must wait and see what happens. To answer the second question, much research needs to be done. The IPCC and its followers have dismissed El Niños as weather events, not indicative of climate change. A relationship between CO2 and El Niños needs to be established. If there is none, so said. See links under Measurement Issues – Atmosphere.
******************
Challenging the Kiehl – Trenberth Model: Last week’s TWTW introduced the Kiehl – Trenberth Annual Global Mean Energy Budget Model, which provides the core for most, if not all, current global climate models (GCMs) used by the IPCC and its followers.
What is of particular interest is the center of the diagram, the Latent Heat (or latent energy) from Evapo-transportation and, to a lesser degree, Thermals. The latent energy is from phase change of water at the surface evaporating into water vapor, then the energy is released as heat when the water vapor condenses in the atmosphere. This gives rise to the so-called “hot-spot”, which was incorrectly called by B. Santer, et al. the “distinct human fingerprint.”
This latent energy from phase change of water is critical to the 1979 Charney Report. It was estimated, “guessed at”, and no empirical evidence was provided. The Charney Report provided the basis for the claim that a doubling of CO2 of will increase surface temperatures by 3 degrees C, plus or minus 1.5 degrees C. Except for an increase in the lower estimate in Fourth Assessment Report (AR-4, 2007), which was discarded in the Fifth Assessment Report (AR-5, 2013), the estimates in the Charney Report have been used by the IPCC and its followers for over thirty-seven years, without improvement.
Any error in the calculations may produce significant errors in climate models over time. In personal correspondence, meteorologist Australian William Kininmonth wrote:
“…While the radiation aspects of the GCMs are relatively well specified from experimental physics and the well-known structure of the atmosphere this is not the case for processes involving heat and latent energy. In the Kiehl and Trenberth assessment (and other like budgets) the surface heat and latent energy exchanges are not verifiable from physical measurements but are values giving closure the steady state model. In modelling these processes the best that can be done is to resort to unverified bulk aerodynamic formula, modified somewhat arbitrarily for changing terrain. There is great uncertainty as to how, globally, the surface heat and latent energies might change with temperature. Yet these rates of change are crucial to understanding how surface temperature will change under changing CO2.
“Then there is the issue of feedbacks. Surface heat and moisture fluxes are functions of temperature and moisture gradient as well as surface temperature. How do these gradients vary as surface temperature increases? In the troposphere, convection distributes heat and moisture vertically and the overturning converts latent energy to heat that is available to offset radiation divergence. If the convective overturning is not sufficiently rapid, then moisture stays longer in the boundary layer thus inhibiting any increase in latent energy flux with temperature increase. From the discussion above it can be recognised that any inhibition to latent energy flux increase with temperature will suppress the overall rate of surface energy loss as temperature rises. A new steady state surface energy balance from an increase in CO2 (and hence increased back radiation) will require a greater fraction of the incremental increase in surface energy loss to be taken up by surface radiation emission – that is, a higher temperature for a new steady state condition. Within GCMs, on average, surface evaporation increases at about 2 percent per degree C. This is about one-third of the Clausius Clapeyron relationship. This discrepancy does not seem to trouble modelers.
“Modellers are not able to maintain long term stability of their models without imposing predetermined conditions on aspects of the energy flows through the system. Initially this was via surface flux adjustment; that is, constraining the very energy flow that realises temperature sensitivity to CO2 forcing. Later models use different methodologies but the constraints to ensure long term steady state also impact on the sensitivity.”
It is the lack of physical verification of the surface heat and latent energy that may be the source of major problems with the GCMs, particularly in their inability to forecast a warming of the atmosphere, which the Chaney Report states will occur. This is the primary amplifier of a CO2-caused warming, which the Chaney Report says, alone, will be modest, based on laboratory experiments.
Independently, using spectral analysis, Antero Ollila of Aalto University, Helsinki, addresses the issues in Watts Up With That? His calculations of the warming contribution of CO2 were very close to those of Kiehl and Trenberth – 27% and 26%, respectively. But, Ollila goes on to state:
“…There is only one small problem, because the water content of this atmosphere is really the atmosphere over the USA and not over the globe. The difference in the water content is great: 1.43 prcm versus 2.6 prcm. I have been really astonished about the reactions of the climate scientists about this fact. It looks like that they do not understand the effects of this choice or they do not care…”
If Ollila’s assertions are correct, then there is a major problem with the global climate models. The surface of the tropics is 80% over water. Water vapor dominates the tropical atmosphere, but is not as prevalent in the U.S. Thus, the transfer of surface heat and latent energy through phase change in water may be stronger in the atmosphere over the US than over the tropics, where this energy transfer is inhibited by atmospheric saturation. The moisture gradient is far less over land in most of the US than the moisture gradient in the tropics. Such a difference would result in a far greater estimate of CO2-caused warming than what will occur. It may be time to re-examine the entire effort to blame CO2 for possible dangerous global warming. See links under Challenging the Orthodoxy and Defending the Orthodoxy.
******************
Peak Oil Peaked? In 1970, oil production in the US peaked at 9,637 thousand barrels per day (BPD), giving rise to government energy models predicting the world would run out near the end of the 20th century, and the US would run out of natural gas about the same time. In 2007 oil production bottomed at 5,077 thousand BPD. Thanks to the advances in precision drilling and in hydraulic fracturing, the US Energy Information Agency is projecting that in 2018 US oil production will exceed that of 1970, at an estimated 9,700 thousand (BPD).
These projections do not include the major finds in Alaska and possible major development in the Gulf of Mexico. See links under Oil and Natural Gas – the Future or the Past?
******************
Number of the Week: 7,500,000 tonnes of lead acid batteries (8,250,000 tons). Recently, South Australia had several major black-outs that can be largely attributed to over-reliance on unreliable wind power. Yet, the government wants to go 100% renewable. On Jo Nova’s web site, Paul Miskelly and Tom Quirk presented their calculations of the least costly way to provide reliable back-up when wind power fails. It would require about 60 to 90 billion Australian dollars and about 8,250,000 tons of lead-acid batteries. No doubt, the government will tuck them away in Adelaide.
###################################################
NEWS YOU CAN USE:
Science: Is the Sun Rising?
Russian Scientists Predict Global Cooling In The Next Few Decades
By Staff Writers, GWPF, Mar 15, 2017
http://www.thegwpf.com/russian-scientists-predict-global-cooling-in-the-next-few-decades/
Link to paper: Cosmic rays, solar activity, and changes in the Earth’s climate
By Stozhkov, Y.I., Bazilevskaya, G.A., Makhmutov, V.S. et al. Bull. Russ. Acad. Sci. Phys. Mar 3, 2017
https://link.springer.com/article/10.3103/S1062873817020411
Conference on Cosmic Rays
Abstract: One of the most important problems facing humanity, global climate change, is discussed. The roles of cosmic ray fluxes and solar activity in this process are analyzed. Although several mechanisms explaining global climate change have been proposed, none of them are firmly grounded. At the United Nations summit in Paris at the end of 2015, it was decided that greenhouse gases are responsible for the global warming of our planet. However, the authors of this work believe the question of what causes global changes in the Earth’s climate remains open, and will obviously be solved once and for all in the next 10–15 years.
Challenging the Orthodoxy — NIPCC
Nature, Not Human Activity, Rules the Climate
S. Fred Singer, Editor, NIPCC, 2008
http://www.sepp.org/publications/nipcc_final.pdf
Overcoming Chaotic Behavior of Climate Models
By S. Fred Singer, SEPP, July 2010
http://www.sepp.org/science_papers/Chaotic_Behavior_July_2011_Final.doc
Climate Change Reconsidered II: Physical Science
Idso, Carter, and Singer, Lead Authors/Editors, 2013
https://www.heartland.org/media-library/pdfs/CCR-II/CCR-II-Full.pdf
Summary: http://www.nipccreport.org/reports/ccr2a/pdf/Summary-for-Policymakers.pdf
Climate Change Reconsidered II: Biological Impacts
Idso, Idso, Carter, and Singer, Lead Authors/Editors, 2014
http://www.nipccreport.org/reports/ccr2b/pdf/Full-Report.pdf
Summary: https://www.heartland.org/media-library/pdfs/CCR-IIb/Summary-for-Policymakers.pdf
Why Scientists Disagree About Global Warming
The NIPCC Report on the Scientific Consensus
By Craig D. Idso, Robert M. Carter, and S. Fred Singer, NIPCC, Nov 23, 2015
http://climatechangereconsidered.org/
Download with no charge
https://www.heartland.org/policy-documents/why-scientists-disagree-about-global-warming
Challenging the Orthodoxy
Why Are Climate-Change Models So Flawed? Because Climate Science Is So Incomplete
By Jeff Jacoby, Boston Globe, Via GWPF, Mar 15, 2017
“But for the sake of argument, say there are merely 15 variables involved in predicting global climate change, and assume that climatologists have mastered each one to a near-perfect accuracy of 95 percent. What are the odds that a climate model built on a system that simple would be reliable? Less than 50/50. (Multiplying .95 by itself 15 times yields 46.3 percent.) Is it any surprise that climate-change predictions in the real world – where the complexities are exponentially greater and the exactitude of knowledge much less – have such a poor track record?”
On the Reproducibility of the IPCC’s climate sensitivity
Guest essay by Dr. Antero Ollila, WUWT, Mar 17, 2017
https://wattsupwiththat.com/2017/03/17/on-the-reproducibility-of-the-ipccs-climate-sensitivity/
A Particularly Troublesome Aspect of Climate Alarmism
By Alan Carlin, Carlin Economics and Science, Mar 16, 2017
http://www.carlineconomics.com/archives/3455
“Pruitt has made an important beginning, but much more unequivocal statements from public officials together with references to the abundant evidence available for it will be needed if decades of misleading CIC propaganda are to be overcome.”
Global CO2 Emissions Have Stopped Rising, International Energy Agency Says
By Pilita Clark, Financial Times, Via GWPF, Mar 17, 2017
http://www.thegwpf.com/global-co2-emissions-have-stopped-rising-international-energy-agency-says/
[SEPP Comment: Yet atmospheric CO2 content continued to increase.]
Defending the Orthodoxy
Earth’s Annual Global Mean Energy Budget
By Kiehl, J. T. and Trenberth, K. E., Bulletin of the American Meteorological Society, 1997
http://www.cgd.ucar.edu/cas/abstracts/files/kevin1997_1.html
“Because the net surface heat budget must balance, the radiative fluxes constrain the sum of the sensible and latent heat fluxes which can also be estimated independently.”
Carbon Dioxide and Climate: A Scientific Assessment
Ad Hoc Study Group on Carbon Dioxide and Climate
By Jule G. Charney, et al. Climate Research Board, National Academy of Sciences, July 23-27, 1979
https://www.nap.edu/read/12181/chapter/2#2
Questioning the Orthodoxy
Uncertainties, Errors In Radiative Forcing Estimates 10 – 100 Times Larger Than Entire Radiative Effect Of Increasing CO2
By Kenneth Richard, No Tricks Zone, Mar 13, 2017
A menagerie of fallacies
The various ways our statistical reasoning lets us down
By Matt Ridley, Rational Optimist, Mar 11, 2017
http://www.rationaloptimist.com/blog/statistical-fallacies/
Exaggerated Coal-Ash Dangers: Part II
By Paul Driessen, Master Resource, Mar 16, 2017
https://www.masterresource.org/coal-ash-issues/exaggerated-coal-ash-dangers-ii/
How Imminent is the RSS Pause? (Now Includes January and February Data)
Guest Post by Werner Brozek, Extended Comments from Barry and Edited by Just The Facts, WUWT, Mar 14, 2017
Surprising news about trend of America’s temperature and precipitation
By Larry Kummer. Posted at the Fabius Maximus website., WUWT, Mar 15, 2017
Undue influence
By Martin Livermore, The Scientific Alliance, Mar 17, 2017
http://scientific-alliance.org/node/1041
After Paris!
China Claims Coal Cutback Despite Doubts
By Michael Lelyveld, Radio Free Asia, Feb 13, 2017 [H/t GWPF]
Change in US Administrations
Overnight Energy: Trump’s budget aims for a 31 percent cut for EPA
By Timothy Cama and Devin Henry, The Hill, Mar 16, 2017
Link to “skinny” budget
http://www.wsj.com/public/resources/documents/2018_WhiteHousebudgetblueprint.pdf
Trump proposes deep cuts to EPA, federal climate funding
By Devin Henry, The Hill, Mar 16, 2017
Trump budget: US to stop funding UN climate process
“America First” budget would axe 20% of the UN’s climate body’s funding and $2bn to help developing countries deal with global warming
By Karl Mathiesen, Climate Home, Mar 16, 2017 [H/t GWPF]
http://www.climatechangenews.com/2017/03/16/trump-budget-us-stop-funding-un-climate-process/
White House: Climate funding is ‘a waste of your money’
By Devin Henry, The Hill, Mar 16, 2017
Review of Recent Scientific Articles by CO2 Science
Terrestrial Carbon Uptake Slows Growth Rate of Atmospheric CO2
Keenan, T.F., Prentice, C., Canadell, J.G., Williams, C.A., Wang, H., Raupach, M. and Collatz, G.J. 2016. Recent pause in the growth rate of atmospheric CO2 due to enhanced terrestrial carbon uptake. Nature Communications DOI: 10.1038/ncomms13428. Mar 16, 2017
http://www.co2science.org/articles/V20/mar/a11.php
Warmer Winters Reduce Mortality in Europe
Ballester, J., Rodó, X., Robine, J.-M. and Herrmann, F.R. 2016. European seasonal mortality and influenza incidence due to winter temperature variability. Nature Climate Change 6: 927-931. Mar 15, 2017
http://www.co2science.org/articles/V20/mar/a10.php
Some Corals Are Insensitive to Ocean Acidification and Warming
Lenz, E.A. and Edmunds, P.J. 2017. Branches and plates of the morphologically plastic coral Porites rus are insensitive to ocean acidification and warming. Journal of Experimental Marine Biology and Ecology 486: 188-194. Mar 14, 2017
http://www.co2science.org/articles/V20/mar/a9.php
Models v. Observations
How The Recent El Nino Saved Climate Models
By David Whitehouse, GWPF, Mar 13, 2017
http://www.thegwpf.com/how-the-recent-el-nino-saved-climate-models/
Measurement Issues — Atmosphere
Global Satellites: 2016 not Statistically Warmer than 1998
By Roy Spencer, His Blog, Jan 3, 2017
http://www.drroyspencer.com/2017/01/global-satellites-2016-not-statistically-warmer-than-1998/
Mauna Loa Observatory
Earth System Research Laboratory, NOAA, Updated Jan 20, 2017
Changing Weather
NASA: Could Leftover Heat from Last El Niño Fuel a New One?
By Staff Writers, Sierra Sun Times, Mar 14, 2017 [H/t GWPF]
“Whether or not El Niño returns will be determined by a number of factors, one of which is the larger stage on which El Niño and La Niña play, the Pacific Decadal Oscillation (PDO). The PDO is a large-scale, long-term pattern of ocean temperature and other changes in the Pacific Ocean. It alternates between two phases, warm (called positive) and cool (negative), at irregular intervals of 5 to 20 years.”
The Nor’Easter of March 14: What are its Lessons for the Weather Community?
By Cliff Mass, Weather Blog, Mar 16, 2017
http://cliffmass.blogspot.com/2017/03/the-noreaster-of-march-14-what-are-its.html
Changing Climate
Study: Ice age thermostat prevented extreme climate cooling
By Anthony Watts, WUWT, Mar 14, 2017
https://wattsupwiththat.com/2017/03/14/study-ice-age-thermostat-prevented-extreme-climate-cooling/
Link to paper: A lower limit to atmospheric CO2 concentrations over the past 800,000 years
By E. D. Galbraith & S. Eggleston, Nature Geoscience, Mar 17, 2017
http://www.nature.com/ngeo/journal/vaop/ncurrent/full/ngeo2914.html
[SEPP Comment: Does nature employ a thermostat?]
Changing Cryosphere – Land / Sea Ice
[Up to 60% of September] HALF of Arctic ice loss is driven by natural swings and not global warming, controversial study claims
By Colin Fernandez, Daily Mail, Mar 14, 2017 [H/t GWPF]
Link to paper: Influence of high-latitude atmospheric circulation changes on summertime Arctic sea ice
By Qinghua Ding, et al., Nature Climate Change, Mar 13, 2017
http://www.nature.com/articles/nclimate3241.epdf
Arctic Ice Loss and The AMO
By Paul Homewood, Not a Lot of People Know That, Mar 17, 2017
https://notalotofpeopleknowthat.wordpress.com/2017/03/17/arctic-ice-loss-and-the-amo/#more-26846
Natural Variability’s Role in Arctic Sea Ice Decline Strengthens Case for Lukewarming
By Patrick J. Michaels and Paul C. “Chip” Knappenberger, CATO, Mar 17, 2017
Questioning European Green
Green taxes on energy bills to rise to £12.6bn by 2020
By Priyanka Shrestha, Energy Live News, Mar 14, 2017 [H/t GWPF]
https://www.energylivenews.com/2017/03/14/green-taxes-on-energy-bills-to-rise-to-12-6bn-by-2020/
GWPF Condemns Misleading Committee on Climate Change Report on Policy Costs
By Staff Writers, GWPF, Mar 16, 2017
http://www.thegwpf.com/gwpf-condemns-misleading-committee-on-climate-change-report-on-policy-costs/
Funding Issues
Mapping Washington’s Lawlessness: An Inventory of “Regulatory Dark Matter”
By Clyde Wayne Crews Jr. CEI, Mar 2017
Climate-Dollar bragging is over: funding goes underground to avoid “climate-axe”.
By Jo Nova, Her Blog, Mar 17, 2017
Hundreds of millions of British aid ‘wasted’ on overseas climate change projects
By Robert Mendick,, Telegraph, UK, Mar 12, 2017
To Protect Climate Money, Obama Stashed It Where It’s Hard to Find
By Christopher Flavelle, Bloomberg, Mar 15, 2017
Cap-and-Trade and Carbon Taxes
California’s Cap-And-Trade Train Wreck
By Patrick J. Michaels, Orange County Register, Via CATO, Mar 17, 2017
https://www.cato.org/publications/commentary/californias-cap-trade-train-wreck
Energy Issues – Non-US
Blackout Race Underway
By Donn Dears, Power For USA, Mar 14, 2017
https://dddusmma.wordpress.com/2017/03/14/blackout-race-underway/
[SEPP Comment: Which government will win the dubious honor of implementing policies that foster black-outs: Australia, Germany, or California?]
Battery powered SA, could be 100% renewable for just $60 – $90 billion
By Jo Nova, Her Blog, Mar 14, 2017
Analysis by Paul Miskelly and Tom Quirk
The Dark Secret Behind India’s Solar Plan
By Saket Sundria, Rajesh Kumar Singh, and Anindya Upadhyay, Bloomberg, Mar 15, 2017
[SEPP Comment: Rural electrification is a major undertaking. As the US discovered over decades, it requires a reliable grid.]
Energy Issues — US
Abundant Natural Gas Delivers For US
By Paul Homewood, Not a Lot of People Know That, Mar 16, 2017
https://notalotofpeopleknowthat.wordpress.com/2017/03/16/abundant-natural-gas-delivers-for-us/’’
‘Combined Heat and Power’ Distributed Generation: Beware of Government Mandates, Subsidies
By Donn Dears, Master Resource, Mar 13, 2017
https://www.masterresource.org/distributed-generation-2/chp-not-government/
Oil and Natural Gas – the Future or the Past?
Shale 2.0 should see the US reaching a record 10 million bpd around 2018 and then sustaining and going higher to 12 million bpd or more
By Staff Writers, Next Big Future, Mar 11, 2017
http://www.nextbigfuture.com/2017/03/shale-20-should-see-us-reaching-record.html
“America is likely to set a record-breaking 2018, taking out the all-time oil production high set in 1970, according to new forecasts published this week by the U.S. Energy Information Administration.”
Short-Term Energy Outlook
U.S. Liquid Fuels
By Staff Writers, Mar 7, 2017
https://www.eia.gov/outlooks/steo/report/us_oil.cfm
U.S. crude oil production averaged an estimated 8.9 million barrels per day (b/d) in 2016. U.S crude oil production is forecast to average 9.2 million b/d in 2017 and 9.7 million b/d in 2018.
U.S. Field Production of Crude Oil
By Staff Writers, EIA, Mar 9, 2017
https://www.eia.gov/dnav/pet/hist/LeafHandler.ashx?n=PET&s=MCRFPUS2&f=A
Nuclear Energy and Fears
NuScale’s Small Modular Nuclear Reactor Keeps Moving Forward
By James Conca, Forbes, Mar 16, 2016
“This nuclear reactor is something that we’ve never seen before – a small modular reactor that is economic, factory built and shippable, flexible enough to desalinate seawater, refine oil, load-follow wind, produce hydrogen, modular to make the power plant any size, and that provides something we’ve all been waiting for – a reactor that cannot meltdown.”
[SEPP Comment: Are the reactors on navy ships subject to meltdown?]
GOP senator slams Trump’s Yucca Mountain proposal
By Timothy Cama, The Hill, Mar 16, 2017
http://thehill.com/policy/energy-environment/324303-gop-senator-slams-trumps-yucca-mountain-proposal
[SEPP Comment: The Federal government reneged on a promise to utilities to provide long-term storage for nuclear wastes, but continued to collect money for that storage. Is the Federal government accountable?]
California Dreaming
Will the Oroville Dam survive the ARkStorm?
By David Hagen, Climate Etc. Mar 17, 2017
https://judithcurry.com/2017/03/17/will-the-oroville-dam-survive-the-arkstorm/#more-22900
[SEPP Comment: Lengthy post on California’s complex system of water transfer. Can the dams withstand the floods caused by atmospheric rivers which may have caused the floods of 1862 and 1605?]
###################################################
BELOW THE BOTTOM LINE:
Heat turned up!
By Staff Writers, Climate Change Predictions.org, Mar 17, 2017
http://climatechangepredictions.org/uncategorized/7904
“The number of elderly Melburnians dying due to extreme heat is expected to rise dramatically as climate change takes hold this century, research suggests.
“Nicole Joffe from consultants Net Balance found the number of days with an average temperature above 30 degrees would double by mid-century – from two to at least four a year – even if governments acted to cut greenhouse emissions. Failure to tackle climate change would trigger a steeper rise.” Sydney Morning Herald, 26 Mar 2007 [Boldface added]
###################################################
ARTICLES:
1. E.ON Posts Biggest-Ever Loss
Uniper spinoff and funding of nuclear-waste storage left deep scars on the company’s balance sheet
By Zeke Turner, WSJ, Mar 15, 2017
https://www.wsj.com/articles/e-on-posts-biggest-ever-loss-1489566692
SUMMARY: Once E.ON was Europe’s largest stockholder electricity company. It bet poorly that with 10% market generation, wind power would become reliable.
The reports states: “German energy giant E.ON SE reported Wednesday the biggest loss in its history, reflecting the scars of the country’s clean-energy revolution and nuclear phaseout.
“E.ON said its net loss deepened 21% in 2016 to €8.45 billion ($8.96 billion), or €4.33 a share, from a loss of €6.99 billion, or €3.60 a share, in 2015. Sales fell 11% to €38.17 billion from €42.65 billion.
“The company incurred restructuring costs last year when it spun off its conventional coal and gas power plants into Uniper SE, seeking to recast itself as a company refocused on forward-looking technologies such as wind, solar and grid infrastructure.
“But it hasn’t been able to shed liabilities from the past—chief among them, the massive risk surcharge connected to finding and building a safe space underground to bury spent uranium fuel rods from its nuclear power plants.”
Subsequently, the report states:
“Earnings across Germany’s energy industry have also suffered from the country’s low electricity wholesale prices, which in the course of 2016 dipped below half of what they were in 2011, around €50 per megawatt hour. After the nuclear disaster at Japan’s Fukushima power plant that year, Germany moved quickly to boost the capacity of the country’s solar and wind power-generating capacity, leading to an oversupply that has wreaked havoc on wholesale prices.
“The country has also pivoted to a leaner subsidies model that will force wind-heavy companies such as E.ON to compete over prices at auction instead of relying on a fixed system.”
***************
2. Trump Heads to Detroit as EPA Reviews Fuel-Economy Targets
Auto makers contend Obama administration targets will be difficult to meet
By Mike Spector, WSJ, Mar 14, 2017
“Donald Trump is waging a war on the environment,” said Sen. Edward Markey (D., Mass.) during a recent conference call. “Undoing the fuel-efficiency standards would harm consumers, harm our energy security and increase global warming pollution.” [Boldface added]
SUMMARY: The report states: “President Donald Trump rattled car executives for months by threatening a stiff border tax on Mexican imports and questioning their commitment to U.S. jobs.
“Now, he’s granting them a much desired reprieve—on fuel-economy regulations.
Mr. Trump heads to Detroit Wednesday, a trip coinciding with the expected reversal of an 11th-hour Obama administration decision to lock in tougher targets for tailpipe emissions.
“The Environmental Protection Agency, after weeks of industry lobbying, plans to reopen a review of the regulations. The standards call for companies to sell vehicles averaging 54.5 miles a gallon, or roughly 40 mpg in real-world driving, by 2025. They would remain in place while under review.
“Auto makers contend the targets, which start toughening in 2022, will be difficult to meet with low gasoline prices steering consumers to higher-emitting and fuel-thirsty pickup trucks and sport-utility vehicles. The EPA found auto makers are capable of meeting the standards without relying too much on electric-car technologies, and that the rules would cut oil consumption and greenhouse-gas emissions, while saving consumers $92 billion at the fuel pump.”
[SEPP Comment: Many of EPA “savings” are imaginary.]
“For car makers, reconsidering the review of emissions and fuel-economy standards opens the door to potentially rolling back costly environmental regulations after several companies were targeted in the last few months by Twitter missives from the president over their investments outside the U.S.
“Auto makers have spotlighted U.S. commitments, and in some cases changed foreign-investment plans. Mr. Trump in turn touted their moves, even some that had been long-planned and weren’t necessarily responses to his criticisms.
At the same time, auto makers pushed to undo the EPA’s final determination, made a week before Mr. Trump was inaugurated, that locked in future emissions targets.
“The process hadn’t been expected to be completed until April 2018. The agency regulates tailpipe emissions and often expresses future targets in terms of fuel economy.”
With the Heartland Conference (ICCC-12) this week, there will be no TWTW next week. Due to other commitments requiring refraining from public comments that may be misconstrued as suggesting policy, this TWTW will be short and comments restrained. Responses to correspondence will be limited. Thank you.
*************
I quote F.K. Richtmyer , 1928 , in one of my Heartland talk slides makes the same point as Kelvin :
http://cosy.com/Science/AWGpptQuantRules.jpg
I would add Lavoisier’s demand for a complete audit .
From my perspective climate science at least post Jame Hansen and AlGoreWarming gets an F in physics despite all their cloud computing .
Climate funding metastasized throughout the federal budget. There are many Republican officeholders who simply take the money not giving a whit about climate. Money for dikes is money for dikes. Not hard to see that the biggest battles over climate spending will occur inside the GOP. Old bulls don’t like people messing with their trough.
Raw temperature data is not subject to compounding. And the rule of significant digits can be mitigated by averaging a large number of measurements, which is what is done in with temperature. That’s why the same article correctly states that the 2016 temperature had to be only 0.10 degree warmer (and not 2 degrees) in order to achieve 95% confidence. Still, point taken that 0.02 is not statistically significant.
Wouldn’t the large number of measurements have to be in the exact same place? I can see that if you took the temperature of the center of a room with one thermometer accurate to +/- 1C, and then took the temperature of the center of the same room with ten thermometers, just as accurate, you might be able to average the errors to get a more precise figure.
However, I fail to see how one could take a thousand measurements from thermometers scattered across the country and perform the same legerdemain to achieve a similarly precise measurement for an entire country. It seems to me you’d need a thousand thermometers at each location to get such precision.
Where is the evidence to support these feats of statistics, anyway? How were they derived? Did some researcher use a thermometer accurate to 0.001 C to take a measurement (with an error of +/- 0.0005 C) and then duplicate those results by averaging a suitable number of thermometers accurate to the +/- 1C?
You are exactly correct. Nick Stokes and any number of others, Zeke Hausfather among them, make the same error. The multiple measurement methodology assumes static temporal and spatial conditions. You can’t measure the temperature of the same parcel of air over a hundred years because that parcel at time t=0 is not the same parcel at time t=n.
Number of the Week: 7,500,000 tonnes of lead acid batteries (8,250,000 tons).
In my book a Tonne = 1000 Kgs
which would make 7,500,000 tonnes = 7,381,549 tons
YMMV…….
Number of the Week: 7,500,000 tonnes of lead acid batteries (8,250,000 tons).
In my book a Tonne = 1000 Kgs
which would make 7,500,000 tonnes = 7,381,549 tons
YMMV…….
Who uses lead acid any more… go see that nice Mr Musk and he’ll do you a deal on Lithium Ion, I’m sure
“Who uses lead acid any more”
Just about every car, truck, bus, motorcycle, stationary generating plant and backup power supply manufacturer on the planet.
And not a single penny of taxpayer-funded subsidy amongst them.
Moron.
I think you applied your factor in the wrong direction. 7,500,000 tonnes x 1000 kgs/tonne x 2.2 lbs/kg = 16,500,000,000 lbs. Divide that by 2000 lbs/ton and you get 8,250,000 tons.
For example, as discussed in the January 21 TWTW, the widely used Automatic Surface Observing System (ASOS) instruments at airports have a precision of plus or minus 1 degree C (1.8 F, correctly, 2 F). Surface datasets using these measurements cannot be more precise than these instruments. Yet, routinely, some government agencies report data, after mathematical manipulation, with far greater precision – to one-hundredths of a degree C. Such precision is false.
Nonsense. The mean of a thousand measurements each with +/- 1 degree precision, is much smaller than 1 degree.
The precision associated with the mean, that is (<<1 deg)
I just don’t see how that works. If you take 1000 measurements with an instrument accurate to +/- 1 unit, the most accurate measurement you can take has an error of +/- 1 unit. One could average those measurements to see how the range of error falls so that you would get a more precise measurement, but I don’t see how one can get a more accurate one.
The way I see it is that one could take one measurement and get a value of 28 C +/- 1 C. Then one might take ten measurements at the exact same location and get 28, 28, 29, 29, 29, 29, 29, 30, 30, and 30 C. You’d be justified in saying that 29 C was a more precise measurement, but you wouldn’t be justified in adding those ten measurements, dividing by ten, and then claiming you instrument was accurate to 0.1 C. The error would still be +/- 1C.
It would be difficult to see how you could be more wrong. If you take those measurements all at the same time in the same space, yes, you can reduce the error by SQRT(N). You cannot do this for quantities not fixed in space and time. Find a big box store and go to the thermometer display. Read and record all the thermometers on display and you can compute the standard error using SQRT(N) for that measurement only. Someone could change the thermostat for the store tomorrow. Running the same experiment tomorrow would get you the standard error for tomorrow. Adding them all together and saying the average store temperature is “(today + tomorrow)/2” and reducing the standard error by SQRT(2N) would be incorrect.
“Nonsense. The mean of a thousand measurements each with +/- 1 degree precision, is much smaller than 1 degree.” Correct if we can be sure that measurements go over and under the “actual” in a random manner rather than all (or most) being skewed one way or the other.
I don’t recall that method ever being taught in my physics classes at university. As I recall, if one took a series of measurements with a device accurate to +/- x units, then any addition, subtraction, multiplication, or division using measurements from that device kept that same error. If one was multiplying those measurements — for example, by measuring the sides of a cube and then calculating its volume — then one had to add the error. If one measured a side to be 10 cm +/- 0.5 cm, then the volume calculation became 1000 cm**3 +/- 1.5 cm**3.
I’ve done a bit of research tonight on error analysis, and this page from Penn seems to be very applicable: http://virgo-physics.sas.upenn.edu/uglabs/lab_manual/Error_Analysis.pdf
Essentially, it states the obvious: that the mean of a very large number of measurements is the same as for a small data set. If one takes 1000 measurements with a thermometer having an accuracy of +/- 1 C, then the mean is merely the sum of the measurements divided by 1000, with the uncertainty of an individual measurement being the range divided by 2. However, the error propagation is described as the square root of the sum of the squares of the uncertainty. In Penn’s example, they measured the four sides of a fenced area, with an uncertainty of 0.07cm. The propagation of the uncertainty is described by taking the square root of the sum of 0.07**2 + 0.07**2 + 0.07**2 + 0.07**2 = sqrt(0.0196 cm) = +/- 0.14 cm, which becomes +/- 0.1 cm because of the accuracy of the measuring tape. Applying the same logic to our 1000 widespread measurements with a 1 C uncertainty means that the propagated uncertainty is the square root of 1000(1 C**2) = the square root of 1000 C, which is 31.6 C. Obviously one is not going to get a range that narrow taking simultaneous temps at 1000 different locations in the US, so that value would be useless in trying to determine a mean temperature for the country.
It seems as though the statistical adjustments for a large number of measurements are just plain wrong as applied: if one takes 1000 measurements all over the country, one is essentially “measuring the different sides of the fence,” and the error propagates as the square root of the sum of the square of each measurement’s uncertainty. However, if one takes 1000 measurements in the exact same place with a +/- 1C thermometer, and if the range of measurements is only 1 C, one would get the uncertainty in the mean down to 0.00003 C. Even so, that tiny uncertainty in the mean is still applied only to the mean itself, and is not an increased accuracy of the mean. Therefore, the mean of the 1000 measurements at +/- 1 C might be calculated to be 28.4C +/- 0.00003 C. One isn’t getting the accuracy of the mean increased, but only the precision of the mean. There’s no way to take a +/- 1 C measuring device and make it accurate to hundredths of a degree; you can reduce the uncertainty of the mean to very small numbers, but not the accuracy of the measurement itself.
This is not true. Multiple measurements still have the mean calculated to the significant digits of the instrument. If the thermometer is +/- 1C, then the mean of 1000 measurements at the same time and place still has an uncertainty of +/- 1C. What the multiple measurements do is reduce the uncertainty in the mean to a very small amount, so that the mean might be calculated as 25 C +/- 0.001 C. You can’t claim to have generated a more accurate mean of 25.001 C, but you can state that the mean of 25 C is within 0.001 C of the true value.
Lots of interesting information in this article. New questions (at least to me) have been raised about the GCM’s.
For stationary applications weight doesn’t matter. The cheaper the better. Li-ion is complete overkill for stationary applications. Do some engineering.
Ignoring the insanity of trying to do this in the first place, cheaper may or may not be better. Battery life is sensitive to a number of factors, one of them being discharge rate. In fire alarm system, they use valve regulated lead/acid batteries. For best life, the discharge rate should not exceed C/10 or C/20, where C is the battery capacity in watt-hrs. It is also important to consider the level of discharge. Draw a battery down repeatedly to 75% and it will last longer than if you draw it down repeatedly to 50%. The deeper you draw down, the lower the battery voltage goes, affecting the instantaneous power delivery rate. Different chemistries will allow different draw-downs and voltage roll-off curves. You probably want to construct an algorithm that maximizes the total number of watt-hours that can be usefully extracted from a battery before replacement while minimizing the capital investment.
Stated above
One could specify the relationship better. If the relationship between CO2 levels and temperature is through a doubling of CO2, then the same percentage rate of CO2 rise would have a constant impact on warming. From the Mauna Loa data, the rate of CO2 rise has been increasing. In particular (i) the rate of temperature rise from CO2 should have been about twice the level in the 1960s, and (ii) around the turn of the century the rate of CO2 rise accelerated.
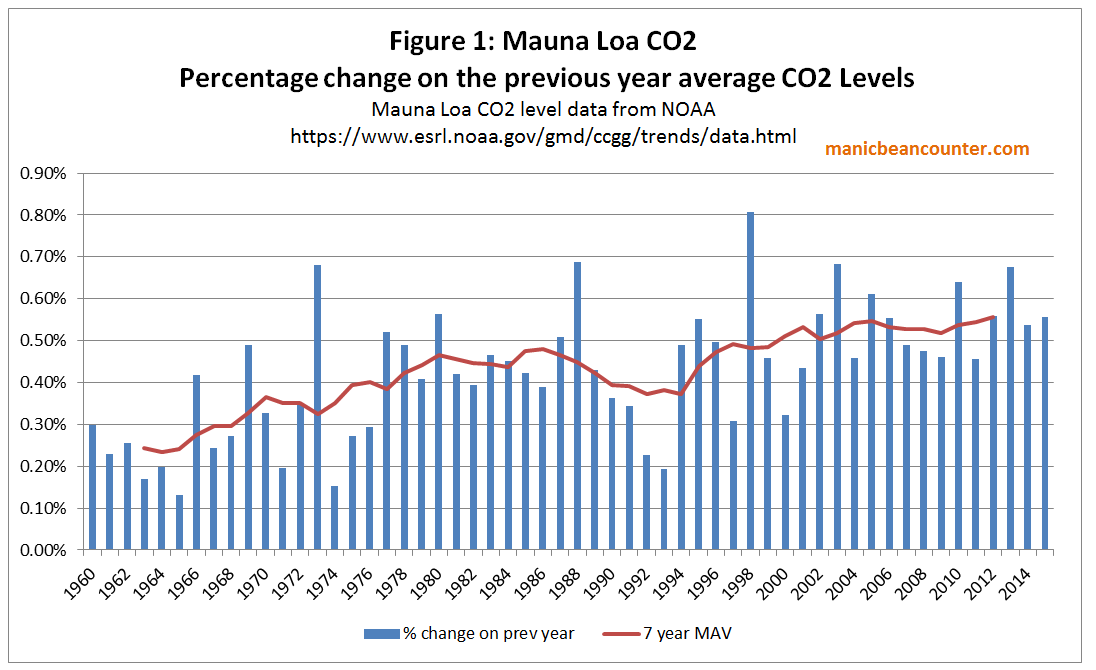
The rate of actual temperature rise slowed dramatically or stopped altogether depending on the temperature data set used. Thus the data does not support CO2 being a dominant factor in warming, even allowing for lagged impacts. It is only by adding in ad hoc, non-scientific factors, like natural variations that the data can be brought into line with theory.
NB. The centered MAV gives a false impression of when the the acceleration in rate of CO2 rise occurred.
A few rhetorical questions: So, is that the number of batteries needed for an average wind “outage?”. A once five year outage? Or a once in a century absence of wind? So, that’s a one-time expense, then?
Delusional.
Ken Haapas:
You wrote (1) What issues will happen following the recent El Nino, and (2) are the frequency and severity of El Ninos indicative of a CO2-induced warming?
No, El Ninos are not indicative of CO2-induced warming.
The timings of ALL El Ninos over the past 160 years perfectly match the dates of business recessions, where the cleaner air due to fewer SO2 aerosol emissions (because of reduced industrial activity) allows greater surface warming, leading to increased ENSO temperatures and El Nino formation.
However, since the 1970’s there have also been El Ninos that are not associated with a business recession. They are, unfortunately, caused by SO2 aerosol reductions due to Clean Air efforts..
Any cooling from an El Nino event can only come from a La Nina, an increase in SO2 aerosol emissions, or volcanic activity (apart from possible changes in solar irradiance)..
See my preprint at OSF.io)
.