Over the weekend, we reviewed the state of the solar data for March 2017. Now, there’s a two week straight lack of sunspots, the longest stretch since 2010.

Overview
The sun is currently blank with no visible sunspots and this is the 14th straight day with a blank look which is the longest such stretch since April 2010 according to spaceweather.com. Historically weak solar cycle 24 continues to transition away from its solar maximum phase and towards the next solar minimum. In April 2010 – the last time there was a two week stretch with no visible sunspots – the sun was emerging from the last solar minimum which was historically long and deep. There have already been 26 spotless days in 2017 (34% of the entire year) and this follows 32 spotless days last year which occurred primarily during the latter part of the year. The blank look to the sun will increase in frequency over the next couple of years leading up to the next solar minimum – probably to be reached in late 2019 or 2020. By one measure, the current solar cycle is the third weakest since record keeping began in 1755 and it continues a weakening trend since solar cycle 21 peaked in 1980. One of the impacts of low solar activity is the increase of cosmic rays that can penetrate into the Earth’s upper atmosphere and this has some important consequences.

Comparison of all solar cycles since 1755 in terms of accumulated sunspot number anomalies from the mean value at this stage of the solar cycle. Plot courtesy publication cited below, authors Frank Bosse and Fritz Vahrenholt
Third weakest solar cycle since 1755
A recent publication has analyzed the current solar cycle and has found that when sunspot anomalies are compared to the mean for the number of months after cycle start, there have been only two weaker cycles since observations began in 1755. Solar cycle 24 began in 2008 after a historically long and deep solar minimum which puts us more than eight years into the current cycle. The plot (above) shows accumulated sunspot anomalies from the mean value after cycle start (97 months ago) and only solar cycles 5 and 6 had lower levels going all the way back to 1755. The mean value is noted at zero and solar cycle 24 is running 3817 spots less than the mean. The seven cycles preceded by solar cycle 24 had more sunspots than the mean.

Daily observations of the number of sunspots since 1 January 1900 according to Solar Influences Data Analysis Center (SIDC). The thin blue line indicates the daily sunspot number, while the dark blue line indicates the running annual average. Last day shown: 28 February 2017. (Graph courtesy climate4you.com)
Read more at Paul Dorian’s Vencore Weather
No wonder it’s so cold here in the Pacific NW!
Based upon the weather is climate “reasoning” of consensus “climate science”.
“No wonder it’s so cold here in the Pacific NW!”
Yeah: a few years back trees were already blooming at the end of February. 2/3 of March is gone, and no blooms yet on the trees under my balcony.
Grew up there. Auburn Washington is were I’m from. The Pacific Northwest is heaven on Earth.
Oh, please, I remember winter weather in June as far back as 2005 in the NW (Washington/Idaho)
That matches the UK really well. A few years ago the Magnolia trees had started to bloom in the cutover week for Feb/March and they are only just beginning to flower now.
Peaches blooming here is SC! Some damaged in last weeks cold snap though.
Lack of sun spots has reduced propagation of radio waves.
Amateur radio operators are having a hard time of it.
World wide communications depend on skipping off the ionosphere several times to get half way around.
In the good times you could her yours self as the signal bounced all the way around.
In the SH leaves started to fall from the trees by the end of February 2017. Autumn temperatures started even in the beginning of March.
Andrew March 20, 2017 at 5:13 pm
It’s a lot less paradisaical now than in the mid-20th century, or at least from the time the Willamette was cleaned up enough for swimming.
Hordes of refugees from California and New York have ruined the PNW. They don’t get that they’re turning the region into the hell holes from which they so wanted to escape.
Hawthorne and Cherry are blooming….
… not Cherry, Plum.
Not where I live, but that’s in the interior, aka the “Inter-Mountain West”. We’ll be lucky if anything blossoms. However the crocuses have at long last appeared, along with the box elder beetles, so there is hope, which springs eternal.
OK, there are two flowers — one yellow, one red — which are out on the ground. The trees I’m talking of are gnarled ones, with moss & lichen on them. The buds are out, but no blooms.
However it is, my entirely non-scientific perception is that the last two winters were kinda cold around here.
I predict Winters will be kinda cold, forever.
Summers, not as cold. Forever.
I like Florida…really nice from October to May, with some chilly days and a few downright nippy nights.
And then hot as hell and brain meltingly humid from June through September, although it is pleasant during and after the near daily rains.
That is not going to change either.
Pick your spot.
To many stay where they are out of inertia.
People can get used to anything…and if you can get used to freezing your nuts off for six months, you can darn sure get used to laying in the sun next to your pool all Winter instead.
“The Leaves turned early in that year…”
https://youtu.be/0rIIIwvJyZA?t=8m27s
Another chance to get into the possible effects of sunspots on terrestrial weather. I used to think there was a connection, but the evidence is very unclear.
The Stanford Linear Accelerator Web Site used to have pages, with graphics, on how the connection works, but the powers that be forced SLAC to take it down some years ago. I wish I had saved at least the imagery.
Have you looked for it on the Wayback Machine at Internet Archive? I don’t know what timeframe you last saw it on or I’d check it myself. It’s at https://archive.org/web/
I have, thanks.
It’s thoroughly disappeared. SOP for the Carbonista Mafia.
This is similar to one of the SLAC Web site images, showing the muon cascade in secondary cosmic rays, leading to cloud condensation nuclei, but in a different context:
http://physicsopenlab.org/wp-content/uploads/2016/01/muoncascade.jpg
I suppose that Usoskin and Svensmark’s papers show similar graphics.
instead of supposing, go check it out. In any case Svensmark doesn’t matter as his hypothesis has failed.
Not sure why Isvalgaard feels that Svensmark’s work on Aerosol Nucleation is weak. I recall that they have several lab studies showing nucleation at 4-10nm and at >50nm.
That may be, but what is lacking is if that has any measurable effect on the climate.
See e.g.
http://www.leif.org/EOS/swsc120049-GCR-Climate.pdf
“it is clear that there is no robust evidence of a widespread link between the cosmic ray flux and clouds.”
Dr. S at 1:07,
Actually Svensmark’s hypothesis has been repeatedly confirmed:
https://wattsupwiththat.com/2013/09/04/svensmarks-cosmic-ray-theory-of-clouds-and-global-warming-looks-to-be-confirmed/
Actually Svensmark’s hypothesis has been repeatedly confirmed
No, what has been confirmed is that he can make aerosols in the laboratory:
“In experiments where ultraviolet light produces aerosols from trace amounts of ozone, sulfur dioxide,and water vapor, the relative increase in aerosols produced by ionization by gamma sources is constant from nucleation to diameters larger than 50 nm, appropriate for cloud condensation nuclei. ”
Not that that has any influence on the climate. In fact, when we put the hypothesis to the test and look for the effect on climate, there is none [as I have shown].
Dr. S,
The CACA hypothesis relies on lab measurements of the effect of CO2 on hypothetical warming, which has never been demonstrated in the climate system. So I don’t see how lab experiments of GCR effects in the lab can be ruled out for the climate system.
That you cannot see something does not mean that it can’t happen 🙂
More seriously: if the cosmic ray flux would have a strong influence [and if it is not strong, then we can ignore it, as it will be in the noise] then the temperature should show a clear solar cycle variation [as the cosmic ray flux does] as it did for the first cycle Svensmark had data for. Unfortunately, as time went on and we got data for three more cycles, the correlation broke down and the expected signal did not materialize. This is the usual fate of spurious correlations: when more data becomes available, the correlation disappears.
Dr. S, could the correlation of higher CGR flux to cooler temperatures be missing in the historical record? How accurate were cloud observations in the past when it came to types and altitudes of clouds? Was the range of cloud nucleation effects as well known during the Dalton minimum?
We don’t have any good cloud data before the satellite era.
But this cuts both ways. There is thus no direct evidence for such a connection before the satellite era. And the latest data shows that there is no correlation. So, it is hard to be enthusiastic about the Svensmark hypothesis when the evidence is against it.
Now, true zealots don’t need evidence so they can carry on regardless.
“The CACA hypothesis relies on lab measurements of the effect of CO2 on hypothetical warming, which has never been demonstrated in the climate system. So I don’t see how lab experiments of GCR effects in the lab can be ruled out for the climate system.”
In 1896 and again in 1938 the hypothesis was laid out that if C02 increased the temperature would in general go up. It has.
This evidence CONFIRMS the hypothesis. Now, you could argue that it MIGHT be something else, like unicorns causing the rise in temperature, but the evidence supports the hypothesis it does not contradict the hypothesis.
On the other hand GCR IN THE FIELD have yet to be connected with any rise or fall in temperature.
Why?
Its simple, left to its own devices the earth creates enough CCN to initiate the production of clouds.
So yes in the lab GCR can initiate a chain of reactions that could produce CCN, but in the field the added CCN are not sufficient to drive any observable change in coulds or temperatue.
FURTHER there is no secular TREND in SSN and so no trend in GCR and hence they cannot explain the trend we see in temperature.
lsvalgaard march 20 5:28pm
“if the cosmic ray flux would have a strong influence… …then the temperature should show a clear solar cycle variation”
Dr Roy W Spencer june 4, 2010
“I detrended both time series first since it is the 11 year cycle which should be a robust solar signature …any long term temperature trends in the data could potentially be due to many things, and so it should not be included in such an analysis.
I have done a 3-year smoothing of the temperature data to help smooth out El Nino and La Nina related variations, which usually occur in adjacent years. I also took out the post-Pinatubo cooling years…”
http://www.drroyspencer.com/wp-content/uploads/TSI-est-of-climate-sensitivity2.gif
It is well-known that the variation of TSI over the solar cycle will generate a temperature variation of the order of 0.1 degree, so Spencer’s result is in the right ballpark.
Steven Mosher March 20, 2017 at 6:40 pm
You keep forgetting that the climate cooled all during the postwar interval of rising CO2, from 1945 to 1977. Then it accidentally warmed up for about 20 years, as CO2 continued to rise. Then, since the 1990s, GASTA has at best stayed flat.
Thus there is no correlation between rising CO2 and global warming. Callendar himself recognized this in the bitterly cold 1960s, considering his 1938 hypothesis falsified.
Also bear in mind that both Arrhenius and Callendar thought AGW would be a good thing, if it happened, which if hasn’t.
Clearly, natural fluctuations cancel out AGW or it doesn’t happen at all in the complex climate system, due to negative feedbacks.
S. M.,
I should have said rising man-made CO2 postwar, to be more precise.
missed th echance for a Pun there
“I used to think there was a connection, but the evidence is cloudy”
Spotty . . the evidence is spotty ; )
Well, it appears that the evidence is not clouded enough to matter. Weather that makes it clear has yet to be seen.
The haze just leaves me in a daze.
https://wattsupwiththat.com/2013/11/06/cosmic-rays-and-climate-to-be-or-not-to-be/
Also CERN, although censored.
+Tom Halla – There are some solar physicists that say the cosmic ray cloud theory doesn’t work, because it should give an 11yr cloud-temp cycle but fails to.
I don’t think that that is any kind of refutation, given Svensmark didn’t point to any cycle – he just looked for cloud nucleation from cosmic rays. Other people have taken this and worked it up into a great big theory of global temperatures, but that wasn’t Svensmark’s theory.
that wasn’t Svensmark’s theory.
Have you read his papers? Apparently not.
Here is one of his Figures:
http://www.leif.org/research/Svensmark-Low-Clouds-GCRs.png
He points out that [based on that limited data] there is a good correlation between the amount of low clouds and the variation of cosmic rays during the solar cycle.
Has anybody ever produced an accurate assessment of cloudiness, let alone any subtile variation therein? I think not. In the absence of such accurate data no-one can claim that the “cloud theory doesn’t work”.
And no-one can claim that it does work.
But, yes, there are lots of data about clouds:
Google is your friend: try ‘cloud cover data’
Just to be clear, ’11yr cloud-temp cycle’ meaning in line with solar cycles, which are roughly 11yr. I didn’t mention Svensmark. Also the 22yr Hale cycle seems to correlate better with observed temperatures. Solar particles are about 300x cosmic rays.
“Has anybody ever produced an accurate assessment of cloudiness, let alone any subtile variation therein? I think not. In the absence of such accurate data no-one can claim that the “cloud theory doesn’t work”.
You forget how science works.
The hypothesis is that if GCR increase, low clouds will increase.
A while back I downloaded the AIRS cloud cover data. Years. at least 12 diferent pressure levels.
I then look for a increase or descrese in clouds that might be associated with GCR flux.
I looked high and low
East and west
North and south.
Hypothesis Busted.
One problem is this.
If it is Already very cloudy, then additional CCN can do nothing. its hard to get more than 100% cloudy
Second
If there is not enough water vapor in the air, no amount of addition CCN will help ( see cloud seeding)
So the labratory effect may be real but in the field there are so many other confounding variables that
it is hard to see any signal.
The only HINT of evidence I’ve seen in during certain rare events ( Forbush).
But clearly these transients cannot be the cause of a centuries long increase in temperature, at best they might explain a few wiggles on top of wiggles.. not the seculr trend we see
whatever creates the decline in sunspots is the cause of warmer weather,whatever creates the increase in sunspots causes colder weather 😉
OMG…man-made climate change is affecting sunspots now!!!! /sarc
Never mind that! It’s affecting computer data archives!
It’s also affecting the polar ice caps ON MARS !
Mike, could you give a link to that info please?
Clearly, an absence of sunspots is proof-positive of man-made climate change.
The paucity of Sunspots is caused by
Anthropogenic CO2 .
Be sure to wipe your shoes when you go inside, so you do not leave any Carbon Footprints.
/sarc
How were they taking and recording these observations in 1755? Thank God for human curiosity and imagination that we had solar nerds back then.
Watching sunspots then was very fashionable. There were even dedicated observers during the Maunder Minimum. Leif has lots to chime in with, but read these:
http://www.leif.org/EOS/0702-0702068.pdf
http://www.skyandtelescope.com/astronomy-news/seeing-sunspots-as-the-ancients-did/
(Ancients? Sigh.)
Good reasons.
The old fashioned way, a telescope, protective lenses, paper and pen(cil)
http://galileo.rice.edu/sci/observations/sunspot_drawings.html
http://galileo.rice.edu/images/things/sunspot_drawings/ss623-l.gif
Just to clarify, “Giug. D.” was not me when I was 23. 😎
Thanks for clearing that up.
And they still do it the old fashioned way now:
http://sidc.oma.be/DATA/uset/archdrawings/2017/03/usd201703220820.jpg
And for VERY goog reasons: to maintain a constant calibration [after some minor normalization]. We also use small telescopes as before.
Also, some old instruments are still in use, see https://wattsupwiththat.com/2013/01/04/counting-sunspots-and-sunspot-inflation/
The Farmers almanac uses sun spots for their model to predict weather.
Com’ on! Don’t let obvious facts interfere with your agenda.
http://i142.photobucket.com/albums/r103/HocusLocus_photos/GreatPumpkin.gif
Better with the sound effects – but I vote you today’s winner…
This is so funny! I laughed so hard my wife came into the room to see what she was missing! hehehehe
You must be a newlywed.
Laugh my A** off!!
Where did you find this?
A solar minimum with a Snoopy
sunspot!!
No sunspots? Trumps fault. A special prosecutor is needed.
The Russians did it
Zombie— Obviously, the Russians hacked the sun and will be releasing cooler global temp data for the next 70 years at Wikileaks…..
Grade A snark, loving it.
It’s the Russians, I tells ya!
Hillary Deleted them.
LOL
You mean with, like a rag?
Brilliant! and not so brilliant if you’re wearing sunglasses!
Winner
I am sure that this can all be corrected with a sunspot correction factor to document the warmth relative to other periods.
Lo and Behold — it is “the warmest March on record”
It’s damn cold where I am, so you’re probably right.
It is fairly warm here in Northern California lately, and rainy. That is due to the ssta warming off shore in the Pacific in the last 10 days. There is a medium size blob right off of the coast of California. The winds moving across that have warmed up points inland. As a result I have not had to turn on my heater much at all over the last week. Fruit trees in the area are blooming, which is a bit risky for this area as temps can drop quickly under the right circumstances.
Need to average one direct measurement with the estimated average of all the stars in our vicinity to get a griddable value.
Need to average one direct measurement with the estimated average of all the stars in our vicinity to get a griddable value.
Huh?
Hilarious!
Are you saying that the current sunspot numbers have not been “homogenized with its nearest neighbor”?
That is unclimate-sciencey!!!
China has been observing and recording sun spots for hundreds of years.
China has been observing and recording sunspots for thousands of years. The Chinese assigned the observation of sunspots to the belief that celestial crows were flying across the face of the sun. The number of crows corresponded with good luck and well being, so they kept track. The colors red and black used extensively in Chinese art are also directly attributable to the sun and crows belief, as well as the round windows used in construction.
So where is their data?
No point saying they observed sunspots, if they kept no lasting records.
Why do you assume there are no records?
There are lots, e.g.
http://www.leif.org/EOS/1612-03283-Chinese-Sunspots-581-960.pdf
The round windows are a throwback to the spaceships their ancients landed in.
It is all Bush’s fault. Opps Trump’s fault
14 days of a blank look…I think that is termed a “griff.”
Or a Kardashian.
LOL
or is that 14 days in which the weak sun is still not shown to have produce any drop in global temps?
“The seven cycles preceded by solar cycle 24 had more sunspots than the mean.”
I think you meant to say “The seven cycles preceding solar cycle 24 had more sunspots than the mean”.
Sorry, do not know why that posted there instead of at bottom.
What I was going to say to Mr. Griff is ” Gaia is waiting for a critical mass of warmistas to stick their necks out and say there will be no cooling, and then there will be rapid and unmistakable cooling.”
Just you wait!
Lets drop the talk about ‘cycles’ or we might get Ashley Judd joining the discussion with her Nasty Woman speech…
Griff,
Lag time….
There is a response lag associated with input in natural systems. The lag is not always the same … depends on intensity, volume, length (time), frequency (time break between input), and many other input variables.
Lag time Griff … when you and your friends are sitting around the table and Jordan tells a joke … all your friends begin to laugh … 10 seconds later your confused look turns to a smile. Lag time.
How’s that global warming going up north Griff .
“or is that 14 days in which the weak sun is still not shown to have produce any drop in global temps?”
Moronic even by your Olympic standards.
Real world test of Svensmark et al.
And they fail:
http://www.leif.org/research/GCR-Temps-Discord.png
Except that HadCRU and all its works are anti-science fantasy, not anything even remotely resembling scientific fact, ie observations of reality.
Nonsense.
What is nonsense is HadCRU’s fake temperature series.
Surely you’re aware that Jones lost the alleged “data” upon which the reconstruction is based. Therefore his garbage is meaningless mendacity. As you also know, to be science, results have to be repeatable. HadCRU’s pack of lies can’t be reproduced, since the dog ate their supposed data.
It is close enough to other real] data sets.
Not to mention unwarranted adjustments to data they do still have.
There are no real “data” sets of temperature reconstruction since AD 1850, or whenever. They all have problems at least as bad as the Hadley Center’s.
You should not repeat such nonsense without even caring to check it out. Here is a comparison between the HADSST3 and the UHA Satellite measurements. They match very well:
http://www.leif.org/research/Compare-HADSST3-and-UHA-Temps.png
Leif, you are as usual ignoring the solar wind bursts from coronal holes which have been inhibiting cooling/increase in cloud cover due to high GCR.
Solar wind bursts create a space charge differential in the ionosphere which removes cloud forming ions. As the electroscavenging mechanism removes ions even when GCR is high, electroscavenging can make it appear that GCR does not modulate planetary cloud if the electroscavenging mechanism is not taken into account.
The solar wind burst effect lasts from 2 to 5 days, so a large number of small solar wind bursts has more climatic effect than a single solar wind burst.
The solar wind bursts are primary caused by coronal holes, not by sunspots.
What causes coronal holes to appear on the sun where, when, how many times, the shape of the coronal hole, the area of the coronal hole, and strength of the coronal hole is not known and does not correlate with the number of sun spots or the time in the period of the sunspot.
http://sait.oat.ts.astro.it/MmSAI/76/PDF/969.pdf
See section 5a) Modulation of the global electrical circuit in this review paper, by solar wind bursts and the process electroscavenging.
http://gacc.nifc.gov/sacc/predictive/SOLAR_WEATHER-CLIMATE_STUDIES/GEC-Solar%20Effects%20on%20Global%20Electric%20Circuit%20on%20clouds%20and%20climate%20Tinsley%202007.pdf
http://www.albany.edu/~yfq/papers/TinsleyYuAGU_Monograph.pdf
Leif, you are as usual ignoring the solar wind bursts from coronal holes which have been inhibiting cooling/increase in cloud cover due to high GCR.
Apart from your comment being way off [as usual] there is no relationship between coronal holes, GCRs, and cloud cover.
There are large coronal holes on the declining phase of EVERY solar cycle. This cycle is not special.
lsvalgaard March 20, 2017 at 11:52 am
Satellite observations don’t extend back to AD 1850. HadCRU and its fellow unindicted co-conspirators in NASA, NOAA and Berkeley are constrained by satellite observations in the degree to which they can cook the temperature books, although NOAA recently broke free from that physical constraint in a flight of ideological fantasy. And GISS is cooked more than HadCRU.
Adjustments to pre-satellite “data” are what make it appear that the world has warmed more than it really has.
Even so, “surface data” have diverged markedly from satellite observations, as the corrupt gatekeepers get more desperate to please their political masters. And now RSS may join the Borg, leaving only UAH as a lonely outpost of scientific integrity.
Since 2014, the divergence has gotten even greater than shown here, ending in that year:
http://www.euanmearns.com/wp-content/uploads/2015/09/themvsat3.png
Your comment attacks a straw man. I was referring to observations since 1964 [Nothing about 1850] that show that the temperature has not followed the GCR counts the past 20+ years, thus falsifying the Svensmark Hypothesis. That is all.
Not a straw man.
First, the books have been cooked for 1964-78 as for prior intervals.
Second, as I showed, there is substantial divergence between satellite (and balloon) observations and the cooked book “surface” series, which of course really aren’t surface observations in any case. The land and sea are different for starters, and have gotten more divergent. The satellites, however, consistently observe the atmosphere.
HadCRU, GISS and NOAA are worse than worthless fakeries, useful only for showing that even cooked books still don’t match the GIGO models’ predictions.
The satellites, however, consistently observe the atmosphere.
The satellite data matches HADSST3 for the years of interest. So, your comment is a misrepresentation.
Making the same comparison with UAH would be meaningful. HadCRU and UAH diverge enough that they can’t be considered functionally equivalent.
With UAH, your point might still be valid. My objection was to the use of such thorough-going nonsense as the “surface data” sets.
You are not paying attention. Since HADSST3 and UHA agree, the comparison is automatically also made with UAH:
http://www.leif.org/research/Compare-HADSST3-and-UHA-Temps.png
None of the supposed “surface data” sets are fit for scientific consumption. RSS may be about to join them. There will be no science left in historical temperature series when and if the Carbonari manage to shut down UAH.
Of course they are. I just demonstrated that for you. As usual, one should use caution when interpreting the data. In the particular case under discussion, the First two sunspot cycles showed that GCR and Temperatures tracked each other, but that that has not been the case since. This is seen with both the HADSST3 data and the UAH data, so both are useful and cater for both sides of the debate about global warming [an extra bonus].
I already showed you how much they diverge. Significantly. Maybe you missed that.
Doesn’t matter for my purpose, as the divergence is much smaller than the effect I’m showing. Perhaps you missed that.
Wait. How did Svensmark get extended to climate? Wasnt the hypothesis that solar activity and cloud formation were linked? I thought we could not model the link between cloud cover and (climate) temperature.
How did Svensmark do it, regardless of the solar link stuff pans out.
He didn’t do it. He just did some curve fitting.
The divergence was already 33% in 2014 and has increased since then.
IMO it makes more sense just to use the UAH data for the comparison rather than the corrupt “surface” series.
Doesn’t matter which one is used. Both show that the hypothesis has failed. There is a bonus to using both series, because that also caters for the warmists who believe in the official AGW junk. And Svensmark did not compare with satellite data anyway.
Jean,
No need to model the connection among cosmic rays, clouds and climate. It can be observed, both in the lab and the wild:
https://www.researchgate.net/publication/228457277_Cosmic_rays_and_climate_forcing
The point is that there is no such link.
What Svensmark did or didn’t do doesn’t really signify.
But given the phoniness of “surface data”, why not make your comparison directly with UAH, which after all samples the atmosphere. You may well find that any correlation is insignificant, or no correlation at all. That would make your case stronger.
There is no correlation using either dataset. This is the strongest refutation possible: to show that the failure is not due to cherry picking the data.
As usual, commenter Chimp’s aggressivity perfectly matches his lack of knowledge.
Here is a chart showing, for one of the politically most disputed climate areas (the CONUS), the strong correlation between surface (GHCN unadjusted) and troposphere (UAH’s interpretation):
http://fs5.directupload.net/images/170320/xbeen24x.jpg
And GHCN unadjusted’s temperatures are quite a bit above both GISTEMP’s and NOAA’s homogenizations.
Bindion,
There is no statistically significant correlation globally, which is what matters.
In the CONUS raw data, there has been now warming since the 1930s.
Your lack of knowledge is exceeded only by your cherry picking.
As for aggressivity, please see CACA adherents and consensus “climate scientists” who advocate jailing and killing climate realists.
Leif said:
William,
In reply to Leif’s above quoted comment that coronal holes in earth affecting positions (low latitude as opposed to the polar coronal holes) always appear at the end of a solar cycle which is not correct.
http://onlinelibrary.wiley.com/doi/10.1029/2009JA014342/abstract
In reply to Leif’s above quoted comment that coronal holes in earth affecting positions (low latitude as opposed to the polar coronal holes) always appear at the end of a solar cycle which is not correct.
You should not uncritically believe everything you pick up from the internet. In coronal holes the speed is high and they tend to recur as the sun rotates. So, high speed in the ecliptic and recurrence tendency are signatures of low-latitude coronal holes.
This is well-known. Here is some information about that:
http://www.leif.org/research/Coronal-Holes-Before-Every-Minimum.png
that should make all of this clear.
You don’t know anything about the sun cosmic rays do influence cloud cover it is proven you are spewing out mis information
[and Dr. Svalgaard proves Bryan to be an idiot in 3….2….1 -mod]
He pretty much did that himself…
Chimp on March 20, 2017 at 2:36 pm
There is no statistically significant correlation globally, which is what matters.
I show you the exact contrary using GISTEMP, HadCRUT, JMA and RSS3.3 TLT temperature time series during the satellite era:
http://fs5.directupload.net/images/170321/xu6vnfyj.jpg
but I know in advance that you will find some pseudoargument, e.g. against 36 month running means which tell us much more than the OLS stuff.
Nevertheless some linear trend estimates for 1979-2016, in °C / decade:
– RSS3.3 TLT globe: 0.135
– JMA globe: 0.140
– HadCRUT4.5: 0.172
– GISTEMP: 0.174
If you have some real knowledge about temperature measurements, you will easily understand why Japan’s surface record differs so much from the two others.
But here is a chart showing a zoom in JMA’s 5° grid record near the North Pole you can easily download from Tokio’s Climate Center:
http://fs5.directupload.net/images/170321/d8g3jfsp.jpg
Linear trend estimates for 1954-2016, in °C / decade:
80-85N: 1.082
75-80N: 0.648
70-75N: 0.412
65-70N: 0.407
60-65N: 0.363
Maybe you think a bit when trying to understand the message. But my humble guess is that you will as usual prefer to bark a it like a bulldog, feel free to do 🙂
… who advocate jailing and killing climate realists.
This, Chimp, is simply crank. It is half a galaxy away from sound skepticism (that kind I appreciate).
Be sure I’ll manage to keep off commenting your paranoid comments in the future.
“Surely you’re aware that Jones lost the alleged “data” upon which the reconstruction is based. Therefore his garbage is meaningless mendacity. As you also know, to be science, results have to be repeatable. HadCRU’s pack of lies can’t be reproduced, since the dog ate their supposed data.”
Wrong.
There were two issues in climategate
A) Jones did not have ALL the raw data from NWS. 95% of his data was in GHCN Raw. 5% was direct from NWS.
B) Jones did a UHI study of china. The metadata and some other data was not archived.
Replicating HADCRUt result is easy. I did it years ago. basically I coded up their methods and used
DIFFERENT data sources than those used by Jones. He uses about4-5K stations. I used only stations
NOT in his database.
Answer?
Same answer.
This Myth of the lost data has been refuted many times, and in fact Hadcrut has moved on to an different dataset from the one they used during climategate.
If the red curve is HASCRUT 3, it has been so corrupted that it totally worthless. If you plot UAH, RSS, and weather balloon data you will see slight global cooling since about 2000-2004, which is what you would expect.
Doesn’t make any difference as to whether the temperature is correlated with the GCR flux [it is not].
Do us all a favor and follow the thread on this.
Here is the comparison with UHA and HADCRU:
slight global cooling since about 2000-2004, which is what you would expect.
Not at all:
http://www.drroyspencer.com/wp-content/uploads/UAH_LT_1979_thru_February_2017_v6-550×317.jpg
No such cooling.
Steven,
Lots more went missing than that. Jones couldn’t satisfy the FOIA request because his records, or lack thereof, were such a mess.
http://www.dailymail.co.uk/news/article-1250872/Climategate-U-turn-Astonishment-scientist-centre-global-warming-email-row-admits-data-organised.html
He also admitted that there was no warming from 1995 to 2010 and that both the 1930s and the Medieval WP were warmer than 2010.
How you can reproduce HadCRU without all the data is one of those “climate science” mysteries. Or maybe not a mystery, when you consider that making stuff up is SOP.
Don Easterbrook on March 20, 2017 at 7:26 pm
If you plot UAH, RSS, and weather balloon data you will see slight global cooling since about 2000-2004, which is what you would expect.
Is this Easterbrook the same as in https://en.wikipedia.org/wiki/Don_Easterbrook ?
I can’t imagine a professor in geology (even if 82 old) writing such nonsense. A simple, trivial look at RSS3.3 TLT’s linear OLS estimate for jan 2000 – dec 2004 shows in WFT like this
http://fs5.directupload.net/images/170322/t772aiul.png
and therefore is enough for clear contradiction. RSS’ linear estimate for the period is
0.261 ± 0.112 °C / decade.
Yes yes: slight global cooling!
I think what he meant was that SINCE about 2000-2004 [but what a vague point] there has been a slight cooling, which is BTW even more wrong.
Some people seem to blinded by their own brilliance…
Well Leif: maybe Easterbrook means in fact 2000-2014!
http://fs5.directupload.net/images/170322/vkr9repc.png
In that case he would be right, wouldn’t he?
But I don’t trust in persons speaking all the time about datasets being corrupted just because these datasets do no fit into what they expect.
maybe Easterbrook means in fact 2000-2014!
No, then he would not say “about 2000-2004”.
And in any case he should use 1976-2017 during which time solar activity has decreased while temperatures have increased.
But I don’t trust in persons speaking all the time about datasets being corrupted just because these datasets do no fit into what they expect.
So, you don’t trust Easterbrook. Neither do I. Welcome to the club.
lsvalgaard
March 20, 2017 at 12:57 pm
Maybe too late on the day, but please allow me to express my position and my point in all this, for whatever it could be worth of..
Thank you for your extraordinary effort, and your excellent work.
Hopefully many, here, do consider it and appreciate it in the same.
Thank you very much. Really extraordinary…
cheers
+1
+2
I’m sure the Dems will call it “settled science” that this lack of sunspot activity has to do with man’s activities on earth … only additional taxes can save us now.
The Planets are currently in an interesting configuration. If this config is involved with the missing sunspots, and that link is Mercury, they should start back in a week or two.
In case anyone want to play with a solar system model
http://www.brightonastronomy.com/solarsystem.html
+10 and thanks!
Thanks for the link. Looks interesting.
This is the Sun’s way of telling Algore and his snowflake army to STFU.
There are spots on the backside of the sun. Should rotate into view in a few days:
http://farside.nso.edu/
There is no accumulation of magnetic field on the far surface
http://farside.nso.edu/oQR/fqj/201703/mrfqj170317/mrfqj170317t1200.jpg
Coming up in the next day or two …
http://www.solarham.net/farside.htm
lsvalgaard on March 20, 2017 at 11:08 am and ff.
Thanks Leif for your comments, accurate info as usual.
Isvalgaard: Look like returning ones , do they get new numbers?
Yes.
I don’t know why these climate guys can’t figure out the solution. The US should just nationalize the sun and then pass some laws, concerning the minimum/maximum amount of sunspots. Problem solved!
Do we have data from a satellite measuring Earth’s cloud cover? Is it too soon to expect the increased cosmic rays to have an effect? If I have not got this entirely wrong then increased cloud would be the clue that the solar minimum was going to change our climate.
yes several satellites measure clouds. None of these datasets show any measurable effect from increases and decreases in GCR
Clouds dont correlate and temperature doesnt correlate.
the changes in the sun ( on sort term ) causes wiggles.. about a .1C wiggle in temperature. The thing we want to explain is the trend in temperature. Sun’s got nothing to do with that.
How do we know it’s not going crazy on the side we can’t see? It rotates every 24 days or so.
See above:
lsvalgaard March 20, 2017 at 11:08 am
lsvalgaard. If you treated other contributors with respect, the credibility of your argumentation would be enhanced. Your assertions seem to be constructed on <0.1°C precision of average global air temperatures over centuries. Not very solid foundation from metrological standpoint.
Respect has to be earned, and many commenters fail in that department. On the other hand, I answer questions and offer explanations freely and extensively. That is a form of respect in the interest of public education which I consider to be of utmost importance.
Sorry Chimp. I don’t know why Worldpress posted my comment here.
We can see the backside.\1) we have a spacecraft on the other side of the Sun
2) we can see through the Sun suing the same technique as used for oil exploration.
Here is the backside view:
http://www.leif.org/research/Stereo-A.png
Thanks, I appreciate the info
Isvalgaard you keep dismissing the effect of cosmic rays and you deny there is a lag between temperatures and solar cycles you keep persisting with this disinformation
You are welcome to produce evidence for your assertion to prove that you are not an idiot.
“How do we know it’s not going crazy on the side we can’t see?”
Because it’s dark on the other side, of course, otherwise we wouldn’t get nights.
An old “Rabbi of Chelm” Joke:
Student: “Rabbi Rabbi Whats more important the sun or the moon?”
Rabbi: “The moon, because the sun shines during the day, when its light out…the moon however shines at night when we need the light.”
The last two weeks here in upstate NY is as cold as the coldest January. The ground is buried in snow and icicles are three to five feet long from the north eaves. The sun controls temperature more than anything.
It’s been “unseasonably” warm here in Minnesota this Winter, and I sure am enjoying it!
Yup, that Sun is definitely what makes it Winter.
Or is it the Earth tilting away as it rotates?
In any case, I think it is safe to say that regarding short term variations in the weather, when it is colder than average in one region, there is somewhere else where the jet stream is carrying warm air north and those places are warmer than average.
With minor variations of course.
Because the average of the whole Earth (if you believe there is such a thing) does not change by very much from month to month, or even when it is Winter in the Northern hemisphere, does it?
Certainly not enough to account for temps 20 degrees or more lower than average.
That’s just weather.
As cold as the coldest January? How cold was the coldest January? How about February 1934 (and 2015)?
emsnews on March 20, 2017 at 11:40 am
The last two weeks here in upstate NY is as cold as the coldest January.
As Ric Werme told you, emsnews, here is Feb 2017…
http://fs5.directupload.net/images/170321/xm8hni4m.png
… followed by Feb 1934…
http://fs5.directupload.net/images/170321/jj8yzu6x.png
… and last not least, by Feb 2015:
http://fs5.directupload.net/images/170321/9j8cgsjf.png
Do you see the dark points over Northern America, emsnews? Look at the scale on the right.
Has there been an observed trend in the number, strength, or duration of aurora events since 1980 and within the current solar cycle?
Another ugly result of climate change.
Those interested in this subject will find a daily video broadcast of news related to solar activity and Earth-Sun interactions at Suspicious Observers: http://www.suspicious0bservers.org/
“The seven cycles preceded by solar cycle 24 had more sunspots than the mean.”
I think you meant to say “The seven cycles preceding solar cycle 24 had more sunspots than the mean”.
………and this folks is why we need fossil fuels and always will.
Research from several groups has shown that episodes of long periods of blocking days over the North Atlantic during the winter are more likely to occur during solar minima bringing acute cold weather over US and northern Europe, like the famous winter storm of 2010 that blanketed in snow the whole northern Europe.
As the solar minimum progresses, very cold winter waves are more likely to occur over Eastern US and Northwestern Europe.
Ineson, Sarah, et al. “Solar forcing of winter climate variability in the Northern Hemisphere.” Nature Geoscience 4.11 (2011): 753-757.
http://www.academia.edu/download/46679164/Solar_forcing_of_winter_climate_variabil20160621-29381-fudcsz.pdf
“low solar activity, as observed during recent years, drives cold win- ters in northern Europe and the United States, and mild winters over southern Europe and Canada, with little direct change in globally averaged temperature.
Gray, Lesley J., et al. “Eleven‐year solar cycle signal in the NAO and Atlantic/European blocking.” Quarterly Journal of the Royal Meteorological Society 142.698 (2016): 1890-1903.
http://onlinelibrary.wiley.com/doi/10.1002/qj.2782/full
“These results confirm that there is a tendency for positive NAO anomalies to follow solar maxima and negative NAO anomalies to follow solar minima. The signal peaks at a lag of ∼4 years with a maximum amplitude greater than 2.5 hPa and 99% statistical significance.
A corresponding analysis was performed to examine the 11- year solar signal in frequency of blocking events over the North Atlantic and Europe. The analysis confirmed previous results of Woollings et al. (2010) that showed increased DJF blocking frequency around periods of solar minimum, although these responds to solar forcing almost immediately
The 11-year solar signal response was also compared with other known influences on blocking frequency over the Atlantic/European sector, namely from ENSO and the Atlantic Multidecadal Oscillation (AMO). The 11-year solar signal was found to be as large in amplitude as the ENSO and AMO signals and the region showing 99% statistical significance was larger than either (Figure 10). When blocking events occur over Iceland the effect on European temperatures can be particularly acute.”
Barriopedro, D., García‐Herrera, R., & Huth, R. (2008). Solar modulation of Northern Hemisphere winter blocking. Journal of Geophysical Research: Atmospheres, 113(D14).
http://stream-ucm.es/PDF%20PUBLICACIONES/Barriopedro/2008%20Barriopedro%20et%20al%20JGR.pdf
“Atlantic blocking occurrence enhances the likelihood of cold days over Europe under either high solar activity or low solar activity. However, cold surface temperature anomalies are more prone to occur during blocking episodes of low solar activity, whereas winter high solar activity blocking does not significantly alter the distribution of cold temperatures. These results support the hypothesis that blocking may have played a significant role in the extremely cold weather conditions that dominated Europe during the Late Maunder Minimum.”
+10
The observation re. weather during the MM and other Minima has long been well supported by historical records.
This was the Mother of All Blocking Episodes:
https://en.wikipedia.org/wiki/Great_Frost_of_1709
Although there were lots of its offspring both before and after. Great frosts were common in the LIA.
PS: Charles XII might have lost to Great Peter even without that cruel winter, but its brutal effect on his exposed soldiers guaranteed that Russia, not Sweden would be the great northern power in Europe.
https://en.wikipedia.org/wiki/Battle_of_Poltava
I remember your comment about the Swedish soldiers having their testicles frozen.
https://wattsupwiththat.com/2016/12/01/cold-kills-the-coldest-decade-of-the-millennium/#comment-2357466
Man, that must hurt!!!
Javier,
Glad you remembered, because I was reluctant to repeat that particular anecdote.
Peter’s (!) soldiers didn’t need to stand guard duty during the long, bitter winter, as they were tucked safely away in his territory. So were able to preserve their crown jewels.
Now that is a cold winter. Thank God earth hasn’t had winters that bad since the end of the LIA.
Chimp March 20, 2017 at 1:38 pm
Hi do you have a source for the Freezing of Charles troops?
I Know He wintered over in the Ukraine South of Smolinsk and received aid from the Cossack’s.
There was a reinforcement column which was nearly destroyed and the near frozen survivors stumbled in.
Charles opened the Campaign by investing Poltava in May of 1709 Peter came to the cities relief, setting up defensive positions intending to lift the siege Charles attacked on July 8 (modern Cal) It was a near thing with Charles troops carrying Russian Redoubts and getting at times into the Russian Camp. In the end it was numbers and the fact that the Russians had finally managed to proper train their troops. Peters Army was +45,000 and Charles’s only 25,000. In the past such odds would have been fine.
Note numbers for troop strengths vary.
michael
Michael,
Yes, the ambush of the Swedish supply train was a catastrophe, but all was not then lost.
In the Poltava battle itself, had Charles not have been wounded, there still was a chance at Swedish victory. But his subordinates, instead of bypassing Russian advanced positions, wasted time and men trying to invest them. There were other mistakes after the battle, too.
As for the effects of the winter of 1708-09 on Swedish soldiers, I read it in a source I can’t find on the Net. Possibly Massie’s “Peter the Great”. Sorry. But there is ample material on the suffering of the Swedish army in the Ukraine that winter.
But for more on the historic winter of 1708-09:
http://www.nationalgeographic.com/archaeology-and-history/magazine/2017/01-02/1709-deep-freeze-europe-winter/
Charles had his chance in 1700 after the destruction of the Russian army at Narva and loss of its artillery, but he chose to defeat his cousin, the Polish king, before disposing of the apparently diminished Russian tsar. Big mistake.
In searching for sources to meet your request, most of the links came up for Swedish meatballs.
I just never came across it. The Swedes were one of the first Armies that to understand you had to grab a city and loot all the near by supplies to winter over.
Didn’t work to well for them in early Prussia during the 1600s
Frederic the elector II and the great Sledge ride. Moved the German army off the coast onto the ice to flank the Swedes.
If you have not heard of it do some digging, a great example of adaptation to yes Climate Change.
michael
Oh and I’ll see if I can find anything on “Swedish Meatballs” The tale is to good.
If it were in Massie, it’s not a tale but truth. Few historical tales can be taken to the bank, but he is the real deal.
However the search is rewarded by the many excellent Swedish meatball recipes on the Net.
+20
Cool summers in NH are also noted from 2009, hemispheric not global.
As far as land is concerned, the NH might as well be global.
While earth’s surface as a whole is 71% ocean, the NH is 81% and SH 61%. About 90% of the world’s people live in the NH.
Sorry. Ocean 61% in NH and 81% in SH.
Yes Resourceguy, and a lot of climatic effects are hemispheric. Insolation from precession has a very big effect and it runs opposite in both hemispheres. Global warming is also curious because it actually seems to take turns between the NH and the SH, and between land and ocean. Last warming bout was leaded by NH land, and the Arctic.
Well, it’s been shining in Nc all week. Looks like more fake news.
The last time I saw activity was on March 9, when there were two large prominences, including an 80,000 foot tower prom, as well as a very small active region on the surface.
Slowest month i remember. Photos here.
http://www.pbase.com/dsnope/sun_march_9_2017
Would that not be 80,000 kms David? ( I doubt you can see 80,000 feet as a prominence, that is barely 3 times mnt Everest)
Thanks, asybot, my mistake. Should read 80,000 miles high
My prediction made back in early 2014 of the solar minimum taking place in 2018 may yet prove correct. The West Coast had had a very heavy rainfall this winter bringing moderate scale flooding to many areas along the coast. The exception to that would be if next winter, 2017/18, turns out to be the Big One. That would then point to the solar minimum taking place in 2019.
goldminor: I don’t think so. Any time before the end of 2018 means this cycle would be less than 10 years long, i.e. shorter than the mean of 11.06 years. Weak cycles are often long, so we could be looking at a really long, slow, decline, to late 2020 or into 2021.
Rich.
And what does that imply may be the case for the next cycle, if this one is very long?
Yes, it certainly would go against the grain. This will be interesting to see how well the correlation between West Coast flood winters and the solar minimum holds up. That potential correlation has been a main focus point for me ever since I saw my first ssn chart back in 2009, in my first year of following this conversation. It intrigued me enough to keep me involved in this story for 9+ years now.
Do the number of sunspots matter?
Don’t we have any way of measuring changes in the amount of energy reaching the earth?
That is a darn good question , I wonder as well where the answers are? And there is little if anything we can do about it ( although I just ordered heating oil just in case)
The number of sunspots matters very much and we do have good measurements by spacecraft of how much energy we get from the sun:
http://lasp.colorado.edu/home/science/solar-influences/
“Studies of the Earth system require precise and accurate knowledge of the intensity of solar radiation
and the amount by which it varies. However, the careful measurement of the Sun is challenging
because our atmosphere absorbs and scatters the light. For this reason, scientists were unable to make precise measurements until the advent of the satellite era, when instruments could be sent above the atmosphere to enable observations from space.”
Seems the answer is that TSI hardly varies at all. http://lasp.colorado.edu/lisird/sorce/sorce_tsi/index.html
Indeed, only by 1 in 1000.
1 in 1000 for TSI translates to 1.3 Watts/sqaure meter. The IPCC’s guess for the total effect of humans on radiative forcing since 1750 is 1.1 to 3.3 W/m2, so even though it is minor compared to total TSI, it is actually significant when trying to compare causes of temperature change.
Even more significant is the data from NASA’s SORCE mission (one of the LASP related missions linked above), which has found that solar output at different wavelengths does not change in concert with TSI, but that some wavelengths have ten times as much change as others, and some increased even when TSI was decreasing. It is unknown if these variations are consistent from cycle to cycle. Because there was no satellite consistently measuring output of the sun at different wavelengths before SORCE was launched in 2003 it means there really is no data to show how the sun’s output was changing during the second half of the 20th century, or what effect it had on warming.
The measurements at different wavelength are much more difficult than the measuring the Total Irradiance, and there is severe doubt is the reported variations are real.
“Strong Evidence That Svensmark’s Solar-Cosmic Ray Theory Of Climate Is Correct”
“Increasingly respected climate theory that cosmic rays impact global temperatures due to influence on cloud formation is given a real boost thanks to new evidence.
“Swedish climate researcher, Magnus Cederlöf has performed a detailed analysis of climate data relating to cloud formation and found that there is strong correlation in favour of the theory of Henrik Svensmark (pictured). Svensmark is a physicist and professor in the Division of Solar System Physics at the Danish National Space Institute (DTU Space) in Copenhagen.”
http://principia-scientific.org/strong-evidence-that-svensmark-s-solar-cosmic-ray-theory-of-climate-is-correct/
Says absolutely nothing about cosmic rays, only that there are more clouds during summer than during winter. Hardly a surprise.
So, you believe that cosmic rays have no effect on cloud formation ? i was under the impression that Forbush Decrease Events were fairly well established and that correlated cloud cover changes were observed.
Given that a 2% change in water vapor concentration has the same effect as a 100% change in CO2 concentration do you think we’d be able to measure small cloud cover changes (as in fractional-percent) accurately ?
i was under the impression that Forbush Decrease Events were fairly well established and that correlated cloud cover changes were observed.
Impressions don’t count for much against cold facts:
http://www.leif.org/EOS/GCR-Climate-Corr.pdf
“No compelling evidence to support a cosmic ray cloud connection hypothesis using the satellite cloud data (ISCCP, MODIS) with long- or short-term (Fd) studies.”
Hell even the sun needs to take a break it’s been going now for millions of years a few days of won’t hurt anyone other than Gore. He is probably as we type looking for some way to get a refund .
Billions of years.
The regions of the earth that most affected by solar cycle cloud modulation are:
1) The equatorial region. This region is effected by solar wind bursts which create a space charge differential in the ionosphere which in turn causes an electric current to flow from the high latitude regions of the planet to equatorial regions. The solar wind bursts are caused by sunspots and coronal holes, with coronal holes being the primary source.
2) High latitude regions between 40 and 60 degrees. Clouds amount and cloud properties are effected in the is region by solar wind bursts and the high speed cosmic particles, mostly protons which for historic reasons are called galactic cosmic rays (GCR). The GCR are partially blocked by the solar heliosphere which is the name for the ions and pieces of magnetic flux that are stripped of the sun by the solar wind. The solar heliosphere extends well past the orbit of Pluto.
Solar wind bursts are now starting to abate as the low latitude coronal holes are starting to dissipate and/or move to the polar region of the sun where their wind now longer effects the earth.
The solar modulation of cloud cover is greatest over the ocean as the air above the ocean has less particles than over land and has less ions as the continent crust is slightly radioactive.
Based on measured cloud changes the solar wind burst cause warming of roughly 7 watts/m^2 as compared to the IPCC estimated forcing for a doubling of atmospheric CO2 of 3.5 watts/m^2.
http://www.ospo.noaa.gov/data/sst/anomaly/2017/anomnight.3.20.2017.gif
This region is effected by solar wind bursts which create a space charge differential in the ionosphere which in turn causes an electric current to flow from the high latitude regions of the planet to equatorial regions.
No, that is not how it works.
Solar wind bursts are now starting to abate as the low latitude coronal holes are starting to dissipate and/or move to the polar region of the sun
No, as I showed, low latitude coronal holes are most prevalent in the years just before minimum.
Thank you so much for answering my last question. It ended the endless debate about how the astronauts could go to the moon in a tin can without getting roasted like a hot dog.
The SORCE data is that and average for the year or a continously record ?
The primary data is reported as a daily average of measurements every few minutes.
The U.N. is tallying your tax on sun spot activity at this very moment.
The latest models of the Sun predict a mini Ice Age coming around 2030, with the output of the Sun falling 60%. All the AGW chicken little’s, carbon capture fanatics and carbon tax control freaks will look extremely foolish in 15 years when cooling creates huge negative effects on crops and humans, especially considering all the resources they’ve used to make the climate cooler. A lot of people died from famine and other effects of the last little Ice Age: https://en.wikipedia.org/wiki/Little_Ice_Age I imagine there will be a lot of people who want to kill the proponents of cooling earth via carbon capture and other actions, who will believe they caused it.
Link to latest Sun model: https://www.sciencedaily.com/releases/2015/07/150709092955.htm
Doubtful, Dogood. It will be seen to have been caused by the continued reckless use of fossil fuels, and the demon molecule. “CO2 – the molecule that ruin your whole day”. However, eliminating fossil fuel use, combined with a punitive carbon tax, will be offered as a solution, but only 6 months remain before a tipping point is reached.
To be clear, the prediction is for solar ‘activity’ to decrease by 60%. If solar output fell by 60%, I doubt anyone would be left to argue about the cause.
That paper has been thoroughly debunked already.
Hillary Clinton wiped the… “with a cloth.”
Must be global warming?
Exactly Neil!
The huuuge upwelling LW radiation emitted to space through the (not yet quite closed) atmospheric window managed to erase all sunspots. It’s so horrible you know.
What is missing in the conversation here about the “blank sun” is the Carrington event that produced a solar (CME) superstorm in 1859 that toasted telegraph wires. It took place during a weak solar cycle. Imagine that scenario happening today with our dependency on electricity and the power grid.
It now seems that not just CME’s can shut down power systems. Filaments and coronal holes have disrupted power over the past several years. Is the earth more vulnerable to the sun due to the shifting of the magnetic poles which is weakening the earth’s protective shield five percent per decade? The north magnetic pole is rapidly moving towards Siberia and the south magnetic pole is also on the move but slower towards each other.
This is a very frightening prospect that seems to be lost on most people and it could very well happen in our life time. Climate change…think that is scary how about a solar flare that takes us back to the stone age without power for years? Why don’t we hear about this more and the rapidly occurring weaking of our magnetosphere…is it because we wouldn’t want to really panic people?
Just saying…
ScienceDoesn’tCareWhatYouBelieve on March 20, 2017 at 4:21 pm
Thanks for this interesting comment.
Yes. But like an asteroid hit, not much to do to prevent it.
Just recovery. Even resilence is uncertain within reasonable costs of an event of unknown frequency/probability.
And if the Socialists can’t tax it, they are not interested in it.
We could begin to build and stockpile replacement transformers, for one thing. The lack of replacements on hand for massive numbers of destroyed transformers will likely be the single most important factor in getting the power back on if this were to happen.
There are things individuals can do as well…do not live in a city.
Do not be one of the ones completely unable to produce any food for yourself.
Do not be one of the ones with zero survival skills.
Do not be one of the ones with no firearms to protect yourself when the law of the jungle prevails.
Have your own well, and a way to power it.
Become proficient in how to repair machinery and such.
If the power goes out for an extended period, it will get very bad before it gets better. Have as many buffers in your own life as possible.
And do not forget…if all of your money is numbers in a bank account which is only stored electronically, you will like be dirt poor overnight…don’t be one of those people.
Skills, tools, resources, money, knowledge. Those things will matter.
“We could begin to build and stockpile replacement transformers, for one thing. The lack of replacements on hand for massive numbers of destroyed transformers will likely be the single most important factor in getting the power back on if this were to happen.”
Agreed. I believe there are some efforts to build spare transformers but the last I heard about it, they were arguing over who should pay for it, the government or the utility companies.
Protecting our electric grid should be one of the highest priority items on our national agenda. Our electric grid can be knocked out by the Sun, or by madmen here on Earth. Even little weasles with just a couple of nukes can do tremendous damage if they do it right. We need to do something about this. Soon!
Seriously, repairing transformers is not so ad, especially if there is a national emergency. It won’t take years it will be done in months.
Ask any Siemens, GE or energy company employee.
You make the assumption that all of their equipment will still be working. If they have to wind them by hand, and worry about their family starving, or being killed, might go a little slower.
Well, Clearly :
CO2 in the Earth’s atmosphere
. . . . . . will cause a paucity of sunspots.
/sarc
Well, Clearly :
CO2 in the Earth’s atmosphere
. . . . . . will cause a paucity of sunspots.
/sarc
IT”S GLOBAL WARMING!!…Wait..What?…..Never mind.
The sun is dying … it will soon expand… God help us… and the sun will become black as sackcloth…. a star collaspses , and becomes black inside.. it expands like a balloon, and then will collaspe in on itself.. its energy out put is going up and down as it starts to lose its ability to burn hydrogen… the sun is doing bizarre things and no one is sure what is going on … We may soon find out….
…. in about 6 Giga years, give or take.
The human race will be long gone, possibly off-world (I don’t think so though sadly), before the sun consumes the inner planets, including Earth, and dies.
I would be very surprised if humans are not living off planet within the next 50 years. Unless someone does something real stupid like starting a nuclear war. That would set us back a little.
It seems to me the sun is setting everyone up for a surpise.
An SC 24prime anyone? (A mini cycle from 2018-2020?)
Then pronounced quiet.
All of these requests for an analysis of accurate solar effects on temperature.
Well I have your data.
I used data from pmod wrc, of satellite based solar to calculate a clear sky surface forcing, and divide the change in temp by the change in forcing at the surface.
http://wp.me/p5VgHU-1t
And the results are shown by bands for the extratropics.
What caused more global cooling , the lack of sun spots or the reduced funding to pay the global warming industrial complex ?
What happened to Bill Nye trying to float warmest year bets ? NOAA and NASA not such a bankable bet theses days ?
Too bad man made Co2 won’t help us stop cooling .
And we have been seeing unseasonably cold weather with the threat of a blizzard in the NE in March. Hmmm, imagine that.
We have also seen unseasonably warm weather.
Key word…weather.
Think: Jet Stream location.
The Jet Stream determines if you are hot or cold. Those living south of the Jet Stream’s path experience mild weather and those north of the Jet Stream get the full brunt of arctic weather.
Currently, the Jet Stream is running along the U.S./Canadian border and dipping down into the northeast U.S.
Yet the temperature of Gulf of Mexico is above the seasonal average. Since it only heats by solar energy, hmmmmmm………………?
We have had fewer than normal incursions of cold air down here this Winter, and it has been very warm, very dry, and very sunny for almost the entire period since the beginning of October.
At least in SW Florida…which one might assume extends to at least a part of the Gulf.
The Gulf of Mexico has volcanoes, so isn’t heated only by solar energy.
No sun spot activity is caused by manmade global warming
(that was sarcasm to make it clear for the idiots whomthink I was being serious)
What’s the connection between this and global warming or cooling?
Some are trying to downplay any possible anthropcentric effect on climate by claiming it’s all about solar variations. One problem with this is that solar output varies so little: from about 1365.5W/m2 at the low point up to 1366.5 at the top every 11 years.
There have been periods in the past where prolonged lows seemed to have reduced global temperatures. The trouble is that at the moment solar is historically quite low but temperatures are refusing to co-operate.
Tony, do remember those numbers the next blog on TSI comes out.
TSI doesn’t vary much, but its high energy component, ie UV, fluctuates by about 100%. Among other climate-relevant effects, this causes ozone levels to vary widely.
I think the outer reaches of the atmosphere expand and contract with the solar cycle as well, and a weaker cycle may cause it to expand less and contract more?
Remember when Skylab fell to Earth because solar max came earlier and stronger than anticipated, due to friction from an expanded outer atmosphere?
I do not know if that can effect how fast radiation can escape into space, but maybe someone else does.
Love the fact that Lief always bashes anything about the climate/sun. Predictable as the sun coming up every morning. (Of course he probably would tell me the sun really doesn’t come up).
But none of his peers ever come here to argue with him that I have ever seen, and I have lurked here for 7 or 8 years and have tried to read every post about the sun/climate. (I am sure I have missed a few).
A major leaguer should be expected to hit home runs in little league. So I always keep that in mind.
But none of his peers ever come here to argue with him
Mainly because they abhor the stupidity and uncivility many commenters display.
But there has been some, e.g. Scafetta, who have tried, but given up.
So why do you do it?
“Love the fact that Lief always bashes anything about the climate/sun. Predictable as the sun coming up every morning.”
Well, Lief might be a little short with some people, but I haven’t seen anyone prove him wrong yet.
Lief is a a person who doesn’t suffer fools gladly. So if you make a foolish assertion, you probably know what you are going to get from Lief.
He does make it difficult to disagree with him lol
That is not the point. The point is that we don’t ever get to hear the other side of experts on his level.
Sometimes as a fan it is good just to watch a real major league game being played out.
After mowing down all comers with his customary dispatch and drinking their blood from their skulls, Lief complains of “uncivility”? “Self-awareness” ain’t yo’ long suit, Mr. Isvalgaard. But you fun to watch!
Hey, he does answer questions, and lots of people are rude on both sides.
But the real test will be what happens over time.
This has been the weakest cycle in a very long time.
Either it will get colder over the next twelve years or so, or it will not.
12 years…it should be pretty clear by then, lag or no lag.
I sure hope everyone is still here so we can each eat some public crow or take smirking bows.
I am considering a bet on popcorn futures.
There might not be much popcorn around if it gets cold, better buy some soon.
Panik! The man-made global warming has reached the sun!!!
@ L. svalgaard
net flux drop (gray area) …
Opinion !?!?
http://wso.stanford.edu/gifs/all.gif
Zonal magnetic flux transport over 3.5 solar cycles
A weaker solar cycle has less magnetic flux. Since cycle 24 is weak, there is less net flux.
It seems to me that after reading the comments. no one really agrees on what effect, if any, low solar activity may have. Even the classic correlation between sunspots and crop yields does no long seems as robust as once thought.
That correlation has been found to be spurious:
https://geomag.usgs.gov/downloads/publications/grl50846.pdf
Indeed Isvalgaard.
Incidentally, apologies for my terrible grammar, predictive text can be a real nuisance !
The correlation isn’t as strong now as when noted by Sir William Herschel because crops are currently less dependent upon weather, although of course it still matters.
We have now higher-yielding seed varieties, and, thanks to fossil fuels, more irrigation (requiring energy to pump), pesticides, herbicides, chemical fertilizers and agricultural vehicles. A large portion of crop yields today are thanks to petroleum and natural gas.
When my great-grandfather started farming wheat in the Pacific NW in the late 19th century, his yields were about one tenth of what we now achieve on the same ground in the early 20th century. They’re around four times what we got when I was a boy in the 1950s. And it takes far fewer people to work the fields and harvest the crop. And no animals, instead of 20-mule teams.
Figure 2 in the main article highlights the weakening trend in solar cycles since 1980. Observations of the surface and atmosphere show continued warming since 1980, even in the ‘coolest’ of the satellite data sets:
http://www.woodfortrees.org/graph/rss/from:1980/plot/rss/from:1980/trend
What more evidence is required to show that solar activity has not been the major forcing on temperature change over the past 37 years?
Today there is a sunspot:
http://cesar.kso.ac.at/main/cesar_start.php?date=2017-03-21
One (very) tiny spot should not make us wonder in the month no. 100 of the cycle. In the article they didn’t use the last data, voila:
http://kaltesonne.de/wp-content/uploads/2017/03/rio2.png
All of this yada yada yada is mostly BS. One need only look to the Maunder Minimum to see the result of lower Sun activity. Everything else is just so much ‘I’m smarter than you’ BS.
Leif, please forgive my ignorance. If there is no correlation between weak solar cycles and colder temperatures, how do you explain the well documented cooling during the Maunder and Dalton Minimum periods? Is it possible that there is a lag in the system so that it takes two or more successive weak solar cycles together to see colder temperatures? In both the Maunder Minimum and the Dalton Minimum periods there were three or more successive weak solar cycles together and they are both associated with periods of cooling.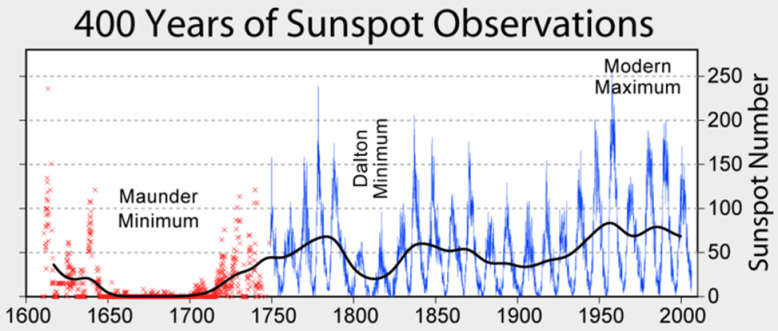
The colder temperatures during the LIA lasted much longer than 2 or 3 cycles:
http://www.leif.org/research/Moberg-Loehle-Temp-Reconstruction.png
Yes, but the Maunder Minimum lasted somewhere between 10 and 13 solar cycles from 1645 -1715 (with some giving an earlier start) and the cooling from the little Ice Age lasted from 1650 to 1850, which matches fairly well if you consider accumulated lags.
Yes, but the Maunder Minimum lasted somewhere between 10 and 13 solar cycles from 1645 -1715
If each cycle last 12 years, the interval 1645-1715 has only room for 6 cycles…
Correction, the Maunder Minimum lasted about 6 solar cycles.
It doesn’t matter how much the LIA lasted. What matters is that prolonged low solar activity during the Wolff, Spörer, and Maunder grand solar minima corresponds to periods of colder temperatures and altered precipitation patterns.
http://i.imgur.com/aXMnuOu.png
Gripegut is correct that it is possible that climate sensitivity to solar activity changes is such that its effect is only significant after a period of decades of below average solar activity. You cannot dismiss the hypothesis on the account of temperature trend not following solar activity trend for the past 4 cycles. For that you must assume that the effect is linear, without lag, and mediated by TSI. And you must assume that solar activity is the main factor affecting temperatures, with all others playing a lesser role. Those two assumptions are likely to be incorrect.
And the problem multiplies because the Wolff/Spörer/Maunder cluster is just one of several clusters of grand solar minima that are more or less evenly spaced through the Holocene, and each and every one of them took place during a period that displayed worsening climatic changes similar to those of the Little Ice Age.
https://judithcurry.com/2016/09/20/impact-of-the-2400-yr-solar-cycle-on-climate-and-human-societies/
Leif cannot explain it, so Gripegut won’t get the explanation he is asking for, and Leif will deny the evidence painstakingly collected by scores of paleo researchers during decades. According to him they are mistaken, the record is contaminated, they are fools deceiving themselves, or worse, cyclomaniacs.
Leif reminds me of Georges Cuvier, a great scientist that produced great contributions to Geology and Natural History in the early 19th century. He was very influential but he is remembered mainly for his stern opposition to any idea of evolution and his unrelenting attacks on anybody that dared to express scientific opinions he opposed. At that time evolution was as obvious to any illustrated person as the effect of solar variability on climate is today, yet nobody had any idea on how it could happen or but what mechanisms, and the hypotheses that were being put forward by evolutionists like Lamarck or Geoffroy Saint-Hilaire were wrong and easily shot down by Cuvier.
In the end if you reject the evidence you always end up being wrong. That is the problem also with the consensus AGW hypothesis. They are rejecting all the paleo evidence that shows that CO2 cannot be as determinant climate factor as needed by their hypothesis.
Also the Dalton Minimum. The LIA can be explained simply on the basis of the frequency and duration of solar minima during it, although other factors are also probably in play.
IMO, the Wolf Minimum belongs to the Medieval Warm Period, as a fairly brief countertrend cycle, since it was followed by renewed warmth before GASTA fell off a cliff in the 15th century.

Chimp, as you may know I’ve said co2 in the ice cores has followed temperature by 800 years. Going back to 1850, and going back on you chart to 1050, to paraphrase a Nobel prize winner, “what pops out at you” ?
The Dalton isn’t labeled in the image, but is the dip in the early 19th century. The last blast of the LIA.
rishrac March 21, 2017 at 12:28 pm
Going back ~800 years from now to c. AD 1217 is also instructive. Medieval WP CO2 isn’t all that different from now. There is IMO clearly a man-made component during the Modern WP, but CO2 in the pre-industrial Middle Ages was higher than the 280 ppm of the LIA, usually considered the “pre-industrial” norm.
The Modern WP still hasn’t equaled Medieval WP peak warmth, which lasted about 150 years and was hotter than now.
gripegut on March 21, 2017 at 5:57 am & ff
gripegut: what do you think about the following two facts:
– Leif Svalgaard’s temperature reconstruction shows a strong decline starting at least 300 years before the Maunder Minimum;
– during that 300 year period there was a tremendous sequence of volcano eruptions with explosivity index of 6 (Rinjani had even 7).
Rinjani 1257, 7
Quilotoa 1280, 6
Kuwae 1452, 6
Bárðarbunga 1477, 6
Billy Mitchell 1580, 6
Huaynaputina 1600, 6
Think of the well accepted effects shown by Mt St Helens (1980, VEI 5) and El Chichon (1982, 5) as well as by Pinatubo (1991, 6).
Some scientists mean that the optical depth of stratospheric aerosols induced by all these huge eruptions became so high at that time that the oceans experienced a strong cooling it took centuries for the planet to get rid of.
If the LIA had been created by the Maunder Minimum and other solar cycles, that would be clearly visible on the temperature reconstructions: the cooling period then would have been initiated after Maunder, and not centuries before it appeared.
I really don’t know how long these types of volcanic eruptions affect temperature, nor do I know what level of solar activity was occurring in the 300 years before the Maunder Minimum, but my guess is that the volcanic eruptions caused much of the cooling before the Maunder Minimum.
gripegut on March 22, 2017 at 9:02 pm
If you are interested:
– The potential impact of super-volcanic eruptions on the Earth’s atmosphere
http://onlinelibrary.wiley.com/doi/10.1002/wea.263/pdf
– Reconstruction of solar activity for the last millennium using 10Be data
http://tinyurl.com/kyuq76l
Bindidon, that is fascinating and very useful. Thank you, this really helps me to understand the historical SN vs temperature. There seems to be a strong correlation between low SN and low temperatures and high SN and higher temperatures when multiple (low/high) similar strength solar cycles are combined.
Bindidon,
The climatic effect of volcanoes is quite well known. It is short-lived, and its effect on the paleo temperature record is clear (blue bars). It is always followed by a recovery (red bars).
http://i.imgur.com/dLwwN4e.png
Volcanic activity cannot explain the Little Ice Age, but it can explain why some decades within the LIA were extremely cold.
The “LIA due to volcanoes” hypothesis denotes lack of scientific rigor. We know perfectly well that volcanic activity was much higher during the Holocene Climatic Optimum, the warmest period in the Holocene. The relationship is the opposite to the one needed. You can only defend it by ignoring available evidence.
http://i.imgur.com/6Mjup0V.png
Dalton minimum is not really a grand solar minimum. Similar periods in the 14C record abound and are not usually considered GSM. Temporal analysis shows it is part of the centennial cycle: 1810, 1912, 2019. As we get farther from the Maunder Minimum, the centennial minima become less pronounced.
http://i.imgur.com/j2hbCiv.png
Dalton Minimum was extraordinarily cold due to extraordinary volcanic activity at the time, not due to extraordinarily low solar activity.
Well, there surely was some serious eruptive activity then, and not just Tambora in 1815.
Laki predates the usual start date for the Dalton, but must have contributed:
http://volcano.oregonstate.edu/laki-iceland-1783
Thanks Javier for that explanation , clear to understand.
Javier, again thank you for your help. I have a lot to learn and this helps tremendously. It seems clear that there is a relationship between temperature and solar activity when several low/high cycles combine suggesting a lag and a compounding effect.
Climate change is governed not by human activity, nor even raw solar output (exclusively). Truth be told there are a million factors, from the orbital positions of the gas giants (AND their satelites) relative to our orbital position, the orbital positions of venus, mars, and mercury, the raw photonic solar output, and the never discussed electromagnetic connection between the earth and sun (especially) as well as the electromagnetic connection with every other body in the solar syatem, and even the electromagnetic connection with neighboring star systems and probably even the center of the galaxy.
We have neither the scientific and technological capacity to measure, nor the computational power needed to extrapolate any meaningful predictions from the immense amount of data, most of which we aren’t even able to measure yet (most of which aren’t even accepted parameters of influence, such as the electromagnetic output of jupiter, even though we know jovian electromagnetic sphere of influemce reaches us).
Simply put…we’ve got a long way to go.
hehe, My theory is that at solar minimum, when the Sun’s polar field is near zero, it is the magnetic field of all of those, that imprints on the Sun, And Leif as stated before that it is at that point the next solar cycle is “defined” (my word not Leif’s).
I posted a solar system modeler up thread I think, go look at the 1907 solar cycle, and the sun spot counts, and then look at the orbit of mercury. Which by the way is a great big magnetic iron core (not magnetized), and we know there is magnetic fields connecting between the Sun and the Earth.
Hey that might be something to go look at, go find the dates NASA says the fields were connected, and see if the temps changed. Oh, FYI after summer solstice, it generally takes only a week or two before the daily change in temp starts to respond, the noticeable effect are longer than that, but had started a few weeks earlier.
Magnetic fields that span the whole galaxy are a fascinating subject.
Years ago, in testimony to Congress on ICBM technology diversion, my brother was explaining some aspects of missile science and one of the congressmen interrupted and wanted to know why about some technical detail. My brother told him it was the laws of physics, the congressman simply replied that’s OK, we’ll change that law!
LOL. Thanks but par for the course.
I find it interesting to say “Svensmark’s hypothesis has failed” as there hasn’t really been enough time to tell if it will have an impact on climate. Svensmark basically says when we get an increase in cosmic rays, we get an increase in cloud cover and that’s basically all he says. To what extent that has on climate is the unknown part. There does seem to be about a 10 year lag between a weak cycle and climate influence so we probably would not expect to see any climate response until sometime between now and 2020. Also the impact of additional clouds will vary according to where they are. More clouds in the tropics will result in cooler temperatures there, more clouds in polar winter will result in warmer temperatures there. Overall we are probably talking about a small change in cloud cover that takes time to be felt.
Svensmark basically says when we get an increase in cosmic rays, we get an increase in cloud cover and that’s basically all he says
However, that is not borne out by the observations:
http://www.leif.org/research/clouds.png
I wasn’t meaning to imply that I thought GCR rates are the *primary* driver of cloud cover, only that they have an impact. Yes, some other things such as evaporation rates will have a greater impact. So yes, if evaporation rates decline while GCR rates increase, overall clouds would decline. They might not decline as much as without the increased GCRs though. The question is if the delta from changes in GCR rates is enough to make a difference and it would seem it takes 10 years or more for that difference to be noticed.
I wasn’t meaning to imply that I thought GCR rates are the *primary* driver of cloud cover, only that they have an impact
‘Impact’ is a strong word Dictionary says it means to “have a strong effect on someone or something”.
A better word would be ‘influence’. There are lots of things that have an influence on the climate, such as radiation from Sirius, or reflected light from the Moon, etc, but all of those are small and in the noise. We only need to consider the ‘primary’ drivers [as you put it]. And there is no evidence that compels us [or me at least] to believe that GCR is such a driver. One can fight about the details forever, but act only on the clear and strong effects on which there is no doubt. And GCRs ain’t it.
and it would seem it takes 10 years or more for that difference to be noticed
It is now 20+ years since the data that formed the basis for Svensmark’s hypothesis were taken, and there is still no evidence of any effect. By the very nature of the hypothesis there should be no lag.
Isvalgaard @ 9:20 am : “A better word would be ‘influence’. There are lots of things that have an influence on the climate, such as radiation from Sirius, or reflected light from the Moon, etc,”
But you keep insisting that solar radiation doesn’t or did I misunderstand your reply?
Steven Mosher wrote: “In 1896 and again in 1938 the hypothesis was laid out that if C02 increased the temperature would in general go up. It has.
This evidence CONFIRMS the hypothesis. Now, you could argue that it MIGHT be something else, like unicorns causing the rise in temperature, but the evidence supports the hypothesis it does not contradict the hypothesis.”
On the other hand, the hypothesis is NOT CONFIRMED when warming such as that of 1910-1940 occurs without sufficient CO2 to be the cause, nor when the highest levels of CO2 of recent years fails to continue to produce a high rate of warming. There is simply not reliable evidence of any effect of CO2 on temperatures.
nor when the highest levels of CO2 of recent years fails to continue to produce a high rate of warming
Similarly: nor when falling solar activity the last half century fails to produce the cooling so fervently awaited.
There are other possible explanations for cooling, which might have just coincided with low sunspot activity. Warming periods, I’m still thinking about that if it’s not solar activity. Since I thought that the solar activity was the primary driver of climate changes, it’s hard to let it go entirely. So I’m watching what this cycle does of course. However, as you indicated it may not be as deep of a minimum as thought. There is other information, whether it is correct or not, seems to support that. Results may not be as conclusive one way or the other as I’d like. I’m not in any hurry to see a cool down of any kind.
I had a reason about asking about the TSI.
falling solar activity, yet higher than average solar activity over the last half century (save SC24)…
But not higher than at similar half-centuries in the past when temperatures were much lower.
Moreover the trend is important: sun down, temps up.
“Moreover the trend is important: sun down, temps up.”
One talking point deserves another: Ever turn the flame down on a kettle of water? (did it continue to warm?)…
Turn the flame [the sun] down. Watch the kettle [the Earth] continue to warm. Such is the real world. Conclusion: perhaps the kettle is warming for other reasons than the flame…
Perhaps not. With higher than average solar activity even after the flame is turned down, we might expect to see some warming. (and with SC24, we got our pause) Conclusion: perhaps the kettle is warming for no other reason than the flame…
We have had higher than average solar activity in parts of every century the past 400 years. So would expect similar behavior in every century. If you watch your kettle after turning the heat down, I don’t think it will continue to warm. Perhaps you just picked a bad analogy.
http://m.imgur.com/yvrMXFy?r
(graph courtesy of Javier)
“Perhaps you just picked a bad analogy.”
Perhaps not…
Contrary to popular belief there is a possibility that volcanic stratospheric SO2 injections have a long term net warming effect. Physics demand that an energy imbalance be compensated for when making general accusations about temperature trends and during the 80’s and 90’s significant amounts of ozone were depleted which has allowed more UV to enter the troposphere. A direct correlation of surface temperatures with solar activity cannot be made with out compensating for the current troposphere / stratosphere boundary energy imbalance that has been caused by the last two major SO2 events.
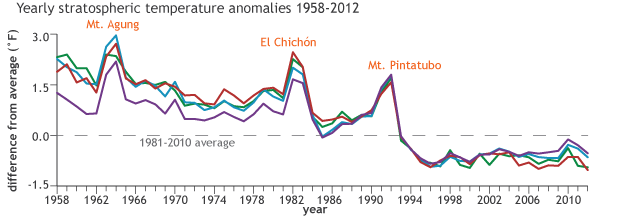
“On the other hand, the hypothesis is NOT CONFIRMED when warming such as that of 1910-1940 occurs without sufficient CO2 to be the cause,
wrong. About 1/3 of the warming in that period is due to C02 and other GGH
about 1/3 is natural and about 1/3 is internal variability.
nor when the highest levels of CO2 of recent years fails to continue to produce a high rate of warming.
Wrong again. You have to look at the sum of all forcing son
[Mr. Mosher might benefit from learning some tact in dealing with people. Just reading the condescending way he writes this makes me bristle, and it likely has the same effect on others. If you want to change minds and opinions, your method of communications certainly doesn’t help -Anthony]
Steven,
Wrong again.
http://co2coalition.org/2016/08/04/non-existent-relationship-co2-temperature-correlation-only-15-of-last-165-years/
1. 1850 – 1910: -0.1°C Cooling with +15 ppm CO2
2. 1910 – 1940: +0.45°C Warming with +11 ppm CO2 (with flat human emissions)
3. 1940 – 1977: -0.1°C Cooling with +23 ppm CO2
4. 1977 – 2001: +0.35°C Warming with +37 ppm CO2 (1st & only positive correlation since 1850)
5. 2001 – 2014: -0.04°C Cooling with +27 ppm CO2
Anthony, i don’t think mosher would be mosher if he didn’t make people bristle… (☺)
Thanks for that breakdown, Chimp. It puts things in perspective, and shows there is nothing unusual going on with the Earth’s temperature.
The temperature goes up for a while, then it goes down for a while, then it goes up again, at the same rate of warming as in the past, and those ups and downs don’t correlate with CO2 concentrations.
The temperature profile is *not* going up at a 45 degree angle as CAGW promoters would have us believe. Instead, the temperature profile is moving in a “seesaw” fashion within a normal range, at least from the 1930’s. And 2016 was not as hot as the 1930’s, so we are not in record territory by any means.
You’re welcome.
The inconvenient truth for the real climate change d@niers is that earth’s response to rising human GHG emissions for 32 years was to cool dramatically. Then for about 20 years, rising emissions and temperature accidentally coincided, the correlation not showing causation. For another about 20 years and counting, emissions rising even faster have coincided with slight cooling to flatness.
Conversely, without rapidly rising emissions, earth warmed up about as much during the ’20s and ’30s as it did during the ’80s and ’90s.
Thus was CACA born falsified.
Chimp March 21, 2017 at 1:22 pm
2. 1910 – 1940: +0.45°C Warming with +11 ppm CO2 (with flat human emissions)
3. 1940 – 1977: -0.1°C Cooling with +23 ppm CO2
From 1945 – 1963 atmospheric nuclear testing took place, over 500 explosions yielding over 500Mt
The plume was 56 km high at the time of the photo.
Need only one big volcanic eruption and the sun at minimum to re-experience the Dark Ages.
Huh… that kind of tracks with the non-gridded non-normalized non-extrapolated temperature record. We should probably be adjusting the sunspot numbers to fit the model du jour.
does anyone know if there are records of uv output and if so over how many solar cycles ?
There is a record [of EUV] going back centuries here:
2160 Reconstruction-of-Solar-EUV-Flux-1740-2015.pdf (Accepted Solar Phys. Topical Issue, 2016)
on my website: http://www.leif.org/research/
EUV is were the variability is.
thank you very much for taking the time to provide that link dr.svalgaard . do i take it although the euv component varies significantly it bottoms out at the same level every cycle and the maximum range in the last 40 years does not indicate any significant change from the rest of the reconstructed record ?
Yes, you are quite right about that.
As usual, the commentary here is divided into two camps. The first being people who are interested in true science, looking for the answers to solve the mysteries of nature. They are not totally fixated on the outcome but open-minded enough to ask questions. The second, being the usual crowd that has bought hook, line and sinker, the contrived AGW scam. But that second group will think they are the first, seeking “truth,” believing themselves to be defenders of the planet. The second group will never learn until they realized they’re the victims of a massive con-job.
Climate “Science” on Trial; Did Cosmic Rays End the CA Drought?
https://co2islife.wordpress.com/2017/03/22/climate-science-on-trial-did-cosmic-rays-end-the-ca-drought/
Changes in offshore ocean temps look like the culprit to me, along with the lower ssn count. I made a successful prediction in 2014 for the return to normal rainfall over the last 3 winters with a specific prediction for this current winter to be a very heavy rain season. A large part of the prediction was based on the recurring flood pattern in the PNW in relation to solar low points. That was my edge in making the predictions both for rain pattern changes on the PNW as well as for concluding that solar conditions were going to fall earlier than anticipated by everyone else. Observations can be useful at times.
It was interesting to also watch the ssta changes in recent years as it allowed me to learn more about how the changing ssta conditions worked to enable the rains to return. Several months ago I informed my relatives in Washington that they should expect the rains to continue on into April of this year, and perhaps into May as well. So far that has proven correct. Part of my reasoning for concluding that had to do with my summer vacation in 1965, the year after the Great Flood of 1964/65. I spent 3 months in Seattle with my cousins that summer. There was around 10 days of sun for that entire summer, and half of the time was a light to moderate rain. I think that is what can be expected up there this year with parts of Oregon also having s similar cool/wet spring/summer. The rains here in Northern California are still coming in as well. Two nights ago there was a massive 4+ hour downpour, and off and on rains since then. No question that this winter has been exceptional for rain here and further north.
Thanks for the comment. It appears the evidence that CO2 isn’t needed just keeps growing.
And for sudden changes in mountain areas it is now snowing here this morning after rain all night long. This is at 2000′ elevation. Good thing that I did not take my greenhouses down. I noticed that the NH cooled down over the last several days after what looked like the beginning of an early warm trend. This strikes me as exactly the type of weather changes that might be expected as a climate falls into a cooling trend. Farmers may have a hard time in the years ahead anticipating their plantings as a result. That is where things could get interesting for the world at large, if abnormal weather patterns take hold that disrupt plantings and/or harvests.
One last point to add to my first comment. What allowed me to get this far in gaining understanding of weather/climate besides years of reading was finding my Rosetta Stone which consisted of two parts. The first part was Dr Svalgaards great high resolution ssn graph which he posted around 4 years ago, and the second part was the JG/U 2K high resolution tree ring study from the sub arctic region. Then I also have to thank the superior a-holes at The Conversation for sparking a fire in me back at the beginning of 2014 which led to a period of inspiration 3 years ago this month. I haven’t been back to that site since.
I always find it amusing when the so called experts here attempt to dismiss the solar/climate connection by directly comparing solar metrics with temperature. There is most certainly a correlation but it has a two to three year lag and one most compare the change in temperature with the change in solar activity. Not just overlay sunspots with temperature.
http://www.woodfortrees.org/plot/hadsst3gl/from:1980/normalise/derivative/mean:130/plot/sidc-ssn/from:1978/normalise/derivative/mean:130
+LT – Not only that, but 200 years of high solar activity is not going to be erased in 1 or 2 low solar cycles. All that energy is stored somewhere: the oceans.
Joe:
Yes, it is stored in interstellar space,
Question to dr. L. Svalgaard,
1. Looking at the graph in http://jsoc.stanford.edu/data/hmi/polarfield/ , in December 2016, you stated that the South pole reached stability in 2016.0 and that the North pole would reach stability in 2017 at a level a bit higher than where it is now. May I conclude that meanwhile that stabiity is yet reached, due to the flat end of the graph of the North pole we now see?
2. In the same webpage, it is written “As of Nov 2015, the south has exceeded the 2010 level, suggesting that Cycle 25 would be no weaker than 24.” The current data show that the value of the South polar fields is much larger than the North polar fields. Let me use the WSO data. The maximum value in 2004 was 73 (in Jan 2004, smoothed value). Now (Dec 2015), we have a maximum of – 82. The maximum of the current solar cycle is 116.4 (SILSO data, new version). May I deduce that the solar maximum of the next solar cycle could be 116.4 x 82/73 = approximately 130?
Now (Dec 2015),
‘Now’ is not Dec 2015, but March 2017.
It is a bit too early to make a prediction. We need the polar fields to stabilize first. Extrapolating [which is always dangerous] I would guess that SC25 will be a bit [i.e. not much] stronger than SC24.
To complicate matters, WSO has been broken since Dec 2016. See http://www.leif.org/research/WSO-Problem.pdf
We will try to fix the instrument tomorrow [if we can – the electronics is old]. Basically, the measured field has been cut in half of what I think it should be. Keep an eye on my website, where I’ll report on progress [if any].
You may also check http://jsoc.stanford.edu/data/hmi/polarfield/ where you can see that the North has not flattened out yet.
For the relationship between the cosmic ray flux and solar temperatures see Fig 2 at Stozhkov 2017
http://notrickszone.com/2017/03/23/russian-scientists-dismiss-co2-forcing-predict-decades-of-cooling-connect-cosmic-ray-flux-to-climate/#sthash.OI8LqaAV.k21OB7Vx.dpbs. Cf future temp forecasts there in Fig1 with forecast in Page – 2017 Fig 12 in same link.
Note that these real scientists, unlike “climate (ie phony) scientists” actually make falsifiable predictions.
lsvalgaard March 22, 2017 at 12:27 pm
Joe:
Yes, it is stored in interstellar space,
Could I finish that statement, ?
and is the energy by which the heliosphere inflates.
How could I resist thaaat?
lsvalgaard March 22, 2017 at 3:55 pm
—————————————————
Thanks Dr. S. for that WSO update.
And the below seemed to be obscure with respect to those older observations.
Historical Sunspot Observations: A Review
http://www.leif.org/EOS/0702-0702068.pdf
To William Astley, hope to check on some of those links you left above, thanks.
Jobs chaos. Left, for better one, didn’t work out, hired back to the old one.
“What a long strange trip its been.”
and is the energy by which the heliosphere inflates.
Not at all. The size of the heliosphere is not determined but the total energy output of the Sun.
lsvalgaard March 24, 2017 at 10:23 am
——————————————————
Slow down Dr. Svalgaard.
Would you be so kind as to explain what energy you were referring to? ( wrt to the inflation of the heliosphere)
And if the solar wind is currently from more southern coronal holes and the magnetic field strength is weaker in the North wrt to the South. Wouldn’t the whole heliosphere have an asymmetric anomaly? um like flat topped or something?
The discussion was about the energy heating the Earth [i.e. TSI].
The heliosphere inflation is due to the energy in density and speed of the solar wind [millions of time smaller than what hears the Earth. Different physics.
What determines the shape of the heliosphere is the accumulated effects of several years of solar wind, as it just piles up at the outer boundary [doesn’t go poof and disappears].
lsvalgaard March 24, 2017 at 11:35 am
The discussion was about the energy heating the Earth [i.e. TSI].
The heliosphere inflation is due to the energy in density and speed of the solar wind [millions of time smaller than what hears the Earth. Different physics.
What determines the shape of the heliosphere is the accumulated effects of several years of solar wind, as it just piles up at the outer boundary [doesn’t go poof and disappears].
So..as sunspots and coronal holes begin to disappear, it wont be immediately seen in heliospheric inflation.
There will be a lag time. Lag time. Lag time.
Isn’t the heliosphere already flat topped due to the asymmetry in magnetic field strengths N, S? And this would affect GCR propagation inside of the heliosphere. So that as Earth bobs up down N, S of the solar magnetic equator, during the Earth orbital year, we would see more GCR enhancements while above the solar magnetic equator?
we would see more GCR enhancements while above the solar magnetic equator
No, because we see the integral effect of a year of two.
Any particular reason that you push your wrong suggestions?
Usually, people don’t want to learn, but rather to push their own ideas.
Below should be added to last comment.
GCR continue to rise despite high speed solar wind coming from coronal holes.
It is not that simple. The geometry of the solar wind and of the heliospheric current sheet are more important. All of this is well-understood, and there is nothing unusual going on.
Solar Slump: The Sun has been blank for two weeks straight
Anthony Watts / 4 days ago March 20, 2017
Thanks for the update Anthony.
One of the effects of a declining phase of solar cycle, as most of us know, is an increase in Galactic cosmic rays.
Some of us here, use spaceweather.com to get our daily dose of the solar stats.
They have been featuring a balloon study of GCR called, Earth to Sky Calculus.
… Spaceweather.com and the students of Earth to Sky Calculus fly space weather balloons to the stratosphere over California. These balloons are equipped with radiation sensors that detect cosmic rays, a surprisingly “down to Earth” form of space weather. Cosmic rays can seed clouds, trigger lightning, and penetrate commercial airplanes. Furthermore, there are studies ( #1, #2, #3, #4) linking cosmic rays with cardiac arrhythmias and sudden cardiac death in the general population. Our latest measurements show that cosmic rays are intensifying, with an increase of more than 12% since 2015:
http://www.spaceweather.com/cosmicrays/stratosphere_11sep16.png
Why are cosmic rays intensifying? The main reason is the sun. Solar storm clouds such as coronal mass ejections (CMEs) sweep aside cosmic rays when they pass by Earth. During Solar Maximum, CMEs are abundant and cosmic rays are held at bay. Now, however, the solar cycle is swinging toward Solar Minimum, allowing cosmic rays to return. Another reason could be the weakening of Earth’s magnetic field, which helps protect us from deep-space radiation…..
lsvalgaard March 24, 2017 at 11:35 am
What determines the shape of the heliosphere is the accumulated effects of several years of solar wind, as it just piles up at the outer boundary [doesn’t go poof and disappears].
Does it, the pile up at the heliospheric nose, begin to erode, become weaker and allow for more interstellar junk to slide on in?
The hemispheric pressure asymmetry is real, at the nose of the heliosphere. Solar orbit wrt Interstellar wind pressure ‘direction’.
As is the hemispheric asymmetry in the solar activity a real phenomenom.
The answers are still, “blowin in the wind.”
WRT to Earth’s warming anomaly of recent years, more work on tectonics, volcanoes, core ‘pressure’ release mechanisms need to be understood. We have come along way in locating under sea ridges, hydro thermal vents and volcanoes.
Thanks for the venting…
Does it, the pile up at the heliospheric nose, begin to erode, become weaker and allow for more interstellar junk to slide on in?
No, the solar wind is supersonic and nothing ‘slides in’. Cosmic rays are of much higher energy and can spiral in along magnetic field lines, but play no role in the energetics of the heliosphere, just like a cork thrown into a river does not impede the flow of the water.
Now that mostly everything was said and done, one may be forgiven to think that there is no meaningful link between solar activity and the instrumental temperature records.
That may or may not be so, but the data does show a degree of ‘familiarity’, consequently perhaps it would be wise, at least for the time being, to conclude that ‘we simply don’t know’
http://www.vukcevic.talktalk.net/GTC.gif
vukcevic March 24, 2017 at 12:53 pm
Hi Vuks, could you elaborate on North Atlantic tectonic counts for us.
V0 and above
Check this out Vuks. Woweeee were on our way..
Heat from Earth’s core could be underlying force in plate tectonics
Greg Borzo
January 17, 2017
https://news.uchicago.edu/article/2017/01/17/heat-earths-core-could-be-underlying-force-plate-tectonics
For decades, scientists have theorized that the movement of Earth’s tectonic plates is driven largely by negative buoyancy created as they cool. New research, however, shows plate dynamics are driven significantly by the additional force of heat drawn from the Earth’s core.
The new findings also challenge the theory that underwater mountain ranges known as mid-ocean ridges are passive boundaries between moving plates. The findings show the East Pacific Rise, the Earth’s dominant mid-ocean ridge, is dynamic as heat is transferred.
….The researchers estimate up to approximately 50 percent of plate dynamics are driven by heat from the Earth’s core and as much as 20 terawatts of heat flow between the core and the mantle……
The heat we get from the Sun is 5600 times larger than the heat we get from below. So we can discount the latter as far as the heat budget of the atmosphere goes.
N. Atlantic’s intermediate and deep-water currents (ocean conveyor belt) crisscross the MAR whereby stratification is affected by the narrow vertical band of the concentrated heat originated from below.
http://www.mar-eco.no/learning-zone/__data/page/112/current-map3.jpg
So? there is not enough energy in any of this to have any effect on the climate.
Thanks Dr. S.
But I had to take a lookey see for myself.
The image below is from 2010.
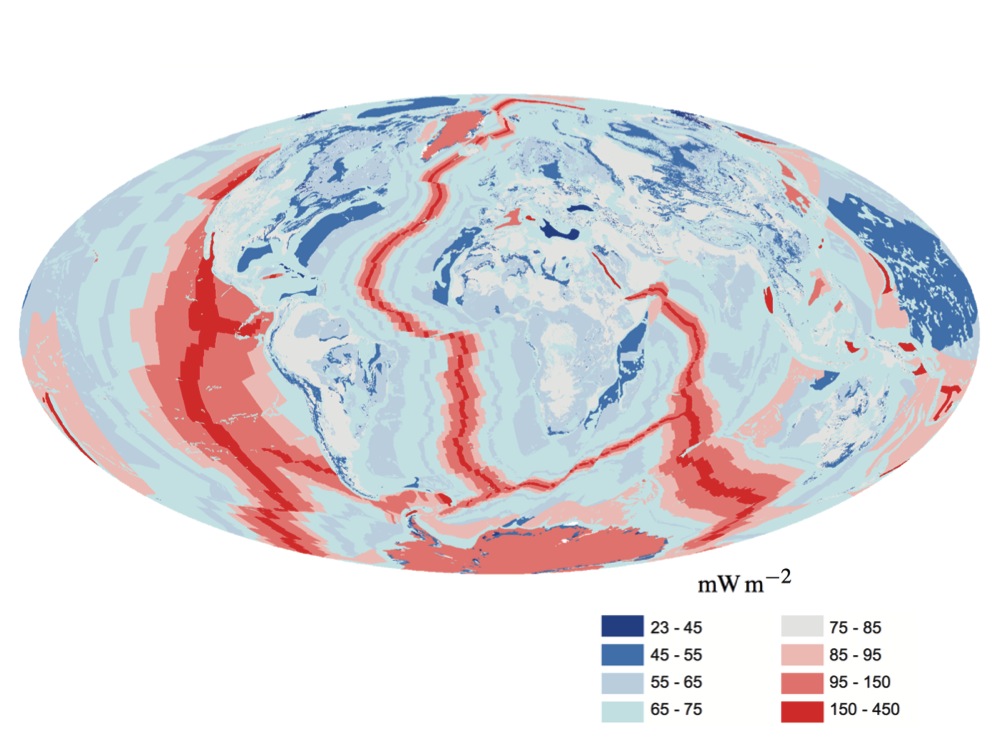
Global map of the flux of heat, in mW/m2, from Earth’s interior to the surface.[1] The largest values of heat flux coincide with mid ocean ridges, and the smallest values of heat flux occur in stable continental interiors.
J. H. Davies and D. R. Davies – Davies, J. H., & Davies, D. R. (2010). Earth’s surface heat flux. Solid Earth, 1(1), 5-24.
The number you see are milliwatt [one thousandth of a Watt]. Note how puny the heat actually is.
Here’s a newer version Dr. S. I’ll look again, might be something even newer….
Global map of solid Earth surface heat flow
Authors
J. Huw Davies
First published: 19 October 2013
http://onlinelibrary.wiley.com/store/10.1002/ggge.20271/asset/image_n/ggge20271-fig-0007.png
Global map of Earth Surface Heat Flow, in mW m−2. It uses the individual components given by Figures 2-4. All component estimates were derived using the mean.
in mW m−2
In milliwatt
Completely negligible
Have to link to the full article, image wont paste here.
Global map of solid Earth surface heat flow
Authors
J. Huw Davies
First published: 19 October 2013
http://onlinelibrary.wiley.com/doi/10.1002/ggge.20271/full
“So? there is not enough energy in any of this to have any effect on the climate”
directly but ‘enough energy’ to slightly increase the temperature of the deep-water current crossing the MAR and consequently affecting efficiency of the deep conveyor pump (deep meridional overturning cell) operating south-west of Iceland.
However, science advances with the mindset changed.
So we went from “20 terawatts of heat flow between the core and the mantle.” To only milli watts by the time it reaches the Ocean floor?
I know you said milli watt negligible Dr. S., but before I have my first drinky pooh for this week, I will wonder what happened to the, 20 terawatts of heat flow between the core and the mantle……

Until next time…
the 25 terawatt is 200 milliwatt per square meter at the core-mantle boundary and 50 milliwatt per square meter at the surface. Can’t people compute anymore? Jeez.
So if Earth’s rotation slows down, when solar wind pressure is high, like over an extended period of time, like a not so grand solar maximum period, the core might heat up.
Then we might expect Earth’s rotation to speed up, over a period of time, like a solar minimum period, when we see extended periods of lower solar wind pressures and Earth’s core cools down.
So if Earth’s rotation slows down, when solar wind pressure is high, like over an extended period of time, like a not so grand solar maximum period, the core might heat up.
No, this is complete nonsense.
Could you please then explain why the Earth’s rotation is sometimes faster and sometimes slower and how that might change eccentricity, pole locations, core heating/cooling, generation of magnetic fields, tectonics and on and on and on….
Prolly not..
The Earth’s rotation varies as the climate [temperature] varies. None of the other things you mention are influence by that.
Bidecadal earth’s rotation variability is concurrent with the solar magnetic cycles oscillations.
https://hal.archives-ouvertes.fr/hal-01071375v2/document
No, there are not. The variations are caused by coupling between the core and the mantle. This is well-established. The Sun has nothing to do with this.
It’s not the burning of fossil fuels, it’s the extraction of fuels from the Earth that puts a sinking feeling in my gut.
No, Carla not sinking, SUBSIDENCE!
Leif Would you care to comment on this new Russian data.?
http://notrickszone.com/wp-content/uploads/2017/03/Cooling-Cosmic-Rays-Stozhkov-2017.jpg
This is Fig 2 at
http://notrickszone.com/2017/03/23/russian-scientists-dismiss-co2-forcing-predict-decades-of-cooling-connect-cosmic-ray-flux-to-climate/#sthash.OI8LqaAV.k21OB7Vx.dpbs. Cf future temp forecasts there in Stozhkof Fig1 with forecast in Page – 2017 Fig 12 in same link.
Their Figure 1 seems to contradict the whole paper:
http://notrickszone.com/wp-content/uploads/2017/03/Cooling-Predicition-Cosmic-Rays-Stozhkov-2017.jpg
Solar activity has gone down since 1960 and cosmic ray intensity therefore has gone up, yet temperatures have also gone up, showing that when the sun cools, the earth warms [at least since 1960]. There is no evidence [other than wishful curvefitting] for the extrapolation shown in Figure 1.
lsvalgaard March 24, 2017 at 3:20 pm
“So? there is not enough energy in any of this to have any effect on the climate”
The MAR hydrothermal plumes initial temperature is in the range of 300-400C with PH of 2, can be many km long and rise to height up to 3km before temperature and PH are equalised with surrounding ocean’s water mass.
‘Enough energy’ to change stratification of the deep-water current crossing the MAR and consequently affecting efficiency of the deep conveyor pump (deep meridional overturning cell) operating south-west of Iceland.
http://www.mar-eco.no/learning-zone/__data/page/112/current-map3.jpg
hydrothermal plumes initial temperature
Overall, we are talking about milliwatt compared to hektowatt. Completely negligible.
Polar jet stream is a powerful atmospheric circulation and yet it gets deflected by static high pressure (with comparatively very little energy) to the southwest of Iceland.
North Icelandic Jet is a deep-reaching ocean current that contributes to a key component of the Atlantic Meridional Overturning Circulation (AMOC), also known as the “great ocean conveyor belt,” which is critically important for regulating the Earth’s climate. The NIJ crosses the MAR both to the north and the southwest of Iceland.
Two Icelandic ‘control knobs’ of the N. Hemisphere’s climate natural variability. bye bye
Perhaps you need a short course in where the Earth’s atmosphere gets it energy from:
http://www.leif.org/research/Where-Does-The-Atmosphere-Get-Its-Energy-From.png
No I’m not going there, it is wise to steer clear of specialist’s obfuscations.
I don’t need to tell you that foot on the break/accelerator doesn’t provide energy for your car. Similarly I don’t need to state that the MAR doesn’t provide the energy either for warming or cooling. The MAR’s heat energy is a ‘foot on/off ‘ the brake on the deep ocean currents (the key component of the Atlantic Meridional Overturning Circulation -AMOC) criss-crossing the ‘boiling hot’ rift valley that runs along the axis of the ridge.
Further more there is some correlation between solar and N. Atlantic tectonic activity (see graph posted at March 24, 2017 at 12:53 pm)
No I’m not going there
Being learning-resistent again?
foot on the break/accelerator doesn’t provide energy for your car.
What brakes the car is not the foot, but the friction in the brake assembly. And there is what the energy is.
Your analogy with MAR and the foot is obviously false, especially since the thermal energy from below does not vary in time scales of interest.
“thermal energy from below does not vary in time scales of interest.”
Both variables the N. Atlantic tectonic count and the 11 year change in the Group Sunspot Number have 6 major peaks since 1650’s, which makes is it 60 year periodicity, btw the same as the well known component as found in the so called ‘global temperatures’.
You may not like it, but there it is in the data.
It is not in the data, but in your head. The ‘change’ in the group number is not a meaningful variable for this.
Study this to learn about spurious correlations http://www.tylervigen.com/spurious-correlations
Thanks, Doc- That link is a hoot!
vukcevic March 25, 2017 at 2:53 am
Bidecadal earth’s rotation variability is concurrent with the solar magnetic cycles oscillations.
https://hal.archives-ouvertes.fr/hal-01071375v2/document
————————————————-
Thanks Vuks,
From your article,
“”Analysis shows that the LOD variability follows
change in the solar magnetic field orientation. The Earth’s
rotation acceleration is concurrent with decay of the even and
continues during rise of the odd cycles. The rotation
deceleration is concurrent with decay of the odd and continues
during rise of the even cycles ; in other words change in the rate
of the Earth’s rotation follows the hemispheric sunspots’
magnetic (Hale) cycle as shown in the Fig.2″”
I do think that there can be external ‘components’ influencing LOD, Earth rotation speed.
Aside from the above. A good whack from a sizable space rock might mess rotation up for a while, as an example.
I have seen some other articles that tried to link LOD to the rise and fall of solar cycle.
Gotta check the spaceweather thread started here at WUWT.
I have seen some other articles that tried to link LOD to the rise and fall of solar cycle
The internet is a good medium for dissemination of misinformation to the gullible.
The LOD component concurrent with solar magnetic field cycles is about 25% of the total, if I remember correctly.
There are no LOD variations caused by your artificially constructed double solar cycle. Decadal [and longer] variations are caused by core-mantle interactions and have nothing to do with solar magnetism that cannot penetrate that deep.
It is nowhere said so. Obviously you didn’t bother to read either ‘Discussion’ or ‘Conclusion’ sections before you made the out of place comment.
The LOD component concurrent with solar magnetic field cycles
So, you retract the above and now claim that there is no physical or causal relationship.
“nowhere said” that there was.
I did read the conclusion:
“However, at this stage of the research, it is not possible to attribute cause directly to the solar activity, while possibility of viable indirect mechanism can not be excluded.”
The first part is correct. The second part [about indirect mechanism] does not follow from the ‘analysis’. You might as well have said: “possibility of the Moon made of green cheese can not be excluded”. Your ‘analysis’ does not show that an indirect cause cannot be excluded. Physics excludes such mechanism.
“viable indirect mechanism can not be excluded.”
such as : “Solar activity – ocean & atmospheric temperatures – oceanic and atmospheric circulation – angular momentum exchange – Earth’s rate of rotation (LOD) – secular change in perceived
geomagnetic field.
“green cheese” is fine, if you like that sort of thing, but not for me thanks, at least not on this occasion.
You do not examine if there is enough energy or physical couplings so you have no basis for saying that those mechanisms cannot be excluded since you have not looked at how they might work. Your statement is void of meaning and looks like a lame attempt of CYA.
One CAN exclude all of your proposed mechanisms on grounds of lacing energy of physical coupling.
Title of the paper is:
“Evidence of length of day (lod) bidecadal variability concurrent with the solar magnetic cycles” and that is what is meant then, now and in the foreseeable future, until refuted.
‘concurrent’ means ‘at the same time’ or ‘simultaneously’, but doesn’t mean that one is caused by the other.
If they were not, there is no need to pretend [or peddle] that they are. That you post on this shows that you believe they are. If you really meant that they were just random occurrences your comment would not make sense.
But, now you are saying that there really is no connection. Fair enough.
Jury is still out on the Solar/LOD connections..Dr. S.
The PPT below covers the period depicting the overall decline of the recent solar cycles.
European Geosciences Union, General Assembly 2016
Vienna | Austria | 17 – 22 April 2016
On searching applicants for mechanism of solar-lithosphere relations
Kairatkyzy D., kairatkyzy.dina@mail.ru, Andreev A. alexey.andreyev@rambler.ru, Saltanat Zhumabayeva, Alibek Seraliyev
“Institute of Ionosphere”, “National Center for Space Research and Technology”, Almaty, Kazakhstan
Conclusion
For the time interval of 42 years (1973 – 2014) the variations in solar activity, the LOD, global seismic activity are analyzed. It is shown that a long-term increase in global seismic activity is accompanied by a long-term decrease in the level of solar activity, and a long-term decrease in the LOD (increase in the Earth’s angular velocity). The subject of our further research will be a study of long-term variations of the amplitudes of tidal LOD harmonics in relation with variations of solar and seismic activities….””””
Jury is still out on the core heat flows and the amount of heat on ocean floors from volcanoes, vent fields and tectonic activity.
Diffuse venting at the ASHES hydrothermal field: Heat flux and tidally modulated flow variability derived from in situ time-series measurements
http://onlinelibrary.wiley.com/doi/10.1002/2015GC006144/full
Eric Mittelstaedt, Daniel J. Fornari, Timothy J. Crone,
James Kinsey, Deborah Kelley, Mitch Elend
27 April 2016
Abstract
…ASHES hydrothermal field located in the caldera of Axial Seamount, Juan de Fuca Ridge…
…Over the ∼12 day deployment, median upwelling rates and mean fluid temperature anomalies ranged from 0.5 to 6 cm/s and 0°C to ∼6.5°C above ambient, yielding a heat flux of 0.29 ± 0.22 MW m−2 and heat output of 3.1± 2.5 kW. Using a photo mosaic to measure fracture dimensions, the total diffuse heat output from cracks across ASHES field is estimated to be 2.05 ± 1.95 MW. Variability in temperatures and velocities are strongest at semidiurnal periods and show significant coherence with tidal height variations. These data indicate that periodic variability near Phoenix vent is modulated both by tidally controlled bottom currents and seafloor pressure, with seafloor pressures being the dominant influence. These results emphasize the importance of local permeability on diffuse hydrothermal venting at mid-ocean ridges and the need to better quantify heat flux associated with young oceanic crust….
The PPT below covers the period depicting the overall decline of the recent solar cycles.
Very clever. No PTT.
Your second quote is not relevant as it is not concerned with climate and is nothing new.
No PPT.
The link to the Power Point Presentation PPT titled, “On Searching Applicants for Mechanism of Solar-Lithoshphere Relations,” below.
European Geosciences Union, General Assembly 2016
Vienna | Austria | 17 – 22 April 2016
On searching applicants for mechanism of solar-lithosphere relations
https://www.google.com/url?sa=t&rct=j&q=&esrc=s&source=web&cd=3&cad=rja&uact=8&ved=0ahUKEwj3mPeiwfLSAhWE7yYKHXYGCvkQFggkMAI&url=http%3A%2F%2Fpresentations.copernicus.org%2FEGU2016-11429_presentation.ppt&usg=AFQjCNG95yTXtETUUFPGWic7woRFpOg0aA
Abstract here:
On searching applicants for mechanism of solar-lithosphere relations
http://adsabs.harvard.edu/abs/2016EGUGA..1811429K
The increase in earthquakes over solar cycle 24 is as striking as the temperature anomaly for the same period.
http://www.leif.org/research/LOD-Variation.png
But nothing about LOD.
If you would care to look for yourself:
http://www.leif.org/research/LOD-Variation.png
you could see how flimsy that and other claims are.
gripegut on March 22, 2017 at 9:02 pm
I really don’t know how long these types of volcanic eruptions affect temperature, nor do I know what level of solar activity was occurring in the 300 years before the Maunder Minimum, but my guess is that the volcanic eruptions caused much of the cooling before the Maunder Minimum.
Let me continue our little discussion…
In 2012 an interesting article was published concerning that point:
‘Abrupt onset of the Little Ice Age triggered by volcanism and sustained by sea-ice/ocean feedbacks’
http://onlinelibrary.wiley.com/doi/10.1029/2011GL050168/pdf
It was tho origin of many contradicting reactions, especially here at WUWT (from Anthony Watts as well as from Willis Eschenbach), together with a more convincing one from 6 scientists:
‘Reply to Miller et al. (2013) Substantial agreement on the timing and magnitude of Late Holocene ice cap expansion between east Greenland and the eastern Canadian Arctic: a commentary on Lowell et al. (2013)’
http://www.geology.um.maine.edu/publications/lowelletalreply2013.pdf
Somewhat later however, the origin of the 1257 eruption was detected by a group of scientists:
‘Source of the great A.D. 1257 mystery eruption unveiled, Samalas volcano, Rinjani Volcanic Complex, Indonesia’
http://www.pnas.org/content/110/42/16742.full
Another very interesting publication in 2015 :
‘Indications for a North Atlantic ocean circulation regime shift at the onset of the Little Ice Age’
It is kept behind paywall
http://link.springer.com/article/10.1007/s00382-015-2561-x
but the submission revision is free
http://www.pik-potsdam.de/~carls/publications/schleussner_divine15_draft.pdf
This recent paper is hard to digest but shows in very impressive manner how scientists managed to detect a rather abrupt, local transition from the MWP to the LIA by using several disjunct proof paths.
lsvalgaard March 25, 2017 at 8:08 am
No, there are not. The variations are caused by coupling between the core and the mantle. This is well-established. The Sun has nothing to do with this.
—————————————————————-
I decided to start a list of possible mechanisms affecting, Earth Rotation LOD.
1. coupling, core and mantle (core rotation speed)
2. Lunar and solar tides and gravity
3. Solar winds, density and magnetic pressure
4. Orbital drag and orbital speed 18.5 miles/sec (30 km/sec)
5. Other stresses, natural and
Coincidentally, the Earth has been speeding up since the suns magnetic field has been on the decline.
http://ars.els-cdn.com/content/image/1-s2.0-S1674984716300283-gr1.jpg
http://www.leif.org/research/Solar-Polar-Fields-1966-now.png
1 and 2 are possible, even plausible.
The rest are not.
Coincidentally, the Earth has been speeding up since the suns magnetic field has been on the decline.
Following, also, coincidentally, the movement of the Dow-Jones Index:
http://www.leif.org/research/DJI-1962-2017.png
Carla
Here is nice picture to help you finalise your list
Note that none of external causes have any influence on the core-mantle interface,
except Carla’s number 2 [Lunar and solar tides] which is not even on your Figure.
Also, note that there is no reference to any solar influence.
yes, it is, the little b/w stick marked ‘tide gauge’.
Indeed, yes, I missed that irrelevant fact that has no long-term variation on time scales we care about.
note that there is no reference to any solar influence.
For better understanding of tidal forces I am tempted to recommend this short article by Charles Chandler despite a somewhat dubious inverted sunspot cycles graph (‘ala’ vukcevic) by P.D. Jose.
Chandler’s ‘knowledge’ about the Sun is completely lacking: “Sun is comprised of charged double-layers” is complete nonsense. As well as his notion that it is an electric field that causes the tides. Complete nonsense. Chandler is an MD and knows very little about all this.
Einstein said it best:
“Most men revere words that they cannot understand and consider a writer whom they can understand to be superficial”
http://physicstoday.scitation.org/doi/pdf/10.1063/1.2811395
“Solar activity – ocean & atmospheric temperatures – oceanic and atmospheric circulation – angular momentum exchange – Earth’s rate of rotation (LOD) – secular change in perceived geomagnetic field.” Vukcevic at al , it’s all in there.
auto spell correction is a wonderful invention, but not this time: Vukcevic et al
Indeed, yes, I missed that irrelevant fact that has no long-term variation on time scales we care about.
note that there is no reference to any solar influence.
My reply went into wrong place, but seriously: who cares about ‘at al’ vs ‘et al’
Beyond Malankovitch: https://www.youtube.com/channel/UCKE0qdPuLg2l0IWnSfgsBSg