Guest post by David Middleton
From the No Schist, Sherlock files…

The “record low wintertime maximum extent” still looks pretty icy.
| OSLONatural swings in the Arctic climate have caused up to half the precipitous losses of sea ice around the North Pole in recent decades, with the rest driven by man-made global warming, scientists said on Monday.
The study indicates that an ice-free Arctic Ocean, often feared to be just years away, in one of the starkest signs of man-made global warming, could be delayed if nature swings back to a cooler mode.
Natural variations in the Arctic climate “may be responsible for about 30–50 percent of the overall decline in September sea ice since 1979,” the U.S.-based team of scientists wrote in the journal Nature Climate Change.
Sea ice has shrunk steadily and hit a record low in September 2012 — late summer in the Arctic — in satellite records dating back to 1979.
The ice is now around the smallest for mid-March, rivaling winter lows set in 2016 and 2015.
The study, separating man-made from natural influences in the Arctic atmospheric circulation, said that a decades-long natural warming of the Arctic climate might be tied to shifts as far away as the tropical Pacific Ocean.
“If this natural mode would stop or reverse in the near future, we would see a slow-down of the recent fast melting trend, or even a recovery of sea ice,” said lead author Qinghua Ding, of the University of California, Santa Barbara.
[…]

But wait! What’s that? It looks like an ominous email!!!
But in the long term the build-up of man-made greenhouse gases would become an ever more overwhelming factor, he wrote in an e-mail.
Oh no!!! A scientist “not involved in the study” is now confirming the ominous email!!!
“Looking ahead, it is still a matter of when, rather than if, the Arctic will become ice-free in summer,” said Ed Hawkins, of the University of Reading, who was not involved in the study.
“This is the worst of the worst catastrophes in the world! Oh, it’s crashing … Oh, the humanity! Honest, I can hardly breathe. I’m going to step inside where I cannot see it.”
Please say it ain’t so!!!
The melt of the Arctic is disrupting the livelihoods of indigenous peoples and damaging wildlife such as polar bears and seals while opening the region to more oil and gas and shipping.

On a somewhat more serious note…
NATURE CLIMATE CHANGE | ARTICLE
Influence of high-latitude atmospheric circulation changes on summertime Arctic sea ice
Qinghua Ding, Axel Schweiger, Michelle L’Heureux, David S. Battisti, Stephen Po-Chedley, Nathaniel C. Johnson, Eduardo Blanchard-Wrigglesworth, Kirstin Harnos, Qin Zhang, Ryan Eastman & Eric J. Steig
Nature Climate Change (2017) doi:10.1038/nclimate3241
Received 26 July 2016 Accepted 03 February 2017 Published online 13 March 2017
Addendum
Perspective: NSIDC Arctic Sea Ice Index Interactive Graph


The five earliest years of data plot near +2 standard deviations. The five most recent full years of data plot near or just outside of -2 standard deviations. Ding et al., 2017 conclude that up to half of the difference is due to the NAO and other natural climate fluctuations.

1979 was not that long ago, and was near the start of satellite monitoring of the ice cap, so there are serious questions about the real long-term variability in ice. What was the ice coverage in the 1930’s and early 1940’s?
An “oldie, but a goody“…
Guest post by David Middleton
The recent return of the Warming Island AGW myth inspired me to build a climate reconstruction for the Greenland Sea region.
Temperature Reconstruction
I performed a GISS station search centered on 71.4 N latitude, 23.5 W longitude and downloaded the 12 GISS/GHCN instrumental records with at least 60 years of continuous data up to 2011.
[caption id="" align="aligncenter" width="479"]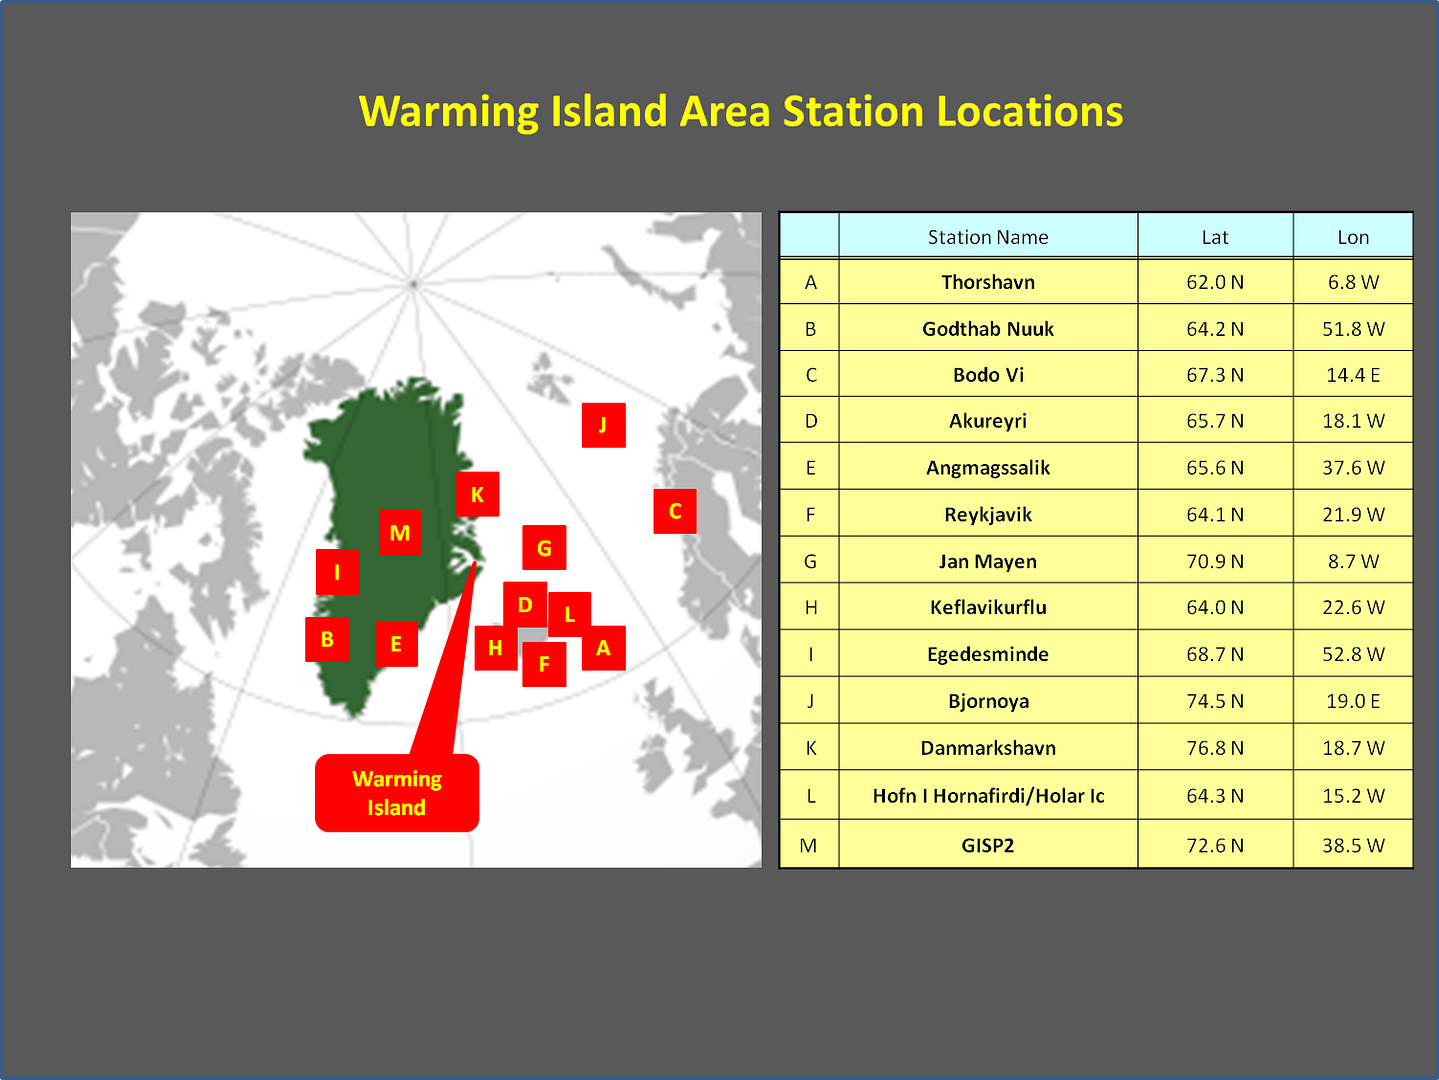 Fig. 1) Station Location Map[/caption]
Next I calculated a temperature anomaly relative to 1961-1990 for each of the 12 stations and then averaged them together to create a temperature reconstruction. The climate in the Warming Island area is statistically indistinguishable from that of the 1930’s.
[caption id="" align="aligncenter" width="479"]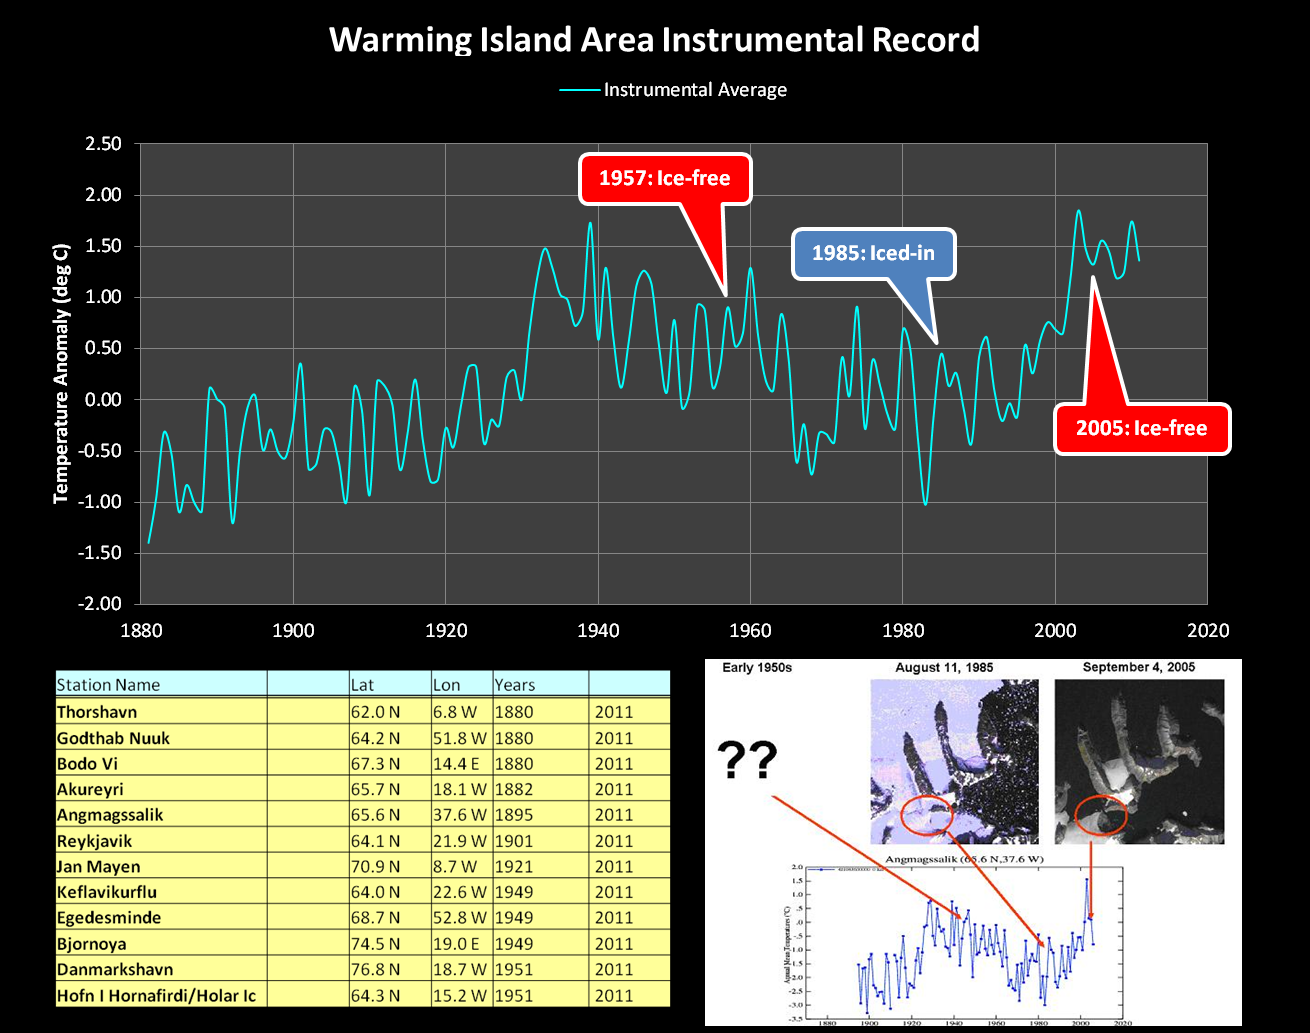 Fig. 2) Warming Island Area: Instrumental temperature reconstruction.[/caption]
Then I took that reconstruction back to 1000 AD with the GISP2 ice core Ar-N2 data (Kobashi et al., 2010)…
[caption id="" align="aligncenter" width="479"] Fig. 3) Warming Island Area: Instrumental reconstruction combined with GISP2 ice core reconstruction.[/caption]
The Modern Warming is also statistically indistinguishable from the Medieval Warm Period in the Warming Island / Greenland Sea region.
Arctic Sea Ice Reconstruction
It occurred to me that there might just be a relationship between the temperature anomaly and the Arctic sea ice extent. So I went to Wood for Trees and downloaded the historical NSIDC Arctic Sea Ice Index. Then I cross plotted an annual 13-month running average of the sea ice index against the average of the station anomalies and the GISP2 reconstruction (Kobashi et al., 2010) and found a pretty good correlation (R-squared = 0.67)…
[caption id="" align="aligncenter" width="479"]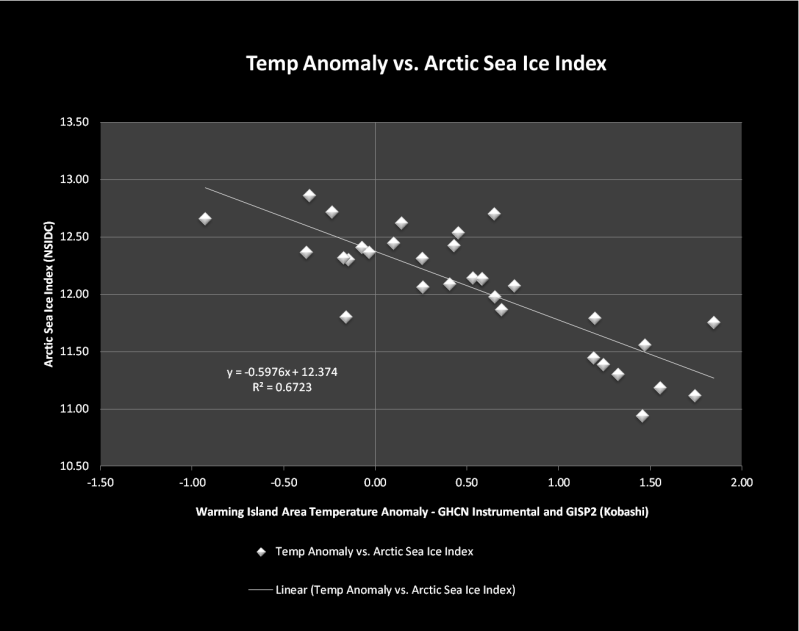 Fig. 4) Warming Island Temperature Anomaly vs. NSIDC Arctic Sea Ice Index.[/caption]
Using the equation “Sea Ice Index = (-0.5976 * Temp. Anom.)+12.374” I calculated a Model Sea Ice Index.
The “Model Sea Ice Index” (white curve) is very similar to the measured sea ice index (cyan curve)…
[caption id="" align="aligncenter" width="479"]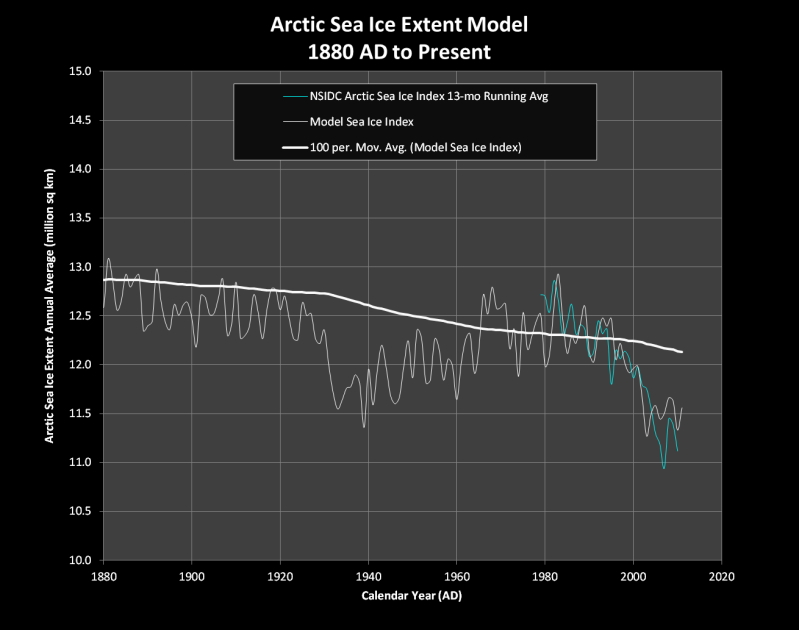 Fig. 5) Arctic Sea Ice Extent Model: 1880 AD to present.[/caption]
Using the same equation, I extrapolated the Model Sea Ice Index back to 1000 AD using the GISP2 temperature data from Kobashi et al., 2010…
[caption id="" align="aligncenter" width="479"]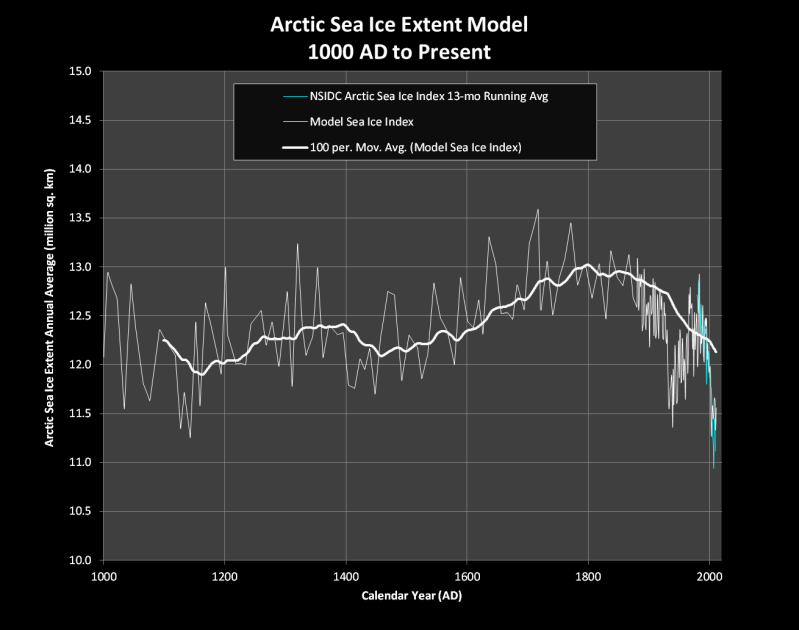 Fig. 6) Arctic Sea Ice Extent Model: 1000 AD to present.[/caption]
The model suggests that Arctic sea ice had been steadily expanding from ca. 1150 AD up until ca. 1800 AD and has been declining since ca. 1800 AD.
Next, I carried the model back to the Early Holocene using the Alley, 2000 GISP2 reconstruction…
[caption id="" align="aligncenter" width="479"]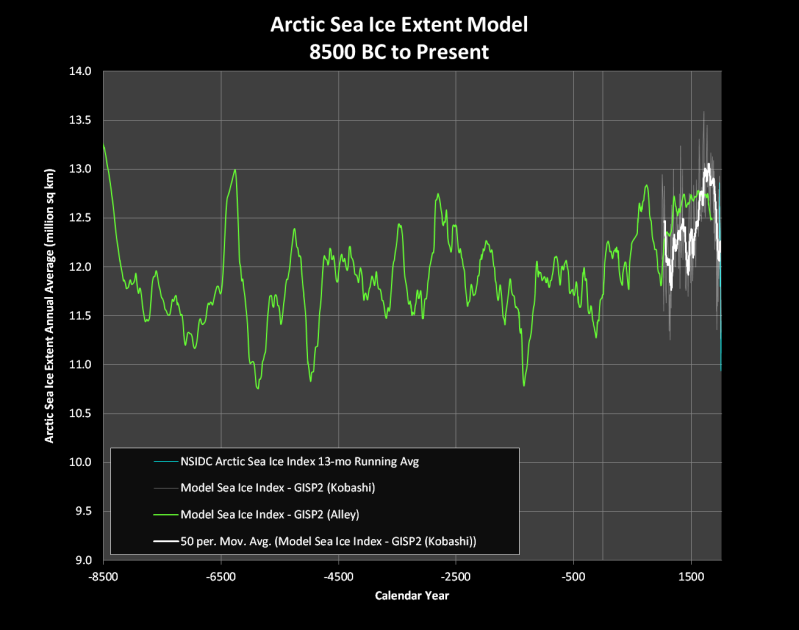 Fig. 7) Arctic Sea Ice Extent Model: Holocene[/caption]
This suggests that the sea ice contraction during the instrumental era (1979-2011) is not particularly remarkable.
Calibrating the Model
Realizing that my model has been extrapolated about 8,000 years away from real data, I decided to compare it to some real data. McKay et al., 2008 demonstrated that the modern Arctic sea ice cover is anomalously high and the Arctic summer sea surface temperature is anomalously low relative to the rest of the Holocene…
[caption id="" align="aligncenter" width="479"]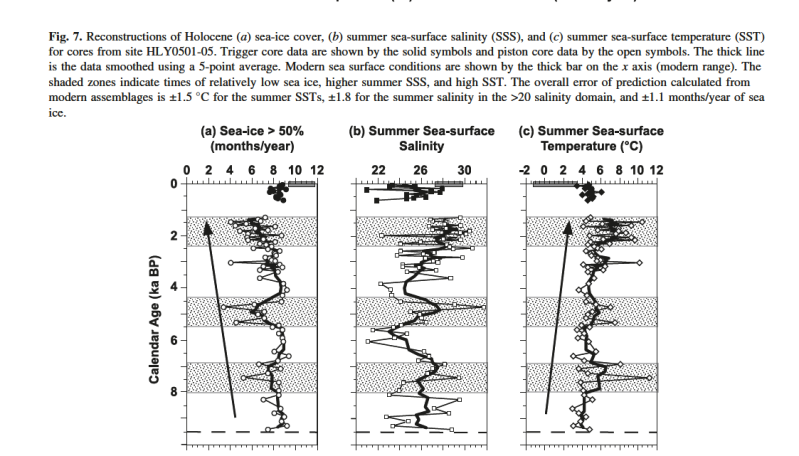 Fig. 8) Chukchi Sea Ice Extent: Holocene.[/caption]
My GISP2 (Alley, 2000) sea ice model is generally consistent with McKay et al., 2008…
[caption id="" align="aligncenter" width="480"]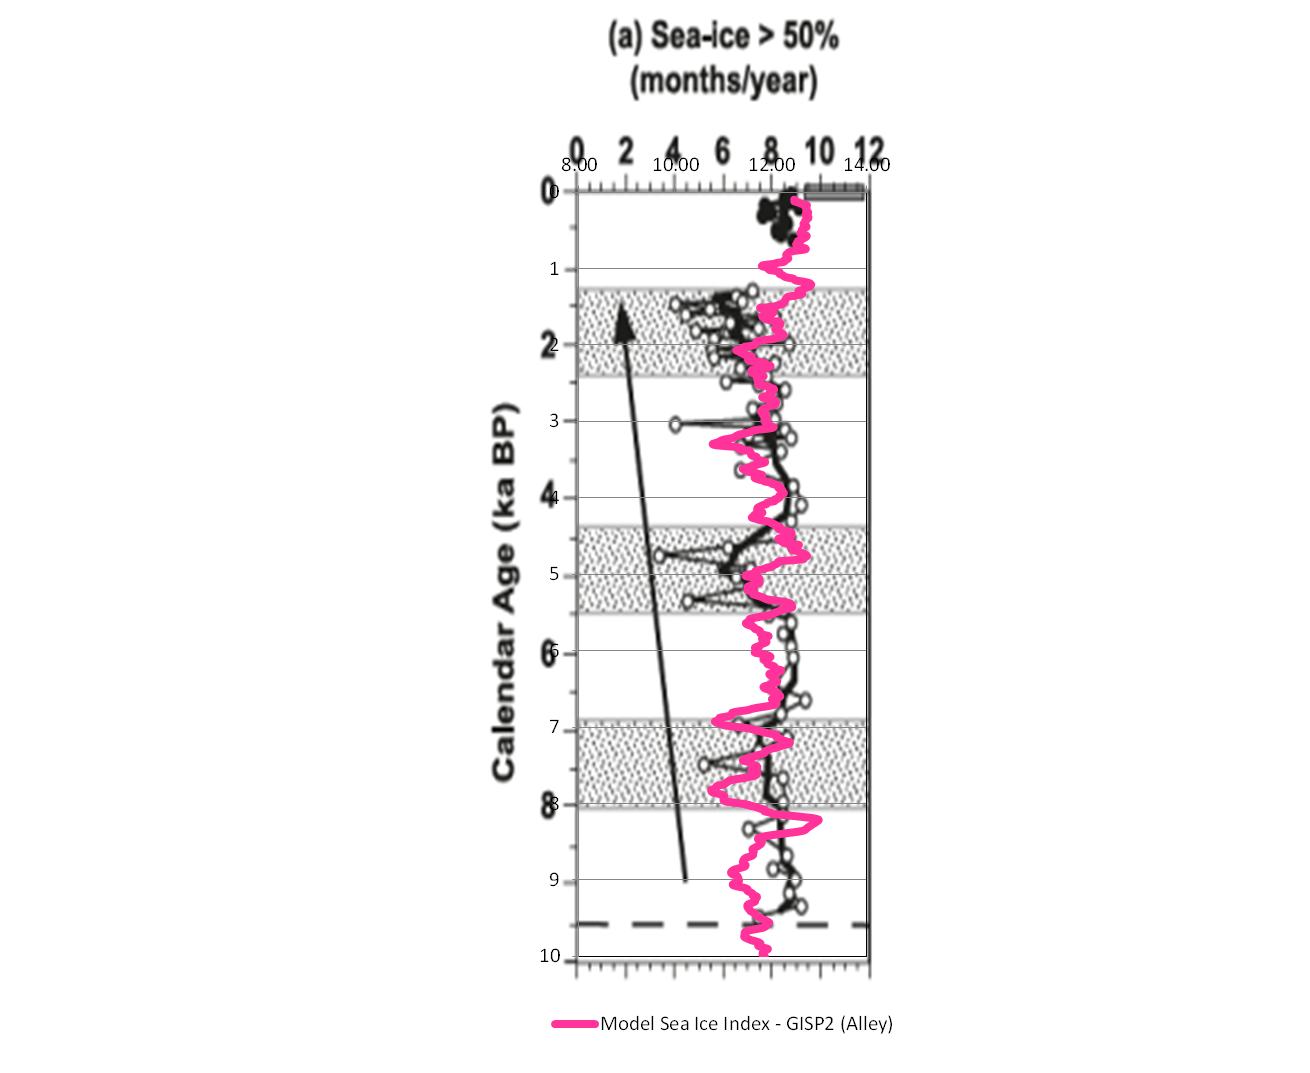 Fig. 9) Comparison of Arctic sea ice extent model to Chukchi Sea ice cover.[/caption]
Conclusion
“Move along, there’s nothing to see here.” The Arctic sea ice has “been there and done that” many times over the last 10,000 years without any anthropogenic assistance.
References
Alley, R.B. 2000. The Younger Dryas cold interval as viewed from central Greenland. Quaternary Science Reviews 19:213-226.
Kobashi, T., J.P. Severinghaus, J.-M. Barnola, K. Kawamura, T. Carter, and T. Nakaegawa. 2010. Persistent multi-decadal Greenland temperature fluctuation through the last millennium. Climatic Change, Vol. 100, pp. 733-756.
McKay, J.L., A. de Vernal, C. Hillaire-Marcel, C. Not, L. Polyak, and D. Darby. 2008. Holocene fluctuations in Arctic sea-ice cover: dinocyst-based reconstructions for the eastern Chukchi Sea. Can. J. Earth Sci. 45: 1377–1397
Michaels, P. 2008. “Warming Island”—Another Global Warming Myth Exposed.World Climate Report.
Worth repeating. –AGF
Please get rid of the stupid, irritating gifs. They make it damned impossible to concentrate on reading the text and add nothing.
Beautiful! And at what $meg cost to the taxpayers for this excellent work?
Outstanding bit of sleuthing. I could call it scientific research, but the term “scientific” has picked up a bit of an odour in the last couple of decades. I thought connecting your work to that of the late Sherlock Holmes would be more flattering.
Ever notice just how rapidly every climate parameter you want to study changes.
So they all plot as sharp jagged zig zaggy graphs.
One thing you can say about such graphs; you could call it a Tautology, is that the AVERGAGE is ALWAYS somewhere in between the extreme limit values.
Ergo, the AVERAGE …. IS …. a point on the graph; maybe even several points on the graph.
It is also eminently clear; blatantly obvious, that the climate parameter values spends approximately ZERO time at the average value. Not quite zero since the value does go through the average; but damn near zero.
Ergo, the AVERAGE value of the plotted variable is most certainly not a representative value to use for that variable.
For one thing, the variable spends so little time at the average value, that it is virtually impossible for anybody to ever catch a climate variable value, and measure and observe it at its average value, in order to find out what happens at that average value.
So what purpose is served by calculating something that is not even observable, and certainly is not anything special.
G
“The climate in the Warming Island area is statistically indistinguishable from that of the 1930’s.”
I’m lovin’ it! 🙂
“Beautiful! And at what $meg cost to the taxpayers for this excellent work?”
That’s what I was thinking, too. Here we have people all around the world being paid millions to do what David knocks out over the weekend. You are underpaid, David, whatever it is.
Greg @8:22am
Yes, I totally agree…the animated gifs are really annoying and a distraction…a still amusing image/cartoon does add interest but these do not!
The arctic was as close to being ice-free in 1940 as it has been the last few years. Several papers published in the late 30s in the Monthly Weather Review discuss it.
Mr. Small, can you provide a link or source?
For Sunsettommy.
You can find a source on WUWT here : ” David Small
March 14, 2017 at 9:03 am ”
G
Here is the US Department of Energy 1985 plot showing Arctic ice extent (5 year mean) from 1920 to 1975.
You will note that in about 1945 it dipped to about 5.8 million sq km, with similar dips in 1953/54 and 1960. Today, say 2013, 2014, 2015 would appear very similar. 2012 was of course lower and 2015/16 was an El Nino year so let us see how thing pan out through to 2020.

Griff, polar bear alert klaxon!
Best you get here quick to tell us all how endangered the poor cuddly creatures are.
On Svalbard you have to carry a firearm and know how to use it. link Similarly, field parties operating in the Canadian Arctic under the aegis of the PCSP are supposed to be equipped with firearms. link
The sign says ‘Manitoba’ and I assume it’s from around Churchill. There are probably places near Churchill where it’s more likely to bump into a polar bear but there have been many occasions when the bears have wandered into town. If you’re in Churchill, polar bear avoidance is not guaranteed.
My own technique for dealing with polar bears is virtually foolproof. Just stay at least a thousand miles away from the arctic. So far it’s worked 100%.
To support your position, commiebob, I will point out that here in Queensland we have had very few attacks by wild polar bears since official records started. Nor do the Aborigines report a tradition of bear attacks from before white settlement.
OT Happy Pi Day
Well spotted!
I do believe a lot of these scientists have a friend in common.
Jack.
Jack Schist.
Al least the great walkback has started,at least to a minor degree.
I’ve met Jack Schmitt… But I don’t know Jack Schist… /Sarc
In St. Louis you can buy your car from Jack Schmidt. You can easily imagine his commercials.
I used to live in St Louis (County).
And when I told people my name was …. smith …. their next question was: ” Izza dt or two t’s ??
G
But not a peep about changes in Arctic Ocean currents. Hmmmm.
Like this?
Nov 2007 – NASA Sees Arctic Ocean Circulation Do an About-Face
Income inequality and a lack of diversity certainly should not be overlooked as drivers of Artic sea ice loss. Also I beleive in “one holy and apostolic anthropogenic climate change church” just to be absolutely clear. Any opinions I express or that you thought I was expressing are subject to change if the party line changes.
They need a buzzer at the journals to tell them when its safe to stop applauding.
http://www.jeffersonpolicyjournal.com/wp-content/uploads/2013/01/SignNoApplause.png
Hahaha
Perhaps they’re suffering from clap?
It’s never safe to stop applauding, troe. As Solzhenitsyn told us in The Gulag Archipelago, a story always worth repeating….
“A district Party conference was under way in Moscow Province. It was presided over by a new secretary of the District Party Committee, replacing one recently arrested. At the conclusion of the conference, a tribute to Comrade Stalin was called for. Of course, everyone stood up (just as everyone had leaped to his feet during the conference at every mention of his name). The small hall echoed with “stormy applause, rising to an ovation.”
For three minutes, four minutes, five minutes, the “stormy applause, rising to an ovation” continued. But palms were getting sore and raised arms were already aching. And the older people were panting from exhaustion. It was becoming insufferably silly even to those who really adored Stalin. However, who would dare be the first to stop? The secretary of the District Party Committee could have done it. He was standing on the platform, and it was he who had just called for the ovation. But he was a newcomer. He had taken the place of a man who’d been arrested. He was afraid! After all, NKVD men were standing in the hall applauding and watching to see who quit first! And in that obscure, small hall, unknown to the Leader, the applause went on—six, seven, eight minutes! They were done for! Their goose was cooked! They couldn’t stop now till they collapsed with heart attacks!
At the rear of the hall, which was crowded, they could of course cheat a bit, clap less frequently, less vigorously, not so eagerly—but up there with the presidium where everyone could see them? The director of the local paper factory, an independent and strong-minded man, stood with the presidium. Aware of all the falsity and all the impossibility of the situation, he still kept on applauding! Nine minutes! Ten! In anguish he watched the secretary of the District Party Committee, but the latter dared not stop. Insanity! To the last man! With make-believe enthusiasm on their faces, looking at each other with faint hope, the district leaders were just going to go on and on applauding till they fell where they stood, till they were carried out of the hall on stretchers! And even then those who were left would not falter. . . . Then after eleven minutes, the director of the paper factory assumed a businesslike expression and sat down in his seat. And, oh, a miracle took place! Where had the universal, uninhibited, indescribable enthusiasm gone? To a man, everyone else stopped dead and sat down. They had been saved! The squirrel had been smart enough to jump off his revolving wheel.
That, however, was how they discovered who the independent people were. And that was how they went about eliminating them. That same night the factory director was arrested. They easily pasted ten years on him on the pretext of something quite different. But after he had signed Form 206, the final document of the interrogation, his interrogator reminded him: “Don’t ever be the first to stop applauding!”
Reblogged this on Climatism and commented:
“ice-free Arctic Ocean, often feared to be just years away, in one of the starkest signs of man-made global warming, could be delayed if nature swings back to a cooler mode.”
“if nature swings back to a cooler mode” !
Big turnaround – “Nature” has a say in climate change.
Careful boys and climate girls! Anymore talk of natural variability and you might find yourselves making clothes for the emperor….instead of scaring us for a crust.
What records do we have regarding the arctic ice cap that pre-dates satellite records?
Lots of anecdotal information and temperature reconstructions and proxies. Fossil foram’s and other critters can tell us when the Arctic was largely ice-free or iced-in… But nothing with resolution comparable to the satellite data.
What about ship’s logs. Ships keep detailed logs of weather and, I would assume, ice in sea lanes. They may not have been in the Arctic Ocean but certainly did sail within the Arctic Circle. These logs date from several centuries ago if anyone takes the time and energy to research them.
Interesting data could be compiled but I guess no one wants to actually have to collate data from reading!!.
Technically, ships’ logs fall under anecdotal information.
https://wattsupwiththat.com/2009/04/26/ice-at-the-north-pole-in-1958-not-so-thick/
Admiral Byrd said there is one.
g
You mean like anecdotal evidence of ships sailing the Arctic without the use of icebreakers? Try google North east passage.
20,000 years ago the Arctic Ice covered New York a thousand feet thick. Then something natural happened and for the next 19,930 years that natural something brought us to the pre-AGW extents. As mysteriously as it appeared this natural something passed the warming baton to an innocuous little molecule. Yeah right.
That’s great and as succinct a ridicule as I’ve yet seen.
beautiful !!
Submarine surfaces at north pole August 1958
https://www.navalhistory.org/2011/08/11/uss-skate-ssn-578-becomes-the-first-submarine-to-surface-at-the-north-pole
Yes… they used sonar to find a spot where they could punch through the ice.
Now most of the ice is thinner than the thin spot they punched through.
And when there is open water from the Russian coast to the pole -coming soon, maybe this year -are you still going to bring this up?
That would only work if everything was better in the past. The ice was thicker, the steel of the submarines was thicker and the frogs wore wooden ties. I have never known that the AGW apostles are such: Previously everything was better followers.
Maybe it’s cyclical. Ice has gotten thinner while your head has gotten thicker. When is the phase reversal?
There was open water at the North Pole. Read. Learn.
Did they check there was not a polar bear above them first Griff???
Griff:
The ice is thinner except where those ships are stuck for the winter near Russia?? Right?
A pity you know so little of which you speak. Now, having been on a uk nuke boat, that’s been to the Pole, I can categorically say that sonar is not used. An echo sounder is used however, but it’s not the same thing. I don’t expect you to know that though. Ice is usually thicker than 6ft (1.85m), so it can take some time to find a polynya (rare) at those latitudes or find a thinner spot (also rare). Any ice greater than 2m is a no go when trying to break through, despite the fin (or sail as you Americans call it) being specially strengthened. Also Griff, even in August, its cold, hence all that blasted ice! Even after surfacing a constant watch has to be kept to ensure we didn’t get locked into the ice.
“Yes… they used sonar to find a spot where they could punch through the ice.
Now most of the ice is thinner than the thin spot they punched through.”
Lying again Skanky?
From the above link:
USS Skate (SSN-578) hung below the Arctic ice like a matchstick suspended an inch from the ceiling of a large room. A knot of sailors in the control room stared intently at an instrument inscribing patterns of parallel lines on a rolling paper tape. The pattern looked like an upside down mountain range.
“Heavy ice, ten feet,” said one of the sailors.
Suddenly the lines converged into a single narrow bar. “Clear water!” the sailor called out.
You would find it less embarrassing if you bothered to read the links you lie about.
Have you apologised to Dr. Cockcroft yet?
When this year the Arctic Ocean is not iceless all the way from the Russian coast to the Pole, do you promise never to spread such drivel here again?
It didn’t happen then, the ice at the N Pole was too thick, they went back the next year after modifications to the Skate and was the first sub to surface at the N Pole on 17 March 1959 after breaking through the ice.
Quite right Phil. The people that pontificate about the Arctic in here seem remarkably ignorant about the topic! Skate in March 1959:

Rubbish.
CW666 – I’ll see your “rubbish” and raise you “tommyrot”!
Your source is evidently mistaken.
“Your source is evidently mistaken.”
Really…
Personally, I think I’ll take the word of a professional naval officer over that of some AGW evangelising poster spouting alarmist drivel on a blog.

CW666 – I think I’ll take the word of a professional naval officer over that of some evangelising poster spouting denialist drivel on a blog.
My source is James Francis Calvert:
http://www.washingtonpost.com/wp-dyn/content/article/2009/06/05/AR2009060503679.html
Who on Earth is yours?
Just to be a snarky wench…watch this video of a sub surfacing at the North Pole in March of….2016. For a year with record (catastrophic) lows…thats a hell of a lot of ice around it…*grin*
https://theaviationist.com/2016/03/21/watch-this-stunning-video-of-a-u-s-nuclear-submarine-breaking-the-ice-to-surface-in-the-arctic-circle/
“Who on Earth is yours?”
The link to it has already been posted twice, but if you’re incapable of finding it, here it is again.
https://www.navalhistory.org/2011/08/11/uss-skate-ssn-578-becomes-the-first-submarine-to-surface-at-the-north-pole
Nautilus and Skate both visited the North Pole under the ice in 1958. That year, Skate surfaced near the Pole in order to radio its position, which wasn’t considered close enough to count as surfacing AT the Pole. It went back in 1959 and surfaced at the Pole.
catweazle666 March 25, 2017 at 1:19 pm
“Who on Earth is yours?”
The link to it has already been posted twice, but if you’re incapable of finding it, here it is again.
It’s not whether it can be found it’s the fact that it’s wrong! That picture shows the surfacing at Ice Station Alfa in the previous March not the surfacing at the Pole which Calvert described as impossible in 1958. They were the second US sub to reach the N Pole on 11 August 1958 (after Nautilus), but they were unable to surface there:
“”Seldom had the ice seemed so heavy and so thick as it did in the immediate vicinity of the pole. For days we had searched in vain for a suitable opening to surface in.” The closest was to make radio contact at the surface from a polynya around 30 nm away, but not to surface fully owing to the risk of damage from ice. Skate did manage to surface and make contact with Drifting Ice Station Alpha at 85ºN, 300 nm away.”
CW666 – I can click links, and read English. Can you. To the best of my knowledge NHHC != JFC.
As other have pointed out, you and Joe and the source you quote are wrong. Period!
Did you bother to click my link? From JFC’s English language obituary:
“Retired Navy Vice Adm. James F. Calvert, 88, commander of the nuclear-powered submarine USS Skate, died of a heart ailment June 3 at his home in Bryn Mawr, Pa.
He wrote about the 1959 polar trip in “Surface at the Pole” (1960).”
Not just wrong, wrong at the top of your voice. Repeatedly. What a rardtard, simply too stupid to know when to shut the f*ck up and sit down. Go ahead, show us again why we love laughing at your stupidity. Please.
Aphan – Just to be a snarky wench… Are you aware that March is the month when Arctic sea reaches its maximum extent and is approaching its maximum thickness?
I assume not, otherwise you wouldn’t post such tommyrot.
AFwetware-
Yes, I am VERY aware that March is the month in which the Arctic sea ice is the thickest and reaches it’s maximum extent. Which is why the video and news story showing the surfacing of a nuclear sub in March of 2016 is so impressive. It’s really cool, you should watch it. 🙂 I posted it because Griff is so worried about the ice at the North Pole and stated -“Now most of the ice is thinner than the thin spot they punched through.”
The chainsaw cutting through the ice sure isn’t cutting through “thinner than thin” ice is it?
The much discussed photograph with the open water around it appears to be a photo of the USS Skate from August 1958 near Drifting Ice Station Alfa-300 nm from the actual Pole. She surfaced nine times in the Arctic on the 1958 trip.
As far as the surfacing of the USS SKate in 1959-
Definition-“Polynya: A wide area of open water in an area of pack ice. A polynya differs from a lead in that leads are long and narrow.” (sea ice atlas)
In the Life magazine article written by the ship’s Captain, James Calvert, in 1959, his own words, he describes surfacing in a polynya they named “skylight number one”. Page 134-
“Prowling along our course at 16 knots, we spotted what looked very much like a newly frozen polynya, a lake in the ice”.
P. 135- “The frozen lake appeared to be several hundred yards both in length and width, giving Skate plenty of room to come up”.
https://library.osu.edu/projects/under-the-north-pole/afterwards.html
On March 17th, they surfaced through a small lead in the ice-and held the memorial service for Sir Hubert Wilkins at the North Pole.
Definition-Lead: “A long, linear area of open water that ranges from a few meters to over a kilometer in width, and tens of km long, which develops as sea ice pulls apart.”
Both leads and polynyas are areas of open water. A newly frozen polynya, by definiton, must have recently been OPEN. Point being? Open water at the North Pole. Which is what I said. I didn’t say ANYTHING about how much, or even hint that the sea ice was gone, or that they went water skiing or anything.
Oh and here’s a link to a photo of crew checking the USS Skate after meeting up with the SeaDragon at the North Pole under the ice in 1962-http://navsource.org/archives/08/575/0857805d.jpg lots of open water.
2H9 – You also seem to be wrongly directing comments concerning CW666 to me in error?
So, you use multiple “identities” to comment? Isn’t that special!
Aphan March 25, 2017 at 10:09 am
Just to be a snarky wench…watch this video of a sub surfacing at the North Pole in March of….2016. For a year with record (catastrophic) lows…thats a hell of a lot of ice around it…*grin*
That video is not of a sub surfacing at the Pole, it was at Ice Camp Sargo, somewhere in the Arctic Ocean is not the same as the North Pole! Early March at the Pole would be pretty dark, that camp is well south of the Pole. Pretty thin ice for March too.
“while opening the region to more oil and gas and shipping.”
The way they say that, I get the impression that they believe this would be a bad thing.
I get the impression that they believe most good things are bad.
Good news doesn’t sell and good climate can’t be taxed.
Bad here, bad there, bad everywhere–now pay up, you climate criminals!
(Is a /sarc really needed?)
Just checked NSIDC, yet again, and yep, still ice covering the entire Arctic Sea and attendant regions. Arctic is not going to be “ice free” at any point in the foreseeable future, and yet their lies keep coming.
Well check again later: this is the week of the maximum coverage.
And it is probably the lowest maximum ever (in contention with 2 previous lowest)
And how should we react to the Antarctic ice?
Ever? Really?
So what, Skanky?
Would you have been screeching about doom and destruction if you had been around when the ice was retreating from the British Isles?
If not, why not?
Have you apologised to Dr. Crockford yet?
Another Doug,
Griff apparently believes that Earth time began in 1979. Before satellites existed, the climate was static.
Another Doug and Aphan – exactly correct, the earth began in 1979, at the precise time that the cult religion of CAGW began. Time, space, matter, etc., did not exist before 1979 as far as they are concerned.
Aphan
“Griff apparently believes that Earth time began in 1979. Before satellites existed, the climate was static.”
I wonder if that could be –
“Griff apparently believes that Earth time began in 1979. Before satellites existed, the climate was ecstatic.”
So good as to be perfect – at least until the SUV was born.
Auto
“Griff March 14, 2017 at 8:25 am
And it is probably the lowest maximum ever (in contention with 2 previous lowest)”
Changing the goal posts Griff. Previously you said it was going to be the lowest ever! Now it’s in contention with the last two?
More straight-line pseudo science.
Until we understand the Arctic climate and its interactions with the rest of the climate system such claims just blind speculation and no responsible scientist would be making such specious claims.
The alarmists’ favourite metric : the September sea ice minimum was the same last year as it was a decade ago, at the same time as the allegedly anthropogenic caused warming is twice that in the rest of the world.
The naive and simplistic attribution just does not match the observed facts. Try again.
Once again the AMO is completely ignored. Probably the single biggest factor in Arctic ice changes. I have a feeling that natural ocean cycles are considered a 4 letter word in the climate priesthood.
I think the paper focuses on the NAO.
At least that is a start. From what I can tell, the NAO and AO have pushed more ice into AMO warmed waters. The combination melts a lot of ice. What drives these natural cycles still remains pretty much unstudied.
Another new paper is also very interesting for a long term look at Arctic ice.
http://notrickszone.com/2017/03/02/new-paper-indicates-there-is-more-arctic-sea-ice-now-than-for-nearly-all-of-the-last-10000-years/#sthash.DHZBYDgy.zSjoZRdc.dpbs
Wow, that’s quite an admission. Still wrong, and simply a SWAG on their part, but the walk-back continues. I guess they see the writing on the wall.
Co2 is not the cause of climate change. Water Vapor is.
Many things are, in combination.
Lot of things control water vapor sure. But rising co2 is not causing climate change. It is almost all natural ocean cycles, where min temp just follows the water vapor distribution. And there’s no sign of water vapor increasing in general, just the spike when the amo when positive in 2000. That was where the “step” came from.
Natural Variation.
What we have here is a revelation of the First Law of Political Science: When you put two unknowns together you get a known.
ron long, that is a great observation .
The reason for the low ice extent must be due to warmer sea currents not allowing the ice to spread further south, the recent el-nino and lots of low pressure dragging warm air up into the arctic from the atlantic. Possibly the lowest sea ice minimum this September. If things carry on like this, the sea ice will completely melt each summer within the next 30 yrs and not completely freeze over in winter.
Cherry pick start point, linear project a cyclical phenomenon and posit with an outrageously unwarranted prediction.
Some of the decline, I suppose, could be due to aerosols aka real pollution, not the fake “carbon pollution”.
Can’t see any dangerous trends in DMI’s data. Looks like business as usual.
It is also seen in the data of Bremen, the NSIDC and others nothing unusual compared to the previous years. The only current ice, which appears less so is the one in the Okhotsk Sea. Since this ice surface is quite far south (near the Kuriles), it is more on the weather and El Nino, to what extent the ice surface develops there. There is nothing unusual in the arctic basin, in the Canadian archipelago, and elsewhere in the inner arctic. On the contrary, on the European side (Spitzbergen, Franz-Josephs-Land and Karasee) more ice is seen than in the years since 2013. Stand 13.03.2017. Compare: https: //seaice.uni-bremen.de/databrowser/
The cold front currently hitting the U.S. northeast is heading your way.
The storm that’s coming is called “Winter Storm Stella”, and there is another storm front going to combine with Stella soon. I don’t know what the second storm’s name is. What happens when you get storms with different names combining? Does that mean they are married and one takes the other’s name?
Stella? Have we had that many storms this season to get clear to Stella in the naming list? I think it’s pretty silly to name thunderstorms over land, and I think they started doing it just to try to hype up extreme weather a little bit more, with the aim of connecting it to CAGW in the eyes of the public.
Thankfully, my local meteorologists do not name thunderstorms. And they don’t make any claims about CAGW, either. We love our local meteorologists. 🙂
30% – 50% huh. I wonder whether that upper limit is constrained by science, or politics?
Considering that, AIUI, 50% natural is the (political) boundary between the 97% and the 3%.
OT Earth’s oceans are warming 13% faster than thought, and accelerating
http://i.dailymail.co.uk/i/pix/2017/03/13/11/3E38CFD000000578-4308648-image-a-18_1489405869536.jpg
Our new study improves estimates of the rate of ocean warming – a critical component of climate change
New research has convincingly quantified how much the Earth has warmed over the past 56 years….
Over 90% of the extra heat ends up in the ocean and hence perhaps the most important measurements of global warming are made in the oceans….
First, we corrected past data for known biases in measurements. Second, we related the temperature measurements to results calculated from advanced climate computer models. Third, we applied temperature knowledge to larger areas so that a single measurement was representative of a large space around the measurement site. Finally, we used their knowledge of recent and well-observed temperatures to show that the method produced excellent results. …
We were able to extend our techniques back to the late1950s and show that the rate of global warming has changed significantly in the past 60 years. One main outcome of the study is that it shows we are warming about 13% faster than we previously thought. Not only that but the warming has accelerated. The warming rate from 1992 is almost twice as great as the warming rate from 1960. Moreover, it is only since about 1990 that the warming has penetrated to depths below about 700 meters. …
It seems that they couldn’t find warming in the Argo data so they used that thing in the picture and measured below the Argo depth of 700 metres. Not having any data at all for depths below 700 metres they gap-filled and extrapolated back to 1950.
Link didn’t work
https://www.theguardian.com/environment/climate-consensus-97-per-cent/2017/mar/10/earths-oceans-are-warming-13-faster-than-thought-and-accelerating
Ah, new “known” biases. Always a good place to start : correct the data to fit your climate model and explain why the model was not matching observations.
Still looking for the “missing heat” apparently.
“Second, we related the temperature measurements to results calculated from advanced climate computer models”
What the hell biases in measurements ??
Use CALIBRATED equipment, and you won’t get any biases in measurements.
G
humor….
The known biases pushed it .2 in one direction….
….the unknown biases would have pushed it +10 in the other
George, so we shouldn’t correct for UHI effect? We should just use the temperatures recorded as long as the thermometer was accurate?
seaice1
Please locate for us on a map exactly where the “Urban Heat Islands” are in the ocean. And then tell us why PAST data would be biased by those “UHIs”.
Aphan. George said
“What the hell biases in measurements ??
Use CALIBRATED equipment, and you won’t get any biases in measurements.”
The conclusion is that if you use calibrated instruments you don’t need to correct for biases. This is wrong, and the UHI effect is one demonstration of why it is wrong.
Seaice1,
I’m aware of what george said. And he’s correct- calibrated instruments measure accurately.
What YOU brought up- the UHI- has nothing to do with ocean temps, which is the topic of this study, AND the UHI imposes a TREND bias, or a warming bias…NOT a measurement bias. A measurement is a measurement is a measurement. It’s either accurate, or its not.
Very well concluded. They have “assumed” the warming of the oceans because supposedly most of the heat in the deep sea has disappeared below 700 or even 2000 meters. If one considers the oceans’ boosting areas (some are even seasonal or fluctuate), a damn narrow ridge is produced , for cold, but still somewhat warmed water ever to emerge neither from the deep sea. Apart from the time factor. You can not compare our current oceans with those of 50 or 100 million years, as some AGW freaks do. Today’s oceans are much deeper, the pressure in the deep sea is higher and therefore the cold water of the deep sea comes only very sparingly upward.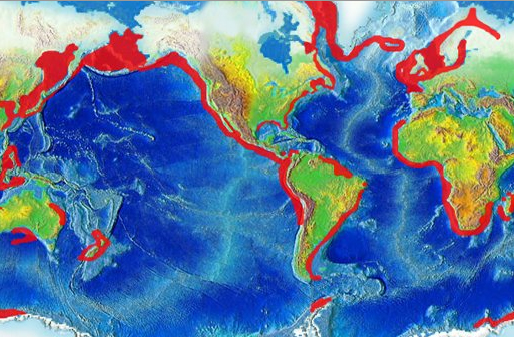
Continents have moved too!
“First we corrected past data….”
“Second……advanced computer models…”
“Third we applied temperature knowledge…”
“Finally….the method produced excellent results”
The Scientific Method of modern climatology in a nutshell.
Yeahbut…
So that’s alright, then!
/sarc
So THEY simply thought 13% too low.
Climate is not an exact science.
Sometimes they get the order of magnitude correct.
g
“Third, we applied temperature knowledge to larger areas so that a single measurement was representative of a large space around the measurement site.”
What idiot claims that a single measurement is representative of hundreds and/or thousands of miles? My grandparents lived about 200 miles north of me, and I can tell you right now that there was a BIG difference in the temperatures in the DC metro area compared to the temperatures in central Pennsylvania. Usually full degrees, plural. I am supposed to believe that their dinky little measurement (taken using a biased method and “adjusted” to be even more biased) can be taken as THE temperature for thousands of miles of surrounding ocean?
That is felony stupid.
Well-known French writer and poet, Theophile Gautier, lived in Russian capitals, St. Petersburg and Moscow, in 1858-1859, and also in 1861. Upon his return to France, he published what these days would be called a “travelogue”, under the title “A Voyage to Russia”. In it, I found this paragraph that may be of interest to the readers of WUWT (my translation into English from Russian translation of French original):
“In St. Petersburg people complain that weather is not harsh enough, and, looking at thermometer, say: “What a joke! Only two or three degrees below zero? Certainly climate is changing.” Old-timers tell you about those wonderful winters when, starting from October and through May, people “enjoyed” –25° and –30° freezes.”
[You see? Not only Russians were first in space and in everything else, invented baseball and vodka, etc., they were worried about climate change in 1858!]
And?
If you look you can find any number of papers saying that the decrease in ice cannot be entirely explained by natural cycles and that warming must have produced some of the decline… which is the same thing as this is saying.
Warming in the arctic is still continuing to drive arctic sea ice levels down and that does have consequences in terms of local warming, global warming and air circulation patterns. Serous consequences.
And yes, the Russians and Chinese get to dominate an ice free arctic ocean as a side effect.
The decline in artic sea ice and the warming rate in the arctic are a clear sign of actual real global warming/climate change.
This year’s maximum has probably been reached and is no higher than the previous 2 lowest maximums.
The sea ice starts out thinner, less thick/older than 1 year MYI, less area, less volume. This year is set for another top 3 minimum or even a new record.
And so should you…!
Well, what is the risk from declining arctic sea ice, exactly? You could speculate about changing weather patterns and perhaps some coastal erosion, but since those things are guaranteed to happen anyway, what’s so serious about what happens now or in the future?
Melting for 22,000 or so years…it must be painful to think about for someone who “cares.”
If the Arctic stopped melting, would you be content, let alone celebrate? Or would you finally disappear out of humiliation?
“And so should you…!”
No Skanky, we see no reason whatsoever to run about virtue signalling because a cyclic climate function is cycling, especially when for a few years it will improve transport access and allow us to extract oil and gas from the Northern fields.
Unlike you, we care about the destruction of wildlife due to your support of the ‘Unreliables’.
And unlike you, we care about the sick and elderly dying in fuel poverty because they can’t afford to ‘eat and heat’, whereas you just see that as a way to make a bit of beer money
Have you apologised to Dr Crockford yet?
Catweazle Dr Crockford mispresents science in an area she does not study for political ends. I’ve told her that in direct reply to her comments and that’s an end to it. She is not a polar bear expert.
I believe that if I started a blog detailing how walrus are not affected by climate change (they are) the likes of you would follow it and applaud my expertise, without regard to considering if I actually had any.
Alarmist drivel, as usual Griffie.
you want to take a bet on this year’s minimum?
Wadhams, Gore, Maslowski, Serezze, and others have for years pushed the NO summer ice narrative. Yet here we are are with over 4 Wadhams left over, at the last years minimum.
Yawn……. Zzzz………………………
Griff
What is your prediction for this September.
More or less than 2012
Ozonebust. I offered a bet that the next three years minimum area would be lower than the previous three years area. Nobody took me up, but I am still open under the same terms (three years from when I offered.) I even gave odds of 3:1, but nobody really thought the ice was recovering, so they didn’t take me up on it. Not too late.
Betting on a single year is a different game, as year on year variations can be pretty huge. The odds would have to be carefully looked at, possibly with a fairly large “nobody wins” area in the middle.
As usual Griffie has cause and effect backwards. It is the natural loss of sea ice that allows open waters to warm the atmosphere. In some areas the difference can be as high as 10-20 C. This warmer air then also feeds down into the mid-latitudes and reduces the natural cooling that would otherwise occur. This is one of the major reasons the NH shows more warming than the SH.
It isn’t natural Richard.
The sea ice extent is already lower than lowest point of last cycle (cicra 1943) and still trending down.
(according to Judith curry’s blog lowest in last century was higher than 2007 figure)
Griff,
you have been told over and over that it has gone through periods of little to no summer ice, that lasted for hundreds to thoudsands of years in the early part of the Inter glacial time.
Why do you ignore the many published papers saying it?
“It is the natural loss of sea ice that allows open waters to warm the atmosphere. ”
Exactly. That is why the usual assumption , which is never tested against reality, that more ice loss will lead to more and faster melting just does not happen. Since the OMG low of 2007 and the OMOMG low of 2012 the summer minimum has not gone any lower Last year was notably more that 2012.
When your hypothesis does not fit observations you change it
“It isn’t natural Richard.”
Of course it’s natural, what a fool you are!
Make up lies as you go along, griff.
Lies and fabrications are all you have left.
Please show the satellite charts that prove current ice levels are less than 1943.
Griff, I am interested in the idea of a wager, but I am not sure how to frame it based on a single year. Obviously something like “lowest since satellite records began” is one option, but that requires significant odds as records are relatively rare events. However, I would be willing to bet quite a lot on lowest since 1979 against highest since 1979, nobody wins if it is in-between. Only record breaking wins. Obviously I am not betting against you.
Any other ideas?
It is natural and Arctic sea ice has already stopped trending down, unless there be a new summer low record this year. Summer sea ice has stabilized since 2007. That then record and the lower low in 2012 were due to August cyclones. Average lows for the two five-year intervals 2007-11 and 2012-16 were about the same. We’ll see if 2017-21 is in the same ball park, lower or higher. But right now the ten0year trend is flat.
Antarctic sea ice has trended up all the while Arctic was trending down, so loss can’t be due to air temperature, as CO2 is allegedly well-mixed. Antarctic is lower than average this year thanks to the super El Nino, same as Arctic. The areas of lower ice there are clearly due to the influence of El Nino. It’s not lower everywhere, but only in regions affected by the North Atlantic Drift and bits of the North Pacific:
“Griff, I am interested in the idea of a wager, but I am not sure how to frame it based on a single year. Obviously something like “lowest since satellite records began” is one option”
I believe satellite records of the ice began in the very early 1970’s, when the ice was as low or lower than today. Are those the satellite records you are referring to, or are you referring to the satellite records which began in 1979, when ice was more extensive than today?
There are even satellite observations from the 1960s. It’s just that continuous observation with a purpose-built satellite began in 1979, conveniently for CACA adherents.
OK Chimp, I think the trend is still down, you think it is positive or flat. We should be able to come up with a reasonable proposition based on that.
If you are right we can extend the flat line. If I am right we can extend the downwards line. Whichever the next minimum is closest to is the winner? Needs some finessing, but is that a good basis? A symbolic bet would be OK.
chimp
well sadly of course there will be a record low this year…
It will be in top 3 lows if not a new record.
How could it not be, given the starting state of the ice?
TA
I think I’d go for in lowest 3 since satellite records began, and would want to use the University of Bremen figures (not sure chart covers all years though it does show lowest).
You on?
seaice1
March 14, 2017 at 4:10 pm
Who can say what will happen in the future, but trends seldom if ever continue forever. That fact is how I make money in the stock market. Trends remain until they end.
The fact is that there has not been a new record summer low since 2012 and that the five year average has been about the same for the past two such periods. Thus my bet is that the current five-year interval will also be about the same as 2007-11 and 2012-16. The later period even had two low years, the lowest and second or third lowest, yet averaged about the same as the previous interval with only one record low.
Griff,
That winter ice has been low doesn’t guarantee a lower summer minimum. Sure, there could be one, but bear in mind that open water in the Barents Sea means that the Arctic Ocean lost a lot of heat to the air and hence space.
Nothing is certain. Arctic sea ice might enter the normal zone this spring, taking a short cut across the usual winter peak. Or it could stay below average, turning down from its present position.
http://nsidc.org/arcticseaicenews/charctic-interactive-sea-ice-graph/
Your conjecture (“how could it not?”) is not a sure thing, but of course could happen.
I keep making the point that the Arctic Sea is covered with ice, and is covered with ice at the height of summer, and leftards refuse to accept reality. Got a feeling leftards are simply never going to accept reality. Oh, I’m sorry did not mean to be repeatedly redundant there. 😉
Seaice and Griff,
My response is either held up in moderation or lost in cyberspace.
Maybe I’ve commented too much lately.
2H9 – “I keep making the point that the Arctic Sea is… covered with ice at the height of summer”
How would you classify yourself? Alt-Rightard? You are evidently living in a fantasy land of your own devising? Here’s the Arctic Ocean last summer:

SST – Has the cat got your tongue?
http://img14.deviantart.net/44dc/i/2010/143/4/8/cat_got_your_tongue_by_chrissiecool.jpg
You want to argue you need to take it up with NSIDC, that is where I go to check Arctic Sea ice extent, so you need to go castigate them for showing your human caused globall warmining religion is a lie. If, as you claim, there is no ice on the Arctic Sea why are the British planning to lock a ship into the Arctic Sea icesheet and allow it to drift, with the icesheet, across the North Pole? You say there is no ice so they should be able to simply steam up there and do their research. Perhaps whilst you are screeching and caterwauling at NSIDC you should sling some at the Brits, too?
In the end your declarations of the end of the world are, well, silly. There is ice on the Arctic Sea year round, and it will be there for the foreseeable future no matter what doomcrying you and others continue to regurgitate. I would suggest you work on that beard, get a nice sack cloth smock and paint up a catchy sandwich board. And remember, speak from the diaphragm when you cry out “The End Is Nigh!”, and stretch that last word, makes it much more convincing.
Oh, and that image you posted show A LOT of ice on the Arctic Sea in September. As the song goes, Ice, Ice, Baby!
2H9 – As I said, you have a vivid imagination. I didn’t claim that “there is no ice on the Arctic Sea” as you assert. My image above shows that “The Arctic Sea” (sic) isn’t “covered with ice at the height of summer”, which is what you claimed. FYI, this is what the latest NSIDC extent data reveals:

and here’s what the Arctic Ocean looks like at the height of winter:

Yep, you prove it again, Arctic Sea covered with ice, no end to it in sight. Thanks.
2H9 – Are you colour blind? Do you comprehend English? Let’s try this once again shall we?
1) The Arctic Ocean last summer wasn’t “covered in sea ice”
2) The recent Arctic sea ice maximum extent is the lowest ever value for that metric in the satellite era.
You’re welcome.
The image you posted proves you wrong, there is no ice free Arctic Sea. Period. Full stop. Hey, its ok, this is America and you can believe whatever fantastical religion you makeup.
2H9 – I never said “The Arctic Ocean is ice free”. That’s a strawman of your own construction.
However I did say “The recent Arctic sea ice maximum extent is the lowest ever value for that metric in the satellite era”. That’s an actual fact.
Here’s the NSIDC data once again:

Twirl&spin, round you go. You keep posting images that show ice on the Arctic Sea and claiming there is no ice because humans destroyed it all. Here, one more once, are the facts. Climate changes constantly. Humans are not causing it and humans can not stop it. Final fact, your little religion is a lie, humans are not destroying the environment. Now spin&twirl and tell us all how we are going to die in a fiery flood because humans are EVIL. Oh, and graphs! More graphs that prove nothing. Love that crap.
2H9 – You are evidently very imaginative! Where was it that I claimed “there is no ice because humans destroyed it all”?
Since you love graphs so much, here’s another one:

And you keep posting images and links to images that show ice on the Arctic Sea year round. Thank you! Keep up the good work.
That’s because in actual fact there is sea ice in the Arctic all year round, for the moment at least.
And will be for the foreseeable future, no matter what apocalyptic doomcrying you want to put forth. Climate changes, humans are not causing it and can not stop it. Oop, there it is.
2H9 – It seems as though we’ll have to agree to disagree on that then, particularly since you provide no evidence for your assertions.
From my perspective the Arctic will be seasonally sea ice free in the foreseeable future. Humans are choosing not to stop it.
You have twice posted satellite images that show I am correct, ice on the Arctic Sea, year round, summer and winter. Please, post more, I am loving it. Meanwhile there is STILL ice on the Arctic Sea and will be for the foreseeable future. Perhaps you should apply all this passion and time to something that helps your fellow man, cause this ain’t.
Griff, does that mean you can’t address Davids data based presentation?
You babble without any evidence,just opinionated drivel is all you have. You have been told many times with published science papers, of low to no Summer Arctic ice earlier in the Inter Glacial time. You keep ignoring them plus the non disasters that didn’t happen THEN,so why you think they will happen now?
Your ice obsession is destroying you and Jim Hunt,who was exposed as a dishonest person over his absurd cherry picking of a small area while Tony was covering the ENTIRE Arctic region. Tony just today exposed Hunts dishonesty, by showing that his small Canadian region is actually thicker than last year.
The two of you are gaining a stellar reputation as wild eyed warmist morons,who will lie or distort the topic presented, Tony has effectively destroyed your low Arctic ice baloney, to the point that you now get derision there, since your replies are free of any science information,meaning you have no effective counterpoint to offer,just brainless opinions, nothing more.
You have NEVER presented evidence of anything showing low ice levels is a threat to the planet,just fear mongering and obsession is all you have.
I’m reflecting as best I can in limited space and with limited time the masses of observed evidence on the state of the arctic sea ice.
Tony Heller is a cherry picker who misrepresents the data. An unreliable commenter and observer.
I believe even Anthony Watts has had cause to rebuke him on misleading posts on the arctic sea ice…
Griff,
The “state” of the Arctic Sea Ice is what it is. Predictions about what it’s state “might” be in the future are irrelevant whether they end up being correct or not. The state of the Arctic Sea Ice in the future, will also be what it will be.
Tony Heller (or anyone else) being wrong at any point in the past, certainly does not preclude him being correct at any other point in time. At least he provides data to back up his conclusions, that can be examined by others to evaluate. You can’t be bothered.
Aphan – How did this Heller prediction from August 2016 turn out?
https://realclimatescience.com/2016/08/arctic-alarmists-screaming/
“We are looking at the likelihood of one of the highest summer minimums of the decade”
A broken clock is right twice per day?
AFWetwear
You proved my point. Sea ice will be what sea ice will be, and predictions are irrelevant to what it actually does.
Tony wasn’t the only person who was surprised by the end of summer melt in 2016. The ice behavior was unusual that year due to weather and two late season storms did a lot of structural damage as well.
It’s a logical fallacy to assume that someone who has been wrong can never be right.
AFWetware,
I hope you realize that Tony does it better than the many sea ice experts, who for years now have wrongly predicted NO summer ice in the Arctic.
Ice-Free Arctic Forecasts
https://realclimatescience.com/ice-free-arctic-forecasts/
Gee how did you miss that angle?
SST – Tell you what. Why don’t you prove Aphan’s theory by showing me one of Tony’s predictions that was correct?
SST – It seems as though you’ve been unable to confirm Aphan’s conjecture with evidence of an accurate prediction? Meanwhile your aforementioned “Mr. Hunt” posted this “data based presentation” earlier:

“You don’t even need to be familiar with the satellite products to understand that the sea ice edge to the north of the Barents Sea doesn’t currently consist of multi-year ice.”
Any comment?
AFWETONE,
Please, for all here, state “Aphan’s theory”. I cannot wait to see what you concoct, since I don’t recall ever stating one.
Aphan – Here you go:
“Tony Heller (or anyone else) being wrong at any point in the past, certainly does not preclude him being correct at any other point in time.”
I was idly wondering if anybody could dig up some evidence for Tony ever being correct about Arctic sea ice at any point in time.
Me-“Tony Heller (or anyone else) being wrong at any point in the past, certainly does not preclude him being correct at any other point in time.”
Not really a theory at all is it? More of just a logical,rational, common sense statement.
You:”I was idly wondering if anybody could dig up some evidence for Tony ever being correct about Arctic sea ice at any point in time.”
1-You seem to be TRYING really hard, over and over again, to attribute something to me that I never said, or even alluded to. Something along the lines of “Tony Heller is an excellent predictor of things, sea ice in particular.” My ONLY point was that discounting everything he says because he’s been wrong in the past, makes no sense logically. It’s fallacious thinking.
2- I also said that I believe predictions are completely irrelevant, whether they are correct or not, to what the Sea Ice (or anything else) actually does. They don’t affect the outcome at all. IPCC, Tony Heller, you….doesn’t matter. Predictions are just guesses. Sometimes good ones, sometimes bad ones. Sometimes just lucky ones.
3-AND I’ll say again, that at least when Tony does make a statement, he usually puts out the data or information he’s basing his statement ON, so that others can examine it for themselves. Right or wrong, he puts it out there. People who make statements of certainty without facts to back them up, are simply blathering.
Aphan – Please forgive me. I’m new here and unfamiliar with your oeuvre. I was merely trying to clarify your gnomic statements. I cannot fault your logic in (1).
(2) The sea ice certainly couldn’t give a proverbial fig for Mr. Heller’s prognostications. However:
(3) I’ll have to quibble with you on this one. Mr. Heller undoubtedly misrepresents the Arctic data he presents to his loyal readership.
As, indeed, does David Middleton.
Wow. You just keep trying don’t you?
I”m one of the least gnomic people here. I say exactly what I mean. YOU don’t need to clarify anything I say, or try to read between lines, or hire an interpreter, or rent a codex. If YOU don’t understand me, it’s on you and your oeuvre.
And one more time. I DID NOT SAY anything about Tony’s oeuvre or his conclusions. I said he presents the data he uses to reach his conclusions for others to examine themselves.
Aphan – Like I just said, I understand your first point now. What was “gnomic” to me is no longer.
Regarding your second, I said ” Mr. Heller undoubtedly misrepresents the Arctic data he presents to his loyal readership.
As, indeed, does David Middleton.”
Is that plain enough for you?
“Is that plain enough for you?”
What is very clear indeed is that you are an abusive little man who hasn’t the first idea what he’s ranting about.
Hey catweazle666! Long time. Your nickname always makes me smile, because I know what’s coming when I see it. Lol
AFWETWARE,
“SST – It seems as though you’ve been unable… Meanwhile your aforementioned “Mr. Hunt” posted this “data based presentation” earlier: (IMAGES) “You don’t even need to be familiar with the satellite products to understand that the sea ice edge to the north of the Barents Sea doesn’t currently consist of multi-year ice.”
First, we all know who you are. No need to refer to yourself in third person.
Second-the Barents Sea only very rarely has multiyear ice of any kind. It’s ice is “seasonal” and melts off every year. So images showing no multi-year ice in that area are kind of the norm.
Here is a little “data based presentation” for you….er….”Mr Hunt” to enjoy:
“The waters of the Barents Sea and around Svalbard are characterised by seasonal formation of sea ice that melts away during the summer (seasonal sea ice)”
http://www.npolar.no/en/themes/climate/indicators/sea-ice/
“The southern half of the Barents Sea, including the ports of Murmansk (Russia) and Vardø (Norway) remain ice-free year round due to the warm North Atlantic drift. In September, the entire Barents Sea is more or less completely ice-free.” wikipedia-Barents Sea
(Hint…a sea which ends up ice free every year cannot form multi-year ice)
Aphan – The truth that dare not speak its name? It’s a well known fact that actually I’m an acclaimed surrealist performance art troupe.
Getting back to the Barents MIZ, thanks very much for making our point for us.
Since it’s readily apparent to anybody apart from an Arctic ignoramus that “a sea which ends up ice free every year cannot form multi-year ice” why do you suppose “Steve Goddard” keeps on gleefully posting maps showing that much of the Barents MIZ currently consists of multi-year ice?
Answers on a postcard please to the usual address.
I’m sorry…I searched “Barents Sea” Tony’s website and I cannot find any mention from him of “multi-year ice” there at all. Please provide link to gleeful references of multi-year ice piling up there.
Aphan – Let’s see if I can manage that seemingly trivial task shall we?
Back in 2 shakes of a proverbial lamb’s tail:
http://afwetware.org/wp-content/uploads/2017/03/2017-03-25_15-34-55_343.jpg
Yeah, you go shake a sheep’s rear appendage. I’m going to nap and pretend you get trampled by a herd of them.
[snip – this commenter is banned for use of multiple personalities, aka “sockpuppeting”, violating blog policy -Anthony Watts]
[snip -another fake Jim Hunt persona – mod]
So, you do use multiple “identities”. Okey dokey then.
2H9 – No we don’t. We’re a split personality but we don’t “use multiple ‘identities’”.
As always, please provide some evidence for your assertion. That goes for [mod] too.
You just admitted doing it. Thanks.
2H9 – No we didn’t!
Please apologise for your scurrilous allegation, or prove it.
Sadly. I think Jim Hunt is real. Crazy. Deluded. Complete and utter liar. But real.
*sets out writing “I will not pet the stray activists” 100 times.
Aphan – The same goes for you too. Please apologise for your scurrilous allegations, or prove them.
3rd time lucky Aphan? Am I back?
Attempt 4. Let me try to Google the definitive answer for you:
http://lmgtfy.com/?q=mean+Arctic+climateball
Yep. *yawn.stretch* Just what I thought. Nowhere in any of the links from YOUR website to Tony’s show Mr Heller EVER saying “multi year ice” and “Barents Sea” at the same time. Not hinting. Not even briefly. Let alone anything close to what you alledged. His graphics also do not show multi year ice actually IN the Barents Sea. Ever.
Wait. You DO know where the Barents Sea is….right? Hint, it’s nowhere near Canada…not even on that side of the Arctic Ocean. So why do you keep posting graphs of the Northwest Canadian side? Are you geologically challenged as well as logically?
I’m bored with your irrelevant and untrue gibberish. Mods, AFWETWARE is Jim Hunt. I believe he has been shown the door here repeatedly for being…well…himself. I will write “I will not pet stray activists” 100 times as my penance.
Yes, we figured this out. Mr. Hunt has several fake personas that he uses to push his ideas, this one being the latest. Our site policy is that people that use multiple personas are automatically banned. Such is the case with “AF Wetware”.
Anthony – The same goes for you too. Please apologise for your scurrilous allegations, or prove them.
You admitted to the crime, now you do the time.
I “admitted” nothing of the sort 2H9, and certainly no “crime”.
At the risk of repeating myself, where’s your evidence for the alleged “crime”?
[snip – language violation – you are on moderation now]
Aphan – Haven’t I already chided you for your patronising tone? This is what I said:
“Why do you suppose “Steve Goddard” keeps on gleefully posting maps showing that much of the Barents MIZ currently consists of multi-year ice?”
I didn’t say what you said I said, The links to which you refer show what I said to be true.
All the linked “Steve”/Tony maps also show “multi-year ice” in the Beaufort Sea, where the CIS maps show there to be none. The OSI-SAF tell me “Concerning the ice type product, there is as you point out a systematic problem that gives multi-year ice in some young ice areas, and we are working on improving that.”
Q.E.D?
Apologies awaited.
Wow. You really are worse than I thought.
The MIZ-Marginal Ice Zone demonstrated by the pink line in those photos does NOT show the edge of the ice formed in the Barents Sea, it shows the edge of the ice, the MIZ of the Arctic BASIN’s Sea Ice!!! You know, where the ice grows and gets pushed around by the Beaufort Gyre. You’ve heard of that right?
I owe you ZERO apologies, and you’ve proven nothing except that my spidey instincts are working perfectly.
Aphan – At the risk of repeating myself, please cut the patronising tone.
Here’s what I wrote:
“Let’s take a look on the other side of the Arctic at the area north of the Barents Sea.”
Your list of outstanding apologies gets ever longer.
To AFWetware et al.
AFWetware (@AF_Wetware) March 27, 2017 at 6:48 am
Anthony – The same goes for you too. Please apologise for your scurrilous allegations, or prove them.
Here you go, dumbass.
Lest Jim Hunt be whining, this is public domain info: https://www.whois.com/whois/afwetware.org
Now STFU and get you and your “multiple personalities” off my blog.
+1,000,000
Hugs Anthony!
[snip]
The fascinating thing is that a few years ago when arctic ice was above average, Griff was one of the first to declare that it didn’t matter.
Icelandic sea ice records show that the late 1970’s had EXTREME high levels, up there with those of the LIA, the coldest period in 10,000 year..

griff knows this to be a fact, but totally ignores it.. DENIAL of the most wilful kind.
Mark… +1
MarkW, which average are you talking about? I don’t think it has been above the satellite record average for a while.
Really? do quote me directly on that and I will answer the point.
Yawn, another I gotta worry about low sea ice levels whine.
It is boring and stupid Griff.
“Yawn” is the word used by lazy debaters who can’t be bothered to refute a point.
Yawn…
If you look you can find any number of papers attributing substantial ice losses to black carbon (which has a direct warming effect as well). So the GHG demon gets smaller and smaller.
Griff,
The climate changes. Always has. Always will. And?
and now it is changing because of human activity, rapidly.
There is always a cause for climate change -Milankovitch cycles, increased volcanic activity, solar output, changes in sea currents due to continental drift, etc, etc
The only cause ‘in play’ today which can account for obseved effects is increased CO2 – and the increase is solely down to human activity
“and the increase is solely down to human activity”
Even more unsubstantiated BS from the blog prize BS artist.
Apologised to You-know-who yet, Skanky?
Hate to burst your bubble, Skankhunt42, but all that will happen is to TIE the previous low. Based on the geological record, the Arctic was ice-free approximately 4,000 years ago, hence all that can happen is to tie the record low. Cannot go to negative ice coverage …… however I am quite certain that the gloom and doomers will try to use that for setting a new record!
Well the Russians are the ones running around in giant icebreakers, breaking up the arctic ice into small chunks so it can melt faster.
Blame them.
There is some place up there called …. Canada …. that is also taking up some space.
G
Multi-year sea ice is at its greatest extent in the last 10 years… and climbing
griff GOOFS-UP yet again.
That come from just fabricating the first random thought that comes into your feeble mind, griff.
You are INVARIABLY WRONG !!
Well Griff, do you care to elaborate on what these “serious consequences are? You never seem to get past the “sky is falling stage” of alarmism.
your starter for 10:
https://www.carbonbrief.org/five-reasons-why-the-speed-of-arctic-sea-ice-loss-matters
just google:
‘why does arctic sea ice loss matter’
“Carbonbrief” Skanky?
You’re joking, right?
Why don’t you quote from the ‘Beano’, it isn’t an EUSSR propaganda Fake News publication.
Apologised to Dr. Crockford yet?
As to “The only cause ‘in play’ today which can account for obseved effects is increased CO2”, that is just another piece of total nonsense with absolutely zero empirical evidence to back it up.
Griff just found one of the unknown biases….
Griff “If you look you can find any number of papers saying that the decrease in ice cannot be entirely explained by natural cycles and that warming must have produced some of the decline… which is the same thing as this is saying.”
And how did they come up with the proof that it could NOT be natural variation? Just a throwaway line from throwaway “climate scientists”.
more claptrap from griff . warming of the arctic can just as easily be attributable to a multitude of natural cycles of varying lengths .
forgot to add that all the arctic “warming” only occurs during winter , summer temps bounce about the long term temps seen long before his new world that began in 1979.
Absolutely not.
The ice decrease is in excess of what could be expected from natural variation in the various cycles.
“The ice decrease is in excess of what could be expected from natural variation in the various cycles.”
Utter drivel.
Once again you demonstrate you haven’t a clue what you’re wittering about.
Quick question. Why would anything scientific use words like must and might? Just curious. Possibly because they are uncertain? Maybe you should be a little less certain yourself. You never know it might cheer you up….
LOL. Definitely made me smile.
Thanks for that
AFW-“Aphan – The same goes for you too. Please apologise for your scurrilous allegations, or prove them.”
My allegations-“Sadly. I think Jim Hunt is real. Crazy. Deluded. Complete and utter liar. But real.”
Don’t really have to apologize for what I think. Let’s call it a working hypothesis. Let’s call everything you have posted here my evidence. Are you an evidence denier?
Real-pretty sure, because no machine could be as inconsistent and illogical as you are. But willing, and hoping, to be wrong. Finding proof that you’re not real would be a relief.
Crazy- “2H9 – No we don’t. We’re a split personality but we don’t “use multiple ‘identities’”
Speaks for itself really.
Deluded-:”misled, deceived, fooled, taken in, tricked, duped, hoodwinked” See thread.
LIAR- (just the most recent example as evidenced in this thread) AFW-“Since it’s readily apparent to anybody apart from an Arctic ignoramus that “a sea which ends up ice free every year cannot form multi-year ice” why do you suppose “Steve Goddard” keeps on gleefully posting maps showing that much of the Barents MIZ currently consists of multi-year ice?”
Me-Checked all of the “maps” AFW’s presonal rants linked to on SG’s blog. Cannot find ONE showing that much of the “Barents MIZ” currently consists of multi-year ice. Not one. Not even one posted sadly, much less gleefully. It’s possible that you simply cannot orient yourself properly to that geographical location (because you’ve post counter maps that don’t even show the same location) -which also makes you stupid, as well as a liar.
Mod. “They” are still posting here. 🙂
“The Arctic has seen rapid sea-ice decline in the past three decades, whilst warming at about twice the global average rate.”
Only twice the global rate? I didn’t know “settled science” could change so much. It wasn’t that long ago that Cowtan and Way did their adjustments on sparse Arctic temperatures and came up with a much worse scenario:
“Cowtan and Way arrived at the result that the Arctic warmed eight times faster than the rest of the planet. Before that it had been thought that it was warming three times faster.”
Will the real Arctic warming rate please stand up?
Like the rest of client science, the number for arctic warming is whichever value best suits the political needs of the moment.
Um Louis,
Do you understand how things cool ??
The hotter things are the faster they cool.
The Arctic is very cold, so it doesn’t cool worth a damn.
And the tropics are not only cooling as fast as all getout, they are even pumping vast quantities of heat from the tropics up into the arctic, where it can’t be gotten rid of.
Just imagine how cold the arctic would be if it wasn’t for the Gulf stream etc.
It is generally believed that the Arctic is colder than most of the planet, because it doesn’t get much sunlight. It would be much colder but for all that tropical water going up there.
Somehow, it doesn’t seem plausible that the arctic could cool as fast as the tropics.
Ergo, the arctic MUST warm faster than most of the rest of the planet.
It doesn’t have anything to do with what we do.
Incidently, the best Temperature regulated part of the planet; the Temperature stablest continent, is Zealandia !!
G
How can this be? I have read here many, many times that climate scientists only look at CO2 and never at natural mechanisms.
Better late or not at all, although doubtfully early enough to sustain the conventions, panels et al.
Last-gasp effort on their part to keep the CAGW gravy train rolling for as long as possible, by appearing to be more impartial. But in their heart of hearts, they know it’s over.
I’m sure that any moment now someone will be along to tell us that none of the authors qualify as “climate scientists”.
“I have read here many, many times that climate scientists only look at CO2 and never at natural mechanisms.”
That’s because if they would have lost their jobs if they hadn’t stuck to the CAGW narrative.
Those days are rapidly vanishing, and now scientists are once again allowed to do real science and aren’t compelled by the likes of Holdren and the EPA directors to lie if they want to keep their jobs.
Nice theory, but easily checked. There are thousands of papers talking about climate change during the period before human CO2 was an effect. Indeed, where did the Greenland ice core data that is so often cited here come from?
No, I think you have got to face up to it. Climate scientists have been looking at natural causes of climate change for decades producing thousands and thousands of papers. This is not a recent thing. The idea that climaate scientists only look at human caused CO2 is simply bunkum.
“How can this be? I have read here many, many times that climate scientists only look at CO2 and never at natural mechanisms.”
1-Hummmmmm you’ve actually read the exact and specific phrase here, “many, many times” that: “climate scientists only look at Co2 and never at natural mechanisms”??? Document them please. Should be easy since you say it’s happened many, many times.
2-If in fact what you proclaim is actually true, are you insinuating that everyone here holds the exact same beliefs/theories and thus if ANYONE, (or multiple someones) here offered up the idea that “climate scientists ONLY look at Co2 and NEVER at natural mechanisms” then we ALL must subscribe to that idea? Because that would be a logical fallacy. Obviously.
3-Since I personally have read many, many papers get posted here in which climate scientists conclude that CO2 has little to do with climate change, and perhaps nothing at all to do with climate change, and thus MUST be the result of natural mechanisms other than CO2, I call your silly comment just snarkity snark snark.
Maybe if you disagree with someone saying that you could say so. Nobody ever has, so I assume there is general agreement. People are quick enough to jump in if I say something they disagree with, so it can’t be reticence. People sometimes comment that the greenhouse effect exists when someone comments otherwise, so I have evidence that not everyone here agrees with that. I have not witnessed anyone contradicting when someone says climate scientists only look at anthropogenic CO2. Maybe next time you see it you could jump in there and correct them.
You ask me to document. Do you seriously doubt that this has been said often here? Don’t you read the comments? I don’t keep an index, but I will flag future occasions for you benefit.
Seaice1,
Anyone with even a passing knowledge of WUWT knows that the vast majority here believes that natural mechanisms drive climate change, not human CO2. Why? Because there is so much scientific evidence to back up that stance!!! (Hint…the stuff we discuss more often than anything else) (Hint 2- if we talk about climate scientists who study natural mechanisms, and their research, we can’t possibly THINK/BELIEVE that they never do….)
So, again, if you want to sell this proposition, you are going to have to explain away ALL the studies discussed here, AND all the posts written by climate scientists here, that demonstrate testing and studies done on natural mechanisms and NOT human CO2. Because you look silly pretending that this paper is either the first, or the only one to ever discuss natural mechanisms.
i think given real world observations and the change of direction in politics they have been left with no option than to come up with some sciencesplaning to explain away previous hyperbole.
Exactly when did we transition over to this kind of certainty on the proportions of natural and human caused?
I wonder what the error term is on that estimate. I’m guessing the real error term is that “Natural variations in the Arctic climate “may be responsible for about 30–50 percent of the overall decline in September sea ice since 1979 … +/- 50%.”
That’s quite a claim. Now can they separate flea-fart methane from cow-fart methane effects? I really want to experience such feats of separation. How did they tag the human melting, and how did they tag the natural melting? How did they track it and keep track of such a clear division over the years?
Oh, ohkay, Jim, let’s admit that SOME natural causes might figure in, but how much should we say, …. 20%, 30%, more. Well let’s just go with 30% to 50% – it shows a range of uncertainty, within which we can still blame a lot of it on humans. 50% is a good midway figure. It sounds intelligent and looks good on paper.
The mythology continues.
Here’s an analysis of the academic article in question from Carbon Brief:
https://www.carbonbrief.org/humans-causing-up-to-two-thirds-arctic-summer-sea-ice-loss-study-confirms
According to Roz Pidcock’s article:
“Rising greenhouse gas emissions are responsible for at least half, possibly up to two-thirds, of the drop in summer sea ice in the Arctic since the late 1970s, according to new research. The remaining contribution is the result of natural fluctuations, say the authors.”
I’m surprised at the welcome being given to a paper co-written by Eric J Steig of “Steig et al” Antarctic Warming infamy.
I do hope his statistics-fu has come along since 2009.
Sadly, I think he’s incapable of progress. Though I did like his work on firn diffusion from a long time ago
Are the natural variations that caused past sea ice extent fluctuations the same as those that are causing the current one? That is the question.
Interesting in terms of magnitude. Meanwhile, surface temperature rise is more or less, 33% +/- GHG, 33% +/- other human caused (albedo mods, direct thermal flux, irrigation, etc), 33% +/- Ma Nature. So not too far off in terms of magnitude. Onward …
David – An Arctic indigenous person of my acquaintance asks me to tell you to “go f(r)@ck yourself”!
What should I reply on your behalf?
Fake news website. Total crap.
That is a harsh verdict on WUWT
Science News is a fake news Website? Or the journal Nature Climate Change?
This finding is interesting because it explains why antarctic ice is disappearing faster than the IPCC reports have all suggested. They assumed only anthropogenic warming and were unaware of the extra natural warming. If this is correct it lends more credence to the IPCC reports.
Antarctic sea ice hasn’t been disappearing. Until this super El Nino year, it was steadily increasing while Arctic ice declined, then stabilized.
IPCC has it all wrong, as in everything else.
Chimp – You seem to be the one that “has it all wrong”?
Arctic ice hasn’t “stabilized”. What makes you think it has?
If the Arctic Sea Ice Index was a stock, it would have established a support level at an annual average of 10.6 million sq km.
It’s actually demonstrated a quadruple bottom since 2007.
AFW,
The observations show that it has not made a new low since 2012, which only slightly exceeded the lows of 2007 and 2016. That is classic bottoming behavior.
As David says, if it were a stock Arctic sea ice would be flashing a Strong Buy signal, having formed a triple bottom.
Thus, there is no reason to imagine that it will keep getting lower, although it would be a good thing if it did return to its summer lows of the Medieval, Roman, Minoan, Egyptian and Holocene Optimum Warm Periods, ie most of the Holocene. We probably won’t be that lucky however, as the long term climatic trend remains cooling.
Chimp, I said antarctic when I meant arctic. Slip of the fingers, or brain. Nevertheless, if you substitute arctic the point stands. Arctic ice has reduced faster than IPCC estimated, and this natural component may be the reason why.
Is this an example of a Dead Polarbear Bounce or the opposite?
The first IPCC report (figure 3.8) contained a plot of Arctic Ice during the 1970s. It showed that in 1974, the minimum sea ice extent was circa 2 million sq. km below that of the 1979 level that is always used today from which to make the alarmist claims about dramatic loss of Arctic Ice. 1874 Arctic Ice extent is about the same as seen during the 2000s apart from a couple of years here and there.
Minimum Arctic Ice extent of about 5.8 million sq km was seen many times during the 20th century. There is nothing anomalous about today’s level of Arctic Ice extent, and it appears that Arctic Ice extent waxes and wanes in cycles, possibly in accordance with the unidentified natural variations mentioned in the subject matter of this post. I am sure that you will have read the Vinnikov et al 1980 paper. I set out their plot from the US Department of Energy 1985 Report since this is easier to paste.
What is strange about today when compared with say 1837, 1945, 1953/54, 1960?

“The IPCC works by assessing published literature (see IPCC Factsheet – What literature does the IPCC
assess?). ***It does not conduct its own scientific research ***. For all findings, author teams use defined language to characterize their degree of certainty in assessment conclusions 2 .”
1979 starts from a high. Had they started from say 1936, or say 1945, the position would look very different, and far less scary.

Richard,
Do you have a link to that DOE publication?
I’m sure I have the link somewhere David, but what’s the point?
Apart from other issues that graph covers a different “domain” to the current NSIDC extent metric.
I would like to see if I can correlate the older data to the satellite derived data… I’m a geologist… I correlate things.
DM try here
http://archives.aaas.org/docs/Projecting_Climate_Effects_Increasing_CO2.pdf
This is the version in my records:
https://www.osti.gov/scitech/biblio/5885458
I see this chart often: I consider it useless as it does not quantify what the arctic ocean area covered is, not does it continue to date to give us a comparison with other data.
and where did it come from?
“I see this chart often: I consider it useless as it does not …”
… Agree with your alarmist Guardianista nonsense religion, Skanky? Does Drillbit Dana not agree with it than?
I don’t think anyone gives a flying dog’s bollock what YOU consider useful or otherwise, you scientifically illiterate, mendacious, misogynistic little propagandist.
Have you apologised to Dr. Crockford yet?
I’ve added this to the post…
Addendum
Perspective: NSIDC Arctic Sea Ice Index Interactive Graph
[caption id="attachment_166478" align="alignnone" width="1880"] Chart 1: NSIDC Arctic Sea Ice Extent: 1981-2010 Median and first five years of data (1979-1983)[/caption]
[caption id="attachment_166479" align="alignnone" width="1880"] Chart 2: Chart 1 plus five most recent full years of data (2012-2016).[/caption]
[caption id="attachment_166480" align="alignnone" width="1880"] Chart 3: Chart 2 with +/- 2 standard deviations (natural variability) instead of 1981-2010 median.[/caption]
The five earliest years of data plot near +2 standard deviations. The five most recent full years of data plot near or just outside of -2 standard deviations. Ding et al., 2017 conclude that up to half of the difference is due to the NAO and other natural climate fluctuations.
[caption id="attachment_166481" align="alignnone" width="350"] If humans were the cause of the entire decline in Arctic sea ice extent, it would barely be anomalous. Since we’re only responsible for about half of it… Yawn.[/caption]
Have you tried doing a similar analysis using Arctic sea ice volume David?
See my “chart” above.
Albedo doesn’t really notice volume.
David – Whilst you could state it more clearly I agree that “albedo doesn’t really notice volume”.
But what’s your point? Sticking with your dubious stock market metaphor, there’s not even been a “double bottom” on Arctic sea ice volume at this time of year,
My point is that the kinves stopped falling in 2007.
afwetware. where will you get measured volume data for the arctic , it doesn’t exist.
How do you know the volumes? Until very recently that’s only been modelled. So there’s no historical data. Plus PIOMAS substantially disagrees with PIPS the older and in my humble opinion better model. So, the phrase…. It’s only a model… springs to mind..
David/Chimp – That’s curious, my “chart” seems to have vanished! Let me try once again.
Arctic sea ice isn’t a stock. Even if it were, take a look at this extremely bearish “chart” of February PIOMAS Arctic sea ice volume:

No doubt you can see the recent downside breakout? The trend is your friend until the bend in the end, but in this case the bend is in the direction of the trend!
Sea ice may not be a stock… but a quadruple bottom is 33% better than a triple bottom.
The extent has to recover before the volume.
that is a notional chart created by guesswork . not a measurement of sea ice volume in the arctic.
Again. Definitely only a model. Please try harder. Better still read more. Stay awake in lectures etc etc
Chilly – It’s not “a measurement” and it’s not “created by guesswork” either.
Bunny – The Ding, Schweiger et al. paper under discussion here is also based on the output of “models”. Why did David even bother writing his article if model outputs are mere “guesswork”, using Chilly’s elegant turn of phrase?
Both – Please be less patronising in future.
I wrote the article so I could have a reason to use the Anchorman and Home Alone gif’s… /Sarc
Models are tools, often very useful tools. But they aren’t observations.
So is PIOMAS a useful tool IYHO?
How about PIPS as recommended by Bunny, or ACNFS, or GOFS? Or even CICE as mentioned by Ding et al., 2017
Models are useful tools.
Tools have to be used properly.
When models are substituted for observations, the tool is being used improperly.
Sea ice extent is, to some degree model-based. The raw satellite images have to be calibrated to produce a sea ice extent map. Sea ice volume estimates basically take the same observations and employ a more complex model to generate a sea ice volume map.
The PIPS output was regularly tested by the Navy who were apparently very happy with it. PIOMAS not so much. But hey ho. You pays your money and you make your choice. You were saying with certainty that volumes have declined in line with PIOMAS estimates and personally I think that level of certainty is inappropriate.
Bunny – Now you’re putting words in my mouth. FYI what I said was:
“No doubt you can see the recent downside breakout? The trend is your friend until the bend in the end, but in this case the bend is in the direction of the trend!”
PIPS was superseded by ACNFS many moons ago. Where does that one stand in your pantheon of models. And how about the still more recent GOFS?
What is this trying to show? We see that the first 5 years cluster about 2sd above the average and the last 5 years cluster about 2 sd below the average. This clearly shows a massive decrease. Some of those lines are go way below the 2sd. What is this trying to prove? It seems to demonstrate that sea ice extent is reducing very significantly over this period.
It’s demonstrating that the sea ice extent has rarely exceeded natural variability.
Why do you think the variability displayed in those graphs is natural? They only go from 1979, which is when man-made is said to be significant.
Because the definition of natural variability is +/- 2 standard deviations.
But, it’s a good point. There are no comparable measurements of sea ice extent before 1979. So there is no way to know exactly how the 1979-2016 period compares to the early 20th century or Medieval Warm Period.
David there has recently been an assemblage of all the many and detialed sources on arctic ice extent going back to 1850.
and yes, we do have a very good idea of the extent back to that date and yes, we now see much lower extent than at any date in that period.
This article gives a useful summary and links to the research
https://www.carbonbrief.org/guest-post-piecing-together-arctic-sea-ice-history-1850
“First, there is no point in the past 150 years where sea ice extent is as small as it has been in recent years. Second, the rate of sea ice retreat in recent years is also unprecedented in the historical record.”
Yes, griffie, there is ice covering the Arctic Sea in winter time, and always will be. Glad you finally admit the truth.
” may be responsible for about 30–50% of the overall decline in September sea ice since 1979″
Hence, human CO2 emissions account for 50-70% of the overall decline. What a surprise.
Not.
**could be delayed if nature swings back to a cooler mode.**
Really? They actually admitted that!
“If this natural mode would stop or reverse in the near future, we would see a slow-down of the recent fast melting trend, or even a recovery of sea ice,” said lead author Qinghua Ding
Sorry, Dr. Ding, but that should be
“If this natural mode stopped or reversed in the near future, we would see a slow-down of the recent fast melting trend, or even a recovery of sea ice.”
No subjunctive “would” in the “if” clause.
(It’s OK as the past tense of “will”.)
Yes, I saw this same article yesterday on Reuters News, and a week or so ago, another article about the Northwest Passage being open enough now to offer cruises on an 800++ foot cruise ship for a mere $28,000. The ship has a golf range, too, if anyone is interested.
It’s a shame, isn’t it, that the planet can handle itself and doesn’t really need us to do anything except pick up after ourselves?
So the swings are natural. What about the roundabouts?
Based on my limited experience driving in the UK, roundabouts are evil.
No, not at all, way more efficient than the US 4-way intersection. But maybe you should google “The Magic Roundabout” in Swindon. You look at it and think “Whoever thought that up was mad!” but it works if you apply and stick to the rules.
When we went to the UK in 2006, we rented a car at Heathrow and drove from London to Bath. The M4 was fine. The “streets” in Bath were a nightmare. However, the worst part was returning the car to Heathrow. I was relying on a navigation device to guide me and it directed us into a roundabout that must have had 15 exits. The problem was that the navigation device was too slow. By the time it said, “take next exit,” we were past the exit. Needless to say, I managed to take all 14 wrong exits… 😉
I see you have visited Milton Keynes…
For once Geoff makes an eminently sensible observation. Milton Keynes is the spiritual home of both the roundabout and the concrete cow. On the plus side traffic does normally move quite easily….
Rounabouts, Milton Keyens? Well, at least they have them. Basingstoke was planed to have them but the local authority ran out of money. So no has none, but is called “Doughnut city”…
As for Bath, Bath is an old OLD city David. In fact people suffering from “Devonshire colic” used to visit Bath, to bathe in the baths, floating semi-weightless, cleansing the body. Of course this turned out to be lead poisoning.
I’ve never understood why Americans get into such a tizzy about roundabouts. It can’t be from driving on the other side of the road. It takes me about five minutes to get used to that when I change countries. Some deep-rooted belief that these things are un-American? But I recall driving round one on the way from Bangor to Boston in the US. (They called it a”rotary”, but it was just a big roundabout.) Puzzling.
Ah, well. “Time for bed”, said Zebedee.
Hey Patrick – in Hemel Hempstead they have a roundabout which consists of 7 mini roundabouts around a central roundabout.
Scares the heck out of me…
Warm air would take a long long long time to melt an iceberg. Warm water is what is melting the ice. With the polar winds changing direction, more ice will be kept is the cold polar region, so my bet is that the ice will be thickening, not thinning in the future. Tony Heller does a great job tracking those changes.
Climate “Science” on Trial; Sea Ice Sophistry
https://co2islife.wordpress.com/2017/01/28/climate-science-on-trial-sea-ice-sophistry/
Tony Heller is not a credible source or observer… he repeatedly cherry picks manipulates and I’m afraid falsifies arctic sea ice data.
The central arctic is warming… there are more storms bringing warm wet air into the central arctic in winter.
The ice has not thickened due to that this winter.
the central arctic is only warming in winter months , it is how the planet sheds excess heat. the ice has thickened this winter due to storms piling up newly formed ice on top of existing ice and mass ridging occurring due to same stormy winter. this melt season will be very interesting to watch.
I think the issue is more warm water is flowing to the Arctic. It is hard to believe near zero temperatures will melt that much ice. Also CO2 LWIR won’t warm water. Either way, it is hard to believe CO2 is the cause.
bitchilly – yes it will be a scary spectator sport watching the ice this year.
Co2 I think the point is in part it has not thickened as less heat was lost from the ocean and less bottom freeze occurred…
(plus the storms have broken up the ice)
and yes, there is a tongue of warm water running up the W coast of Svalbard…
Chilly – Do you actually have any evidence for your assertion that “the ice has thickened this winter due to storms piling up newly formed ice on top of existing ice and mass ridging occurring”?
Model outputs don’t count of course, since they are mere “guesswork”!
“Griff March 15, 2017 at 4:42 am”
Neither are you, Al Gore or The Guardian.
Yes, it is water that melts the vast majority of sea ice. The +AMO provides the warmer water and when the winds blow the ice toward the Atlantic that water melts more ice. The NAO is one of the reasons we get these winds.
This year has seen the winds blowing back toward the Pacific more often. This keeps the ice in the Arctic and thickens the ice. However, it also makes the extent look smaller because the warm Atlantic water blown toward the ice eats away at the edges.
In general this set up should lead to a larger summer minimum. But, that is also affected by the May-July winds and August storms. That is why it is impossible to predict at this time of year.
Yep, that was my understanding, and none of those natural events are caused by CO2.
No, that is not right.
There have been a series of strong storms across the arctic this winter which have blown the ice in many directions…
This does not necessarily thicken the ice… much ice has been exported out the Fram Strait to melt, much has been dispersed around Svalbard and the Kara Sea and in and out the Bering Strait.
given the ice thickness (not very) it is possible to predict rapid melt out in some areas and a very likely summer minimum in ‘bottom 3’ territory.
Qinghua Din lead author, has signed off on other papers with Willie “oilcan” Song, collector of 1+ million dollars from oil, energy & business PR propaganda poopers. G.D. has devoted many of his years to finding “natural variation” warming constructs. Hopefully, Willie shared more than a few bucks with his co-hort.
OMG, not that silly, long refuted nonsense. The money did not go directly to Willie Song. Step away from the propaganda, litesong.
Not refuted at all Richard
https://insideclimatenews.org/news/05042016/willie-soon-climate-change-contrarian-harvard-smithsonian-donors-trust-dark-money
Soon published 11 studies in nine scientific journals without disclosing that fossil fuel interests financed the work.
[snip – that’s out of line, and I just noticed this comment – you are now on moderation -Anthony]
How does this possibly meet the site policy standards?
[it doesn’t and has been deleted – filter didn’t catch his style, now it will -Anthony]
While Griff is wrong, the insults are definitely way out of line.