From NASA/GODDARD SPACE FLIGHT CENTER
The first images from the Solar Ultraviolet Imager or SUVI instrument aboard NOAA’s GOES-16 satellite have been successful, capturing a large coronal hole on Jan. 29, 2017.

The sun’s 11-year activity cycle is currently approaching solar minimum, and during this time powerful solar flares become scarce and coronal holes become the primary space weather phenomena – this one in particular initiated aurora throughout the polar regions. Coronal holes are areas where the sun’s corona appears darker because the plasma has high-speed streams open to interplanetary space, resulting in a cooler and lower-density area as compared to its surroundings.
SUVI is a telescope that monitors the sun in the extreme ultraviolet wavelength range. SUVI will capture full-disk solar images around-the-clock and will be able to see more of the environment around the sun than earlier NOAA geostationary satellites.
The sun’s upper atmosphere, or solar corona, consists of extremely hot plasma, an ionized gas. This plasma interacts with the sun’s powerful magnetic field, generating bright loops of material that can be heated to millions of degrees. Outside hot coronal loops, there are cool, dark regions called filaments, which can erupt and become a key source of space weather when the sun is active. Other dark regions are called coronal holes, which occur where the sun’s magnetic field allows plasma to stream away from the sun at high speed. The effects linked to coronal holes are generally milder than those of coronal mass ejections, but when the outflow of solar particles is intense – can pose risks to satellites in Earth orbit.
The solar corona is so hot that it is best observed with X-ray and extreme-ultraviolet (EUV) cameras. Various elements emit light at specific EUV and X-ray wavelengths depending on their temperature, so by observing in several different wavelengths, a picture of the complete temperature structure of the corona can be made. The GOES-16 SUVI observes the sun in six EUV channels.
Data from SUVI will provide an estimation of coronal plasma temperatures and emission measurements which are important to space weather forecasting. SUVI is essential to understanding active areas on the sun, solar flares and eruptions that may lead to coronal mass ejections which may impact Earth. Depending on the magnitude of a particular eruption, a geomagnetic storm can result that is powerful enough to disturb Earth’s magnetic field. Such an event may impact power grids by tripping circuit breakers, disrupt communication and satellite data collection by causing short-wave radio interference and damage orbiting satellites and their electronics. SUVI will allow the NOAA Space Weather Prediction Center to provide early space weather warnings to electric power companies, telecommunication providers and satellite operators.
SUVI replaces the GOES Solar X-ray Imager (SXI) instrument in previous GOES satellites and represents a change in both spectral coverage and spatial resolution over SXI.
NASA successfully launched GOES-R at 6:42 p.m. EST on Nov. 19, 2016, from Cape Canaveral Air Force Station in Florida and it was renamed GOES-16 when it achieved orbit. GOES-16 is now observing the planet from an equatorial view approximately 22,300 miles above the surface of Earth.
NOAA’s satellites are the backbone of its life-saving weather forecasts. GOES-16 will build upon and extend the more than 40-year legacy of satellite observations from NOAA that the American public has come to rely upon.
###
See time-lapse of the sun:
For more information about GOES-16, visit: http://www.goes-r.gov/ or http://www.nasa.gov/goes
To learn more about the GOES-16 SUVI instrument, visit:
http://www.goes-r.gov/spacesegment/suvi.html
This is a hot topic (just wanted to be first).
I second your emotion.
It certainly opens the door to some burning questions.
It occasionally flares up.
Bur those burning questions still leave gaping holes . One happening now
http://www.solarham.net/
I’m afraid early tomorrow we’ll have a mournful lament.
When will it be available on the Helioviewer?
Finally, we’ll see the effect of Anthropogenic Global Warming on the Sun. All those evil capitalist SUVs will be causing ‘climate change’ on the Sun. The only solution is to surrender political and economic sovereignty to the United Nations and the globalists *right now*. If you are a ‘denier’ and resist then the changes in the Sun are your fault.
/sarc
That would be ASU- Anthropogenic Solar Warming, probably caused isotopes of carbon.
This satellite is going to be awesome. Just wait until you watch thunderstorms in the spring and summer in real-time. Sea-ice movement, greening of the planet in the seasons. Lots more to come.
Goes16 will replace either GoesEast or GoesWest in the fall of 2017. Hope it will be sooner than that given the imagery we have already seen which means it is operating very well.
So it does not solely focus on the Sun?
Just Googled it . That IS going to be impressive. Japan is going to use the ABI system ( advanced Baseline Imager) on two more Japanese satellites. as well! https://en.wikipedia.org/wiki/GOES-16
Yeah, I’m confused as well. It’s “observing the planet” from an equatorial perch, but it’s also observing the Sun? That’s quite a pivot.
G2 level storm taking place as this was posted.
http://www.swpc.noaa.gov/
There doesn’t appear to be a 94 angstrom image available, like in the AIA data products. Anybody know why?
Since approximately Trump’s inauguration, I can’t see any NOAA websites during Australian daytime: “can’t find site, check the address.” I now have to wait until the sun rises in the U.S., after midnight Australian time. No problem accessing NASA sites.
The former Himawari-8 Loop of the Day page at RAMMB was appropriated for GOES-16 loops about 4 weeks ago, loops coming in March. (A few low-resolution loops can be found on youtube)
The manual for the Geocolor product says GOES16 doesn’t have a green channel. To make a full color image, a synthetic green channel is created, based on data from Himawari-8.
Does anyone have a clue as to why they might have made that decision? I would have thought green was important for identifying vegetation.
How do you produce a synthetic green channel from pictures taken on the other side of the globe?
they don’t need green, by the time it is properly active global warming will have scorched all the plant life on earth to a fiery orange colour that the telescope will see fine 😉
That’s not the technical answer I was hoping for. 🙂
But on that note, I found a study a few days ago claiming that in the 27 years period between 1982–2009, Earth’s vegetation increased to cover 18 million square kilometers of previously unvegetated land, equivalent to approximately 2.5 x the area of Australia.
► 2.5 x the area of Australia covered in new vegetation in just 27 years!
That’s a lot of new vegetation in a very short time, 70% of it attributed to rising levels of CO2.
The spectacular turquoise water in the Caribbean requires a green component.
I wonder where it came from / how they do it? Is there an “Ask NOAA” button somewhere?
“That’s a lot of new vegetation in a very short time, 70% of it attributed to rising levels of CO2.”
That’s the calculation for new areas of land that are greening.
Has anyone calculated how much the vegetation has increased on land already growing vegetation? The more CO2, the more robust and bigger the plants get, so the increases are occurring in the new and old areas of growth.
@Khwarizmi
I would have thought green was important for identifying vegetation.
Chlorophyll looks green because it strongly absorbs light in the red and blue regions of the solar spectrum and reflects green: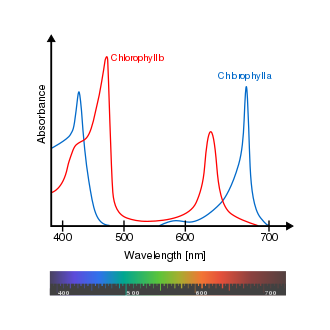
So the GOES-16 spectral response actually corresponds to the most photo-active channels responsible for converting carbon dioxide and water into glucose and oxygen:
6CO2 + 6H2O —[sunlight]—> C6H12O6 + 6O2
The best discriminator for detecting vegetation areas is to compare visible response with near-infrared response, because the cell structure of leaves highly reflects near-infrared light (even more than green):
http://earthobservatory.nasa.gov/Features/MeasuringVegetation/measuring_vegetation_2.php
v’
Thanks.
That helps me understand how they can use a different channel to track vegetation.
But it doesn’t explain how they simulate a green channel to produce a color scheme appropriate for the non-color blind.
Is that contraption solar wind powered?
Only during CMEs otherwise it relies on the Astro-Grid and Cosmic Battery as a backup.
Ya… “this one in particular initiated aurora throughout the polar regions”…and likely earthquakes to follow in the next 72 hours too. Explanations available over here, average successful prediction rates are over 80% for +6.5 Richter scale, etc etc. http://www.suspicious0bservers.org/ (March 1st Morning Report)
February sunspot number update: SSN for February is virtually unchanged at 15.7 (Jan. @ 15.5) in the classic Wolf numbers, while the new Svalgaard number is 26.1 (Jan @ 25.8)
Composite graph can be found here
The real question is now is what is to come? Will the sun do a repeat of the last minimum or are we to go into a Maunder Minimum and another little age or perhaps a full blown ice age?
as someone around bees a bit, the ongoing and now frequent coronal holes and the incoming effects on the magnetics is a real concern. the bees get rather cranky when solar storms are incoming. as to production? I guess we will find out the hard way.
but they DO use magnetic fields to navigate,
I noticed honey-bees raiding the bird feeders 2 weeks ago, they actually drove the birds away. I hope that means they’re making a local comeback, more honeybees seems to mean fewer yellowjackets.
At age 15 and 16 I worked summers for a beekeeper in N. Idaho. One day we arrived at a set of hives in an area with a nearby pine forest. The bees were extremely agitated, attacking us as we emerged from the truck. Normally they ignored us until we started opening hives. We noticed the ground around the hives seemed to me moving. Upon closer inspection there were thousands of yellowjackets and honeybees, locked in mortal combat, rolling around on the ground, mostly in pairs, but sometimes more than one yellowjacket fighting a honeybee. There was a population explosion of yellowjackets, and they were raiding the beehives. The beekeeper said he had known yellowjackets in sufficient numbers to wipe out entire stands of beehives. They ate the honey but also the honeybees themselves. The yellowjackets had an advantage in that they can sting more than once, and do not die after stinging like honeybees, whose barbed stinger usually get pulled from their bodies, along with entrails, thereby killing them. Henry David Thoreau once wrote about a similar “war” he observed between two species of ants.
From the article: “NOAA’s satellites are the backbone of its life-saving weather forecasts. GOES-16 will build upon and extend the more than 40-year legacy of satellite observations from NOAA that the American public has come to rely upon.”
Ironic comment considering the the CAGW community apparently has no faith whatsoever in satellite observations and readings. Or…, do they only accept satellite information which it fits their agenda?
GOES16 “Loop of the day” page start today.
http://rammb.cira.colostate.edu/ramsdis/online/loop_of_the_day/
2017/03/02 – Introducing GOES-16 Geocolor – Fires in east Texas.