Guest essay by Larry Hamlin
The new climate model study by Dr. Curry addressed in the February 21 WUWT article provides some very powerful conclusions regarding the unsuitability of using climate models for purposes of projecting future global climate behavior.

In the Executive Summary of this study Dr. Curry delivers the bottom line on the unsuitability of climate models for use in addressing future global climate behavior by noting:
“The climate model simulation results for the 21st century reported by the Intergovernmental Panel on Climate Change (IPCC) do not include key elements of climate variability, and hence are not useful as projections for how the 21st century will actually evolve.”
She further concludes that current climate models:
“are not fit for the purpose of attributing the causes of 20th century warming or for predicting global or regional climate change timescales of decades to centuries, with any high level of confidence.”
“are not fit for the purpose of justifying political policies to fundamentally alter world social, economic and energy systems.”
These are powerful and well supported conclusions which challenge the validity of global governmental political forces which have proposed massively costly, bureaucratically intrusive and economically damaging initiatives to address global CO2 emissions entirely based upon climate model results which Dr. Curry finds to be woefully inadequate and lacking in scientifically supportable evidence.
Dr. Curry’s new study describes global climate models (GMCs), how they are constructed using various schemes and assumptions to try and address the complicated processes of global climate and also assesses their reliability. She provides the following summary of GMC reliability:
“GCM predictions of the impact of increasing carbon dioxide on climate cannot be rigorously evaluated on timescales of the order of a century.”
“There has been insufficient exploration of GCM uncertainties.”
“There are an extremely large number of unconstrained choices in terms of selection model parameters and parameterizations”
“There has been a lack of formal model verification and validation, which is the norm for engineering and regulatory science.”
“GCMs are evaluated against the same observations used for model tuning.”
“There are concerns about a fundamental lack of predicability in a complex non-linear system.”
Additionally she addresses in detail and summarizes the basic failings and inadequacies of climate models in projecting excessively high global temperatures as a function of atmospheric CO2 levels and in dealing with the chaotic nature of the climate system and internal climate variability.
Figure 6 from Dr. Curry’s new study shows an updated IPCC AR5 Fig. 11.25 demonstrating that using temperature observations through 2015 the CMIP5 climate model simulations project warming, on average, about a factor of 2 higher than observed temperatures. She attributes this excessive projected warming to “a combination of inadequate simulations of natural internal variability and oversensitivity of the models to increasing carbon dioxide (ECS).”

Figures 2 and 3 from Dr. Curry’s new study show global surface temperature anomalies since 1850 and climate model simulations for the same period respectively. She notes that the modeled global temperatures match closely for the period 1970 to 2000 but fail to capture the warming period between 1910 and 1940.

The failure of climate models to address the earlier warming period is described by Dr. Curry as follows:
“If the warming since 1950 was caused by humans, then what caused the warming during the period 1910-1940? The period 1910-1940 comprises about 40% of the warming since 1900, but is associated with only 10% of the carbon dioxide increase since 1900. Clearly, human emissions of greenhouse gases played little role in this early warming. The mid-century period of slight cooling from 1945-1975 – referred as the ‘grand hiatus’ – has also not been satisfactorily explained.”
In the study Summary Dr. Curry further notes:
“The 21st century climate model projections do not include:
a range of scenarios for volcanic eruptions
a possible scenario for solar cooling, analogous to the solar minimum being predicted by Russian scientists
the possibility that climate sensitivity is a factor of two lower than that simulated by most climate models
realistic simulations of the phasing and amplitude of decadal – to century- scale natural internal variability”
“Hence we don’t have a good understanding of the relative climate impacts of the above or their potential impacts on the evolution of the 21st century climate.”
The models do not track historical temperatures, which is why the manipulation of historic temperatures is such a contentious and important issue. Karl and his crew are engaging in the Texas Marksman game.
Karl et al was scientific frawd. That he did not archive the data and now claims to have lost it so can not even reproduce his own results speaks volumes. The paper should be retracted.
etc. etc.
Curry’s article for GWPF was not a “study”, it was a non technical explanation of the limitations of computer models of climate.
Nothing wrong with her article but don’t try to give unwarranted status by repeatedly referring to it as a “study”.
sounds like it was a STUDY of the limitations of computer models of climate. … you moron …
You’re full of sh*t.
Greg February 26, 2017 at 1:10 pm
Karl et al was scientific frawd. That he did not archive the data and now claims to have lost it so can not even reproduce his own results speaks volumes.
Karl did not make that claim about losing the data, it was a story circulated by Bates which appears not to be true.
Anthony: Curry should have a “Dr.” before her name in the sidebar.
“Figure 6 from Dr. Curry’s new study shows an updated IPCC AR5 Fig. 11.25 demonstrating that using temperature observations through 2015 the CMIP5 climate model simulations project warming, on average, about a factor of 2 higher than observed temperatures. She attributes this excessive projected warming to “a combination of inadequate simulations of natural internal variability and oversensitivity of the models to increasing carbon dioxide (ECS).”
Ah no. she used an old chart, even when the newest has been available.
none of her “conclusions” were supported. There was no code supplied, no data. No way to check her assertions. The charts she used were out of date. She did not follow any of feynman’s rules in detailing the ways she could be wrong.
As for the 1910-1940 period, about half of the warming is due to AGW, the other half due to natural forcings.. She doesnt even mention the work on this particular period.
The models will remain useful as long as policy makers choose to use them.
policy makers decide.. not scientists, not blog commenters. Policy makers decide what information is useful for their decision making process. They decide. Its not logical, it not scientific,
I’ve said this a bunch of times.. now with different policy makers in power, folks may finally GET IT.
Policy makers (users) decide when a model is useful and for what purpose.
There is no decision on the part of the deciders. It is my understanding policy makers are simply told the science is settled — they can choose to accept whether it’s actually settled or not, at their own political peril.
As you say, none of this is grounded in anything like science. Science does not claim to be able to predict the weather 100 years from now. That’s for polemicists in lab coats.
Climate scientists predict climate, not weather. However, even without being a climate scientist, I can demonstrate your fallacy: I predict that in 100 years the boreal summer will be warmer in the Northern Hemisphere than the winter. I also predict that if you gamble at a casino for the next 100 years you will lose money, even though I freely admit that I can’t predict how the dice will roll exactly 100 years from now.
Mr. Mosher –
I believe you are correct that policy makers do, in fact, make decisions based on the information and associated uncertainty estimates at their disposal. But in the rational engineering disciplines, (which doesn’t include climate science), practitioners strive for predictive accuracy, uncertainty measures, and identification of potential low probability (black-swan) events. This is why politicians in the climate scare game can proceed with impunity. Thank you Steven for supporting their scam!
Dear Moderator – I’ve posted two inoffensive, polite responses today of WUWT; a website that I respect. Each post was put into moderation. I fully understand how difficult it is to moderate the traffic WUWT has. But how can I remove my personal info from you site … since I get no value from you having it. YEAH: I’M MAD
[be mad all you want, the fault is yours. Whatever you put in the comment form is what gets displayed. You are responsible for that, not us. All new commenters are held for moderation until they can be inspected, otherwise we’d be flooded with spam and cuss words -mod]
The CMIP5 models were tuned to hindcast the historical period (whose last year was 2005), especially the period from 1975 to 2005, without consideration for the Atlantic Multidecadal Oscillation and the like – which was/were contributing to a rapid global temperature upswing from the early 1970s to a few years after 2000. I think the AMO (and any related such stuff) contributed about .2-.22 degree of the rapid warming from the early-mid 1970s to around 2004-2005. If the CMIP5 models were tuned to hindcast about .2-.22 degree C less warming during this period than they did, then I think they would have produced more realistic projections of temperature increase from 2005 onward.
Several years ago I used Fourier on HadCRUT3 (UEA version annual figures or averages of each year’s 12 monthly figures) from 1877 to 2005 and found a cosine with a period of 64 years and a peak-to-peak amplitude of .218 degree C.
Published by Nicola Scafetta in 2012, finding an amplitude of 0.1+- 0.01 for the zero to peak amplitude of a 60yr cycle. Paper was quite seminal, but not widely quoted, for reasons readers will have to guess for themselves.
Journal ofAtmosphericandSolar-TerrestrialPhysics80(2012)124–137
Scafetta has published a series of follow-on papers which will be of interest to those thinking about natural variations.
The same cycle and amplitude found in a major collaborative work between NOAA and Princeton Univ, looking at both observational SST and model-based decadal variability:
Barcikowska, M., T. Knutson, and R. Zhang, 2016: Observed and simulated
fingerprints of multidecadal climate variability, and their contributions to periods of
global SST stagnation. J. Climate. doi:10.1175/JCLI-D-16-0443.1, in press.
I thought that any Fourier analysis required de-trended data and that the trend is the main signal in climate science. The period 1877 to 2005 is 128 years, only twice the period of your signal. Seems suspicious…
Steve from Rockwood: A cosine function with a whole number of cycles or a sine function with an odd number of half cycles has no linear trend. My efforts back when I did this were to identify the period in HadCRUT3 (starting in the warm times around the 1877-1878 El Nino, and ending around the 2004-2005 warm bump) that had the strongest two-cycle cosine component.
A more thorough investigation would be to remove the best-fit exponential function having growth rate same as that of the best-fit exponential function in the CO2 record (one ending a few years ago, perhaps ending with 2010 to account for lag), then remove any linear trend, and after that a more proper Fourier analysis on the whole HadCRUT3 or HadCRUT4 (or choice of version of HadCRUT4) record can be performed.
Have a look at HadCRUT3 (red) and HadCRUT4 (green), smoothed by a 9 year 1 month averaging function (each month gets averaged with the prior 54 months and the following 54 months):
http://woodfortrees.org/graph/hadcrut3gl/mean:109/plot/hadcrut4gl/mean:109
A periodic item with period a little over 60 years shows in both. HadCRUT4 differs from HadCRUT3 mainly by:
1) HadCRUT4 has slightly less of a WWII bump and less of an early 1950s dip and general late 1940s to mid 1960s depression than HadCRUT3. This is due to the sea surface temperature of HadCRUT4 factoring for changes of nationality and military/civilian nature of ships measuring sea surface temperature around and after WWII and the biases relative to each other in the measurement methods used in the kinds/nationalities of ships.
2) HadCRUT4 catches and HadCRUT3 does not catch the spiking of the 2014-2016 prolonged El Nino, which peaked at ~20-30 year class peak intensity in the 2015-2016 El Nino season.
3) HadCRUT4 (especially versions more recent than HadCRUT4.2) has its land component being warmer and more-warming than that of HadCRUT3 after 1998 (and cooler from around 1855 to around 1885). This seems to be from the land component change to include more of the Arctic, which has a regional “polar amplification” positive feedback mechanism much more than the Antarctic has.
Many years ago I heard Dr Hansen’s ex supervisor tell a reporter that Hansen’s models will never predict anything, ever- EVER – because they are hoaxes. They dont have, said his supervisor, the law of thermodynamics to discover the temperature of some atmospheric air.
Sure enough many years later those taking his type climate models apart found: no law of thermodynamics for solving temperature of atmospheric air.
It’s fake.
From the very first word to the very last word, it’s fake.
If it weren’t, it’s ignoratnt barking loons would be able to discuss the temperature of the atmosphere without humiliating, un-physical, impossible descriptions coming from them
that humiliate them so bad they have to fall back on excuses that science is political and you don’t get truth by doing science right.
Thanks for alerting us to this. Here’s what Hansen’s supervisor actually said.
Somehow nobody has ever been called to account for this crap. The alarmists have been able to deal with it by ignoring it. There has been senate testimony but no action. Drain the swamp please Mr. President.
Hansen’s supervisor: “…the models do not realistically simulate the climate system because there are many very important sub-grid scale processes that the models either replicate poorly or completely omit.”
When I was a programmer for NOAA in Boulder, Colorado back in the early 1970’s, my supervisors (Stan Barnes & Doug Lilly from NCAR) told me that to get weather projections beyond 15 days would require a grid size that would adequately capture energy transport of dust devils in every desert, plowed field, etc.
He also said what I told you in an NPR radio broadcast. He blew the whistle on Hansen multiple times, multiple ways, and retired, at war with Hansen due to the fact that he, and everybody else who just happened to come across news of what Hansen was doing, knew it was fraud: knew there would be no way to hide that it was fraud, and thought people would be furious to find it out.
Hansen was also taken to task for his fraud on actual film. There were multiple films of the two of them arguing on Youtube for some years but about 5 years ago I searched around a little bit and didn’t find any of them. I definitely heard his supervisor say, precisely what I told that he said, and he discussed it at length, much more in detail than what I reported here.
He explained that it’s counter-intuitive, but that the real law of thermodynamics for solving atmospheric temperature, doesn’t allow for CO2 to alter the temperature of atmospheric mix, because Nitrogen, Oxygen, Argon, CO2, Methane etc all get identical specific energies in any real, standard gas calculations involving atmospheric mix.
EGIEGO – Expensive…
E Mendes wrote, “He explained that… the real law of thermodynamics for solving atmospheric temperature, doesn’t allow for CO2 to alter the temperature of atmospheric mix, because Nitrogen, Oxygen, Argon, CO2, Methane etc all get identical specific energies in any real, standard gas calculations involving atmospheric mix.”
It is true that, because of extremely frequent collisional energy transfers, all the gases in the atmosphere have very nearly identical temperatures, until you get way above altitudes of interest to humans. However, that doesn’t mean CO2 cannot alter the temperature of the atmosphere. It just means that when CO2 absorbs IR, the energy that it absorbs is immediately “spread around,” and warms the whole atmosphere a little bit, rather than warming just the CO2 a lot.
Christopher Essex explains this rather well from the ~26 min mark of
The Kolmogorov microscale for atmospheric turbulent flow is ~1mm. This is the grid size that would be needed to do “proper” computing – an impossible problem to tackle for all sorts of practical reasons. I don’t know what the current grid size “resolution” is today, but Essex quotes “hundreds of kilometres”. At this size, many very important real climate features become invisible – for instance, the millions of thunderstorms each year, which transport a HUGE amount of heat between the ground and space.
The GCMs have to “fake” all of these processes (with scales less than the grid size) with their (non-physical) tuneable parameters. This feature enables them to “refit” their model runs (after the event) to make them NOW look “reasonable” in terms of hindcast capability (now that they have that data) and then to claim, on that basis, that the “new improved” models are now a stunning success. So looking at their future “predictions” – “Yes … manmade global warming is still happening. And it’s even worse than we thought!” Ergo … the science is settled.
…and no, we shouldn’t have to use them until something better comes along. Doing so would be similar to sticking with medically using leeches and bleeding until “something better comes along” even after it was shown the leeches and bleeding are actually harmful.
Not true
http://sciencenetlinks.com/science-news/science-updates/modern-leeching/
&
I have a relative who had medical maggots to clean a wound that conventional surgery & antibiotics didn’t touch, she has a large hole in her leg…. but no amputation.
1saveenergy February 26, 2017 at 2:50 pm : Not, not true. Leeches and maggots are as unrelated as you are to a fish, roughly. They do not leech blood, an irrelevant action; but do ingest necrotic tissues and effectively sterilise the area.
Both leeches and maggots still have medical uses as you said. Leeches improve blood flow and restore circulation whereas maggots clean wounds.
The humble leech’s medical magic
http://news.bbc.co.uk/1/hi/health/3858087.stm
Maggot medicine gains popularity
http://news.bbc.co.uk/1/hi/health/1907065.stm
There are recognized medicinal applications for leeches as well…they are used after reattachment of limbs and fingers, to impede clotting, and improve blood flow in the attached limb..
But your point is correct.
Brett
Honest question: where does maggot poop go if they “ingest necrotic tissues and effectively sterilise the area”?
maybe I should have written “It’s ignoratti barking loons” in place of that typo, lol
Why don’t we want nicer weather, again?
Yes, especially when we know whatever warming occurs will be mostly owing to natural processes. Might as well just lie back and enjoy it. The plant kingdom will surely enjoy any actual warming. 🙂
It’s a damn shame Curry has to waste her enormous talent on formally disproving claims which are intuitively obvious fraud.
Other research notes the issue of natural climate variation that in the past looks very much like today.
https://www.researchgate.net/publication/261404049_Inter-hemispheric_temperature_variability_over_the_last_millennium
One would think that with all the global pollution emitted from 1938 to 1945 (WWII), we would see a spike in temperatures. Since we do not should give us a hint that perhaps pollution is not the major climate factor many on the left believe.
Perhaps a lot of aerosols.
Nice summary of Judith’s article for GWPF. For more in depth on models, parameterization, tuning methods, and the attribution problem see my previous guest post here on models.
Let’s go back to a simple energy balance model. The real issue is more CO2. All it can do is reduce the heat leaving the planet which will cause global temperature to rise a little. Factor in the major feedback factors that can be estimated separately. Models incorrectly show cloud cover positive and underestimate sea surface evaporation because of excessive humidity. Also the real rate of CO2 increase to about ½ now used in models. Finally note that most warming is in winter in the colder climates where reduced water vapor enhances CO2 effect.
The HadCRUT4.4 data set did not exist in 2005. Models should be compared to the data sets used as a reference to run the models.
Can someone recommend a primer on what is actually calculated in GCMs. I understand they are ensembles. Are they iteratively solved separately until boundary conditions match? What form of the Navier Stokes equations are actually used? What CFD codes are typically used? I can foind some piecemeal articles, But I would like an overview of the entire GCM. I am familiar with CFD, FEA, numerical techniques, fluid dynamics, etc., so am looking for something beyond a layman’s guide. Thanks.
If you want to get into model guts, and have the math chops, read the technical documentation for NCAR Cam3 (now Cam5). 226 pages. Available free online as NCAR/TN-464+STR (2004). CAM has several coupled submodels. (ocean, ice,…) you can read about at NCAR. The tech doc is for the atmosphere.
Give up some links please Rud. Save us the searching if possible.
TIA
http://www.cesm.ucar.edu/models/atm-cam/docs/description/description.pdf
Thanks, Ristvan, I just googled it and found it immediately. It is pretty extensive.
They don’t actually calculate anything John Public, see Michael and Ronan Connolly who started the Ireland National Aquarium, on their expose on what they found when taking those disgusting frauds’ ”work” apart.
Ronan is a national programming competition winner and his father teaches chemistry and electronic engineering.
It’s very interesting what you’re gonna see.
Note also my first post above.
They don’t actually calculate anything John Public, see Michael and Ronan Connolly who started the Ireland National Aquarium, on their expose on what they found when taking those disgusting frauds’ ”work” apart.
Ronan is a national programming competition winner and his father teaches chemistry and electronic engineering.
It’s very interesting what you’re gonna see. Note also what I said above, at 11:37am
Whatever you do, don’t read Harry_read_me. You’ll have a fit!
Climate is a regional thing with few major and many minor factors. The major factors persist while the lesser ones may temporarily dominate, but their contribution eventually diminish in order to return with some unrecognised or ill defined periodicity.
Any attempt to identify decadal global trends accurately in whatever aspect (temperature, precipitation, extreme events, etc. ..) is a task doomed to failure.
GMC or GCM? (paragraph 7)
There’s one glaring typo needing fixing, “GMC” in the first reference to what should be “GCM”. An article this good deserve a correction! GMC is a truck.
The bottom line is if something is understood, it can be modeled.
Climate “Science” on Trial; If Something is Understood, it can be Modeled
https://co2islife.wordpress.com/2017/02/06/climate-science-on-trial-if-something-is-understood-it-can-be-modeled/
Facts are, the climate models are a complete joke. In any real science the R-Squareds and reproducibility determine the truth. Climate “science” has none of the characteristics associated with a real science.
Climate “Science” on Trial; The Criminal Case Against the Alarmists
https://co2islife.wordpress.com/2017/02/21/climate-science-on-trial-the-criminal-case-against-the-alarmists/
Dr. Curry argues that these are highly complex models, they aren’t. They are deliberately designed to manufacture the illusion of a linear relationship between CO2 and Temperature, and the data is adjusted accordingly. In reality, a real climate model would be infinitely complex. In reality, the climate models can be written on a napkin, they are a laughable joke. ?w=559&h=420
Climate “Science” on Trial; The Criminal Case Against the Alarmists
https://co2islife.wordpress.com/2017/02/21/climate-science-on-trial-the-criminal-case-against-the-alarmists/
Perfectly well put with that 12:17 PM post, co2islife. I am a mathematician who worked in networking and understand programming and indeed – what you said is correct to the letter. I haven’t checked every word in the links you provided but as put, what you wrote, is precisely the way it is.
Thanks a million for those comments, they are greatly appreciated.
Of course they are complex but the complexity is a charade.
I really enjoyed your linked article. It explains the basis for the failure of the models at a level a layman such as I can understand.
I can’t thank you enough for those comments. That was the entire objective. Thanks again, and be sure to share. The more people that learn the facts, the better off we will all be.
Some time ago on WUWT Willis put forward a simple model that duplicated to a high precision the results of the climate models, showing that CO2 and aerosols were the tuning knobs, with no requirement to run supercomputers to achieve the same results as the GCM forecasts.
It was a very interesting article. What Willis showed was that there an infinite number of CO2 levels that resulted in the same level of warming, so long as the CO2 was offset by aerosols. In other words, according to the GCM’s, CO2 was not a problem so long as aerosols were emitted in the correct balance, and temperature rise could be controlled to any level desired, without cutting CO2 emissions.
From Steve Mac … https://climateaudit.org/2013/07/21/results-from-a-low-sensitivity-model/
Yep, you can also demonstrate that with MODTRAN, and isolate the layer to the lower 1km of the atmosphere.
Smoking Gun #12: Doubling CO2 has NO MEASURABLE IMPACT on the lower atmosphere temperature, none
https://co2islife.wordpress.com/2017/01/17/climate-science-on-trial-the-forensic-files-exhibit-l/
They are highly complex models designed to deliberately designed to identify the linear relationship between CO2 and temperature.
The models basically boil down to a single variable linear regression model. I don’t think I would call that “complex.” IMHO they aren’t intended to model the climate, they are modeled to create the illusion that CO2 and temperature are related. That is why they have to adjust the temperature data, and make it more linear.
They are complex models, but that complexity does not mirror or match the complexity that is supposedly being modeled. That is the sleight of hand of such things.
Years ago when I was building my first models, my boss told me off for claiming “spurious accuracy” through making my models more “complex” (i.e. having more lines). Ever sine I have tried to avoid making models more complex when that complexity does not provide any more accuracy – even though it then looks better to clients!.
Yep, but that is also why you have adj R-Squared. Each additional variable will increase R-Squared, but if it isn’t helping the model the adj R-Squared will decrease.
Does a more complex representation imply a more accurate/useful representation? For example: is it really necessary to simulate a pilot initiating a manoeuvre and then representing the aircraft response by solving a shed-load of partial differential equations when it is known that a pilot can change heading, height and speed within a definable accuracy?
More complexity certainly provides significantly more room for modelling errors to be introduced which suggests that a more complex model might not be more accurate. It should also be clear that the more complex the representations in a model are, the more robust the Verification & Verification phase needs to be. Without a comprehensive comparison of the model against measured data in dedicated trials how can a model be declared ‘fit for purpose’? Which begs another question: what does ‘fit for purpose’ mean in the climate world? Is there for each of the global models, I wonder, a requirement specification that says something like: for any given scenario the model shall be able to provide representations of temperature to an accuracy of, say, +/- 1C and that the model will be correct in its ‘projected’ temperature on 95% of occasions in, say, 100 years time? If the answer is: “no, how could we possibly meet such a requirement?” then it’s clear that the system cannot be modelled with any degree of confidence for those circumstances. The model is, therefore, of limited value – and even to be of limited value the user has to be aware of the model’s limitations. Is that the case in the climate world I wonder?
Ooops, Verification and Validation
This is one of the issues I am trying to get at. I asked Judith Curry on Twitter if there are any GCM currently existent that intrinsically PREDICT the forcings, (rather than assume them). She has yet to answer. I am pretty sure the answer is NO. The complexity and cost (size, time to run, #cores, RAM, etc.) of the model required (if we even had the relevant inputs available) would be beyond today’s computer power.
Basically, if such a model existed (and it does in physical form- known as “earth”), the only input required would be solar irradiance hitting the top of the atmosphere (fully described in time, wavelength, locations, etc.) plus any conduction rates through the mantle, some initial state, and models of all the relationships occurring between radation in the atmosphere, surfaces, etc. Of course this is unimaginably complex.
We know for a fact what models they do have don’t explain the temperature very well…if at all. Also, the “forcing” of CO2 isn’t linear, and what models they do have are linear. The S-Squards of the models prove they are failures.
Ok. So going back to basics:
Energy Balance for earth-atmosphere-other (ocean, sea ice, land, etc.) system
Out = In + Accumulation. (1 and only)
The In we pretty much know (at the outer boundary). The Out we are starting to measure (I think, with satellites), but for most purposes we calculate it. So the “greenhouse” effect is mainly about [temporary] Accumulation.
My understanding is that when CO2 is projected to increase in a model, a “forcing” is applied, meaning that energy is added to the system. This is basically a forced realization of the assumption that CO2 increase leads to a certain amount of [linear] energy increase. Now they cannot just create energy, so they must create additional accumulation. They must increase the caloric content of the atmosphere, oceans, etc. (per model specific partitioning functions), then recalculate the interactions that would normally account for the In + Out portions to accommodate the “forced” accumulation (and thus maintain a temporally correct energy balance). Does this sound correct?
Of course they aren’t. This is why no one even attempts to predict anything in climate science, they are doing projections.
A great advance.
Through in a few circuit boards and you longer need to look into a crystal ball, it will project stuff onto the wall!
(Of course, you still have to massage it a bit to get the picture you want. 😎
TYPO!
“Through in a few circuit boards”
Should be:
“Throw in a few circuit boards”
And, it appears, that what “projected” against the wall is beginning to peel off.
Just as well it wasn’t projected into a fan, like it normally is.
Yes, their noses are projecting further and further as they publish their model-based Lysenkoist papers.
However, they are using projections to imply predictions to justify global control (loss of freedom) of societies.
Oh yes, they throw out projections. All scenarios are projected. That nobody can grab them for their crap at the collar. Like an eel in the mud. They have a suitable scenario for each situation. And if it does not happen, they have just been wrong. Can times occur. To err is human. Headache the money continues to flow.
“predictions” or “projections” the same rule applies: Garbage In = Garbage Out. Add the butterfly effect and you’ll find that even a small load of garbage In results in disproportionally large amounts of garbage out.
Since those ‘projections’ morph into calls for political action, I fail to see the distinction between ‘projection’ and ‘prediction’ as used by climate ‘science’.
IPCC 1 already said you cannot predict future climate. So, they changed the name from “predict” to “project”, and pretend that these projections can predict future climate. Something they have already admitted cannot be done by predictions.
So the difference between predictions and projections is that projections can predict the future while predictions cannot. Next up, we change the name of Global Warming to Climate Change, because warming is only true if temperatures go up, while change is true if they go up or down.
So the pause would be called climate stasis.
“they are doing projections”
No, they aren’t. A projection is a prediction made by extending a trend line into the future. Since we don’t actually have trend lines (not for ~20 years, we haven’t), you can’t project it into the future.
What they are doing isn’t projecting a trend line. It is what we in the industry call “making it up.”
There is a big difference between the terms “prediction” &. “projection”. Prediction is a scientific concept with well defined, specific meaning, it is at the core of the scientific method, while projection is just another word, it can mean whatever you like. This is why it is attractive.
On the other hand, projection is easy-peasy.
Thanks for the laugh.
The IPCC is using ground measurements to make their models appear to be doing a better job then they are. That is why they must most the temperatures more linear. The models are linear.
A few more colours would make that graph a bit easier to follow.
http://www.ipcc.ch/report/graphics/index.php?t=Assessment%20Reports&r=AR5%20-%20WG1&f=Chapter%2012
All graphs look linear on a small enough interval. There is no conspiracy to make observed trends or models look linear and in the long run they are not.
Sorry, link was to all graphics in Chapter 12: This was the one I had in mind
http://www.climatechange2013.org/images/figures/WGI_AR5_Fig12-5.jpg
Really? Then how do you explain the “abjustments” and deviation from satellite and balloon?
Curry’s conclusions are so obvious they hardly needed to be stated, let alone the subject of numerous news stories, but such is the state of the science today that her banalities will be treated as most blasphemous heresies.
No doubt the fatwas are already being issued. CAGW and radical Islam will be remembered as the two most stupidly destructive popular ideologies of our time.
The article was not ‘banalities’ is was a non technical guide to the limitations of GCMs and their fitness for purpose in predicting future climate and the effects of a human emissions.
Since most people are of the impression that climate models are built on “basic physics” this lies needs exposing to those who are not technically up to speed on the details of climate research.
Care to change the title?
Sounds funny.
And, if AGW is real, the renewable energy subsidy prescriptions enacted for a fast buck to exploit the irrational fear spread in the name of climate change MUST make it worse in fact, as net CO2 emissions from the grid system are made worse than prefering gas replacing coal then nuclear replacing both, with NO renewables. We lose many $Billions pa pointlessly enriching the renewables fraudsters.
Example? Consider the limiting condition. Renewables “offsetting” ALL grid fossil generation, on which they depend for their subsidies and the other 2/3 of the paired output, will be lucky to make 33% duty cycle hence CO2 reduction. Clean gas replaing coal reduces those CO2 emissions by 60%, 24/7, so can achieve c.40% CO2 reduction on the grid overall, on existing sites, unsubsidised. Nuclear will take that to zero, agin with no additional environmental imapct or land use, hydro does the load balancing. No subsidies required for the very best results on every policy measure. You have been massively conned by a decitful legalised climate change protection racket by politicains in the renewables trough. – “Planets can catch fire”…….Go figure.
The inconvenient truth is the proxy solutions for a undefined problem, renewables, in the context of a grid system and their energy density and intermittency, are inadeqauate, unaffordable, unsustainable and unreliable, compared to the better unsubsidised options we already had. Subsidies can’t change these fundamental characteristics of the energy sources, that we abandoned to achieve industrialised then develped economic status. A fortiore when their fossil host is gone and we need 2 then 3 times the energy for transport and heating, that is now fuelled by primary fossil burning – woefully inadequate.
For any physicist or engineer to support such a fraud on the engineerig facts should get them struck off for malpractice, IMO (i). Numbers in my paper are all for the `UK, but you could get similar answers for USA, which has similar heterogenous mix of base load energy supply on the grid, with some small but useful peak solar available down South where demand overlaps supply, that we don’t at 50 degrees north. New York is already 44% gas, 31% nuclear, 19% hydro BTW. You can live off the grid if you like. And pay the price.
All modalities are welcome, but no subsidies. I have no problem with, and would support, fiscal levelling so investors are indifferent to the various pay back periods and CAPEX/OPEX mixes. Same lifetime IRR and risk profile.
https://dl.dropboxusercontent.com/u/1976309/THE%20ECONOMIC%20IMPACT%20OF%20SCIENCE%20DENIAL%20IN%20ENERGY%20POLICY.doc
(i) I let biologists and pretend medical “Doctors” (no PhD) and soft “scientists” off. Most have NO idea what they are talking about on energy, or physics, experimental success is more than 50% to some. By their degree shall ye know the “near enough” pseudo scientists from the hard scientists. Good work, but not physics that has to deliver as adverised, every time. I just wish the worst offender celebrity scientists like Paul Nurse and Robert Winston, et al, would understand they have no idea what they are talking about on energy, and keep their uprovable beliefs to themselves. Such eminent celebrities long ago eschewed the scientific disciplines of sticking to what you understand and absolute proof, and fail science every time they conflate climate change with the very bogus solution of over-subsidised renewable energy, in public or with anyone in politics. Just isn’t the fact. Do they even know?
Science denial looks like this.
“a possible scenario for solar cooling, analogous to the solar minimum being predicted by Russian scientists”
Oh no, the Russians hacked the climate as well ??
Greg February 26, 2017 at 1:33 pm : Good thing Trumpy has Russia covered too…. No problemo, senor.
I bought the book “Predictability of Weather and Climate” by by Tim Palmer and Renate Hagedorn in order to understand how they modelled natural variation in the climate models.
There was one line in the book which more or less said they didn’t model it.
That is the fundamental problem with this whole sorry subject.
the climate models cannot model natural variability because the cause of natural variability is not understood.
quite simply, no one knows what caused the little ice age or the medieval warming, etc., so these events are extremely difficult (impossible) to model.
So climate science pretends these previous climate changes don’t exist. The typical excuse is to claim these climate changes were regional and thus can be ignored. Without ever considering that if you make one region of the globe warmer, this raises the average temperature.
As such, regional warming will appear global when one talks about global average temperature. As such, whether warming is regional is irrelevant if your metric is global average temperature. Everything appears global, regardless of how regional it may be.
Both interesting and amusing. You’re right – on that basis, all of the polar ice could melt away, but everything would be still “business as usual” provided the tropics cooled down a bit from all that cold water thus produced. We could all remain in our happy hiatus … apparently, nothing would have changed! Too funny.
But so much of their nonsense is locked into the fra-d of so called mitigation of their so called CAGW.
Even Dr Hansen the father of their so called CAGW knows that S&W are BS and fra-d. And Lomborg’s PR study of Paris COP 21 is correct even after using a much higher climate sensitivity that can be justified when compared to the more recent Climate Sensitivity studies. Like Lewis and Curry 2015.
In OZ Labor and the Greens continue to lie to the Aussie people about the consequences of their co2 reduction policies and yet most of the MSM refuse to challenge these stupid falsehoods.
This is very simple maths and science that anyone can understand and yet Labor would waste endless billions $ for no measurable change to temp at all. Of course their bi-polar remedy would also include exporting millions tonnes of coal and gas overseas to any country that wanted it.
IOW Labor couldn’t care less about co2 emissions at all, but would happily harm Aussies by forcing them to use fairy tale , unreliable and super expensive energy like S&W. Unbelievable but true.
Oh and the 2016 US govt EIA study tells us on page 3 that co2 emissions will increase by 34% by 2040. If that’s true even Lomborg’s COP 21 study is a wild exaggeration. The IEA ( EU based) told Lomborg that solar and wind would produce about 2.5% of TOTAL world energy by 2040. Their mitigation is a silly fairy tale and yet few in the media have the wit or guts to challenge their bogus claims. Here’s Lomborg’s Paris COP 21 study.
http://www.lomborg.com/press-release-research-reveals-negligible-impact-of-paris-climate-promises
Ha! And now in Oz we are repeatedly told that renewables are not the cause of skyrocketing electricity process, it’s that pesky free market economy that dun it!
In one fell swoop the econuts reveal their intentions to destroy capitalism with lies.
This is actually incorrect. It is not a study. It is an expert opinion article. They are quite different things.
I once read the beginning of an article, written by a HARVARD climate scientist, that began with these words: “I created a synthetic data base”. I stared at the word “synthetic” for a long time, not believing what my mind was thinking.
Anyway, his “data” conclusively proved that it was a sudden, completely mysterious, increase in the CO2 that ended the last ice age. And by the way I owned a home just 3 miles north from the terminal moraine of a glacier. According to the USGS the ice was 6 miles thick at that point. At Omaha, NE.,
It is estimated to have been 10 miles thick. Have always been amazed by their estimates.
Dr. Pat Frank demolishes all the popular climate models with this presentation in July, 2016: https://www.youtube.com/watch?v=THg6vGGRpvA&feature=youtu.be
Good presentation of fundamentally simple statistical technique which shows how all these models are used by people who don’t understand science and maths.
As Dr Frank says what he has done could and should have been done 25 years ago ( or at any time between then and now); he is amazed how all the scientific authorities have just accepted this junk without fairly simple analysis which shows its ineptness. Why and how? I try very hard not to think of conspiracies, but its impossible not to conclude that a lot of ‘power and money’ was and is behind this.
It does seem to be about controlling society by changing some fundamental aspects of how we live.
I don’t like thinking that stories about ‘agenda 21’ , ‘nwo’ etc are true, it seems too extreme. Maybe its all about designing ways to redistribute wealth globally ( along with immigration effects etc). Who’s hand is on the tiller?
Agenda 21 is not a “story.” It is a process initiated by the UN designed to make the world “sustainable,” which rhymes with “controllable.”
See, for example: http://www.democratsagainstunagenda21.com/index.html
The purpose of climate models is not to predict, but to destroy.
HOW TO BRAINWASH A NATION
by Yuri Bezmenov (KGB defector)
8 minutes
Dr. Curry’s paper is I think flawed. She starts by stating the obvious – that Climate models are
not perfect and all have some error. However at no point does she quantify the errors nor does
she look to see how fast they grow with time. And that is crucial – there is a huge difference between saying that we can predict the global temperature to within 0.2 degrees and saying that we can do so to within 2 degrees. Furthermore there is no logical way of going from saying that the models are wrong to saying that there is nothing to worry about. There is always the possibility that things might be much worse. For example the Nature paper “Evolution of global temperature over the past two million years” published last years suggests a climate sensitivity of 9 degrees per doubling of CO2.
This is based on past temperature reconstructions and does not use any results from global climate models.
So I could take all of Dr. Curry’s points about the problems with global climate models add in a
recent estimate of the global sensitivity and come to the conclusion that we need urgent action
to stop the rise of CO2. So being skeptical about climate models is no reason for doing not acting.
Agreed. Unless skeptics think the chance of CAGW is zero, I don’t understand the unwillingness to support action. If I own a house I will get fire insurance even though the chance of a fire is .3% per year.
Ah yes, the Precautionary Principle, favorite hobbyhorse of the greens. Come up with a scary scenario, and demand it be disproven. Despite the minor little factor that one cannot prove anything “safe”.
Only if the cost of the insurance is in some way equivalent to the risk. If your insurance cost you twice as much as the value of house, would you take it out? I assume not, so you need to rethink your analogy.
Moreover, every year, houses burn down. We know that for a fact, and we have years of reliable data on the risk. So we can assess that risk and the insurance company can set premiums at the right rate.
On this we have no reliable data on either whether it will happen, nor if it does what the costs will be. So what should we pay for insurance?
The insurance analogy simply doesn’t work.
I think we should be redirecting all the climate money into asteroid-proofing civilization, since there is a non-zero chance of an asteroid striking the Earth. AKA the Precautionary Principle in action. We MUST act now!
“Unless skeptics think the chance of CAGW is zero, I don’t understand the unwillingness to support action.”
Because:
1) The ‘C’ in ‘CAGW’ implies any warming will be ‘Castastrophic’ when it could in fact be beneficial.
2) ‘Action’ requires trillions dollars in the form of vague goals that can be better spent elsewhere.
3) Quite simply, the models don’t work. What part of that don’t you understand?
The real question is: ‘Is AGW via CO2 real?’, let alone CAGW.
The chance of CAGW is zero. It may even be less than zero.
For absolute proof of this. CO2 levels have been above 5000ppm in the past and nothing bad happened.
So the idea that going from 280ppm to 500ppm is going to cause something catastrophic is ridiculous.
Chris would you still buy fire insurance if the annual cost exceeded the value of your house?
Since it’s been well shown that temperature leads CO2 at a variety of time scales, CO2 may be a consequence of temperature, but it can’t cause anything except beneficial plant growth 🙂
Again that is a logical fallacy. Temperature rises can cause CO2 levels to increase and
CO2 increases can cause temperature rises – this is caused positive feedback and is
well understood. Nobody is stating that CO2 is the only cause of temperature increases just
that it is A CAUSE and currently it is the only driver of temperature that humans are influencing.
Pure waffle. The CO2 levels have been steadily rising since 1950, due mostly to anthropogenic emissions. The temperature went up, then down, then up and has now plateaued out. Just because a laboratory demo can be set up to show that CO2 can reradiate certain bands of IR does NOT mean that its presence will have any detectable effect on the Earth’s climate system.
Pull the blinders back and you’ll see that, over half the Earth’s history, CO2 has been anti-correlated with temperature just as often as it has been correlated.
http://www.geocraft.com/WVFossils/PageMill_Images/image277.gif
In real science, we call this an absence of any cause-effect relationship.
If positive feedback was happening the measured RSS tropospheric data would show a tropical hotspot like the models all show. Why doesn’t the data match the models? Because the models are wrong. It’s called the Scientific Method. Ever hear of it? It was big in Galileo’s day.
Of the plethora of models supported by the IPCC, only one can possible be the correct model. It is time for the IPCC to chose the one correct model and to delete consideration of all the other wrong models. All the models that required some sort of correction applied to them in order to fit past climate data are wrong and must be deleted. Maybe all to the models are wrong.
________________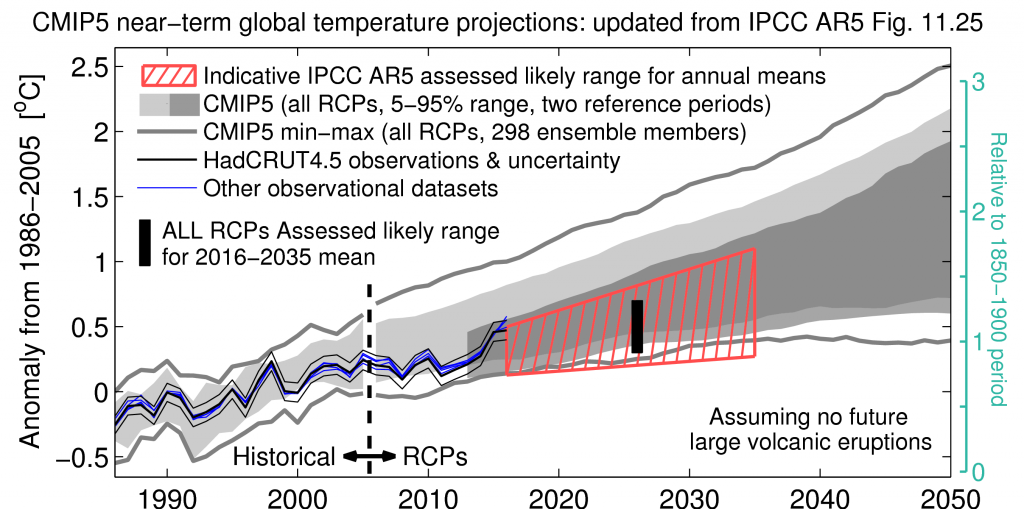
I don’t see how it shows any such thing. It shows that observations up to 2015 (from the least warm surface data set, HadCRUT4) were well within the 5-95% model range and closing in on the multi-model average, based on annual comparisons.
Ed Hawkins, who produced that chart, has updated it with 2016 results showing that, on an annual basis at least, observations at end 2016 were actually running ‘higher’ than the CMIP5 multi-model average:
Re-reading the above quote, it struck me that maybe I’d misunderstood it. Perhaps it was saying that over the projected period (since Jan 2006) the average temperatures in the models or the warming ‘trend’ in the models was running “a factor of 2” higher than observations.
To test this I downloaded ‘CMIP5 mean rcp4.5’ from climate explorer (link below). This gives the average of all the RCP 4.5 model runs. I also averaged the GISS, HadCRUT4 and NOAA surface data records, as this is the metric used by the WMO, then base-lined everything to 1961-90 anomalies.
From what I can see, since 2006 in terms of absolute numbers the models are running about 23% higher than observations (not a “factor of 2” higher). However, the linear trend in the observations is running slightly higher than that in the models (0.29 versus 0.24 C/dec).
In other words, since 2006 average temperatures forecast by the models are running slightly higher than those seen in reality; but the ‘rate’ of warming seen in reality has been slightly higher than that projected by the models. Nothing is “a factor of 2” higher than anything else.
CMIP5 model data link: https://climexp.knmi.nl/selectfield_cmip5.cgi?id=someone@somewhere
And what purpose is the multi-model average exactly?
Using the multi-model average is just a handy way of estimating how observations are going relative to average expectations for any given RCP. In this case it tells us that, of the 42 model projections in RCP4.5, observations are lying somewhere around the middle of the projected warming range.
It’s basically a con, giving a false impression that if so many models agree, within some MODEL- ENSEMBLE-BASED variance/ uncertainty, then the overall modelling must be on the right track. But this is nothing to do with the uncertainty inherent within the models themselves. IPCC figures, and similar junk, pretend that the uncertainty bands around various scenario runs are the real uncertainties in the model calculations, They are just the variance between (near identical) model runs. Pat Frank shows nicely what the REAL uncertainties look like:
http://cornwallalliance.org/wp-content/uploads/2016/08/Patrick-Frank-Uncertainty-Propagation-in-Projections-of-GAT-300×250.jpg
(Note the vertical scale spanning about 20°C)
Garth Paltridge, in his book “The Climate Caper”, reveals the further con that these models are somehow all “independent” efforts – nothing could be further from the truth:
“They take some or all of the code from the model of another group, and slightly modify those bits of it that are relevant to their particular interest and expertise. The overall process ensures that there is a gradual, and largely unconscious, move towards a situation where all the supposedly independent models have common physics and common values for their tuneable parameters. Quite naturally they begin to tell the same story.”
Multi-model average is meaningless. Only one model can be the correct model. All the other models are wrong and must be thrown out.
Neither the multi-model mean nor any particular model projection is ‘correct’; nor are they expected to be.
Part of the function of having so many and varied models for the one emissions scenario is to compare individual performance against observations then try to understand some of the factors responsible for the differences.
Identify those factors that work in reality and weed out those that don’t for the next model phase.
The IPCC has been playing this game for more than two decades and they have yet to advance to the next stage. In their first report the IPCC published a very wide range of possible valuse for the climate sensivity of CO2. In their last report the IPCC published the exact same values. So far they have learned nothing that would allow them to narrow the range of their gureese one iota. They are still just guessing. Their theroy, the AGW conjecture, is based on a radiant greenhouse effect that does not exist. It is all science fiction.
I’m having post after post vanish into nowhere. Are other people having that problem? I usually don’t have it.
So nice to see Dr.Curry unshackled. Scientists behaving as scientists is so refreshing .
My thoughts too. Bravo!
For more then two decades the IPCC has made absolutely no progress in determining what the climate sensitivity of CO2 really is. Without the the correct value of the climate sensivity of CO2 there can be no correct model. Recently Kyoji Kimoto pointed out that the original calculations of the Planck sensivity of CO2 is too great by more than a factor of more than 20 because the fact that doubling the amount of CO2 in the Earth’s atmosphere will cause a slight but significant decrease in the dry lapse rate in the troposphere which is a cooling effect. So instead of 1.2 degrees C we are talking about less than .06 degrees C which is trivial. Then there is the issue of H2O feedback. The IPCC likes to assume that the feedback is positive but the wet lapse rate is significantly less than the dry lapse rate so the feedback must be negative. so the climate sensivity of CO2 must be somewhere between .06 and 0.0 degrees C if not negative.
willhaas
What do you believe caused the observed warming of ~0.9C since the mid 20th century? If the IPCC is right in suggesting that practically all of that increase is the result of enhanced greenhouse warming, then that would suggest a CS of 1.7C at the very least (assuming no further warming).
“What do you believe caused the observed warming of ~0.9C since the mid 20th century?”
Probably the same thing that caused the Medieval, Roman and Minoan warm periods. Warming out of a cold period, like the Little Ice Age.
“Probably the same thing that caused the Medieval, Roman and Minoan warm periods. Warming out of a cold period, like the Little Ice Age.”
What do you think that something is?
natural variation,
certainly it was not CO2 since it is the IPCC’s contention that CO2 levels did not significantly change before about 1940/1950.
The Earth has warmed since The Little Ice Age,
CO2 causes warming,
Therefore the Earth’s warming was caused by CO2
Fallacy of Affirming the Consequent https://en.wikipedia.org/wiki/Affirming_the_consequent
..After the Little Ice Age, the Earth would have warmed up NATURALLY, even if there was ZERO CO2 in the atmosphere…!! Argue with, that Seaice1 !!
From all the work done with climate models one can conclude that the climate change we have been experiencing is caused by the sun and the oceans over which mankind has no control. The AGW conjecture is based upon the concept of a radiant greenhouse effect caused by trace gases that have LWIR absroption bands. A real greenhouse does not stay warm because of a radiant greenhouse effect. A real greenhouse stays warm because the glass limits cooling by convection. It is a convective greenhouse effect that keeps a greenhouse warm. So to on Earth. As derived from first principals, the surface of the Earth is on average 33 degrees C warmer because of the atmosphere because gravity limits cooling by convective. It is a convective greenhouse effect that accounts for all 33 degrees C that has been observed. There is no additional radient grenhouse effect on Earth or on any planet in the solar system with a thick atmosphere. The radiant greenhouse effect caused by so called greenhouse gases is fiction as is the AGW conjecture. If CO2 really affected climate then one would expect that the increase in CO2 over the past 30 years would have caused at least a measureable increase in the dry lapse rate in the troposphere but such has not happened.
Probably solar activity
http://appinsys.com/globalwarming/GW_Part6_SolarEvidence_files/image013.jpg
The GCMs are wrong because they are based on a wrong climate physics model (CO2 is the climate controller).
Since no one understands exactly what causes climate change, developing a climate physics model is an impossible task.
The causes of climate change probably include the sun, water vapor / clouds, oceans, “greenhouse gasses”, albedo, and planet / sun geometry changes (long term).
I challenge any “climate scientist” to provide a more specific explanation of what causes climate change — even short term changes (a degree or two, over a century of two).
The GCMs are a total waste of taxpayers money — worthless computer games!
Most climate “scientists” on government payrolls are also wasting taxpayers money.
The climate in 2017 is better for humans and plants than it has been in at least 500 years — there is no problem — there has been no abnormal climate change — there is no need to make wild guess predictions of the future climate and overreact to them.
Some people, however, do have a need for more attention and power, and know they can get both by scaring ordinary people with the false claim that CO2 is an evil gas, and only they can save the world.
Unfortunately, there are a lot of gullible, stupid people (mainly leftists) who believe the scaremongers!