From the University of Reading:
Britain may lose the magic of the Northern Lights by the middle of the century due to major shifts in solar activity, scientists have discovered.
Space scientists at the University of Reading conclude that plummeting solar activity will shrink the overall size of the sun’s ‘atmosphere’ by a third and weaken its protective influence on the Earth.
This could make the Earth more vulnerable to technology-destroying solar blasts and cancer-causing cosmic radiation, as well as making the aurora less common away from the north and south polar regions for 50 years or more.
Dr Mathew Owens, from the University of Reading’s Meteorology department, led the research. He said: “The magnetic activity of the sun ebbs and flows in predictable cycles, but there is also evidence that it is due to plummet, possibly by the largest amount for 300 years.
“If so, the Northern Lights phenomenon would become a natural show exclusive to the polar regions, due to a lack of solar wind forces that often make it visible at lower latitudes.
“As the sun becomes less active, sunspots and coronal ejections will become less frequent. However, if a mass ejection did hit the Earth, it could be even more damaging to the electronic devices on which society is now so dependent.”
The study, ‘Global solar wind variations over the last four centuries’, published in Scientific Reports, shows how sunspot records can be used to reconstruct what happened the last time the Earth experienced such a dramatic dip in solar activity more than three centuries ago. Combined with updated models and contemporary reports, the researchers were able to predict what could happen during a similar event, likely to occur in the next few decades.
‘PROTECTIVE BUBBLE’
The scientists believe the coming ‘grand minimum’ could be similar to the Maunder Minimum of the 17thcentury, when sun spot activity almost stopped – another symptom of a less active sun.
Solar wind, made up of electrically charged particles from the sun, travels at around a million miles per hour.
A reduction in solar wind would see the heliosphere – the ‘bubble’ around the solar system maintained by particles emitted by the sun – shrink significantly.
This protective bubble helps shield the Earth from harmful radiation from outer space, but has weakened since the 1950s.
“If the decline in sunspots continues at this rate, we could see these changes occurring as early as the next few decades.” – Professor Mike Lockwood FRS, University of Reading
The scientists predict a rapid reduction in the bubble’s size by around the middle of the 21st century. The Earth’s own magnetic field deflects some of this radiation, but areas close to the north and south poles are more vulnerable where the Earth’s magnetic field is weakest.
Co-author Professor Mike Lockwood FRS, University of Reading, said: “If the decline in sunspots continues at this rate, and data from the past suggests that it will, we could see these changes occurring as early as the next few decades.
“The Maunder Minimum in solar activity of the 17th century is sometimes mistakenly thought to be the cause of the so-called Little Ice Age, when winter temperatures in Europe, and elsewhere in the world, were lower than average.
“But the Little Ice Age began before the Maunder Minimum and ended after it, and our previous work with the Met Office has shown that the coming solar minimum will do little to offset the far more significant global heating effects of greenhouse gas emissions.”
Full reference: (open source)
M.J. Owens, M. Lockwood, P. Riley (2017). ‘Global solar wind variations over the last four centuries’. Scientific Reports. DOI: 10.1038/srep41548
h/t to Dr. Leif Svalgaard
Abstract:
The most recent “grand minimum” of solar activity, the Maunder minimum (MM, 1650–1710), is of great interest both for understanding the solar dynamo and providing insight into possible future heliospheric conditions. Here, we use nearly 30 years of output from a data-constrained magnetohydrodynamic model of the solar corona to calibrate heliospheric reconstructions based solely on sunspot observations. Using these empirical relations, we produce the first quantitative estimate of global solar wind variations over the last 400 years. Relative to the modern era, the MM shows a factor 2 reduction in near-Earth heliospheric magnetic field strength and solar wind speed, and up to a factor 4 increase in solar wind Mach number. Thus solar wind energy input into the Earth’s magnetosphere was reduced, resulting in a more Jupiter-like system, in agreement with the dearth of auroral reports from the time. The global heliosphere was both smaller and more symmetric under MM conditions, which has implications for the interpretation of cosmogenic radionuclide data and resulting total solar irradiance estimates during grand minima.
From the conclusions section of the paper:
Firstly, we consider the terrestrial implications. Space weather is primarily the result of rapid changes in the space environment, rather than annual variations reconstructed in this study. Nevertheless, the equilibrium state of the terrestrial magnetospheric system is expected to be very different under MM than modern conditions. This, in turn, will mean a different response to a space weather driver, such as a fast coronal mass ejection. Future work will use a global MHD model of the coupled magnetosphere-ionosphere-thermosphere system to quantitatively investigate this. But even without a numerical model it is possible to draw some qualitative conclusions. The lower PDYN during the MM would increase the average stand-off distance of the dayside magnetopause43. The width of the far magnetospheric tail, however, is controlled by the solar wind static pressure, PSTA = npkTSW + B2/(2μo). As the higher np and TP have a larger effect on PSTA than the reduction in B, the tail would, on average, be somewhat thinner during the MM than in modern times. Thus the magnetosphere would have presented a smaller cross-sectional area to the solar wind, reducing the electric field placed across it by the solar wind and the total solar wind energy that it intersects. A reduction in VSW and B would mean a reduction in the solar wind electric field, which in turn would combine with the smaller diameter of the magnetosphere to reduce the trans-polar cap potential and polar cap area44. Thus the Earth’s magnetosphere would have been somewhat more Jupiter-like, with the part driven by solar wind-driven convection smaller in extent, and the part driven by internal dynamics and co-rotation larger in volume. In addition to an expected reduction in both recurrent and non-recurrent geomagnetic storms during the MM, the expected poleward motion of the nominal auroral oval position may further help explain the dearth of auroral reports from that period for all but the most northerly locations15. Beyond the magnetopause, the enhanced MA suggests that the bow shock strength would be enhanced, resulting in more efficient energetic particle acceleration, while the bow shock stand-off distance would be increased on average, resulting in a thicker magnetosheath45.
Secondly, we consider the implications for the global heliosphere. Again, a future study will use the reconstructed solar wind parameters with a MHD model of the global heliosphere, but here we consider the first-order implications. Most obviously, a drop in PDYN will result in an overall smaller heliosphere, though the contribution of pick-up ions to the total solar wind momentum budget46 means the PDYN decrease at large heliocentric distances will be lower than the factor 2 between modern and MM 1-AU values. Any calculation of the heliopause distance under grand solar minima conditions will also need to account for the change in pick-up ion acceleration under the MM reduction in B, particularly out of the ecliptic plane. The shape of the heliosphere is also likely change under MM conditions. For the modern era, PDYN has been ~2–3 higher at the poles than the solar equator47, which results in latitudinal asymmetry in the heliopause stand-off distance and termination shock location48. During much of the MM, however, PDYNbecomes almost uniform with latitude for a greater period of time, suggesting a more spherical heliosphere and termination shock.
In turn, there will also be a number of implications for cosmic ray intensity in near-Earth space, with potential knock-on effects for long-term heliospheric reconstructions on the basis of cosmogenic radionuclide records in ice cores and tree trunks23,49,50. The relative abundance of radioisotopes such as 10Be and 14C can be used to determine the effective shielding of heliosphere from the interstellar cosmic ray spectrum, referred to as the heliospheric modulation potential. Interpreting the modulation potential in terms of heliospheric parameters, such as OSF, necessitates a number of assumptions about the size of the heliosphere, the solar wind speed and the scaling of cosmic ray scattering centers with the HMF intensity20. During grand minima, all of these properties will change, to some degree. As already discussed, we expect a smaller heliosphere, with lower and more symmetric solar wind speeds. The lack of latitudinal solar wind speed structure suggests reduced corotating interaction region formation and hence reduced cosmic ray scattering (even for the same OSF). Furthermore, we note that enhanced VA during the MM would increase the termination shock strength and may affect the efficiency of anomalous cosmic ray acceleration46. While the effect of changing size/shape of the heliosphere is expected to be small on GeV (and greater) energy particles which are largely responsible for cosmogenic isotope production, and hence radionuclide reconstructions of the heliosphere and total solar irradiance51, it needs to be fully quantified via a galactic cosmic ray transport model and a cosmogenic isotope production model.
It seems not long ago the sun activity was going to be the highest ever…
That was until the decline during our current cycle 24 http://www.universetoday.com/10000/most-active-sun-in-8000-years/
That was before Paris….
And Santa will drown with the polar bears as the ice melts, and the Easter Bunny will choke on a jellybean.
Of course Lockwood had to mention global warming. Might lose some of his funding if he didn’t. How pathetic. And he mentions the Met Office. A friend of mine phoned them and was put through to ‘an expert’. He wanted some info about solar activity, etc. Turns out the ‘expect’ had never heard of the Maunder Minimum, nor a GCR. They thought it might be ‘great central railway’. I’m not joking, I was listening in to the call.
If I read anymore may, mights, ifs, cans, coulds, shoulds, etc. I just maybe might scream!!
Might I suggest if you can, you should….
Read an article last week that people are tuning out, wholesale, from the “Expertocracy.”
If, I live long enough I might see something happen.
Yes, the .1 degree increase will dwarf the effects of the sun. Thanks for reminding us of that yet again on a totally unrelated note. Anyway, soon you won’t be able to see the Northern Lights because of all the wood smoke in Britain.
If the warmists were smart they would quickly do a 180 and ‘discover’ that the global climatic effects of variance in solar activity (which used to dominate the climate prior to CO2) were actually greater than they originally thought.
That way they can say that the current downtrend in solar activity, and the cold it has produced, has temporarily offset the CO2 warming their models have predicted. But when solar activity soon returns to normal, global warming will be… wait for it… WORSE THAN THEY THOUGHT.
(Will perform climate science for $$$. Call me.)
Psst. Don’t give them ideas.
They already use that line or something similar. Heat hiding in the deep oceans (where it can’t be measured) etc.
Any excuse is valid as long as they don’t have to admit that their theory was wrong.
SC February 2, 2017 at 4:42 pm
The idea was to use natural variation as a camouflage they can’t go back and say sorry we under estimated.
They have been attacking anyone who pointed natural variation out as a factor.
michael
TRM : Re: “Heat hiding in the deep oceans ..”
Hidden by whom?
Suspects include Santa, the Easter Bunny and the Tooth Fairy. The IPCC believes the Easter Bunny is the most likely culprit, because he does tend to hide things….
____________
The above comment is no more foolish that everything the IPCC has published to date.
There is NO evidence that ECS is above 1C, and it is probably much less, so small as to be insignificant.
There is in reality NO global warming crisis – it is a figment of overheated imaginations – a chimera that has been created by self-serving scoundrels and believed in by gullible imbeciles, and has cost society tens of trillions of dollars in wasted subsidies, destabilized critical energy systems and cost lives.
Already covered, global warming will cause the next ice age don’t you know?
RW, that’s only after a few decades of Venusian heat and pressure. We gotta get the timing straight here…
P.S. They might want to call the boys up and have them recalculate the sunspot count methodology to make them lower.
SC, I’ve been watching daily, predicting the sunspot count myself using the helioviewer program and then checking the numbers, with fair success. The count is usually 10 or 12 in small ARs and 15 or so in larger regions. This is what I saw with the old method also. Looking at 24 hour movies I can usually see about as many magnetic disturbances take place as the count implies. Can you tell me what I should compare to in order to see the exaggeration of the new method?
I blame global warming.
Only two weeks in office and Donald Trump has already destroyed the Northern Lights!!! Is there no end to this mans evil ways?
Our children won’t know the Auroras!
And to know what it was like to be on a beach in the northern latitudes.
Or to BBQ on Superbowl Sunday (when the Rams won) in St. Louis.
If we’re heading into a Maunder Minimum where temperatures plummet do we really want to be reducing CO2? Actually, on that point, it simply doesn’t matter: there’s zero evidence that changes in CO2 (at current PPMs) affects climate temperature at all.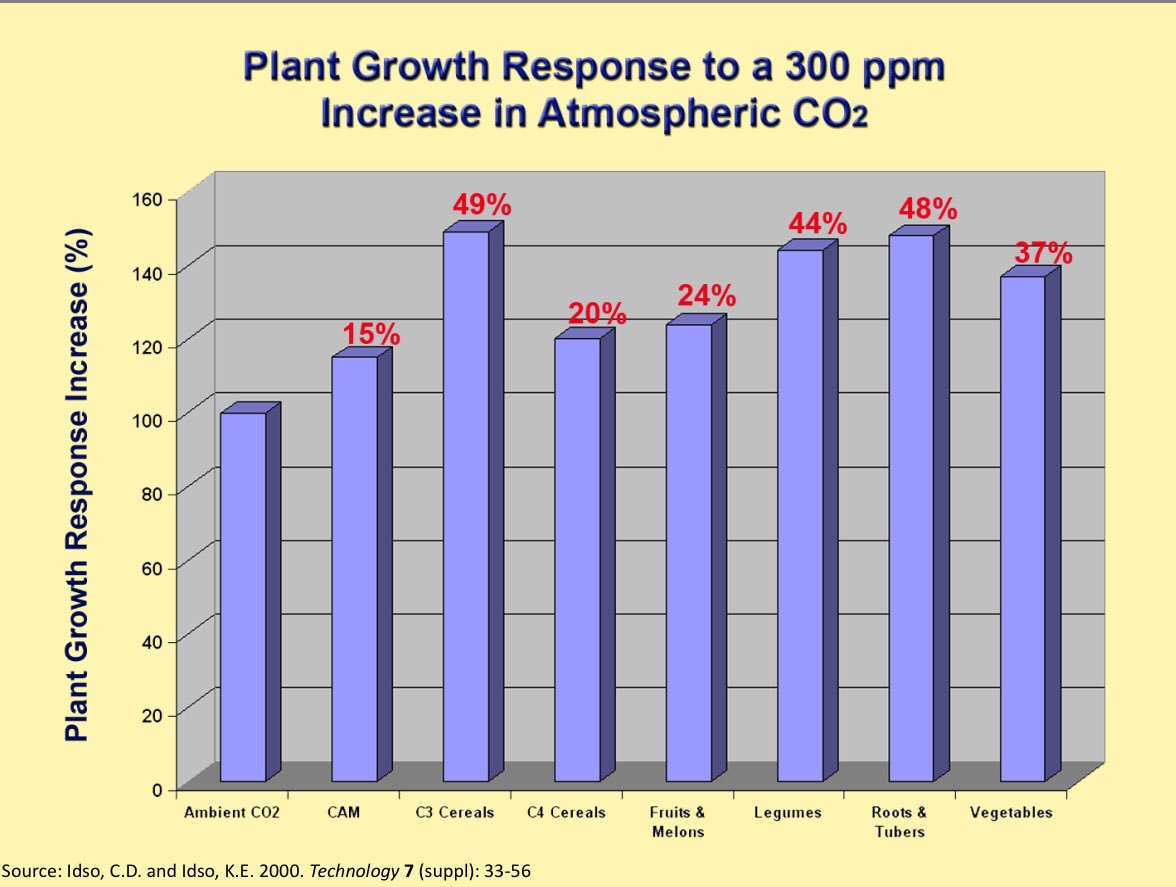
What does matter, though, is that declining temperatures would likely dramatically reduce agricultural output. But substantially higher levels of CO2 could ameliorate that:
Eric,
Nice chart.
The massive benefits from atmospheric fertilization of plants because of increasing CO2 is irrefutable.
“If we’re heading into a Maunder Minimum where temperatures plummet…”
This is hysterical claptrap. There are a lot of so-called alarmists out there Eric. And you’re one of ’em.
The only difference between you and them is that they’ve noticed that temperatures are not actually trending down at the moment.
Look at the trend from the thirties, and it is DOWN!
This graph is NASA’s USA data in 1999 (interesting now that nasa data has changed, lol):
tony mcleod February 2, 2017 at 4:50 pm
This is hysterical claptrap. There are a lot of so-called alarmists out there Eric. And you’re one of ’em.
Nope tony can’t you see the joke….. it is on you..
michael
The government climate datasets which are all in the hands of talebanic AGW activists, will never show anything except endless warming. It means nothing. We’re in a complete dark age as to what is really happening. Except occasionally for clues such as this:
http://www.bbc.com/news/uk-38851097
Rationing of lettuce and broccoli in UK supermarkets due to cold and wet weather devastating harvests.
Do you realize how nutty that sounds ptolemy2
Fascinating, the alarmist get’s it’s panties in a wad because someone else is doing alarmism.
PS: The temperatures haven’t been trending up either, not for about 20 years.
tony is so far gone to his personal paranoia, that reality now sounds nutty to him.
Vegetable shortage in the UK this winter due to cold caused crop failures in Spain. Scary business!
The areal extent of crop reduction in Western Canada due to a 1C drop in mean temperature is very alarming. Let alone the shortages due to unexpected frost. Yet the so-called “leaders” of the planet want to do as much as possible to reduce CO2 concentration.
Utterly amazing. Why oh why …..
Don’t panic, it is merely a rehearsal to prepare us for the full impact of Brexit and an oppressive trade deal with the US.
Gareth
I guess there are those who regard all trade and capitalism as oppressive 😉
There was no sign of any shortage in my local market this morning. The stall holder told me that the price of broccoli had fallen. I suspect we have a touch of the fake and scary news.
Perhaps the climate has entered a ‘vegetative state’.
More fear and loathing Gareth? Why am I not surprised. What a depressing world view, and with the majority of the population rejecting it, life must be almost unbearable. No wonder the lefties are rioting.
Gareth will believe any lie, so long as it conforms with one of his personal religions.
Maybe we should try and fence in the CO2, just in case it does warm us a teeny bit.
England, Canada and Germany can emit their own CO2. 🙂
Tony McLeod.
The Scots are usually more intelligent than you. Kindly do some homework.
Eric is correct, and you are taking ignorant pot-shots.
Nobody should use the surface temperature (ST) datasets unless there is no alternative, and then one should use an early version, circa year 2000. The later ST versions are corrupted by consistent warming adjustments.
Here is a plot from Tony Heller, and there are many more:
https://realclimatescience.com/all-temperature-adjustments-monotonically-increase/
https://www.facebook.com/photo.php?fbid=1209281512482742&set=a.1012901982120697.1073741826.100002027142240&type=3&theater
Allan, Eric is afraid we are already plunging into a new Maunder Minimum. Are you?
Citing Heller’s handiwork in no way to bolsters your case.
Actually, Eric said something else Tony – he said “IF” on that subject. That is markedly different from your allegation.
IF is a small word that makes a big difference.
Tony said
“Citing Heller’s handiwork in no way to bolsters your case,”
It supports Eric’s case, which is what I intended.
Tony, you make statements that are wild pot-shots, unsupported by facts.
That’s the way the ball bounces; That’s the way the troll rolls.
So what response is it that they are doing.
Maybe trying to keep up with the C3 serials.
g
Serials, Cereals and all that jam
C3, C4 and all them CAM
CO2 so low you won’t give a damn
A-wop-bop-a-loo-bop-a-lop-boom-bam !
And the obligatory: “…our previous work with the Met Office has shown that the coming solar minimum will do little to offset the far more significant global heating effects of greenhouse gas emissions.””
Go Donald!
Well, they still did an “oopsie” there – according to current doctrine of the High Church of Climate, there was no such thing as the Little Ice Age.
Yes, obviously you’ve been following this whole thing for a while. Have you noticed that some facts are refuted unless convenient to the current claim? I’ve also noted that the claims often conflict with previous claims.
Must have been a typo. It should have said,
“… global heating effects of greenhouse gas emissions are far from powerful enough to mitigate the coming solar minimum or any future ice age.”
The absence of something to worry about is itself something of a major worry!
Vilfredo Pareto’s power law distribution of geophysical phenomena still holds despite the election of Donald J. Trump.
Here are some applications of the law. How they apply to this story isn’t obvious to me. Would you please be more specific.
The principle applies, not some particular application(s). The executive summary for you is that if something hasn’t happened recently then it is not likely to happen soon.
In other words, if something happens on average once every thousand years and hasn’t happened in 1500 years. That is proof that it won’t happen for another 1500 years at the soonest.
So Doug; just what proof of that do you have of that idea.
Does it occur to you that if something has not happened that is because it cannot happen (yet/now /whenever).
So what makes you think it will not happen soon.
It WILL happen just as soon as it CAN happen; and by “soon” I mean it will happen in the next 10^-43 seconds after it can happen.
G
If you want to see the Northern Lights go to Blackpool
+10 The only Northern Lights I ever saw growing up!
Carbon shuts down sun…..earth still heats
Film at 11……
Um … I could easily be wrong, but I thought it was Earth’s magnetic field that helps protect us from cosmic rays etc (by deflecting it/them away), not the aurora – which is pretty but doesn’t do much of anything else? It sure doesn’t “protect” the tropics.
I too thought that the magnetosphere protection came from the Earth’s magnetic field, though it is shaped by the solar wind.
I had heard that the Earth’s dipole magnetic field was weakening recently, for internal reasons not related to the Sun or atmosphere, though perhaps connected to the possible flip of the magnetic poles (a recent article)
But wasn’t the sun also supposed to moderate the ammount of Galactic Cosmic Rays that also reach us? So wouldn’t a quiet sun also allow for an increase in Galactic Cosmic Ray influence? (however slight that increase might be)
Auroras and protection from cosmic rays are both features the Earth’s magnetic field.
Its both. the solar winds protect us by preventing harmful rays from getting to us and the magnetic field protects us from the sum and other rays. Interestingly, there is a report that the magnetic field is due to do a reversal soon. If that is the case our protection will drop even further.
arghhh. “sun”
Aarrg! “it’s”
(sorry, couldn’t resist 🙂
Correct. The sun’s heliosphere protects the earth from cosmic rays that are always hitting us from the Milky Way. The reduction in protection from the sun will allow more cosmic rays into the solar system. Our magnetic field also does a good job of protecting us, however with a drop in the heliosphere, more cosmic rays will make it to the lower atmosphere, and the impact of that will be increased cloud coverage in the lower atmosphere. Increased lower cloud coverage = lower surface temperatures. Furthermore, CO2 does NOT drive temperature, and my personal opinion is that the “greenhouse” effect of CO2 is zero, or so bloody close that it is not measurable. Therefore even if we were at significantly higher atmospheric CO2 concentration, the temperature of the planet will drop due to the reduced protection of the heliosphere.
the temperature of the planet will drop due to the reduced protection of the heliosphere.
The problem is that solar activity has generally dropped the last half-century, yet temperatures have increased.
Isvalgaard, good catch. There are two items involved – the energy output of the sun, and the solar activity of the sun, allow me to explain.
The energy output of the sun is what fuels our planet – 100% of our fuel, irrespective of fossil fuel, solar panels, wind power, etc., it is all due to the sun. There was some indication that the energy output had been dropping (albeit very, very slightly) over the past couple of decades, yet why was the temperature of the planet increasing? Recent review of the data collected shows that in actuality the energy output has been very gradually increasing, a correction of past analyses of the data collected and part of the reason of why the planet was showing an increase in temperature.
The second part of the reason is the sun’s magnetic shield, which correlates very well with sunspot activity. For comparison, the earth has a magnetic shield which also varies over time, and has a polar reversal “schedule” (so to speak), but in the sense of the solar system, our energy output is negligible to zero. The sun’s magnetic shield, which dictates the strength of the heliosphere, also varies over time and this appears to be measurable via the sunspot activity. Therefore lower sunspot activity appears to be a direct relationship with the strength of the heliosphere, leading to a greater amount of the Milky Ways cosmic rays making it to the lower atmosphere, causing higher % of cloud coverage.
The sun can be getting hotter (and when I say that, I mean by a very, very small amount measured on a decade time scale), and we can be getting colder at the same time, due to the multiple effects involved.
It appears to be a matter of gain. Periods with above average solar activity are warming periods, while periods with below average solar activity are cooling periods. We just entered a period of below average solar activity, so we should see if this is correct once the El Niño is properly accounted for. There hasn’t been much warming since 2003, so far so good.
http://www.coyoteblog.com/wp-content/uploads/2016/04/Slide90.png
Solar activity has generally decreased in the last half century while temperatures have increased, much like releasing the accelerator from the floor up a centimeter yet still accelerating. Mysterious…
Darrell Demick (home) February 3, 2017 at 6:32 am:
“Isvalgaard, good catch.”
Now that brought out a chuckle or two.
Charged cosmic ray particles have extremely high energies, about 3 billion electron volts, or about six orders of magnitude higher than solar wind particles. The more energetic the charged particle, the more difficult it is to bend it in a magnetic field. Thus, whereas the Earth’s field is strong enough to deflect solar wind, it requires the Suns field spread over all of the solar system to deflect cosmic ray particles. The Sun’s field is embedded in its charged particle outflow.
I think the energy record for a cosmetic ray charged particle as collected in a stack of photographic emulsion plates was somewhere in the 10^19-10^22 eV range total energy.
Can you believe that somebody actually went through that stack of plates and identified each and every one of those secondary particle tracks and daughters, and grand daughters etc, and calculated the energy of each, and added it all up to get the total energy or the primary particle.
Actually I think the primary particle was just the head of a bolt that came off a Klingon Bird-of-prey battle cruiser; during an uncloaking accidental collision with some Dinornian space junk.
G
george, it was probably a grad student. Not like they had been given anything else useful to do.
Why do you blame the Dinornians, G? If the Klingons had Romulan technology they would have detected the derelict craft before uncloaking. Clearly a shift of culpability.
Oh, shouldn’t we notify Leif of our sarcasm, to be “on the up ‘n up”?
The Aurorae tend to happen in the I O N O S P H E R E. That is the land of the I O N s.
Do you see any tracks of solar charged particles ripping through your aurora pictures ??
Is green an Oxygen line ??
G
One thing they said is wrong because there is no evidence that CO2 has any effect on climate and plenty of scientific reasoning to support the idea that the climate sensivity of CO2 is really zero. Acording to the IPCC’s own reports, they do not know what the climate sensivity of CO2 really iis because all they offer is a range of guesses and over the years the IPCC has learned nothing that would allow them to narrow the range of theri guesses one iota.
There were really a number of sun spot minima associated with the Little Ice Age. and the end of the Medivial Warm Period. We may be approaching another cooling period and longer term the next ice age. I doubt that Man’s use of fossil fuels has any effect on solar activity.
LOL!!!! Love your last sentence!!!!!! Superb!!!!!
Well our inconsiderate use of fossil fuels causes the sun to suck in even harder; to prevent the escape of free clean green renewable solar energy. That’s all there is to the “quiet” sun.
g
The Sun is the Sun.
So much attention and cash has been thrown (and reaped by some) at stopping Man’s implied, but yet to be realized, catastrophic effects on our planet.
That big yellow (and hot) ball in the sky that has made life on Earth possible has been ignored in “MSM Political Science”.
Who would buy into the idea that Man can control it or that some kind of tax could eliminate any harm it might do?
I mean. it’s not like selling the idea that Man burning old tree rings can change the Climate of the entire Earth?
As you read the article you wait with doleful anticipation in the certain knowledge that very shortly the word “model” is going to swim unerringly onto your screen. This time it isn’t any old model but I’m delighted to note a rather grand “magnetohydrodynamic model” and this time rather than being pulled directly from some grant seeker’s fundament it is apparently also “data-constrained”.
Nevertheless, despite the clearly awesome provenance of this particular modelling effort it must be noted that, much like modelling of earthly climates, solar models are similarly fraught with difficulties, unknowns and inaccuracies. Consequently I for one won’t be rushing to terrify the kids jsut yet with these horrific newsworthy ‘findings’ and lobbying my political representative to urgently pour more funding in the direction of Reading University.
It’s the harbinger of a catastrophic Maunder minimum and starvation up-thread.
what Sol giveth Sol also taketh away.
Tony, you seem to be blind to solar history. If the extra clouds that have caused my “off-the-grid” neighbor to run his Honda generator daily to charge his battery are also affecting insolation to the oceans (which shows up in GOES satellite photos) then it is only a matter of time until the oceans run out of stored heat from the earlier decades of clear skies over oceana. The effects of a shrunken heliosphere on the global temperature are surely not immediate. To rule out CR flux as a regulator of oceanic insolation is myopic at best.
“But the Little Ice Age began before the Maunder Minimum and ended after it, and our previous work with the Met Office has shown that the coming solar minimum will do little to offset the far more significant global heating effects of greenhouse gas emissions.”
So they go to great lengths to tell us about all these new discoveries about the sun but yet have enough knowledge and therefore confidence to state CO2 is still more powerful than a massive nuclear fussion reactor.
Oh what such hubris they have.
Not hubris. They have to very carefully state that their work is insignificant compared to the tree ring counters and the computer modelling people. Otherwise, their research funds would be completely cut off.
“But the Little Ice Age began before the Maunder Minimum and ended after it, and our previous work with the Met Office has shown that the coming solar minimum will do little to offset the far more significant global heating effects of greenhouse gas emissions.”
The way they put this is as if the MM had a start and stop date.( The MM which they actually deny happened, the deniers they are)
To me ( and correct me if I am wrong). The MM was a slow process.. If the pause in the past 20 years gets aligned with slowly lowering sunspot numbers we may now already be slowly going into a “MM type” minimum as we speak and it should then deepen and then , as sunspots increase again, we will come out of this new minimum. (+/- 200 years?). And frankly I am NOT looking forward to that on behalf of my great/ great/ great Grandkids)
We will have to find a new name for this minimum,
What about the “Al Gore” minimum? (sarc)
The Little Ice Age began with the Wolf Minimum, recovered briefly then cooled further in the Sporer Minimum and froze in the Maunder Minimum. It started to recover over the eighteenth century only to give the world the Dalton Minimum and white Christmases along with frozen rivers ( Ice Fairs on London’s Thames River) all over again. Those winters are well described in Charles Dickens’ writing.
Haven’t heard of those? Check the Sporer Minimum page on wikipedia. Stoat hasn’t hacked it up too badly.
Given all the magical things the IPCC and the Warmists impute to Anthropogenic Carbon Dioxide, it’s now suffocating the Sun. We gotta do something right now! Before It’s Too Late.
/sarc
I’ll buy another SUV … purely on the Precautionary Principle 🙂
Well in trying to get a real Handel on the weather in those days; I would just note that nobody of note wrote any “Ice flow” music to remember the weather by, and they made up for the lack of an aurora by having some Royal Fireworks instead; right down on the river; which as I said was in the liquid phase at the time.
g
University of Reading speak:
The Maunder Minimum in solar activity of the 17th century is sometimes mistakenly thought to be the cause of the so-called Little Ice Age, when winter temperatures in Europe, and elsewhere in the world, were lower than average.
But the Little Ice Age began before the Maunder Minimum and ended after it, and our previous work with the Met Office has shown that the coming solar minimum will do little to offset the far more significant global heating effects of greenhouse gas emissions.”
logically wouldn’t a minimum caused ice age end AFTER the minimum had ended ? so the statement “But the Little Ice Age began before the Maunder Minimum and ended after it” is half wrong in its implication …
Last paragraph of abstract is the tipoff. What a joke. I dunno what the direct plus indirect solar influence on climate is. Do know we do not have enough reliable data to sort that out, perhaps for several centuries. All else is unicorn pharts (misspelled on purpose). Meanwhile, lets figure out Carrington event consequences, since they will occur, direct hits can be detected now in advance by coronasphere ring symmettry, and there are (costly) preventative measures that could be taken per previous thread if likely real bad news. Lets get real with research dollars.
Florida should be pretty safe, it’s something that young Justin Trudeau should be more concerned about.
p.s. talking about Canadians my ageing relatives have opted for an apartment (Sunrise something ?) in F.L. for their winters’ refuge.
Vuk, Sunrise is a town about 5 miles from me, due west. Inland from us on the beach. Heck, used to have a 2000 employee plant there– white stucco outside surface turned greener every time I went there for whatever business reason. Something about summer humidity and Florida stuff.
Let me know next time you come down. I will cancel Georgia, Chicago, or Wisconsin to host you and yours on the beach here in Fort Lauderdale.
Hi again
Apparently it is the Sunrise lakes area, where there is an established South Slavs community with cultural centre and orthodox church. They have been going there every winter since 1980s.
Thank you kindly for your invitation, however it might be some time before I would be back to Florida, my own family’s refuge is in the s.france, just came back to the UK. No Florida temperatures, but plenty of snow for the winter sports enthusiasts, just about an hour drive away. Had no electricity cuts but scheduled daily 5% voltage reductions during the peak times.
Could be Sunshine Key there Vuk. great place for tarpon and bonefish.
In fact Sunshine Key tends to be the center of action when the spring tide Pololo worm hermaphroditic love fest takes place as the famous Worm Hatch”.
G
Hi big G
Ah, the Florida Keys, a different story all together. An uncle of mine, who spent most of his life in Detroit, having enough of it he retired in the Key West to pursue deep water fishing. Ironically the fish had the last laugh (got his ashes) regretfully before I had a chance to get down for a visit.
January’s (2017) sunspot number in the old money is few points up to just over 15.
For 2016 annual non-smoothed Wolf SSN ended at 24 while the new Svalgaard SSN ended at 35.5. Composite graph is here
what this story did NOT mention was the rather large and frequent coronal holes that have been creating amazing auroras featured on spaceweather for many months now,
theyre a rather good indicator n visible show n tell of just how much gets INto our atmosphere and will continue or maybe rise?
NASA says that the magnetic anomalies caused when the sun’s corona ejects charged particles beside causing problems for Earth-orbiting satellites and power grids they could be reason why the “otherwise healthy whales, dolphins, and porpoises end up getting stranded along coastal areas worldwide.”
https://www.nasa.gov/feature/goddard/2017/nasa-scientist-studies-whether-solar-storms-cause-animal-beachings
Did he say we will be getting hit with more cosmic rays? If that happens, won’t that trigger a cloud layer and global cooling?
theoretically yes
Good answer. The field of cosmoclimatology is in its infancy – it does appear that there will be an increase in lower cloud coverage, leading to cooler temperatures on the planet. Time will tell.
“Combined with updated models…”
Stopped reading right there…
Back in the old days the people who ran the gigantic computers used to get really pissed off if you wasted enormously valuable processor time and the adage drilled ruthlessly into everyone’s consciousness was “engage brain before going to compute”. That of course is no longer seen to be relevant in the era of massively cheap computing but the downside is that now it’s all computing with not a brain cell in sight.
“A reduction in solar wind would see the heliosphere – the ‘bubble’ around the solar system maintained by particles emitted by the sun – shrink significantly.”
Looks like Pluto and the Kuiper Belt are in for deep doo-doo.
Yup, gonna suck when it drops from 4 K to 3 K!
In case no-one has mentioned it yet, I’d like to point out that we’re doomed.
Yup, in 500 million years or so, the energy output of the sun will have risen to the point that life on this planet as we know it and are accustomed to, will cease to exist.
The end is, ….. , quite a ways away (as far as the sun’s output is concerned, what our species does to each other, well, that is another story entirely).
This is indeed a case of models running wild. The money graph is this one:
http://www.leif.org/research/Owens-2017-MM.png
Don’t worry about the details of the various quantities being plotted.
The key point is that there seems to be agreement that there is no long term trends in the variables after 1735 AD, but that before that the Maunder Minimum sticks out as a sore thumb. There is a severe paucity of actual data so a fancy model is dragged in to calculate the variables under the main assumption that the sun’s magnetic field was very small during the Maunder Minimum, while it never was after 1735 [top panel]. So, IMHO the paper just shows the failure of the model and there is no good case for a new impending Grand Minimum.
The good news is that solar activity now seems to be well constrained back to the 1730s and that workers are beginning to attack the problem of the MM. The dust has still not settled on this, but it is progress that the issue is now an ‘active area of research’ [=euphemism for ‘we don’t really know yet’].
Are you saying; there seems to be little evidence recent decadal scale changes in global temperature can be attributed to solar variation and that you don’t see your position changing anytime soon?
Extend that to the last 300 years.
Isvalgaard,
It appears as though GCMs are not adequate to predict/project temp trends with any accuracy perhaps its because of a lack of knowledge and or data. How would you describe the current understanding of the sun?
EG, do we have enough knowledge of the sun to make any accurate predictions and do we have enough knowledge/data to accurately state what effects if any the sun plays in global climate changes.
Regards
I think he answered both those questions above.
So we don’t know enough about the sun to make such predictions, move along nothing to see here once again.
Its just another “look at me” attempt by scientists who crave attention.
“the money graph”, indeed – fascinating. This would be reassuring, but could it be extended further back in time? What did conditions look like, just before the apparent fibrillation of MM?
HI Leif,
Odd place to bump into you again.
I agree there’s a lot of assumptions that go into such a reconstruction. Not least that relations observed during the space age must be assumed to hold outside the observed parameter regime. But sadly there weren’t any spacecraft in the 17th century with which to make measurements. The assumptions are all explicitly stated in the paper.
I disagree there are no long-term trends after 1735. Both B and VA show fairly strong trends, though admittedly, none reach the Maunder min levels after 1735 (and why would we expect them to?).
The paper also has very little to say on the prospect of an impending Maunder minimum. It investigates the likely solar wind conditions under such low solar activity levels. Yes, there is uncertainty about quite how low the Maunder minimum was, but even you are not claiming that it was as high as post-1735?
I disagree there are no long-term trends after 1735. Both B and VA show fairly strong trends
VA varies basically as B, so let us only consider B. Here is B determined from geomagnetism [red] and cosmic rays [blue] and group numbers [pink]:
http://www.leif.org/research/HMF-back-to-1770s.png
There is no trend.
There is a slight [not ‘fairly strong’] trend in your curves when you reconstruct B from the sunspot number. Your SSN correction for the Waldmeier weighting is too small [see the now published http://www.leif.org/research/Effect-of-Sunspot-Weighting.pdf ] causing your B to be too small in the early part, giving the [false] impression of a [small] trend. In any case, using the Group Number avoids the weighting issue [and shows no trend].
We can take that reconstruction further back:
http://www.leif.org/research/HMF-B-back-to-1610.png
The issue with the MM hangs on whether there is a floor in HMF B [as there has been since 1700].
This is an issue for active research.
Leif, two things.
Firstly, there is a trend even in your simple B reconstruction. Compute 11-year means or something if you can’t see it. It looks more than a 50% variation by eye.
Secondly, your B reconstruction is still relying on the idea that B can’t drop below 4 nT. Even though we’ve directly observed it to do so. It might only make a small difference in your reconstruction for modern times, but it’s going to be completely invalid in the Maunder Min. Which even in your latest group series, is lower than modern periods.
Firstly, there is a trend even in your simple B reconstruction. Compute 11-year means or something if you can’t see it. It looks more than a 50% variation by eye.
There is an approximately 100-yr variation [which is not a ‘trend’] but no long-term trend since 1730s:
http://www.leif.org/research/HMF-B-back-to-1610-No-Trends.png
Secondly, your B reconstruction is still relying on the idea that B can’t drop below 4 nT.
This is no ‘idea’ but an observational fact for all the time where we have data [e.g. the geomagnetic reconstruction back to 1845].
http://www.leif.org/research/HMF-B-as-Function-SSN.png
Even though we’ve directly observed it to do so
The lowest yearly average for all the time where we have spacecraft data was 3.93 nT in 2009, which is statistically not significantly different from my nominal 4 nT floor for yearly averages.
My little brain, as I went throough the details of the various quantities being plotted in that money graphic, kept saying something is ‘out of whack’. Then I read your comment. lol
But that is not my first thoughts, or why I’m here.
From the abstract above,
“”The global heliosphere was both smaller and more symmetric under MM conditions, which has implications for the interpretation of cosmogenic radionuclide data and resulting total solar irradiance estimates during grand minima.””
Stating that the heliosphere is more symmetric under MM conditions, is tripping me up here, after having read some of this paper below. We currently have an asymmetry in solar polar magnetic fields, which produces an asymmetry in the heliosphere. Does the earth then receive more GCR rays in its bobbing orbit about the sun when it is north of the solar magnetic equator (and HCS)?
UNUSUAL POLAR CONDITIONS IN SOLAR CYCLE 24 AND THEIR IMPLICATIONS FOR CYCLE 25
Nat Gopalswamy1, Seiji Yashiro1,2, and Sachiko Akiyama1,2
Published 2016 May 19
https://arxiv.org/ftp/arxiv/papers/1605/1605.02217.pdf
Stating that the heliosphere is more symmetric under MM conditions
I think you misunderstand this. what they mean is that during solar minima the ‘streamer belt’ that lies in the heliospheric current sheet is normally rather narrow [only a few degrees wide in latitude], but during MM conditions the authors guess that the streamer belt was much wider, thus more ‘symmetric’ [although this is a poor way of expressing it]. The influence on cosmic rays of this would be small, especially on the rays with high energy. At present, there is no strong annual effect on cosmic rays.
And this cycle is not so unusual, there is some asymmetry in almost every solar cycle. The current observations of high-latitude and polar fields http://jsoc.stanford.edu/data/hmi/polarfield/ show that there is a lot of positive [blue] flux on its way to the north pole, so the asymmetry is rapidly diminishing.
I showed long ago [ e.g. http://www.leif.org/research/Polar%20Fields%20and%20Cycle%2024%20(Observations).pdf see also http://www.leif.org/research/Polar-Fields-in-17GHz.pdf ] that the 17 GHz microwave flux was a good indicator of the polar fields. I recently brought that plot more up-to-date:
http://www.leif.org/research/Nobeyama-17GHz-Synoptic-Limb-Chart.png
You can see the South pole at position angle 90 degrees and the North pole at 270 degrees. The reversal in the South was clearly delayed with respect to the reversal in the North for cycle 24 leading to the opposite conclusion from that of thepaper you cite, but the sun is a messy place and such asymmetries introduces enough noise in the system that basing wholesale predictions on them is a dubious business.
“This could make the Earth more vulnerable to technology-destroying solar blasts and cancer-causing cosmic radiation,”
Why more vulnerable to solar blasts when CMEs are less frequent? Earth’s atmosphere shields us from cosmic rays. Going to higher altitude could increase cosmic ray exposure more than change in heliosphere.
The earth’s magnetic field and the solar heliosphere (solar heliosphere is the name for the pieces of magnetic flux that are carried by the solar wind out past the orbit of Pluto) deflect high speed cosmic particles (mostly protons, called Galactic Cosmic Rays GCR for historical reasons, the initial discoverers did not know whether the phenomena has caused by a ray or particles and misleading term stuck) from striking the earth.
When the solar cycle is weak the solar heliosphere shrinks, is less dense, and has few pieces of magnetic flux.
There are very high speed protons (GCR) from Milky Way sources which strike the atmosphere. The very high speed proton which strike the atmosphere in turn create ions (atoms that are missing an electron and hence are charged rather than electrically neutral) in the atmosphere. The ions cause clouds to form, change the properties of clouds, increase the amount of rainfall, and increase the time before clouds dissipate. More cloud cover more solar radiation is reflected off into space, planet cools.
The complication is there is a second phenomenon that also affects cloud cover. Solar wind bursts create a space charge differential in the ionosphere which removes ions from high latitude regions.
The solar wind bursts are created by both sunspots and by coronal holes.
The cause of coronal holes is not known. The coronal holes can occur when there are few sunspots and hence when the solar heliosphere is weak and the GCR is high. The solar wind burst removes the ions created by the GCR for three to four days. Coronal holes are long lasting (months).
The surface of the sun rotates at different speeds depending on latitude. High latitude regions of the sun rotate roughly 40% slower than the equatorial region.
Sunspots float on the surface of the sun and rotate at the same speed as the surface of the sun.
Coronal holes on the other hand rotate at the same speed independent of solar latitude and at the same speed as the solar core. This indicates that coronal holes are caused by something related to the core of the sun. This is a paradox, as there is no mechanism in the standard stellar models than can create the coronal hole phenomena.
There are now immense coronal holes on the sun which indicates that there was been a change in the core of the sun.
The amount of warming due to solar wind bursts has been calculated based measured changes in cloud cover to be roughly 7 watts/m^2 as compared to the theoretically calculated 3.5 watts/m^2 (the theoretical warming for a doubling of CO2 is too high by roughly a factor of five) for a doubling of atmospheric CO2.
There is a review paper link below that discusses the solar wind phenomenon which is called electroscavenging by changes to the global electric current (current that flows from the poles of the planet to the equatorial region.
https://www.spaceweatherlive.com/en/news/view/239/20160926-massive-coronal-hole-faces-earth
http://iopscience.iop.org/1742-6596/440/1/012001/pdf/1742-6596_440_1_012001.pdf
http://iopscience.iop.org/article/10.1088/0004-637X/763/2/137/pdf
http://sait.oat.ts.astro.it/MmSAI/76/PDF/969.pdf
http://gacc.nifc.gov/sacc/predictive/SOLAR_WEATHER-CLIMATE_STUDIES/GEC-Solar%20Effects%20on%20Global%20Electric%20Circuit%20on%20clouds%20and%20climate%20Tinsley%202007.pdf
The role of the global electric circuit in solar and internal forcing of clouds and climate
William Astley February 2, 2017 at 5:32 pm
…””The surface of the sun rotates at different speeds depending on latitude. High latitude regions of the sun rotate roughly 40% slower than the equatorial region.
Sunspots float on the surface of the sun and rotate at the same speed as the surface of the sun.
Coronal holes on the other hand rotate at the same speed independent of solar latitude and at the same speed as the solar core. This indicates that coronal holes are caused by something related to the core of the sun. This is a paradox, as there is no mechanism in the standard stellar models than can create the coronal hole phenomena.
There are now immense coronal holes on the sun which indicates that there was been a change in the core of the sun.”””
William, I am hoping our resident solar/astrophysicist, weighs in on this comment.
There are now immense coronal holes on the sun which indicates that there was been a change in the core of the sun
No, there is no evidence of that. Immense coronal holes are not new. The year 2003 had even larger holes. Large coronal holes show themselves at the orbit of the Earth as high-speed solar wind. Such high-speed wind happens on the declining phase of every solar cycle and reveal itself as high recurrent geomagnetic activity], e.g.
http://www.leif.org/research/High-Speed-Streams-Before-Every-Minimum.png
and also directly by the values of the solar wind speed:
http://www.leif.org/research/Solar-Wind-Speed-Last-100-Years.png
This plot was made in 2014 and the dashed arrow shows that streams [=’immense’ coronal holes] were predicted to occur just about now [as they do]. It helps to know what one is talking about.
William has no idea what he is talking about. No need to worry about his various muddled comments.
I thought I read in Dr. lsvalgaard’s writings some 2-3 years ago that MASSIVE CMEs are more likely during a quite sun (zero sunspots) then when the sun in a more “normal” mode. ???
No Northern Lights and no snow? Boy the UK just keeps getting the short end of the stick. Wait, record snow you say? I can’t tell by the glow of these damn lights.
If we really do experience an increase in cosmic ray fluence, it should tell us whether or not cloud formation is strongly linked to cosmic radiation. Unfortunately, a “yes” to that will mean substantial cooling as the cloud albedo increases.
‘…the coming solar minimum will do little to offset the far more significant global heating effects of greenhouse gas emissions.”’
Well there you go. Just had to sneak the usual grab of alarmist baloney in. Keeps the grant money on tap.
Yep …. carbon driven global warming is the money line for all research these days. In fact, we are strongly considering tagging it on the end of our paper on new strategies for preventing b-amyloid plaque formation associated with Alzhiemer’s disease.
Start by checking for a plaque minimum during the little ice-age.
It’s too late. Debate (and science) have ended by order of the Sierra Club and NRDC. Fake consensus is actually more destructive than fake news.
A Sierra Club representative (not sure title) was on Tucker Carlson’s program tonight, clearly an empty suit and not focused on Environmentalism as noted by Tucker. They have adopted every left wing cause including abortion and claimed some environmental benefit for each cause.regardless of how ridiculous.
The kow tow to climate science is pathetic. It also demonstrates the group-think which climate change dogma has infected science in general with. This is political science also known as Lysenkoism. These poor fellows are so cowed and weak minded that they can’t publish without covering their behinds politically. We need more brave scientists badly.
Another interesting paper tainted by gratuitous pro forma non sequitur.
Yes, there certainly is a cosmogenic mouth full going on here…
““The Maunder Minimum in solar activity of the 17th century is sometimes mistakenly thought to be the cause of the so-called Little Ice Age, when winter temperatures in Europe, and elsewhere in the world, were lower than average.
“But the Little Ice Age began before the Maunder Minimum and ended after it, and our previous work with the Met Office has shown that the coming solar minimum will do little to offset the far more significant global heating effects of greenhouse gas emissions.””
The ever present “money phrase.” They had to give obedience to the global warming god to make sure they do not get defunded or marginalized by the government.
It is clear that the Earth would be cooling as it went into the Maunder Minimum, as cold during the minimum, and only warmed up afterwards. They imply that the Maunder Minimum was the trigger for cooling rather than the minimum of an energy input system that was already declining, and thus the Earth cooled.
Their pandering to politics is SO TRANSPARENT, it’s sickening. Sign.
I have to say this: solar stuff, CO2 stuff, etc., all must be sexy. Oceans? Borrrring. Yet it is the ocean alone that has the capacity to hold onto or expel heat over very long periods of time. But that doesn’t sell stories on the 6:00 news.
I was actually wondering, in response to lsvalgaard’s comment that solar activity has been declining for the past century and yet temperatures have not, if the oceans might be a factor in that. Then there is the jet stream, which certainly seems implicated in decadal variations in temperature. Add all that to the fact that by definition, more or less, climate changes slowly, and it seems like we have a recipe for a lot of uncertainty about climate past, present, and future.
Very well said. However I think physics can be used here, as in liquid/gas thermodynamic theory. Much has been learned on a smaller scale, and I think an engineer may be able to unravel this, by creating a model of a world 75% covered with a circulating variously evaporating large body of water, similar to Earth, overlaid with various degrees of water vapor, exposed to a constant heat source. By changing the dials, the body of water would slowly heat. By changing dials the other way, the body of water would slowly cool. And because the body of water can be essentially held at a constant volume, it conceivable could switch on its own, being saturated, from net warming to net cooling, creating a seesaw pattern over time.
“They imply that the Maunder Minimum was the trigger for cooling”
Hmm. Not according to your quotes. Pandering and sickening might be just a rumour.
Whew! Good thing the sun is running on idle… now that the earth’s magnetic field is flipping. What exquisite timing!
Paul? Are you implying that there could be a connection? i don’t know but when was the last “flip”? This is an honest question btw not a ” dig” I thought these type of ” flip ” events happened every 25,000 years or so?
?? sarc !!
They last flip happened 781,000 years ago. There have been about 170 flips in the last 100 million years.
That works out to an average of 1 every 600,000 years or so, allowing for rounding error.
https://www.nasa.gov/topics/earth/features/2012-poleReversal.html
“…..Reversals are the rule, not the exception. Earth has settled in the last 20 million years into a pattern of a pole reversal about every 200,000 to 300,000 years, although it has been more than twice that long since the last reversal. A reversal happens over hundreds or thousands of years, and it is not exactly a clean back flip. Magnetic fields morph and push and pull at one another, with multiple poles emerging at odd latitudes throughout the process. Scientists estimate reversals have happened at least hundreds of times over the past three billion years. And while reversals have happened more frequently in “recent” years, when dinosaurs walked Earth a reversal was more likely to happen only about every one million years……
Another doomsday hypothesis about a geomagnetic flip plays up fears about incoming solar activity. This suggestion mistakenly assumes that a pole reversal would momentarily leave Earth without the magnetic field that protects us from solar flares and coronal mass ejections from the sun. But, while Earth’s magnetic field can indeed weaken and strengthen over time, there is no indication that it has ever disappeared completely. A weaker field would certainly lead to a small increase in solar radiation on Earth – as well as a beautiful display of aurora at lower latitudes – but nothing deadly. Moreover, even with a weakened magnetic field, Earth’s thick atmosphere also offers protection against the sun’s incoming particles.”
Declining intensity of the Earth’s magnetic field will have serious consequences for the satellite communications (military and civil) long before any significant effect on the surface systems is even noticeable.
This map gives an idea what might happen worldwide
click on to enlarge
Satellite memory has built in circuitry that can detect and correct 1 bit errors. It’s only when 2 of more bits are changed in any one byte that data is lost.
It’s the CO2 wot dunnit, m’Lord!!!
“Children won’t know what Northern lights are anymore!”
” if we extrapolate the trend”
“Major Disasters will happen”
Sounds familiar?
Now practising for the NYT ‘bonfire for sinners’-quiz:
Sun and atmosphere are homogenous and constant. Climate would be too, if the carbon-based lifeforms realised their social cost, preyed for winter, burned their food for warmth and ate their young.
The human race survived the Maunder minimum , so maybe we should not worry too much about the suppression of a dipole earth field. A quadrupole field will likely remain.
We rarely saw the Northern lights from the island which is my home in the Irish sea, but over the last few years they seem to have made a much more regular appearance. I know this is personal observation and subjective, but i have seen nothing which indicates increased sold activity over that time.
That should be :
increased SOLAR activity. Mrs.Phillips ensures that there is plenty of “sold” activity in our local shops 🙂
Ha! more alarmism….
Poor Griffie, he’s like a little dog who’s convinced that the plastic toy he’s been tossed is a real bone.
Poor Griffie’s shadow, keeps bravely yapping into his keyboard.
Poor McClod, with his boot in his gob, fresh from treading in a cow-pat.
There is no such evidence.
Few scientists believe that. There is no coming grand minimum. Solar grand minima take place mainly in clusters at specific times in the ~ 1000 and ~ 2400 year solar cycles. None is due, so the chances of a grand solar minimum are really small. The expected solar activity from solar cycles is:
http://i.imgur.com/j2hbCiv.png
Note that the millennial high is expected around the end of the century. There won’t be significant cooling from solar activity for at least a couple of centuries.
By pure chance there was a cluster of strong volcanic eruptions right before the Wolf minimum, and another right after the Dalton minimum. The Little Ice Age went from that first cluster to the last, but low solar activity is still the best explanation for the Little Ice Age
http://i.imgur.com/QWfrKaI.png
Figure 15. The effect of LIA climate changes on human societies of Europe. From top to bottom: (a) Solar activity reconstruction by Steinhilber et al., 2012 (in black), shows the Wolf, Spører, Maunder, and Dalton grand solar minima. (b) Volcanic activity reconstruction by Sigl et al., 2015, (in magenta), with dates for the three major eruptions. (c) Northern Hemisphere temperature reconstruction (in red), by Christiansen & Ljungqvist, 2012. (d) Wheat price in Dutch guilders per 100 kg (Lamb, 1995; inverted, in blue), for France (continuous), England (dashed) and Germany (dotted). (e) Three main crops of grain net yield per acre in England, with annual data in pink, and long term trend in brown (Campbell & Ó Gráda, 2011). (f) Northern Hemisphere population growth in % (Zhang et al., 2010; in orange). (g) Northern Hemisphere famine index in events per decade (Zhang et al., 2010; in green). (h) Major famine events (green boxes) and major epidemic and pandemic events (brown boxes). Main historical periods of crisis are shown in boxes at the bottom. Grey vertical lines link multiyear crop failures in (e) with major famines in (h). Light blue boxes are periods of climate deterioration defined in figure 13.
https://judithcurry.com/2016/09/20/impact-of-the-2400-yr-solar-cycle-on-climate-and-human-societies/
This article has a chapter on the Little Ice Age.
Javier, looking at your first figure it would seem that the two previous centennial lows had 3 low periods in a row before rising. It would appear that cycle 25 and 26 could well be much lower that you predict.
One cannot just look at previous cycles and extrapolate repetitions. The sun doesn’t work like that. The only way to predict the next cycle is to actually observe the polar fields during the declining phase of the current cycle from which the new cycle will be generated.
Asybot,
Two centennial lows ago was the Dalton minimum. The last one was the 1900’s cold period. Clearly the intensity of the centennial lows is related to how close they are to the millennial low or the millennial high. Now we should get a centennial low that is significantly warmer than the 1900’s. A couple of below average solar cycles (24 & 25) is probably all we should expect. This projection is in sharp contrast to the many people (relatively speaking) that predict a solar grand minimum like the Maunder.
Back in 1977 the sunspot cycles were graphed as follows. The ‘Fallacy of repeating patterns’ is shown by the red boxes. Guess what the cycle marked by the big question mark would look like [pretty small, one would guess]:
http://www.leif.org/research/Fallacy-Repeating-Patterns,png
The pattern [big, small, small] was supposed to repeat every 83 years.
As we all know by now, it didn’t. Herein lies the cautionary tale.
http://www.leif.org/research/Fallacy-Repeating-Patterns.png
http://www.leif.org/research/Fallacy-Repeating-Pattern.png
An hypothesis is proposed based on observations. The hypothesis makes a prediction. The prediction does not come to pass. The hypothesis is rejected.
The great majority of hypotheses are wrong. The problem comes when after the prediction fails the hypothesis is not rejected, but modified to accommodate new observations whichever they are and at the same time observations are adjusted to fit the hypothesis. That is the real cautionary tale as a failed hypothesis that is anyway upheld delays the acquisition of knowledge.
That is the real cautionary tale as a failed hypothesis that is anyway upheld delays the acquisition of knowledge
That is your problem: clinging to a failed hypothesis.
Again a matter of opinion. The hypothesis that the Sun’s variability displays cycles is supported by a lot of evidence based on observations, and makes predictions easy to test.
A centennial cycle low was expected at SC24, and a centennial cycle low is taking place.
Here is a prediction for SC 24 based on cycles that nailed it (marked in red in the first figure of my post above).
Tan, B. (2011). Multi-timescale solar cycles and the possible implications. Astrophysics and Space Science, 332(1), 65-72.
SC29 and SC31 should also be lower than the cycle immediately before as they belong to a half centennial low and a de Vries low respectively.
Is your opinion contrary to the existence of solar cycles? That’s fine. You can also be wrong.
lsvalgaard, February 2, 2017 at 11:34 pm
“The problem is that solar activity has generally dropped the last half-century, yet temperatures have increased.”
========================
“But how can you stop people remembering things and feeling cold?” cried Winston.
From the Memory Hole…
* * * * * * * * * *
Study Finds Increasing Solar Trend That Can Change Climate
NASA, Mar. 20, 2003
Since the late 1970s, the amount of solar radiation the sun emits, during times of quiet sunspot activity, has increased by nearly .05 percent per decade, according to a NASA funded study.
“This trend is important because, if sustained over many decades, it could cause significant climate change,” said Richard Willson, a researcher affiliated with NASA’s Goddard Institute for Space Studies and Columbia University’s Earth Institute, New York. He is the lead author of the study recently published in Geophysical Research Letters.
“Historical records of solar activity indicate that solar radiation has been increasing since the late 19th century. If a trend, comparable to the one found in this study, persisted throughout the 20th century, it would have provided a significant component of the global warming the Intergovernmental Panel on Climate Change reports to have occurred over the past 100 years,” he said.
* * * * * * * * * * *
Scientists blame sun for global warming
BBC, Friday, February 13, 1998
image 1: “The Sun is more active than it has ever been in the last 300 years”
image 2: “Ancient trees reveal most warm spells are caused by the sun”
[…]
“The researchers point out that much of the half-a-degree rise in global temperature over the last 120 years occurred before 1940 – earlier than the biggest rise in greenhouse gas emissions.”
* * * * * * * * * * *
Spotless Sun: Blankest Year of the Space Age
NASA, Sept 30, 2008
* * * * * * * * * *
The Planet Gets Cooler in ’08. Say What?
Time, Dec 16, 2008
* * * * * * * * * *
The Alps have best snow conditions ‘in a generation’
Telegraph UK, Dec 19, 2008
* * * * * * * * * * *
Snow falls on Baghdad for first time in memory
Reuters, Jan 11, 2008
* * * * * * * * * * *
China battles “coldest winter in 100 years”
Reuters, Feb 4, 2008
* * * * * * * * * * *
Arctic blast brings London earliest snow for 70 years
EveningStandard UK, October 2008
* * * * * * * * * * *
Flights axed as Las Vegas hit by rare snowstorm
USA Today, Dec 19, 2008
* * * * * * * * * * *
The world has never seen such freezing heat
Christopher Booker, Telegraph UK, November 2008
* * * * * *
Nice find, Khwarizmi.
What a good job it is and we are so lucky that the climate ‘scientists’ have all the answers and can lead us to salvation. /s
If we demand that an open mind be maintained on CO2 and climate, we must do the same for solar activity.
Claims that CO2 drives global temperature are abundantly refuted by the paleo record of temperature and CO2.
Claims that sunspots and solar cycles drive climate are repeatedly refuted by Leif, Willis and others since the data don’t show it.
Right now we are half a precession cycle into the current interglacial which is already tailing off to cooler temperatures toward inevitable glacial inception with a few centuries. By Milankovich forcing. That’s the only real climate issue.
“since the data don’t show it.”
====
It depends what you mean by “data”
The atmosphere is made up of molecules https://www.youtube.com/watch?v=zRw0O782o2k of positive and negative charges, when the charged solar wind collides with these molecules they emit a photon of light .
Can humans really feel temperature. https://www.youtube.com/watch?v=yXT012us9ng
Misconceptions About Temperature. https://www.youtube.com/watch?annotation_id=annotation_622525&feature=iv&src_vid=yXT012us9ng&v=vqDbMEdLiCs
How Hot Can It Get? https://www.youtube.com/watch?v=4fuHzC9aTik
There seems to be a high correlation between reduced solar activity and increased CO2. Ergo, we need to stop emitting CO2 if we want to live.
How do they keep forgetting? Horse first – THEN cart. Auroras need solar wind, magnetosphere, and atmosphere. Sunspots are telling us the solar wind has been fading, and the other two components are fine right where they are.
Magnetosphere has been dropping for the last century or so.
The authors claim: “But the Little Ice Age began before the Maunder Minimum …..”.
According to Wikipedia: “The Maunder Minimum, also known as the “prolonged sunspot minimum”, is the name used for the period starting in about 1645 … “.
Also according to Wikipedia, with respect to the Little Ice Age: “The NASA Earth Observatory notes three particularly cold intervals: one beginning about 1650, another about 1770, and the last in 1850 … ”
It seems to me that the authors’ claim is a distortion of the truth, to put it mildly.
Or (and brace yourself here), it could be that the Wikipedia entry is incorrect because it’s not peer-reviewed and literally anyone can edit it.
Why not take a look at the data for yourself?
http://www.nature.com/nature/journal/v536/n7617/fig_tab/nature19082_F2.html
Firstly, you’ll see that the “Little Ice Age” is very hard to spot, because it wasn’t an ice age at all, little or otherwise. Secondly, you’ll see that the small temperature decline starts well before 1650.
Oh yes it was a Little Ice Age if you happened to study glaciers, as they reached their maximum extent during the Holocene at that time.
Mann-made facts
And then the cosmic radiation will increase the sky haze which will decrease the amount of light reaching the surface and blah blah blah…..
Solar wind transports the Earth’s oxygen to the moon
“Because the moon is protected from the solar wind by the Earth when the increase in oxygen ions was recorded, the researchers are confident they come from the Earth….
Data from Kaguya now suggests that some of those ions are oxygen. The researchers found that approximately 26,000 oxygen ions per second hit every square centimeter of the moon’s surface during the deluge.
More details here
Word to the wise. Using research from various decades leaves you vulnerable to inadvertently referencing an outdated hypothesis. Because the hypothesis no longer has merit does not mean it will be erased from the journals. It is up to the presenter to remain current on the research in order to avoid such mistakes, unless of course the person has gone fishing for an article that supports his or her’s proposal and be damned with current knowledge.
The last two paragraphs are nonsense. Lockwood and his student must be the only astronomers who believe that the Maunder minimum had nothing to do with the litle ice age. But then again, Lockwood is a GW believer. Unfortunately for him CO2 is not a climate driver and will therefore not more than compensate for the next solar minimum.
It’s happened before, it will happen again.
It does not take much change or combination of factor impacts to create problems in the real world.
http://heatst.com/world/severe-vegetable-shortage-deprives-europeans-of-spinach-broccoli/
Average length of sunspot cycles during the last 200 years is about 10.7 years.
W. Gleissberg In his letter (1945) Evidence for a long solar cycle writes:
” One long cycle is equal to 7 eleven-year cycles”, which would make the Gleissberg’s cycle about 75 years long.
Spectral power distribution for the GISP2 Ice Core 1000 Year long (1000 – 1993 AD) Ar-N2 Isotope Temperature Reconstruction (data from ncdc.noaa)
http://www.vukcevic.talktalk.net/GISP2.gif
has the strongest component at exactly 75 years.
However, as stated in another publication, some 25 years later Galesburg appears to change his mind.
Was the original Galesburg solar cycle just an accidental coincidence, or is the Greenland temperature variability with its critical relation to global trends directly related to now ‘nearly forgotten’ 7 x SSN cycles periodicity?
More research required (send the money).
Galesburg ? !
where did that come from? russian hackers?
It should be: Gleissberg & Gleissberg
Solar activity reconstructions match quite well with temperature reconstructions and sea level reconstructions. CO2 however doesn’t.
http://peakoilbarrel.com/wp-content/uploads/2017/01/594402.png
No, solar activity does not match the climate record at all. Especially not the recent record.
Frankly, Leif, it should be expected that the recent climatic record should be very certain. But regretfully that is not the case. One has to ask which record, because different records show different things. Many of the adjustments set the new version outside the 90% confidence range of the previous version, which means that the confidence range is bogus. Satellites and surface records are quite different, and both are different from some proxy records. I don’t think we can say reliably how much warmer are the 2010’s with respect to the 1930’s. So I wouldn’t make a world about the lack of match between recent records and solar activity. Specially if we can infer an important role for the past 10,000 years. It is unlikely that the role of solar activity on climate has changed recently.
One has to ask which record, because different records show different thing
So lots of ways to cherry-pick the ones you like best. I think in the current parlance they are called ‘alternative facts’.
That there is even discussion and dissent about this simply shows that there is no good evidence of the sun being a major driver of recent climate change. It may be sobering for you to read http://www.leif.org/EOS/Sun-Weather-Climate.pdf describing the situation 40 years ago.
No progress has been made.
Javier, you articulate a point I have pondered for awhile: How do researchers reconcile prior study results, based on older surface temperature records (and paleo-data),with heavily adjusted current records? I assume results could vary considerably. The science is settled?
Climate modelers have a similar problem: Having tuned their models to the “hot” late 20th Century, how do they reflect the 21st Century slowdown without destroying prior hindcasting? Adjusting aerosols, water vapor, clouds, etc. will simply solidify the idea that the models are essentially sophisticated speculation/guesses.
Dr. Judith Curry pointed out that IPCC climate models are not fit for the purposes of changing our society, economy and energy systems, as progressives are wont.
IPCC climate models are bunk.
Specially if we can infer an important role for the past 10,000 years. It is unlikely that the role of solar activity on climate has changed recently
Conversely: if there is no evidence for the past several centuries it is unlikely that the role of solar activity on climate was any different for the past 10,000 years.
The early CET annual data are estimates rather than accurate instrumental records. In recent decades with proliferation of central heating installations (UHI) and elimination of coal home heating (1956 clean air act) and the intense de-industrialisation (atmospheric particles), the CET data reflects not only the fundamental natural variability but also number of the anthropogenic factors of this densely populated, once highly industrialised area
Having in mind all of the above, still there is a relatively good association of the CET to the solar activity.
http://www.vukcevic.talktalk.net/CET-GSN2.gif
It should be added that in the second half of 18th century there were two or three large Iceland’s volcanic eruptions, which due to the proximity to the CET area might have had disproportionate influence on the temperatures.
That is a matter of opinion, obviously. We do have several interesting hypotheses on how the Sun could affect climate other than TSI changes. These hypotheses are testable. To me the most interesting one is the one outlined by Joanna Haigh 20 years ago.
Haigh, J. D. (1996). The impact of solar variability on climate. Science, 272(5264), 981.
“A general circulation model that simulated changes in solar irradiance and stratospheric ozone was used to investigate the response of the atmosphere to the 11-year solar activity cycle. At solar maximum, a warming of the summer stratosphere was found to strengthen easterly winds, which penetrated into the equatorial upper troposphere, causing poleward shifts in the positions of the subtropical westerly jets, broadening of the tropical Hadley circulations, and poleward shifts of the storm tracks. These effects are similar to, although generally smaller in magnitude than, those observed in nature. A simulation in which only solar irradiance was changed showed a much weaker response.”
The effect of solar activity on stratospheric temperatures has been demonstrated. And the expansion of the Hadley cells during global warming is an observed phenomenon to which the Greenhouse Gas hypothesis has no explanation.
There is plenty of evidence. One only has to read the paleoclimatology articles that study the periods of low solar activity as determined by the cosmogenic isotopes record.
Plenty of bibliography to start looking at the evidence at:
Impact of the ~ 2400 yr solar cycle on climate and human societies
And simply look at the correlation between temperatures and past solar activity.
http://i.imgur.com/chz2WcX.png
There is no doubt that there is an intermittent association of the temperature as expressed in the ‘global’ or the hemispheric data with solar activity/TSI; however this doesn’t mean that the cause-effect can be conclusively demonstrated.
There is a huge disparity in the energy content in the stratosphere and the lower troposphere, not to mention energy content in the top tens of meters of the world oceans.
In the energy domain, figuratively speaking, is the waving of the stratosphere’s ‘tail’ capable of swaying the ‘elephant’ of the lower troposphere and the world’s oceans surface?
I seriously doubt it.
Dave Fair,
For what I have read from quite extensive bibliographic reading, many researches deal with it the easy way by dividing the temporal range according to the Before Present (1950) scale so they have to deal only with pre-anthropogenic climate. Those that study recent climate only use BP climate to support very specific points.
But there are clear inconsistencies that nobody wants to deal with. From Last Glacial Maximum to Holocene start CO2 increase was only 75 ppm, and some researches defend an important role for CO2 in deglaciation, however between 6000 BP and 1600 AD, CO2 increased by 25 ppm (one third of deglaciation change), while temperatures consistently fell as the Neoglacial period took place. This is indefensible, yet it is defended.
Then models that reproduce 20th century warming, fail to reproduce Holocene climate. They are still defended as correct.
See the very interesting article:
Liu, Zhengyu, et al. “The Holocene temperature conundrum.” Proceedings of the National Academy of Sciences 111.34 (2014): E3501-E3505.
http://www.pnas.org/content/111/34/E3501.full
Owens refers to this data set [CET I believe]:
http://www.leif.org/research/Owens-No-Little-Ice-Age.png
re CET: see comment above
I read somewhere that many of the CET sites are compromised by UHI effects.
Much can be inferred about energy change needed to drive long term climate patterns up or down. Just scrubbing out temperature inversions takes tremendous energy, meaning that the strength of an oncoming pressure system has to be greater than the system keeping a temperature inversion in place. Now multiply that pressure system interaction by 100’s of years. These are the things that weather is made of that then becomes the statistical derivative called climate change. Tiny changes in w/m2 from solar or ppm gas molecules cannot be the cause. These variation just are not great enough to drive changes in weather patterns that are the bedrock, the only bedrock, of climate change. Weather is a very large and energetically powerful entity, equivalent to the oceans in strength and resistance to change. It boggles the mind that most of both sides of this debate continue to focus on minutia (tiny fractional amounts of energy change available in solar or CO2 variations), in spite of the much more significant energy requirements necessary to change weather patterns.
From the abstract above.
“”Relative to the modern era, the MM shows a factor 2 reduction in near-Earth heliospheric magnetic field strength and solar wind speed, and up to a factor 4 increase in solar wind Mach number. Thus solar wind energy input into the Earth’s magnetosphere was reduced, resulting in a more Jupiter-like system, in agreement with the dearth of auroral reports from the time.””
When they say ‘dearth of auroral reports,’ do they mean northern european countries only?
Maybe we can ask Pres. Trump, to ask his Russian friends, to inquire of the science community, if they have scoured their history for they auroral reports? Or are theirs included and what of the southern hemisphere?
And…
Could someone help us to understand the following statement?
“”the MM shows a factor 2 reduction in near-Earth heliospheric magnetic field strength and solar wind speed, and up to a factor 4 increase in solar wind Mach number””
Could someone help us to understand the following statement?
“”the MM shows a factor 2 reduction in near-Earth heliospheric magnetic field strength and solar wind speed, and up to a factor 4 increase in solar wind Mach number””
Their model [which I think is faulty] shows a factor 2 reduction. That does not mean that there actually was such a reduction. See e.g. http://www.leif.org/EOS/2011GL046658.pdf
The Mach number depends on the magnetic field strength B [inversely], so if B is wrong, so will be the Mach number. Modern data shows that the Mach number is constant [=12.5] at every solar minimum, so was likely also so during the MM.
Spacecraft data 1964-2016 shows that as the sunspot number decreases to zero, the Mach number increases to 12.5 from about 8. No increase by a factor of four from high solar activity [SSN ~ 250] to no activity [SSN ~ 0].
The Figure:
http://www.leif.org/research/Alfven-Mach-Number-as-Function-of-SSN.png
The sunspot-Mach number plot is very interesting. Though there’s likely a big difference in heliospheric conditions resulting from zero sunspots for 27 days and zero sunspots for 27 years.
in 2008-2009 there were 527 spotless days. Very much MM conditions.
No, that’s a deep solar minimum. Having a “solar maximum” with zero sunspots is very different.
No, it just means that the same [well-known] conditions at sunspot minimum prevailed also at maximum. And your own plots do show ‘some’ activity at maxima. The Mach number is determined by conditions at and very near the sun and not by ‘heliospheric conditions’.
“in 2008-2009 there were 527 spotless days. Very much MM conditions.”
AND, it got very cold… Any correlation between the two & are we likely to see a repeat this time around? (yes, no, maybe so?)
Hi there
Russian science ‘started’ with the rule of Peter the Great, who came to power towards the end of Maunder Minimum. However, there are Hungarian records going back to 1550s. In 120 out of subsequent 400 years some 240 events were recorded, which is not many but considering that the clear sky with an aurora well above average strength are required to be visible in Hungary at latitude at 47N.
http://www.vukcevic.talktalk.net/HAr.gif
Personally Dr. S., I think conclusions below, sum up the current solar cycle progression very well.
Last question, if I may Dr. S.?
If the amount of north pole ward flux available for the next cycle got cancelled out by flux of opposite polarity, from where would you expect more flux to be available from? What flux was available got cancelled, no?
UNUSUAL POLAR CONDITIONS IN SOLAR CYCLE 24 AND THEIR IMPLICATIONS FOR CYCLE 25
Nat Gopalswamy1, Seiji Yashiro1,2, and Sachiko Akiyama1,2
Published 2016 May 19
5. Conclusions
The main conclusions of this paper are as follows:
1. The north polar region of the Sun had an unusually long stretch of near-zero magnetic
field strength for more than three years. This was caused by surges of both polarities
towards the north pole that prevented the buildup of the polar field until the end of 2015.
The alternating surges caused the undulating pattern in the polar microwave brightness
enhancement.
2. The continued occurrence of high-latitude prominence eruptions, the lack of microwave
brightness enhancement, and the absence of polar coronal holes are consistent with the
prolonged zero-filed condition in the north.
3. The end of zero-field condition is indicated by the steady increase in microwave
brightness enhancement above the quiet-Sun level and the cessation of high latitude
prominence eruptions.
4. In the southern hemisphere, most of the surges were of opposite polarity to that of the
incumbent flux, so the reversal was completed in the middle of 2014. Because of the last
intense surge, the south polar magnetic field rapidly increased as indicated by both
SOLIS magnetic field data and microwave brightness enhancement.
5. We identified multiple rush to the poles episodes from PE locations. The PEs occurred at
the boundary between poleward surges of opposite polarity. The high-latitude PEs
occurred along the boundary separating the incumbent polar flux and the insurgent flux
of opposite polarity.
6. There is a clear change in the north-south asymmetry of polarity reversal. For the past
several cycles, north was reversing first. In cycle 24, the reversal was more than a year
ahead in the southern hemisphere. The arrival of zero-field condition, however, was first
in the north.
https://arxiv.org/ftp/arxiv/papers/1605/1605.02217.pdf
Personally Dr. S., I think conclusions below, sum up the current solar cycle progression very well.
But are rather useless as they are purely descriptive. What I would call ‘butterfly collecting’. You learn nothing of general value that you can use for other cycles, for prediction or for learning about the physics of generation of solar cycles.
If the amount of north pole ward flux available for the next cycle got cancelled out by flux of opposite polarity, from where would you expect more flux to be available from? What flux was available got cancelled, no?
There is always enough new polarity from decaying active regions to generate the next cycle. If there even once were not, the cycle would stop forever. Since we after several billions of years and hundreds of millions of cycles still have a cycle, complete cancellation never happened and so is not likely to happen in any foreseeable future that we need to worry about.
Thank you Dr. S., for the replies.
From the link below, (thanks for the update of) you can see in Figure 1, that the northern polar magnetic field strength is only half the strength of the south.
In Figure 2, you can see that for 2016 there is more negative flux between 0-20 degrees N. Lat. than there is positive flux. That means that the positive flux was still being cancelled out by the more plentiful negative flux and unable to reach the N. Pole, no? Why is there still more negative flux?
http://jsoc.stanford.edu/data/hmi/polarfield/
With this info, runs my imagination, seeing LOTS more compression of the heliosphere over its NORTHERN Extent. This has been weak for several years now. And one of our Voyager space craft sees more action than the other?
Currently the earth’s magnetic field and the solar magnetic field are weakening thus far the climatic effects are very little but it is early in the game.
Thresholds are out there and in time if the trends continue they will be reached and at that time the climate will change in a notable way –colder.
The latest data for solar polar fields shows this period of solar activity is not normal it is different how different remains to be seen and how this effects the climate remains to be seen.
Solar parameters are starting to reach my criteria with the exceptions of solar wind speeds and AP index values but this should start to come in line as sunspot numbers continue to decline.
I am still confident that solar is the key climatic driver while the GHG effect is a result not the cause for the climate to change.
The test has started and we shall see how this all pans out.
Solar climate correlations are quite strong if one views the historical climatic record versus solar activity. I expect this time will be no different.
The asymmetries in this solar cycle are telling a good story.
HEMISPHERIC ASYMMETRIES OF SOLAR PHOTOSPHERIC MAGNETISM: RADIATIVE, PARTICULATE, AND HELIOSPHERIC IMPACTS
Scott W. McIntosh1, Robert J. Leamon2, Joseph B. Gurman3, Jean-Philippe Olive4, Jonathan W. Cirtain5, David H. Hathaway5, Joan Burkepile1, Mark Miesch1, Robert S. Markel1, and Leonard Sitongia1
Published 2013 February 27
http://iopscience.iop.org/article/10.1088/0004-637X/765/2/146#apj461526s2
Every 96 minutes MDI takes a synoptic map of the photospheric magnetic field. The example shown (Figure 3) was taken at 00:00 UT on 2008 April 10 when the Sun was very quiet (see, e.g., Figure 3(A)). The photosphere, in this case, appears as a mixed “salt and pepper” distribution of positive (white) and negative (black) magnetic field concentrations. The first impression of the signal from the disk center area is of a dominance of negative polarity magnetic field.
http://cdn.iopscience.com/images/0004-637X/765/2/146/Full/apj461526f3_lr.jpg
During the 2009 solar minimum the equatorial region of the Sun was imbalanced, with a net negative field. That imbalance persisted for almost two years.
We should stress that our use of the term “imbalance,” or later use of the term “unipolar,” with reference to the distribution of the photospheric magnetic field, implies that the spatial magnetic field distribution is dominated by one polarity over a given scale length—polar coronal holes are an example of a prolonged (local) imbalance and unipolarity of the magnetic field. The use of these terms in no way indicates that the entire solar atmosphere is unipolar or imbalanced (implying a breakdown in the fundamental laws of physics) where local imbalances of one polarity are balanced by local concentrations of the other polarity that are not necessarily nearby.
3.2. Long-lived Unipolar Regions?
The implication of Figure 4 is that the equatorial region of the solar atmosphere is dominated by one single polarity of magnetic field through the 2009 solar minimum. If this is indeed the case then we should expect some impact of this on the global morphology of the Sun’s magnetic field. Consider Figure 5, which shows three visualizations of the coronal magnetic field topology near the 1997 and 2009 solar minima and in the first quarter of 2010 as approximated by the Potential Field Source-Surface (PFSS) model extrapolation of the LOS SOHO/MDI photospheric magnetic field (Schatten et al. 1969). Notice that the structure of the 1997 corona (left) is (approximately) symmetric about the solar equator while the 2008 image (center; noting the polarity reversal of the northern and southern poles) shows that the open magnetic field of negative polarity spans nearly two-thirds of the off-limb corona. As solar cycle 24 begins in earnest (right) we see a coronal environment that has a high degree of north–south symmetry.
http://cdn.iopscience.com/images/0004-637X/765/2/146/Full/apj461526f5_lr.jpg
http://cdn.iopscience.com/images/0004-637X/765/2/146/Full/apj461526f5_lr.jpg