Guest Post by Willis Eschenbach
Estimates of future atmospheric CO2 values as a result of future emissions, called “scenarios”, fall into two camps—demand driven, and supply driven. A recent paper entitled “The implications of fossil fuel supply constraints on climate change projections: A supply-driven analysis” by J.Wang, et al., paywalled here, has a good description of the difference between demand and supply driven scenarios in their abstract:
ABSTRACT
Climate projections are based on emission scenarios.The emission scenarios used by the IPCC and by mainstream climate scientists are largely derived from the predicted demand for fossil fuels, and in our view take insufficient consideration of the constrained emissions that are likely, due to the depletion of these fuels.This paper, by contrast, takes a supply-side view of CO2 emission, and generates two supply-driven emission scenarios based on a comprehensive investigation of likely long-term pathways of fossil fuel production drawn from peer-reviewed literature published since 2000. The potential rapid increases in the supply of the non-conventional fossil fuels are also investigated. Climate projections calculated in this paper indicate that the future atmospheric CO2 concentration will not exceed 610 ppm in this century;
The obvious advantage of supply-driven projections is clear—they represent our best estimate of what will be physically possible based on our best estimates of how much fossil fuel we can actually produce over the coming century.
Here is their description of how they put together their best estimate of the future oil production.
We assembled 116 long-term forecasts for the global production of fossil fuels (oil, gas or coal), using peer-reviewed literature published since 2000, and recent reports from the mainstream energy forecasting agencies. These comprised 36 forecasts for conventional oil, 18 for conventional gas, 18 for coal, 29 for non-conventional oil and 15 for non-conventional gas. We assumed the forecasts to be equally likely, and statistically combined the range of possible combinations to yield median and probabilistic values for total global fossil fuel production.
Sounds like how I’d do it. Figure 1 shows their estimate of future conventional and unconventional fossil fuel production.

Figure 1. ORIGINAL CAPTION: Fig.1. Mean value of expected future supply of global fossil fuel resources, based on peer-reviewed literature and on forecasts from the mainstream energy institutes. Note that the production of coal is treated as solely a conventional fossil fuel; while both oil and gas production have conventional and nonconventional components.
I found this graph most interesting. I see that I’ve been mentally overestimating the effect of unconventional oil and gas on the total amount of fossil fuels that will be available over the 21st century.
From this estimate of future production, they derived two estimates of the peak values in the 21st century. Using just conventional fossil fuels, they estimate a peak value for atmospheric CO2 in the 21st century of 550 ppmv. If you add in “unconventional” fossil fuels (fracked oil and gas) they get 610 ppmv.
Now that was interesting, but what was more interesting was that they compared their results to fourteen other supply-driven CO2 estimates that have been done since 2008. Here is that comparison.

Figure 2. ORIGINAL CAPTION: Fig. 5. Comparison of atmospheric CO2 concentration under SD [supply-driven] scenarios with those from a range of current literature that examines ‘supply-driven’ fossil fuel emission scenarios.
Seeing that, I digitized the peak values for each of those sixteen scenarios. This gives me a distribution of best estimates of how high the atmospheric CO2 levels will go in the 21st century.
Finally, I converted those peak CO2 values to the corresponding temperature change that would happen IF the current central climate paradigm is true. This paradigm is the claim that temperature varies as some constant “lambda” times the variation in forcing (downwelling radiation). I do not think this paradigm is an accurate description of reality, but that’s a separate question. Their constant “lambda” is also called the “equilibrium climate sensitivity” or ECS.
The value of the climate equilibrium sensitivity constant (ECS) is the subject of great debate and uncertainty. For years the IPCC gave a range of 3 ± 1.5 degrees C of warming per doubling of CO2. In the most recent IPCC report, things were even more uncertain, with no central value being given.
Now the ECS, the equilibrium climate sensitivity, refers to the eventual projected temperature change measured hundreds of years after an instantaneous doubling of CO2. There is also a constant for the response to a gradual increase in CO2. This is called the Transient Climate Response, or “TCR”. Here’s a definition from Implications for climate sensitivity from the response to individual forcings, by Kate Marvel, Gavin Schmidt, et al.:
Climate sensitivity to doubled CO2 is a widely-used metric of the large-scale response to external forcing. Climate models predict a wide range for two commonly used definitions: the transient climate response (TCR: the warming after 70 years of CO2 concentrations that rise at 1% per year), and the equilibrium climate sensitivity (ECS: the equilibrium temperature change following a doubling of CO2 concentrations).
If we want to see what temperature change we can theoretically expect during the 21st century from the possible atmospheric CO2 scenarios shown in Figure 2, obviously the value to use is the TCR. However … just like with the ECS, the TCR is also the subject of great debate and uncertainty.
In the paper by Marvel et al. I just quoted from, they purport to calculate the ECS and the TCR from three observational datasets. Using the traditional methods they find an average TCR of 1.3 °C per doubling of CO2 (ECS = 1.9 °C/2xCO2). Dissatisfied with that result, they then adjusted the outcome by saying that one watt per square metre of forcing from CO2 has a different effect on the temperature from that of one watt per square metre of solar forcing, and so on. Is their adjustment valid? No way to know.
You will not be surprised, however, when I tell you that after their adjustment things are Worse Than We Feared™, with the transient climate response (TCR) now re-estimated at 1.8 °C per doubling of CO2 (ECS increases to 3.1 °C/2xCO2). I have used both the low and the high TCR estimates in the following analysis.
Please note that I am using their paradigm (temperature follows forcing) and their values for TCR. Let me emphasize that I do not think that the central paradigm is how the climate works. I am simply following through on their own logic using their own data.
Figure 3 shows a “boxplot” of the sixteen different estimates of the peak 21st century atmospheric CO2 concentration. To the left of the boxplot are the values of the extremes, the quartiles, and the median of the 16 atmospheric CO2 estimates. To the right of the boxplot I show the various estimates of the temperature change from the present IF the “temperature slavishly follows forcing” climate paradigm is true. Finally, the blue dots show the actual estimates of peak 21st century CO2 values. They are “jittered”, meaning moved slightly left and right so that they don’t overlap and obscure each other.

Figure 3. Boxplot of sixteen estimates of peak CO2 values in the 21st century, along with projected warming from the present temperature. Green area shows the “inter-quartile range”, the area that contains half of the data.
Now, recall that we are looking at estimates of the peak values of CO2 during the century. As a result, the temperatures shown at the right of Figure 3 are the maximum projected temperature rises given those assumptions about the future availability of fossil fuels.
So what all of this says is as follows:
The highest possible projected temperature rise from fossil fuel burning over the rest of the 21st century is on the order of three-quarters of a degree C.
The mid-range projected temperature rise is on the order of half a degree C. If one were to bet based on these results, that would be the best bet.
The lowest possible projected temperature rise is on the order of one or two tenths of a degree C.
=============
Here’s the takeaway message. Using the most extreme of the 16 estimates of future CO2 levels along with the higher of the two TCR estimates, in other words looking at the worst case scenario, we are STILL not projected to reach one measly degree C of warming by the year 2100.
More to the point, the best bet given all the data we have is that there will only be a mere half a degree C of warming over the 21st century.
Can we call off the apocalypse now?
Here it is a sunny noontime after some days of rain. I am more than happy that it is warmer than yesterday. I’m going to go outside, take my shirt off, and charge my solar batteries.
Warmest regards,
w.
As Usual, I politely request that in your comments you QUOTE THE EXACT WORDS YOU ARE DISCUSSING, so we can all understand your exact subject.
Well, maybe you’re overestimating the amount of fossil fuel available, or they’re underestimating it. Personally I’d be inclined to believe the latter, nevertheless, this shows how futile any attempts to rein in fossil fuel use are even if you believe the AGW CO2 sensitivity bandied about. Don’t expect this paper to get any traction in the media or among the usual suspects though. Maybe someone should send a copy to Trump, he’ll need all the ammunition he can get to get the EPA under control.
Yep, sounds like another doomed peak-oil prediction.
Doomed? Conventional oil (API>10, reservoir porosity >5% and permeability >10 millidarcies) peaked in 2008 just as LaHerre of TOTAL and Defeyyes of Princton predicted. Do not confuse the transient US shale/OPEC kefuffle as postponing the ultimate peak in production of all crude oil by more than a very few years. You want estimates and reasons and illustrated specifics, see several of the energy essays in ebook Blowing Smoke.
Yes, and that’s when they opened up drilling in the Canada & the Dakotas for shale oil. Before you know it, production rose again. They’ve been predicting peak oil since the 1980s — yet, every time the price increases, the amount of oil that is economical to produce also increases.
Oil production did peak in 2008 … for a year. Since then, it has been growing at ~1.5% per year.
http://peakoilbarrel.com/wp-content/uploads/2015/05/A-World1.jpg
https://www.eia.gov/outlooks/steo/report/global_oil.cfm
lorcanbonda,
The initial predictions of Peak Oil were based on conventional oil. That is, oil accumulated in traps. Because of concerns that discoveries were not keeping pace with demands, the oil companies explored alternatives such as hydraulic fracturing It was fundamentally a technological breakthrough, not new conventional fields, that has allowed an increase in production. That isn’t as likely to happen with coal. But, yes, increased prices provided an incentive to find ways to tap unconventional oil and gas. If the problem(s) of thermonuclear fusion should be solved any time soon, the economics would relegate that newly available fossil fuels to lubricants and plastics.
For what it’s worth, the world’s crude and condensate production peaked in 2015. We know 2016 average was lower than 2015, and 2017 should not exceed the 2015 level. Prices are higher, so it’s reasonable to think 2018 production will rebound to 2015 levels. The oil price has to increase to drive activity so we can offset natural decline, which means prices will rise gradually and will eventually reach $100 per barrel. It’s hard to figure out how the market will evolve, but it’s very unlikely world crude oil and condensate production will ever exceed 100 mmbopd. The IPCC “business as usual” case estimates a peak at over 160 million BOPD (but they don’t say what type of liquid is included in that figure). It sure looks like this number is impossible to reach.
Fernando writes
This is because demand dropped in China and India due to their economic setbacks. Since then, the price of fuel dropped and the demand is growing again. It will exceed the 2015 level.
Clyde writes
Yes, technology and price considerations are the prime reasons for increases in oil reserves. That being said, I don’t believe thermonuclear fusion will be an adequate automotive fuel anytime soon.
A frequent mistake is to assume oil production represents available supply – it does not – it represents demand.
Further future estimates are based on exploration and there is little point in exploring beyond a 20-30 year horizon. That is why we have a long history of predictions of running out of oil in 10-20 years.
And demand depends on fossil fuel price, especially compared to other energy sources. And higher prices drive increased efficiencies and thus lowered demand.
It is a complex cycle, making it difficult to predict future characteristics.
Demand can be altered slightly by storage. Right now storage is way above average. We have also seen an intense price and market share war between the Saudis, Iranians, and Russians. This led them to pump as hard as they could over the last 2-3 years (with Iran coming off sanctions).
We no longer put too much stock on exploration results because the industry isn’t finding much new oil. Exploration for oil is going the way of whaling and candle stick making.
http://www.usatoday.com/story/money/nation-now/2016/11/17/usgs-largest-oil-deposit-ever-found-us-discovered-texas/94013292/
For the United States, the EIA estimated that we have 198 billion barrels of undiscovered oil — most of that in Alaska, the Atlantic coastal shelf, and the Bakken formation in the Northwest.
http://instituteforenergyresearch.org/studies/new-oil-finds-around-the-globe-will-the-u-s-capitalize-on-its-oil-resources/
(Note: this is not a new find, but it is not listed in the world’s proven oil reserves.)
Israel has 14 million barrels of proven oil reserves listed.
Much of the world’s “unproven” reserves are in oil sands like Canada and Texas. These are controverial, but China is building wells for them like they want to own it all.
Lorcabonda: all those figures you quote are baloney. If you read through the comments you will see I already discussed quite a few of them.
Jim: future estimates are no longer based on exploration results, because exploration isn’t finding much oil. This makes it easier to project forward.
Since I was on the periphery of the issue of “peak oil” in he early 1990’s, forgive me if this question is way off base. Was not tax law and oil depletion allowance based “reserves” the basis for much of the estimates and hyperbole of “peak oil”? At a conference in ~1991 I remember having a beer with a couple of mid level retiring bureaucrats from both DOE and EPA–they both said their bosses joint presentation was a bunch of S$$t. There was no discussion of production sensitivity to price and demand, nor then known technological advancement nor exploration/discovery sensitivity to future supply/demand analysis.
Am I on track….or have the faulty memory of an old fa#t.
I found the paper online (perhaps in a pre-publication version – I don’t know), and I downloaded it to my box, where you can see it in full here:
https://www.dropbox.com/s/w0jj4eyy1jckc2x/The%20implications%20of%20fossil%20fuel%20supply%20constraints%20on%20climate%20change%20projections%20A%20supplyside%20analysis.pdf?dl=0
I’m inclined to believe that higher fossil fuel use projections are more convenient to use in models which already overestimate the warming response to CO2. It’s erring on the side of caution (and cause).
We could also over estimate your age by 70 %. If you are 40 you pay premiums as if you were 68 years old. That would give society a nice cushion just in case you need a full body transplant.
All of these studies are based on proven reserves which is based on verifying that the oil is there and that there is technology available to extract it. This is then compared projected demand to to develop a full supply model. Oil companies deliberately reduce supply if they feel future demand is not sufficient for the number of wells and new fields being brought online. The “unproven” reserves are much larger than shown in these graphs. As the price of oil declines so does the investment in new extraction technology. As the price of oil goes up then so does the investment in new technology. Deep sea and Siberian oil needs around $90 a barrel to break even. The Utah and other western oil reserves need to be heated to extract, and the technology to do this is not yet viable, just as fracking kit was not viable 30 to 40 years ago. Tfrithere is about another 300 to 400 years of oil in these western fields just waiting for the technology to mature and become viable.
The Figure 1 graph shows fossil fuel supply peaking around 20 years from now at about 17% above what it is now in carbon , including unconventional oil and gas. If coal becomes a smaller percentage of the mix and gas becomes a larger percentage of the mix, then energy supply will increase a little more than 18% because gas has less carbon and coal has more carbon per amount of energy. Meanwhile, I see global demand increasing a lot more than 18% during the next 20 years, and that will support prices high enough to bring a lot of oil and gas out of the woodwork. I think CO2 will peak at some level higher than 650 PPMV, probably 700 maybe 750 PPMV. I think this means an additional .15-.4 degree C.
Tim, that’s well reasoned. I can see 700 ppm as a possible upside. But I’m having a little difficulty envisioning where we can get lots of oil “out of the woodwork”.
And I’m worried because gas doesn’t move very well across long distances. This means a pending gas shortage in say the UK will require foresight and construction of gas import infrastructure. I see something similar in Pakistan, where gas production capacity is dropping so fast, and they aren’t trying to replace it in a meaningful fashion. I guess in the future they’ll have to use Australian coal.
Your comment reminded me of something that happened on KCBS TV on the 6 PM newscast back in 1982. There was a big parade in Manhattan New York City. Spectators were watching the parade from the top of a scaffolding that covered the sidewalk at a construction site. The weight of all those people caused the scaffolding to collapse. Several people were injured. The TV station sent a reporter and cameraman to scene for a live report on the incident during the newscast. After the news story, the reporter on the scene said, “Either a worker sold the people permission to be on the scaffolding or they simply took it on themselves to climb up there.” The news anchor at the studio then offered, ” I think it was the latter.” The reporter on the scene then replied, “I have looked around and I don’t see the ladder anywhere.” The anchor then tossed up his hands went on the next story but lots of laughter could be heard from the studio crew. Latter, Ladder….never mind.
700ppm would be great aiming point for a start..
Pity there is not much chance of reaching 1000ppm. 🙁
More CO2= More Plants
More Plants = More O2
More O2 = the next scare – the atmosphere will catch fire and we’ll all die!!!!
The more fossil fuels burned the more O2 removed, the increase in plant growth does not produce enough O2 to compensate, so O2 concentration goes down.
Has anyone yet raised the point that, the more CO2 there is, the less any additional adds to its effect? The greatest greenhouse effect would be in raising CO2 from 0 to 200 parts per whatever; beyond that, the rate of increase slows according to a logarithmic formula. So, the more CO2 climbs into the atmosphere, the less effective that increase is in hiking the temperature; by now, it is quite negligible, I would think.
“Climate projections calculated in this paper indicate that the future atmospheric CO2 concentration will not exceed 610 ppm in this century;”
Yup. That’s unfortunate. 1000ppm would be awesome for agricultural production and worldwide de-desertification:
http://www.ncpa.org/images/1484.gif
Yes, 1000ppm CO2 (1 part CO2 per 1000) would have no negative impact on human health, and arguably zero or near zero impact on temperature, and here’s another graphic showing the immense benefit of higher CO2:
http://www.co2science.org/education/experiments/student_exp/mckemy/figures/fig21.jpg
Increase emissions!!
On it. Beans, beans, the magical fruit …
Not that what CO2 allegedly does even matters.
References:
Trenberth et al 2011jcli24 Figure 10
This popular balance graphic and assorted variations are based on a power flux, W/m^2. A W is not energy, but energy over time, i.e. 3.4 Btu/eng h or 3.6 kJ/SI h. The 342 W/m^2 ISR is determined by spreading the average 1,368 W/m^2 solar irradiance/constant over the spherical ToA surface area. (1,368/4 =342) There is no consideration of the elliptical orbit (perihelion = 1,416 W/m^2 to aphelion = 1,323 W/m^2) or day or night or seasons or tropospheric thickness or energy diffusion due to oblique incidence, etc. This popular balance models the earth as a ball suspended in a hot fluid with heat/energy/power entering evenly over the entire ToA spherical surface. This is not even close to how the real earth energy balance works. Everybody uses it. Everybody should know better.
An example of a real heat balance based on Btu/h follows. Basically (Incoming Solar Radiation spread over the earth’s cross sectional area) = (U*A*dT et. al. leaving the lit side perpendicular to the spherical surface ToA) + (U*A*dT et. al. leaving the dark side perpendicular to spherical surface area ToA) The atmosphere is just a simple HVAC/heat flow/balance/insulation problem.
http://earthobservatory.nasa.gov/IOTD/view.php?id=7373
“Technically, there is no absolute dividing line between the Earth’s atmosphere and space, but for scientists studying the balance of incoming and outgoing energy on the Earth, it is conceptually useful to think of the altitude at about 100 kilometers above the Earth as the “top of the atmosphere.”
The top of the atmosphere is the bottom line of Earth’s energy budget, the Grand Central Station of radiation. It is the place where solar energy (mostly visible light) enters the Earth system and where both reflected light and invisible, thermal radiation from the Sun-warmed Earth exit. The balance between incoming and outgoing energy at the top of the atmosphere determines the Earth’s average temperature. The ability of greenhouses gases to change the balance by reducing how much thermal energy exits is what global warming is all about.”
ToA is 100 km or 62 miles. It is 68 miles between Denver and Colorado Springs. That’s not just thin, that’s ludicrous thin.
The GHE/GHG loop as shown on Trenberth Figure 10 is made up of three main components: upwelling of 396 W/m^2 which has two sub parts: 63 W/m^2 LWIR and 333 W/m^2 and downwelling of 333 W/m^2.
The 396 W/m^2 is calculated by inserting 16 C or 279K in the S-B BB equation, a calculation that does not actually exist in the real world. The result is 55 W/m^2 of power flux more than ISR entering ToA, an obvious violation of conservation of energy, i.e. created out of nothing. That should have been a warning.
ISR of 341 W/m^2 enter ToA, 102 W/m^2 are reflected by the albedo, leaving a net 239 W/m^2 entering ToA. 78 W/m^2 are absorbed by the atmosphere leaving 161 W/m^2 for the surface. To maintain the overall energy balance and a steady temperature (not really a requirement) 160 W/m^2 rises from the surface (0.9 residual in ground) as 17 W/m^2 convection, 80 W/m^2 latent and 63 W/m^2 LWIR (S-B BB 183 K, -90 C or emissivity = .16) = 160 W/m^2. All of the graphic’s power fluxes are now present and accounted for. The remaining and loop 333 W/m^2 are the spontaneous creation of an inappropriate application of the S-B BB equation violating conservation of energy.
But let’s press on.
The 333 W/m^2 upwelling/downwelling constitutes a 100% efficient perpetual energy loop violating thermodynamics. There is no net energy left at the surface to warm the earth and there is no net energy left in the troposphere to impact radiative balance at ToA.
The 333 W/m^2, 97% of ISR, upwells into the troposphere where it is allegedly absorbed/trapped/blocked by a miniscule 0.04% of the atmosphere. That’s a significant heat load for such a tiny share of atmospheric molecules and they should all be hotter than two dollar pistols.
Except they aren’t.
The troposphere is cold, -40 C at 30,000 ft, 9 km, < -60 C at ToA. Depending on how one models the troposphere, an evenly distributed average or weighted by layers from surface to ToA, the S-B BB equation for the tropospheric temperatures ranges from 150 to 250 W/m^2, a considerable, 45% to 75% of, less than 333.
(99% of the atmosphere is below 32 km where energy moves by convection/conduction/latent/radiation & where ideal S-B does not apply. Above 32 km the low molecular density does not allow for convection/conduction/latent and energy moves by S-B ideal radiation et. al.)
But wait!
The GHGs reradiate in all directions not just back to the surface. Say a statistical 33% makes it back to the surface that means 50 to 80 W/m^2. An even longer way away from the 333, 15% to 24% of.
But wait!
Because the troposphere is not ideal the S-B equation must consider emissivity. Nasif Nahle suggests CO2 emissivity could be around 0.1 or 5 to 8 W/m^2 re-radiated back to the surface. Light years from 333, 1.5% to 2.4% of.
But wait!
All of the above really doesn’t even matter since there is no net connection or influence between the 333 W/m^2 thermodynamically impossible loop and the radiative balance at 100 km ToA. Just erase this loop from the graphic and nothing else about the balance changes.
BTW 7 of the 8 reanalyzed (i.e. water board the data until it gives up the “right” answer) data sets/models show more power flux leaving OLR than entering ASR ToA or atmospheric cooling. Obviously those seven data sets/models have it completely wrong because there can’t possibly be any flaw in the GHE theory.
The GHE greenhouse analogy/theory not only doesn’t apply to the atmosphere, it doesn’t even apply to warming a real greenhouse. (“The Discovery of Global Warming” Spencer Weart) In a real greenhouse the physical barrier of walls, glass, plastic trap the convective heat, not some kind of handwavium glassy, transparent, radiative thermal diode.
The surface of the earth is warm for the same reason a heated house is warm in the winter: Q = U * A * dT, the energy flow/heat resisting blanket of the insulated walls. Same for the atmospheric blanket. A blanket works by Q = U * A * dT, not S-B BB. The composite thermal conductivity of that paper-thin atmosphere, conduction, convection, latent, LWIR, resists the flow of energy, i.e. heat, from surface to ToA and to make that energy flow (heat) requires a temperature differential, 213 K ToA and 288 K surface = 75 C. The atmosphere is just a basic HVAC system boundary analysis.
Open for rebuttal. If you can explain how this upwelling/downwelling/”back” radiation actually really works be certain to copy Jennifer Marohasy as she has posted a challenge for such an explanation.
+100!!
Nickolas, the IPCC has known this for at least 15 years. It’s good that someone else has the same view…. +1. In the IPCC models they used an electronics formula, bode, which is a feedback formula. The problem with it is that it requires additional energy. Seriously, if global warming worked the way they said it should, it would be a the first system that we know of that would have been over unity.
They set a time limit on when all the catastrophic events to occur so that they could seize power. They set their hopes on hoaxahagen. They were disappointed that the world dissolved into bickering. Of course the snow ( which it wasn’t suppose to do anymore) and cold was a direct contradiction. It was a mess. Somebody should have turned off the heat, like they did in Washington DC a few years earlier at a hearing where they turned off the air conditioning.
An electronic circuit does not necessarily have its energy requirement increase by connecting a positive feedback loop. The energy limitation for positive feedback in the climate system merely limits its presence to a limited temperature range. Once the world gets warm enough to rid it of variable snow and ice cover (or cold enough to be snowballed), it loses the surface albedo positive feedback. Notably, the climate has been more unstable during Pleistocene ice age glaciations when more of the world was covered by variable snow and ice cover where there was a lot of insolation, and more stable during warmer times of the interglacials.
The Bode does. That’s the formula used in the models. It requires additional energy. Currently, ( 1- a) is about 0.30. There isn’t a lot of downside for albedo.
In any event, if what I’m saying about the carbon cycle is correct and there is an underlying warming trend, and the loss of the albedo can be traced back to further warming, it rules out AGW altogether. ( co2 follows temperature is my position ).
The layer of greenhouse gases actually radiates more longwave IR downward than upward because its effective lower surface is warmer than its effective upper surface.
Since it violates Thermodynamics it is nothing more than intellectual masturbation.
So, there is a peak oil coming in 2020 after all…..
The authors of the article under review seem to be saying the peak will occur in 2040.
Don’t forget some refer to peak oil, others to peak fossil fuels, others to peak emissions from fossil fuels. They are different terms, don’t happen at the same time.
“It’s difficult to make predictions, especially about the future” (Yogi Berra). Remember the first peak oil predictions were made in the late 19th century, and later during the Great War, it was predicted by 1921 – or earlier (David White, chief geologist, United States Geological Survey (1919)). After that, the prophets just moved it out about 15-20 years (Marion King Hubbert, American geologist and geophysicist). They’re all dead, so, not too embarrassed that a century later, we’re still confidently predicting peak oil. And those guys were smarter than the current lot of Paul Ehrlich disciples.
I’m not a Paul Ehrlich disciple, and I wasn’t predicting peak oil 40 years ago. I’m a petroleum engineer, with over 40 years experience, so I come at this from a different angle: over the last two decades the industry has been investing in ever more difficult and expensive fields, and this means we demand more inputs, and have to sell at higher prices. This implies we will reach a plateau (call it a peak if it makes you feel better) and then decline as other energy sources take over.
On the other hand, those who laugh at this idea simply lack any arguments, other than “it’s a Paul Ehrlich thing”. Get real, get down to brass tacks. So tell us, where exactly do you think we will be finding new oil fields 20 years from now? Any ideas?
Peak in green line is more like 2030. Probably why the Chinese offered to “try” to peak their CO2 emissions by that date. It was going to happen anyway.
Yep. The Chinese offered nothing meaningful. Their coal use may be cut because they build dirty coal plants and their air is filthy.
Dirty coal plants in China? New coal fired power plants can only improve things.
Sure, they have filthy air: every factory, hotel, farm etc has/had its own furnace and a pile of wet, low quality, dirty coal outside.
The Chinese are building (they were overshooting demand, a lot have been cancelled) state of the art supercritical coal fired power plants.
With a net efficiency of 46%, these are far more advanced than anything in Australia, (where the net efficiency of coal plants is about 33%) and these are primarily replacing millions of small individual furnaces and boilers across vast areas… only god knows what their efficiency was.
http://www.power-technology.com/features/featurelean-and-clean-why-modern-coal-fired-power-plants-are-better-by-design-4892873/
We are below the 2015 oil peak, but it looks like production may start rising again as prices rise (they’ll eventually go over twice-triple current levels). BP projects peak between 2025 to 2040 for oil. But gas and coal should reach peak later. I can’t remember my estimated range, but I think I pegged the overall fossil fuels peak in the 2040-60 range (this includes coal).
From a technical/economic point of view the “shales” are overhyped. The individual oil well recovery is fairly slim, there are problems producing them at low rate, and so on. The gas wells are doing much much better.
Heavy oil is a mixed bag. Venezuela’s reserves are being destroyed by pdvsa because they use a really bad development scheme. And there’s no really large heavy oil reserve other than Canada, Venezuela, and the Middle East.
Deep water discoveries are getting really scarce, the Gulf of Mexico Eocene (the so called Wilcox) is relatively poor as far as I can see.
We have good targets in Russia, but those will require much higher prices, and Russia is pumping over 10 mmbopd. So I wouldn’t expect them to go much higher. New discoveries may help them slow down future declines.
Anyway, for those of us who look at this closely the writing on the wall is clear. And it does get tiring to read the typical cornucopian arguments.
Fernando, agree. Wrote the biggest part of Gaia’s Limits on this, then revisited with several specific essays with updated/new information in Blowing Smoke. Studied it since late 2009, since one of the sequelae is the future of hybrid and electric vehicles, where I have a direct personal interest via my energy storage materials invention/business. Hybrids will become desireable then necessary to combat transportation fuel scarcity/cost. And future hybrid battery packs will themselves become hybrids of LIB and supercaps linked by the requisite Dc/Dc voltage converter to prevent the battery side from clamping the cap side discharge. The alternative may be Fiskers hybrid LIC device, butbtyempatent application has not yet published to know more. My speculations on it given in a recent guest post at Climate Etc accessible by searching Fiskers there.
Do these studies include the potential output from the Green River Formation?
http://canaryusa.com/oil-production-in-colorado-skyrockets-thanks-to-fracking/
It’s great to see your name, Fernando! I miss reading your always interesting posts. Even if they are tinged with end-of-oil, lol. I hope things are doing well for you. I thought of you when Satan finally found a place in hell hot enough for Fidel, and how relieved you and so many others would be.
SN, do you know that the Green River ‘oil shale’ formation has no oil since it never entered the oil catagenesis window? It is a kerogen shale. And takes 3-5 barrels of water per barrel of syncrude to produce at most 40 percent of OIP in the best case. All that water comes from the Colorado Compact (Green River is a major tributary) whichnis already short for Las Vegas, LA, and Phoenix. You want Green River syncrude, then wipe out completely the water demands of Vegas, LA, and Phoenix. Good luck.
You would benefit from reading the energy essays in ebook Blowing Smoke. Much you could learn.
Stuart, this is from your link:
“Producing oil from oil shale has been done in one of two ways: a.) The oil shale is brought to the surface and cooked; or b.) An electric heater is placed deep beneath the surface at the base of the rocks to heat the shale, convert it into liquid oil and gas, and then bring it to the surface.
Unfortunately, neither method has proven economically viable to this point. In recent years, both Shell and Chevron have abandoned their respective oil shale efforts in Colorado, after investing tens of millions of dollars into finding profitable extraction methods. And so, for now, the alluring deposits of oil in this fine-grained sedimentary rock in the Green River – that could put an end to America’s dependence on foreign oil – remains out of reach.”
In other words, we can’t figure out how to get it out of the ground and sell it at an acceptable price.
Wang et al say
“The results of this analysis is that the mean forecast indicates that the global production
of conventional fossil fuels will peak in 2028, at 11.42 Gtoe/yr”
11 years away.
Nick Stokes: leave it to some shirt-front slobbering statistics failure to believe the insane likes of what you write.
Strategic RD&D need for sustainable transport fuels/energy.
Prof. Cutler Cleveland shows that it typically takes a generation (40 to 60 years) to transition from one major energy source to the next. e.g. from wood to coal, and then from coal to oil.
I see an average of 116 models revealing an average peaking of fossil fuels in about 16 years at about 2032. That is dire news indeed.
That indicates that we need to research, develop and deploy sustainable energy and especially transport fuel by about 2025 to cost effectively supply the gap between the rate of growth in the world’s demand for transport and electricity. Then by 2030 the rate of growth needs to increase to accommodate declining conventional and unconventional fossil fuels.
Climate alarm is an insignificant side issue by comparison.
(i.e. Most retirees want to move From Maine and Michigan to Florida, Texas and Arizona – AND to Mexico and Panama – NOT from the equator to the Canada!)
All hands on deck to develop the energy and fuel needed to keep civilization afloat!
DH. Yes. There are two bright tech hopes for you to research. First is Siluria Technologies catalytic OCM and ETL. If viable at industrial scale, then efficiently converts ‘abundant ‘ shale gas to liquid fuels. Second is Fisker Nanotech LIC speculation. See my recent guest post at Climate Etc on that EV speculation. Else liquid transportation fuels look a big future problem.
Could this be the solution: http://www.h2-fuel.nl/en
Marinus Drop the cost an order of magnitude and it would be an interesting start. http://www.h2-fuel.nl/en/h2fuel_pdf/production-and-pricing/ First priority and primary driver is to develop sustainable / renewable energy cheaper than gas and coal sufficiently to justify H2O+CO2 to hydrocarbon fuel delivered comparable or cheaper than ethanol / gasoline/ diesel. The rest is ‘easy’.
More likely around 2025. All crude oil, conventional and unconventional. Conventional already peaked in 2008. Best estimate 2014 was 2023-2025, but the China demand slow,down pushes things out a bit. Not a cliff event because the correct distribution finctionis not Hubbert’s lambda but rather a gamma (long scewed decline side tail).
“Peak Oil” in the end is a political and economic decision. The Green River Formation alone contains from 500 billion to 7 trillion barrels of oil as kerogen. At $40/barrel Royal Dutch Shell thought they could make money. At $140/barrel the economically practical yield is much above a trillion barrels.
Drill here, drill now, pay less will be true for decades yet. Cheap oil will be done in a few decades which likely means “peak oil” based on cost, not ultimate availability. Proven reserves keep growing. They only stagnate based on economics of resource recovery.
JH, Green River contains no oil whatsoever. You have been conned. It is the world’s largest kerogen shale that never reached the catagenesis window for ‘cooking’ kerogen into oil or (higher temps) gas. Whether in situ freeze wall or mined/retorted, a barrel of syncrude cannot be more than about 40% of the kerogen resource in place, and requires 3-5 barrels of water per barrel of syncrude. Fully depopulate Vegas. LA, and Phoenix permanently and you might get 3.5mbpd. WhynReagan defunded any federal Green River research. WATER. The US consumes about 19.5mbpd, the world at present about 93mbpd. Good luck with that Green River nonsense. Wrote it up explicitly in essay Much Ado About Nothing, highlighting it plus several other supposed ‘fossil fuel’ reserve misunderstandings. Devil is in details, period.
It doesn’t work like that. That stuff requires so much energy and water it’s cheaper to build nuclear reactors and use the electricity.
But out of an abundance of caution we must suspend debate, suspend standard of living, suspend science process, suspend error checking along the way, and suspend rights. Welcome to the State of New York.
Nice job. I estimated 623 peak ppm, back in 2014. I wrote it in a quickie blog post to see if I got a reaction, but I don’t think I got enough readers to make a dent in the orthodox on both sides. (Burn baby burn (CO2 Atmospheric Concentration from Fossil Fuels)).
But I can see a few glitches in that work, so I’ve been trying to improve upon it. My conclusion is that we have to get into three issues: 1. How fast do replacement technologies evolve so they keep energy prices lower and gradually choke down the fossil fuel industry? 2. What does the carbon cycle do as CO2 concentration increases? And 3- what will happen on the political side?
My conclusion is we could see it go as high as 650 to 700 ppm if technology doesn’t evolve. After that we will see serious population pressures, starvation, and wars, because of lack of energy cheap enough to be purchased by poor overpopulated nations (say Egypt, Pakistan, Indonesia, etc). .
I’ve been writing about this topic because it’s clear the social cost of carbon estimates simply fail to grasp the possibility that the market takes care of the problem. Although it’s clear the world has to move towards resilience as suggested by Lomborg, it’s not clear that we should put much effort into changing the climate. A safety calve such as geoengineering ought to get research funds. And we do need to get cracking on new nuclear plant pilots and a slow building schedule which can be sped up if needed.
This is more or less in alignment with my calculations, based on the geology. For carbon dioxide and climate change to increase to scary levels, we’d need an infinite supply of fossil fuels. That does not exist.
Realistically, we are probably already near-ish the peak for demand. More electric cars, more solar cells, more wind, more nuclear. It will take time, a long time, for hydrocarbon powered vehicles and power plants to completely disappear, given a 10-30 year life cycle, but right now, all the growth in fossil fuel usage is in the developing world. In advanced economies, demand is falling, and is unlikely to ever be revived.
Progressives love to say even Donald Trump can’t stop renewables. Why would he want to? Just let things go the way they are going already. No mandates or support from him are really necessary – it will all inevitably work out due to supply limitations anyway. Give or take a decade or two.
be aware that almost no oil is used in electricity production. Gas, yes. Coal, yes. Oil? almost exclusively for transport use. Can’t be directly replaced by either ‘renewables’ or nuclear.
Leo, I guess the market will induce higher efficiency and a gradual change to other options. I notice there’s a tendency for comments to focus on USA conditions. But this problem will impact poor countries much earlier. So when you think about future conditions, use Mexico, Haiti, Egypt, Nigeria, Pakistan and Samoa to understand how bad it could get.
Fernando, the world will be a better place with 650ppm than at 400, and better at 1000ppm than at 650. Plants will grow, more people will be fed. And absolutely NO government funding for geo-engineering research, which, as there is no way to scientifically test anything in advance, would just be creating another instance of rent-seeking, corrupt, alarmist science-like pimping that we see now in the climate “community.” Why would we want to subsidize such activities again?
Sorry, but I’m not into dogma and nearly religious rejection of research, and I think geoengineering does deserve funding. I guess it helps that I’m not inclined to support any political parties, prefer to sit on the fence, happen to be difficult to brainwash, and I’m a pretty good nerd who loves to look at data.
What makes anyone think we will be using fossil fuels in a century. I feel Thorium or Fusion will be the main sources. With improved solar being used along with high efficacy LED lighting. To assume we will be doing what we do now 100 years into the future is ludicrous. When did anyone last use a rotary phone
You have just made several assumptions. However, if you think of “fossil fuel” as a source of carbon based compounds and not as fuel, then the future use seems assured.
Thorium and Fusion may be useful and in great supply — built out — someday. I won’t see that, but if you are under 30, you might.
And why do you think folks will be using high efficacy LED lighting in 2117?
When I was young we picked up a big black thing and asked an operator to connect your line with another line. Sometimes she would greet me by name and connect me to a friend — by name. Sometimes, I had to run next door and ask the lady there to hang up her phone so we could use ours. She and half-a-dozen others could pick-up and listen. We’ve made a little progress in over half-a-century but even now I can’t talk on a phone and think it is a private conversation. Less so, in fact.
Fernando Leanme January 24, 2017 at 1:52 pm
Agreed …
w.
Thanks, Willis.
With luck, you and I will be around for another 20 years to watch this — but beyond then, I don’t expect that, even if around, I will care.
It is comforting to know that whatever kills me, it won’t be too much CO₂ that does it.
I note from the figure (#1) that carbon-based fuel appears to go on well past 2100.
they represent our best estimate of what will be physically possible
IMHO This is may be an overstatement
The Power River Basin in Wyoming has more then 110 billion tons of recoverable coal.
Using an economically recoverable measure drops that down to about 23 billion tons.
The US has a total recoverable reserve base of about 250 billion tons.
‘Peak Coal’ production occurred in the US in 2009 at about 1.4 billion tons and has since declined to about 1.1 billion tons.
harrywr2 January 24, 2017 at 1:59 pm
Thanks, Harry. According to the section I quoted in the head post, they looked at 18 different forecasts for the future extraction curve for coal … what more would you expect them to do? If you have different or better info than the 18, now would be the time to break it out.
w.
When we look at peak fossil fuels we do it on a world wide basis. As it turns out the USA is the Saudi Arabia of coal. So future projections include large volumes of coal exports. The Powder River basin is prolific, and the definition of reserve of course depends on price. Thus, as I pointed out, the evolution of alternative energy resources does have to be such that prices don’t go through the roof. And thus we find ourselves in a guessing game.
Looking forward to less junk science as the funding pipeline runs dry. If you watch Trump sign orders and hold meetings he talks about slashing regulations in almost every setting. The best is yet to come.
Slashing regulations in the USA won’t make much difference. The drill baby drill crowd never seems to grasp most of the remaining lower 48 oil and gas is under private ownership. The USA could do better working to help the world bank finance high efficiency clean coal plants in third world nations (focus on high efficiency and clean). Future odds are such that trump will likely be replaced by an Obamite. This means radical measures are going to get rolled back unless they are really sound.
It depends, of course, whether he is successful in creating jobs.
If his policies work and jobs and pay increase in the rust belt states etc, he will not be losing support from those who voted from him in November, and he will inevitably pick up some further votes from those that were on the fence voters. Will this be sufficient? Well much may depend upon whether the Democrats can find a really good candidate, and it may also depend upon how populist movements in Europe perform. Technocratic government may be falling out of favour, so I would not (at this early stage) bet on some unknown Obamite coming into office next time round.
I am all for high efficiency coal plants being run out in the developing world and there is plenty of coal to make these a viable option for the foreseeable future.
Coal will run out in due course as well. It will be a matter of cost, many countries will be too poor to afford it.
Regarding USA politics, it sure seems a bit naive to think that it’s going to be “Trumpism forever”. Don’t forget the guy won mostly because Hillary was a lousy candidate, and as it is, she did win the popular vote. Unless Trump changes his behavior, he’s unlikely to be reelected.
All the reports I’ve ever seen say that the effects of one degree of warming are almost wholly beneficial.
“Apocalypse Cancelled”
Well, I wonder if folks are happy with other aspects of this good news from these business school folk. The paper is here.
Their key proposition is:
“Based on the sources described above, we conclude that a very likely pathway for the total production of all fossil fuel resources in future is to keep increasing in next two decades to reach a maximum at 12.40 Gtoe/yr, and then to decline. “
So it looks like it won’t be the greenies telling us we can’t burn it. It isn’t there (so they say).
Same garbage the Malthusian doomsayers have shoveled since 1970.
Fossil fuels are essentially unlimited.
Actually since the first half of the 20th century.
Since the 1880s, per Wikipedia (https://en.wikipedia.org/wiki/Predicting_the_timing_of_peak_oil). The number of experts since then go on forever, many not even mentioned in this article. The early 70’s had them predicting from every corner.
Mr Maximus, you won’t like the link above. They don’t buy your theory of unlimited oil. I do, but frankly, I still think in time a nuclear version will become cheaper. And that might be good. Then again, our world thrives on CO2, so maybe not.
GM,
If you had said sand or silicon, I’d have no quibble. However, it is the nature of most things that have to be concentrated in the crust to be useful, to be finite and therefore limited. Just because you say something doesn’t make it so.
I wish fossil fuels were essentially unlimited. in reality they are scarce and increasingly expensive – especially in EROEI terms
I didn’t say that oil was necessarily unlimited, but coal, oil and gas together are.
It’s not just my saying so. In coal alone, we have hundreds of years of supply, which can be converted to gas and oil.
Hydrocarbons are essentially unlimited because by the time we might theoretically start to run short of them under the economic recovery technologies of the year 2525, other energy technologies will likely have arisen, to include fusion and who knows what else.
Besides, not just earth but the universe abounds in hydrocarbons.
This planet doesn’t have unlimited resources of fossil fuels. Nor is the future ability to produce such fossil fuels solely based on their existence. I assume there’s general agreement that we in the oil and gas business are seeing increasing costs over time on a world wide basis. This increasing cost trend, over and beyond general inflation, means other energy options can begin to compete. As these newer technologies become more competitive we see depressed demand for fossil fuels. Eventually the competitive pressures are such that production reaches a peak. Models indicate the peak will be within a plateau with oscillations.
As I wrote elsewhere, we are in a crude oil and condensate production plateau with small oscillations at this point in time. Oil prices are recovering, and it’s possible that we will increase production by tiny amounts over the next 20 years, I think it’s extremely difficult to have crude oil and condensate (the stuff we refine) climb over say 90 mmbopd (I change my mind over this figure all the time). And the key point is that the current information confirms RCP8.5 has way too much oil production, way more than anybody in their right mind thinks is feasible.
Gas will eventually follow oil, and then coal will also begin to run out. And the world doesn’t have hundreds of years’ worth. I’ve never seen a professional argue that, at current rates, with very small growth, we can avoid reach peak fossil fuels within decades. I realize some think the leak is closer, I tend to think it’s a bit farther away, mostly because I don’t see renewables and nuclear beating fossil fuels in the current state of technology and cost environments.
By the way, did you notice that emissions are barely growing?
@ Fernando Leanme,
Very much, the Alarmists hate it, They keep crying “We have to Do More”, then I point out US, EU, Japanese and Russian are both down and on a pronounced downward trend and only China and India have upward CO2 emissions trends. Seems like I saw the Chinese had cancelled construction on 100 coal fired power plants, not too long ago as well. If this keeps up for much longer, the Alarmists will have to find a new apocalypse to whine about!
Whatever the cause, it shows a weakness in the “business as usual” emissions forecasts.
How very Ehrlichian. That boy has cried “wolf” too many times to count.
And if Wang et al are right, we’ll need all those windmills anyway.
That’s right, I see electric aircraft powered by enormous wind turbines up front charging onboard batteries at the same time providing the forward thrust.
However it’s an idea that probably won’t get off the ground.
Oh-oh, I see the idea has already been patented:
https://www.google.com/patents/US1245902
Nick
Please don’t tell me that you finally have excepted that there is no C in AGW?
These chaps seem to be saying there isn’t much fossil C on Earth. I’m doubtful, but if true, it alleviates AGW prospects. It gives a different but equally pressing reason for developing alternative energy sources.
Nick @ 4:34
“equally pressing”
Not sure this makes sense. What is pressing? Is it to remake the world as fast as possible in the manner the UN wants to see, and (apparently) the now ex-president was interested in? Or is it to force the world toward wind and solar electricity? Why those two? Does “pressing” mean there is 10 years or 100? Or 200? Not pressing” then, is it? Are there pressing physical reasons, or pressing social-justice reasons?
Perhaps you could write an essay for WUWT explaining your understanding of what’s happening with regards to these issues, and what should be done. I have a great interest in “opportunity cost” — in case you care to comment on other pressing issues.
John,
“Does “pressing” mean there is 10 years”
According to these writers, peak fossil fuel is in 20 years. Assuming energy use keeps increasing, that means that even before that 20 years, there has to be a substantial alternative source.
The planning needed to meet 20 year peak fossil and to meet AGW requirements are actually pretty similar. And citing a UN bogeyman won’t help.
Nick,
“The planning needed to meet 20 year peak fossil and to meet AGW requirements are actually pretty similar.”
What AGW requirements are you talking about?
“And citing a UN bogeyman won’t help.”
Oh . . then, what AGW requirements are you talking about?
Look, it’s really obvious that most people around here don’t believe in your rubbery climate crisis, so they don’t believe there are any “AGW requirements” beyond what something like the UN agreement might entail . . Of course that’s the relevant “bogeyman” to us . . You don’t think we worry about what a handful of climate scientists might “require” of us, do you?
; )
Nick
Whether they are right or not try saying this with me “There is no C in AGW” you know its true and you have for a long time you just won’t say it, try to though it will set your soul free.
GM, present data. Better, refute the illustrated data presented in ebooks Gaia’s Limits and Blowing Smoke, all with google references and footnotes. Good luck.
I was especially amused by the line “a mere half a degree”. Anyone here know the difference between water at -0.25 deg C and at 0.25 deg C?
Depends on the salt content. What are you getting at?
OK, H2O at standard pressure. My point is that the climate is not a linear system.
That’s right. My analysis shows that market forces will trigger replacement technologies and/or induce changes (I suspect those large houses and the Gumby looking cars Americans like will start disappearing).
Slapstick,
The discussion was about a 0.5C degree increase in a synthetic value called “average global (air) temperature”. This is not the same at all as the real measured temperature of a small sample of water. If a 0.5C change in the air temperature was so disastrous, we would never be able to survive the daily swings, let alone the seasonal variations. BTW, the air temperature was -1C this morning at my house, yet the pond in the yard was not frozen. How can that be, I wonder?
[Snicker Snicker] The … Horror. The … Horror.
Trump re-instated XL, Dakota and other US pipeline projects and derailed permitting (EPA style obstruction) on highway projects this morning!
Jalapeno flavored popcorn popping! 😀
Great news
Trump has a very odd style. When he signed that “approval” he said he would renegotiate the pipeline deal. But I’m not sure there’s much to renegotiate. Trump has been getting advice from a guy I think is pretty amateur in this area, and that amateurism really shows. If they don’t get their act together in a hurry they’ll find themselves tangled up in courts for the next four years.
But as you know, it is claimed that there has already been warming of about 1.2degC (since pre-industrial times) and with your high rate of a further 0.8 degC, this takes us to some 2 degC of warming.
And of course recently, the 2 degC goal post has been altered. It is now 1.5degC of warming that is considered dangerous.
Whilst I enjoyed the analyses, I do not see the warmists throwing in the towel just yet.
Yeah, but the 1.2 comes from an El Niño jacked temperature anomaly, usng the Karlized ocean temperature data set. Now that El Niño has ended it sure looks like the world surface temperature anomaly has increased about 0.9 to 1 degree.C, and that’s with the Karlized data, which I suspect will be revised in due course. Even if we use Karl et al, a well crafted analysis sets the temperature peak below or right around 2 degrees C.
I think I mentioned this back in 2014 when I started writing here. Fossil fuel constraints and a reasonable TCR leads to temperature at an optimum range over the next 50 years. This means the global warming problem is secondary to a future energy supply crisis. And I sure wish politicians would get this straight.
Fernando
I do not disagree. I have often suggested that there is no correlation between CO2 driving temperature in the satellite data set, and the response in that data set appears to be natural events, viz volcano short term cooling, ENSO variations with a step change in temperature coincident with the Super El Nino of 1998 (the reason for this step change, and the reason why it has not dissipated being unknown, but not CO2 related).
My point is directed at the warmist’s stance. People often make a mistake as to what that is.
First, people often consider that the 2 degrees warming runs from toady. That is not the warmist’s stance; it runs from pre industrial times.
Second, which follows from the first, the claim is that we have already seen about 0.8degC warming, recently put up to 1.2degC warming (due as you state to the 2015/16 El Nino), such that we can only permit a little additional warming before calamity occurs.
Third, the 2 degree threshold has recently been reduced to 1.5degrees of warming. This occurred before the Paris Agreement, and was then adopted in it.
Thus in summary; it is the warmist’s position that we can only permit about a further 0.3degC warming (1.5 – present day warming of 1,2), or maximum 0.7 degC (1.5 – the previous claimed late 19th/20th century warming of 0.8degC).
One must not miss that the pea has subtly been moved.
I have been saying this for years based largely on exactly the same analysis. The fact is after 70 years since we have been collecting reasonable data and with enough co2 put into the atmospbere to be close to half what we will put in and with only 80 or so years to go till the end of the century the guessing game is over.
When we were at the beginning of the curve there could be substantial variation like firing a bullet from a gun there was substantial variability in the trajectory as it left the barrel but now that it is halfway down the field the path is determined. We have had 0.4C for 70 years and given that more co2 has less and less of an effect it is easy to see that the ending temperature in 2100 has to be somewhere near an additional 0.4C barring some fundamental problem with the models.
To me this is indisputable. There is simply too much data to argue that suddenly we are going to get 2 C more. It’s insane. To get that would require that temperatures start acceleration 6 times faster than the last 70 years and not have another pause for 80 years. That’s more like a religious belief than Science. It’s simple math at this point. There is no need for complex models. We’ve got half the distance covered.
I totally agree about the co2 numbers too. It’s clear to me the IOC and alarmists like to put the 1400ppn scenario in so they can show lines with big changes that dominate the graphs. If they eliminated that and showed the more reakilistic co2 levels we’d be looking at charts with under 1 degree change and it would be nearly impossible to get people excited. Further all their studies of consequences would not be based on 2 or 3 C higher temps which are massively overhyped would show no impact.
Every aspect is magnified by a factor of 2. The amount of co2. The sensitivity and the impact in terms of consequences are all magnified giving a 5-10 times greater impact than is remotely possible.
This is a great point that I would like to expound on – why is there any uncertainty regarding the impact of anthropogenic carbon dioxide on temperatures?
Greenhouse warming is thought to be a logarithmic or diminishing return effect, so that the 200 ppm rise from 200 to 400 ppm would cause the same warming as the 400 ppm rise from 400 to 800 ppm. Another way to put this is that each ppm of CO2 added has incrementally less effect than the last.
Assume all the warming since the 1950s has been driven by anthropogenic carbon dioxide. We KNOW carbon dioxide concentrations have increased since 1950 from 270 ppm to 400 ppm, or 130 ppm. The curve gets flatter at higher carbon dioxide concentrations. So the change from 270 ppm to 400 ppm, or 130 ppm, should have increased temperatures by 0.75 degrees, at a minimum, using the 1.3 degree per doubling.
Problem is that is only 2/3 what they have predicted has actually happened. This strongly suggests that climate sensitivity to carbon dioxide is very low, much lower than expected.
What is it we are arguing about again? I mean, we know the answer, and even under the worst possible scenario, this is going the be a Y2K level problem (that is to say, a minor inconvenience to a few people).
why is there any uncertainty regarding the impact of anthropogenic carbon dioxide on temperatures?
In a word, feedback, its magnitude and its sign.
jdm064, I thank you for the discussion however I beg to differ. Your conclusion appears to be based on the assumption that the impact of CO2 on temperature can be precisely quantified. Put another way, all of the change in temperature over the past 70 years is due entirely to increasing atmospheric CO2 concentration. I will discuss this a little later on, but first I want to provide my opinion on CO2 as a greenhouse gas. In closed system (laboratory), bombarding CO2 with very specific wavelengths of energy shows that there are specific frequencies where energy is absorbed, however our atmosphere is an open system (which is a very good thing considering that the 40 quadrillion equivalent horsepower sun provides us with all of our energy requirements but nope, warmists, don’t take that as “well then, we don’t need hydrocarbons!” – more to follow), and the energy from the sun is over a very large bandwidth and not just at the frequency that CO2 absorbs at.
I believe that the “greenhouse” effect of CO2 is minimal to zero. The maximum atmospheric CO2 concentration over the past 600 million years is 7,000 ppm, or 0.7%. Plant and animal life has flourished over the past 600 million years, and temperature stayed within a very narrow bandwidth irrespective of CO2 concentration. On planet Earth, CO2 has always been a trace molecule in our atmosphere, and there is no correlation whatsoever between CO2 concentration and temperature, therefore why would that change now?
Trace molecule, please let’s not compare a physical process to a biological process, okay? Living at 51 degrees north latitude, I take vitamin D in the winter, a whopping 0.5 parts per BILLION (by weight) on a daily basis, and this helps to balance the vitamin D level in my body. Therefore YES, very minute changes in concentration in a biological sense can make a huge difference, but a trace molecule in our atmosphere that has the ability to impact all of the other molecules, get real.
Even at 7,000 ppm, if this is considered to be a big number, then what about the other 993,000 ppm, isn’t that a REALLY big number? I digress to current concentration of 400 ppm – yup, that is a big number …..
Back on topic, we have had glacial events in the geologic past where the CO2 concentration was ten times current (450 million years ago, at the end of the Ordovician, atmospheric CO2 concentration of 4,000 ppm vs. current of 400 ppm), and five times current (150 million years ago, end of the Jurassic, atmospheric CO2 concentration of 2,000 ppm vs. current of 400 ppm). And over any time frame that you want, changes to the atmospheric CO2 concentration always follows changes in atmospheric temperature. So how does CO2 drive temperature? If you believe that CO2 drives temperature, that is analogous to saying that “the tail wags the dog”.
Or my favorite, “lung cancer causes smoking”.
With regards to the big bright thing in the daytime sky, yes, it does provide us with ALL of our energy, but please do remember that oil, natural gas and coal are versions of concentrated energy from the sun – collected over millions of years, cooked for tens to hundreds of millions of years, for us to use in a geological “snap of the fingers” time frame. And all of the CO2 that was sequestered from the atmosphere over those same hundreds of millions of years, well, we are doing all plant life the biggest favor in the history of this planet by releasing it back into the atmosphere – where it came from in the first place.
There are way too many variables that impact the atmospheric temperature of this planet, from terrestrial all the way to the Milky Way level. Some have dependencies, others have none. I personally consider the impact of CO2 on the atmospheric temperature to be a red herring, and the entire “global warming” apocalypse to be the “witch hunt” of our generation.
And all of the CO2 that was sequestered from the atmosphere over those same hundreds of millions of years, well, we are doing all plant life the biggest favor in the history of this planet by releasing it back into the atmosphere – where it came from in the first place.
My thoughts exactly. I’ll go farther, the past million years the Plant Kingdom is living in a desert of low CO2 concentrations. Life has been sequestering carbon out of the biosphere for the past 600 million years at least. Current estimate of Carbon in various forms in the crust and biosphere (See Wikipedia: Carbon Cycle)
Atmosphere: 720 GT (gigatons)
Terrestrial biosphere: 2,000 GT (living and dead)
Fossil Fuels: 4,130 GT (90% coal and peat)
Ocean organic: 1,000 GT
Ocean inorganic: 37,400 GT
Ocean methane clathrates: 2,000 GT
Lithosphere Kerogens: 15,000,000 GT
Lithosphere Carbonates: more than 60,000,000 GT.
All these carbon atoms, especially the Lithosphere Kerogens and Carbonates used to be part of the atmosphere, then taken up by plants, animals, or corals and sequestered from the biosphere until subducted and ejected in volcanos or eroded, both comparatively slow processes compared to the sequestration rates.
Life, by sequestering carbon away from the biosphere, is it’s own worst enemy, slowly starving itself of a critical element. If we humans are returning some of that sequestered carbon into the biosphere via the atmosphere as CO2, I view that as a long term good thing for life.
@Darrell Demick,
we have had glacial events in the geologic past where the CO2 concentration was ten times current (450 million years ago, at the end of the Ordovician, atmospheric CO2 concentration of 4,000 ppm vs. current of 400 ppm),
Have you given consideration to variations in total atmospheric PRESSURE over the past billion years? All estimates of CO2 measured in ppm implicitly assume that atmospheric pressure is unchanged. A complementary measure would be to look at CO2 in terms of partial pressure.
Periods of gigantic forms of life (18 inch dragonflies, dinosaurs) have been suggested benefiting from high O2 concentrations at 1 atm. Alternatively an atmosphere of greater than 1 atm with higher O2 partial pressure along with higher CO2 partial pressure would also support gigantic forms of life. Especially life that flies.
A small observation on the impact of regulation: Volkswagen cheating to get around one air qualiy regulations estimated to cost $20 BN
No regulation no cheating no cost
Volkswagen’s mistake was the cheating they did increased noxious pollutants such as NOx and fine particulates. It wasn’t about CO2. Given the number of vehicles involved and the increases of around 40% above legal limits. Given that the current legal limits really don’t do the job in places like Denver(temp. inversions) and the LA basin it’s a significant pollution problem for certain areas. Realistically 20 billion is about right for the amounts of excess pollution.
They didn’t have to do it.
NOx and PMs are not harmful – there is simply no proper science that shows they are. PM claims are based on epidemiological studies with relative risks of around 1.2, which given all the confounding factors, let alone the Exposure Fallacy, means there is no problem. Add in the fact that there is no known biological mechanism for harm, and you have simply junk science.
There’s no doubt we will continue to have sufficient electricity after fossil fuels, even with today’s technology; necessity will overrule nuclear critics. The big issue is transportation fuel. If you’re optimistic you would say we’re just one big battery breakthrough away from solving the problem.
The battery break through has been elusive and may never be realized. Even if it is the recharging stations are a big problem particularly if one thinks they can duplicate what we have for liquid fuels through out the country. Who is going to pay for that?.
Another option: http://www.h2-fuel.nl/en
The Chevy Volt demonstrated that virtually no fossil fuels are needed to fuel the electric hybrid. The entire need for transport fuel will and can decrease by at least 1 order of magnitude if needed. Right now in its primitive state, it is only marginally more expensive I see no practical replacement for aviation fossil fuels and maritime fuel needs, are also fairly stable.
The point is that fossil for fuels can decrease substantially and if the price need increase by an order of magnitude, the Volt provides technology that makes it acceptable with minimal consequences. All these peak oil predictions are based on not improving technology or finding new fields. That is rediculous.
stas peterson BSME MBA MSMa January 25, 2017 at 2:42 pm
“Virtually no fossil fuels”??? Only about 4% of the electricity generated in the US comes from sources recognized by the State of California as being renewable. This means that some 96% of the power for your Chevy Volt comes from fossil fuels.
w.
Willis you are using the State of California’s definition of “renewable” to classify the energy generated in the entire US? That’s really dumb. Try not mixing your apples and oranges together. If that Volt was in West Texas, your 4% number is not applicable.
If that Volt was in California, your 4% number is also off base (as of 2009) : http://www.energy.ca.gov/renewables/
Can’t build Volts without one of these:
http://images.travelpod.com/tw_slides/ta00/a71/f36/iron-ore-truck-labrador-city.jpg
That bad boy doesn’t run on electricity.
Willis,
An interesting article… with a minor question. From the paragraph:
From this estimate of future production, they derived two estimates of the peak values in the 21st century. Using just conventional oil, they estimate a peak value for atmospheric CO2 in the 21st century of 550 ppmv. If you add in “unconventional” fossil fuels (fracked oil and gas) they get 610 ppmv.
Did you intend to say ‘conventional fossil fuels’, rather than ‘conventional oil’?
Thanks, fixed. My motto is “Perfect is good enough.”
w.
It has been a “Hoaxocalypse” since the beginning.
(Using simple “Hoax” definition of “something intended to deceive or defraud”)
As the observational ‘effective’ ECS is something between 1.5 and 1.85 (and most likely ~1.65 (e.g. lewis and curry 2014) then the right most column of fig. 3 better represents the end outcome at 2200 or 2300 (crazy IAM models of SCC). Means the SCC is as crazy as the feared CAGW 3C>2C. Nice analysis.
And your conclusion about unconventional (shale mostly) oil and gas can be backed up directionally with a lot of geophysical evidence. For example (essay Matryoshka Reserves in ebook Blowing Smoke) the worlds largest mostly oil shale by area, Bahzenov in Siberia, likely has (for several different reasons) less TRR than Bakken in North Dakota/Montana despite being 80x ‘bigger’.
What about the huge potential of the oil sands such as in Alberta.
Yups. Huge potential for hydro upgrading using nagas to syncrude value about 2/3 of WtI.
And max SAGD OIP (not here even oil, just bitumen) is ~20 percent. Recalculate!
The Alberta oil sands, the Venezuela Orinoco oil belt, and other smaller extra heavy oil accumulations are already included in most “burnable” oil figures. I happen to have consulted in this particular field for years, and I don’t see much upside.
I do see a significant downside for Venezuela, because the Maduro dictatorship is quite irrational, but neither Obama nor the Europeans had the moxie to stop it from turning into a monstrous, nearly genocidal tyranny. Right now we should assume the bulk of that oil will not be available for the next 50 years. Why? Because the political elites have already legitimized the Castro dictatorship. And the Castro Mafia is mentoring Maduro. To make matters worse, Maduro just named a new executive vicepresident, a Syrian citizen named Tareck el Aisami. The regime controlled Supreme Court rubber stamped this move by issuing a decision that it was fine to have a Syrian as Vice President (and therefore as president if Maduro dies or resigns). This situation will likely be ignored by the USA ruling elite, and this means Venezuela is toast. Forget that oil.
I really hope that man can actually warm the climate. We are going to
need it.
As I know most of you have read me write in the past, it is hydrocarbons
not fossil fuel.
The first shortage of “fossil fuel” occurred ~1856. Since then each
“shortage” of hydrocarbons has been alleviated by advances in drilling
or discovery. When the incentive was high enough, more was produced.
That process will continue.
For a tabulation of past shortages, I refer you to Julian Simon’s “The
Ultimate Resource 2” starting on Page 164.
There is no limit, as far as humans are concerned, of hydrocarbons. When
pressure is relived near the surface, more will well up.
As I told my financial adviser when I sold my business, and retired
never invest in anything which competes with hydrocarbons as a portable
source of energy. For a review, check ethanol, wind, and solar and oil
supply after Carter subsidies died in the USA.
An extremely stupid set of assumptions: I have little doubt that molten salt reactors and electric cars will dominate within the next few decades, electric cars more rapidly, since they have a relatively short lifespan and high turnover rate – less than a dozen years on average.
Ever heard of Semi Valley in California? Do you know what went wrong with the molten salt reactors there ? They didn’t move the reactors they buried them on site.
Yeah, they were unable to make the technology work in the 1950’s, so let’s never try again. Good plan.
Put the sarc after if that’s what you meant Paul. Perhaps you can tell me what happened so we can avoid the same . But don’t pretend they aren’t risks or faults that we shouldn’t be aware of.
It’s misguided to think that regulations in the nuclear industry came about because we were anti nukes. The regulations came about because of inherent structural faults. Devastating event years later after the building of a plant. The ” it’s off my desk ” attitude and I saved money now.
You see an immediate solution to energy problems, I see the problems 50 years from now, and on into the future. Chernobol was a long time ago. The dome over it is going to have to be replaced. In nuclear time, that event happened a few minutes ago. It will be dangerous longer than man has had the ability to read and write. And there is no accounting for political expediency. What’s the cost on an on going basis of an area that becomes unfit to live in? What the maximum amount of earth that we can have those kinds of problems ?
You know what scares the crap out of me ? A New Madrid earthquake.
Google is your friend.
https://en.wikipedia.org/wiki/Sodium_Reactor_Experiment
If you bother to read the article, it explains that this was not a Thorium Molten Salt Reactor, but one that used Uranium. It therefore had a very different design than the thorium reactors being proposed. It used liquid sodium as a coolant rather than water. It relied on an entirely different set of nuclear reactions and fuel cycles. So it’s really not relevant. Of course, one could still use molten salt as a coolant in a uranium reactor, but use a more sophisticated design. Of course, the current design of standard uranium reactors is very different than the old models that resulted in disasters such as Chernobyl, so those incidents aren’t comparable. You might as well compare biplanes from WWI to modern fighter jets or jetliners.
While technically you are right, the issue remains that nuclear in any form is inherently safe. It’s the humans in control of it that is the problem. No where is the issue of data, facts, and agendas more apparent than in the still settled science of climate. Despite 25 years of catastrophic predictions not one has occured. No one in position of authority has published anywhere, ” we might be wrong “. In fact they are pushing ahead as if they aren’t. Do you think this mindset is any different in the nuclear field ?
Actually, the design of Thorium Molten Salt Reactors is inherently safe, regardless of what humans do. It’s very, very different from a Uranium reactor using either liquid sodium or water as a coolant. The Thorium is not in the form of pellets or rods, but is dissolved in the sodium salts and if it overheats, it automatically melts a plug in the drain below it, and all the radioactive material flows into a safe holding pool where it cannot continue to heat up. So meltdowns and release of nuclear material are simply impossible, regardless of human operator error. That’s entirely different from a standard Uranium reactor, where coolant failure can lead to catastrophic meltdowns. Likewise, Thorium reactors produce very little waste, since their nuclear cycle burns up most radioactive by-products.In fact, it would be an excellent way to dispose of the waste generated by Uranium reactors.
All that is fine and good, what you are not accounting for is human ineptitude.
I know .. we will do it anyway and deal with the problems later. Problems are not evident until they are.
the design of Thorium reactors explicitly takes human error into account and makes it irrelevant. A human error could force the reactor to shut down, but it could not lead to a meltdown.
I have heard that before. .. the responsibility falls on me to tell you what could go wrong. It’ll probably be beyond my current life expectancy before problems become apparent. So, other than I believe that there is life after life, I try to make things as good as possible. Who wants to come back here with more problems ?
There is nothing ever built that doesn’t have problems. That’s what I telling you. When I hear about how safe something is, forgive me for being a little skeptical. I’ve heard it before.
It’s probably safer than what we have now, I don’t know what the future problems could be.
Every American nuclear reactor has the same design flaw as the reactors in Japan that exploded. It wasn’t suppose to happen.
@3:01 “electric cars will dominate within the next few decades, electric cars more rapidly,”
In 2016, the USA auto sales have been about 17,800,000 and give or take a million this will continue in 2017. Most are ICEs and that will likely continue.
So, what is a “few decades” or more rapidly than that?
What does “dominate” mean? Does it mean electric autos outsell ICEs? Does it mean the total number of electrics on the roads will be greater than the ICEs?
I don’t think we should depend on electric cars until someone invents the decent battery and tells us who is going to pay for all the charging stations needed through out the country, How about the diesel trucks which require much more energy?
We’re going to have to start cracking limestone to get a decent level of CO2…
That is what plate tectonic subduction zones do for free. Thank goodness.
Eric Excellent observation. Limestone is a major industry and there is lots of it around.
But then we’ll have to sequester the CaO, else limestone just reforms.
I think we are looking at a different kind of apocalypse. Judging by how fast the curve comes down, and given relatively inelastic demand, I would say the price is going through the roof. On the other hand, I don’t think they’ve factored coal into the mix.
If the supply falls and the price rises as fast as I think it will, look for a major boom in nuclear power stations. Renewables won’t cut it and will be pushed aside when cold hard economic reality hits.
The construction of nuclear power plants should keep the economy chugging along for decades to come. Maybe.
The problem isnt coal, used for electricity and steel. And for many decades thanks to fracking it isn’t natural gas used for electricity and heating. And nuclear can be used to generate electricity to save coal for steel and gas for heating. The problem is crude oil, which globally goes about 70% to just three liquid transportation fuels: gasoline, diesel, and jet kerosene.
There are pathways to keep surface transportation alive and auto manufacturers are madly pursuing alternatives (efficiency, electricity, sharing) but Boeing, Airbus and the airlines don’t have any realistic medium term solutions. Biofuel maybe but the volumes are huge.
Look, with the use of nuclear power as a supply of industrial process heat (at about half the price per watt-thermal as for watt-electric), it is possible to synthesize virtually any hydrocarbon fuel from water, air, and any source of carbon (vegetable waste, garbage, calcium carbonate, etc.). It would be an endless renewal cycle. If we didn’t already have hydrocarbons, we would have had to invent them.
ristvan,
I agree, there are two different needs. Electricity is easier, transportation fuels could be more difficult although coal liquefaction is viable but expensive. I think we are being too pessimistic regarding the new technology that can be used to find and recover more oil. We have been told that we are running out of oil too many times in my lifetime. Besides we can reverse the Obama edicts which preclude oil production over vast areas that are promising. (some sarcasm)
Nice work Willis.
A couple notes. I’m glad you agree that its sensible to combine all the forecasts statistically.
Note.. a bunch of folks might caterwaul if you did that with GCMs but, its a good pragmatic solution
to a tough to handle problem.
Second, I much prefer the AR4 approach to scenarios which was bottoms up, as opposed to the RCP
approach which gives you scenarios like 8.5 which look kinda bonkers to use a technical term.
Third. My guess has long been 600ppm give or take.. based on supply and a wild ass guess that
we would innovate our way away from FF by no later than mid century.
4th. In assessing climate science ( just looking at the charts in AR4 ) it was immediatey apparrent
that the two largest uncertainties were ECS and Future Emissions.
Hence, if your goal is to improve understanding and put the science to a test.. if your goal is to hit
the weakest link.. then these are the areas where you should concentrate fire power, time, brain power and effort. every other attack is waste of time and diversion.. strength on weakness usually works
5th. You can quite comfortably ( as Nic Lewis shows and as these guys show ) Punch heavily on those
soft spots and A) get published. B) occupy a place INSIDE of the consensus. C) avoid the charge of being anti science D) Avoid political arguments. E) resist the urge to charge fraud and end up in court.
So just from a practical stand point– it is the best place to make a science impact. it has always amused me that skeptics waste their time trying to refute radiative physics.. or waste their time as Salby has, when the Obvious place to aim is as I describe above.
Mosher I find myself amazed at agreeing completely. Nice comment. Have railed at no GHE and Salby crowds myself. Would add two other very soft target: climate models per se, and CAGW predictions (polar bears, tipping points, accelerating SLR). Secondary, but necessary to bring down the CAGW edifice. Both get to prognosticating the C part.
Agree totaly. It allways hurts me when the most comments according to a technical post about TCR/ECS or so try to deal with basic physics (TCR=0). It’s hard to find some valuable hints as the needle in a haystack.
Not bad. But the consensus has been built around rcp8.5 for years. The EPA uses a case that’s even more extreme than rcp8.5 to estimate the cost of co2 emissions, and we get these rather useless impact studies by the thousands. I’m encouraged because the fossil fuel limits are gradually starting to be understood by some, but it sure is an uphill battle.
Mosher
“A) get published. B) occupy a place INSIDE of the consensus. C) avoid the charge of being anti science D) Avoid political arguments”
Great so this is what this country has come too! What ever happened to “I don’t agree with what you are saying, but I will defend with my life your right to say it.”
One point Mosher, what if the consensus IS wrong? Not saying it is but what if it is. Whether it’s the consensus on this or some other point that affects every ones lives and freedoms what then just go along?
want to add my thanks for making a reasonable comment.
The difference in averaging this (as opposed to averaging GCMs) is that Willis is simply approaching this problem without having any deep knowledge of the subject or the efficacy of the various models. So averaging is a decent way to at least start a conversation. And that approach perhaps made sense in the very beginning of the GCM modeling process. But it wouldn’t make sense in either case if after decades of observation we see that some of those models don’t work well at all. At that point, averaging the good and bad models (evaluated based on observational results) is simply absurd. Best at that point to throw out a lot of the models which have been shown to not be in accord with observations, and then perhaps average the remainder before having a conversation about the range of possible scenarios that make any sense. So it’s not just that the RCP 8.5 emissions scenario that doesn’t make sense, it’s also a whole lot of the models regardless of the emissions scenario they are using as input. And so the models have to be broken down and evaluated on the basis of their other internal assumptions, with some being similarly tossed aside as absurdly out of touch with observational reality and basic physics.
Peak oil, coal whatever have failede big deal, so a bit of humility would be good.
Never the less there is a limit to the amount of CO2 we can produce, or will produce, and in this way some projections are far out.
All we can do is look at the data, figure out how much resource there is, and guess at how much we will find in the future. This is a lot easier now because we aren’t finding much in recent years. So now the problem is simplified. As it turns out, many reservoirs are already depleted, or are on their last legs (Samotlor, Prudhoe Bay, Cusiana, El Furrial, Brent, Staffjord, et al). We are also starting to understand much better what makes the “shales” tick, and how much oil will come out. And some reservoirs, such as the North Dakota Baken, are already drilled by thousands of wells. So today we know much much more than we did 20 years ago.
What has happened to Richard Courtney?
Two things:
1) He found the personal abuse thrown his way because of his left wing views to be intolerable. It was bad gfoir his heart and blood pressure.
2) He has had a stroke and is now far less active than he was. And he has other medical issues which are not good.
Thanks M.
Richard as a champion of Britain’s coal miners was always going to be left of center politically. It’s regrettable that there seems to be more tolerance for even AGW pseudoscience than for socialist views – climate skeptics should be a broader church. Richard is remembered with respect and affection by many here I’m sure, we miss his distinctive passion for science and integrity. Say hi to him for us!
Will do.
“Can we call off the apocalypse now?”
Willis, what exactly is the apocalypse that is referenced all the time anyhow?
I must have missed that episode,,,,,,,,,,or it remains an ongoing enigma.
Just sayin…….
Every 10 years someone forecasts peak oil is 10-20 years ahead. Eventually they will be right. The same is true of gas.
But we will never run out of carbon to burn.
Carbon cycle: the series of processes by which carbon compounds are interconverted in the environment, involving the incorporation of carbon dioxide into living tissue by photosynthesis and its return to the atmosphere through respiration, the decay of dead organisms, and the burning of fossil fuels.
“In terms of geologic pollution the Mississippi River was, and is, North America’s largest sewer system. It collects and dumps waste into the Gulf cesspool, where oil and gas forming processes start immediately.” Clark, R. H. and J. T. Rouse. 1971. A closed system for generation and entrapment of hydrocarbons in Cenozoic deltas, Louisiana. Bulletin of the American Association of Petroleum Geologists. 55(8):1170-1178.
As one who still has epidermal mud molecules from the Louisiana marsh, I agree. May not fly many planes, but should feed lots of people.
Well, actually, that is geologically incorrect. The biggest carbon sink is marine single cell organism calcification (limestone results) from diatoms and coccoliths. The only recycling is tectonic subduction zone volcanism. Now how much ??
I find it strange that climate alarmists aren’t in a tizzy over 610 ppm of atmospheric CO2 by the year 2100. Of course, they don’t know their climate history very well and it is a shame because sometimes such knowledge can be twisted to their advantage. For instance, about 50 million years ago the global temperature of the earth is estimated to have been about 10 degrees C more than it is today – BUT, atmospheric CO2 levels were only a little more than 600 ppm. Can you not see them screaming already?
“the global temperature of the earth is estimated to have been about 10 degrees C more than it is today – BUT, atmospheric CO2 levels were only a little more than 600 ppm.”
Is that good news?
That would be good news for the climate alarmist who would say, “Look, look, 600 ppm raised the global temperatures to 25 degrees C.” For what they want to say is that we are all doomed. However, point out other instances in climate history when atmospheric CO2 levels were no more than 300 ppm, such as the last interglacial, the Eemian period, and yet, global temperatures were close to 20 degrees C and sea levels were much higher than today, and let them crunch on that one. A good dose of climate history, in my opinion, is how to turn climate alarmists into climate realists.
Slowly they are FJ . There will be a new crop of alarmist every so often. But they are getting fewer.
It is good news for humans burning hydrocarbons for a better life. Let’s list the evidence CO2 “don”t do Jack”:
1. Current models based on CO2 radiative feedback grossly exaggerate atmospheric warming for all except the surface boundary layer.
2. Even in the current regime of rising atmospheric CO2, temperature controls the variation around the rising trend.
3. Ice cores indicate CO2 has been the slave of temperature for 800kyr until we started liberating it.
4. Benthic cores strongly suggest from where they overlap ice cores that CO2 slavery to temperature continues back considerably further.
5. In deep time when atmospheric CO2 was MUCH higher, even the slavery to temperature breaks down and there appears to be no meaningful correlation between the two.
Now let’s consider the evidence CO2 causes significant warming:
.1 Steven says it does.
.2 It happens to be warming now.
It is abundantly clear from 1-5 above that something besides CO2 is responsible for past warming at least equal to what we see today. What basis do you have to suppose that current warming is different?
I completely agree that the “burn, baby burn” mentality is stupid. We need to save hydrocarbons every chance we get. We need to save them for the third world out of human decency, in case we can’t find anything better soon.
We are incredibly wasteful. The ethic should not be that CO2 is evil. The ethic should be that to waste the resource is evil.
I read this and i am increasingly convinced it is beside the point.
Let me put it this way. When carbon dioxide and various carbonates are present in seawater, there is a vapor pressure of the carbon dioxide vapor in equilibrium with the carbon dioxide (and surrogates) in solution. At a current concentration of 400 ppm and atmospheric pressure of 14.7 psi, this vapor pressure is about 0.006 psi.
Equlibrium vapor pressure is analogous to saturation humidity. When the water vapor concentration is forced higher than saturation level, what happens? Does it go higher than saturation? No, it condenses. Similarly, if carbon dioxide concentration rises above the equilbrium level, does it simply go higher? No, it dissolves into seawater. Likewise, if the concentration lowers below equilibrium, does it simply go lower? No, the seawater releases carbon dioxide to reach equilibrium. In chemistry, this is known as LeChatlier’s Principle: the chemical system will always move in the direction that restores equilibrium.
Any argument to this point? Because the direct implication is that the level of human release can have no actual effect on atmospheric carbon dioxide concentration–if we accept that this concentration reflects an equilibrium between the atmosphere and the oceans. (Natural CO2 sources and sink far outweigh the human contribution.)
What I surmise is that the oceans are “warming” (or changing chemistry equivalently) in the direction of a higher vapor equilibrium pressure. CO2 is increasing regardless of human activity. This would explain the CO2 increase prior to significant industrial activity in “modern” (post-1700) times. This would explain the odd shifts in CO2 over millenial time scales. And I would venture to suggest that if civilization were to be wiped out, insofar as CO2 production is concerned, there would still be an increase of CO2.
The important thing to understand is that the CO2 rates into and out of the oceans are variables, controlled by the equilibrium conditions. If human production were to shut down, it would be matched by a compensating increase in emission from the oceans. All we are doing is producing CO2 that otherwise would be emitted from the oceans anyway. (Or, if emission doesn’t rise in compensation, then vapor solvation would decrease–whichever works.)
The alternative to this line of thought is to deny that such an equilibrium must exist, and to deny that LeChatlier’s Principle is operative.
As for heat? It is so far overblown that–in my opinion–we give too much credence to the “science” that purports to be out there. We get caught up in minute predictions of general trends that involve vast natural variations. As I have mentioned from time to time, the equilibrium temperature of the Earth, is proportional to the fourth root of the ratio between its absorptivity and its emissivity. Do we know either of these values to better than +/- 10%? A 10% variation results in a temperature change of 7 K (13 F). It is not apparent to me that we are watching anything other than noise. A 1% variation is a change of 0.74 K (1.3 F)…which is what we seem to be arguing about. Are you kidding me? We are arguing about climate effects of natural parameters that are supposed to be constant to +/- 1%? I don’t think so.
“Any argument to this point?”
Yes. The equilibrium shifts. That’s actually the point of Le Chatelier’s principle. It shifts to counter the perturbation. If you compress a gas over water, more will dissolve. But the pressure still rises. And so it is here. If you emit CO2, some dissolves, but a fraction (about half) remains.
http://www.woodfortrees.org/graph/plot/esrl-co2/from:1958/mean:24/derivative/plot/hadcrut4sh/from:1958/scale:0.225/offset:0.097
“…(about half) remains.”
That’s not what the data is telling us. Whatever remains is highly dependant on temperature (assuming the rise is anthropogenic) regardless of the amount of co2 we add to the atmosphere. Short term variability, long term trend, it’s all there in the data, well over half a century’s worth…
Thank you all for the interesting and learned comments – a very good thread.
Thank you too Fonz for your plot of dCO2/dt versus global Temperature T:
http://www.woodfortrees.org/graph/plot/esrl-co2/from:1958/mean:24/derivative/plot/hadcrut4sh/from:1958/scale:0.225/offset:0.097
When dCO2/dt is integrated, it shows that atmospheric CO2 lags Temperature by about 9 months in the modern data record.
The essence of the mainstream global warming debate is an argument about the magnitude of ECS – essentially it is an attempt to quantify how much the future causes the past. 🙂
Yes, you are a good reader. That was my point: the equilibrium is shifting. Actually the rates of emission and solvation would be equal in the case where nothing else is happening. If something else is happening, then either the emission or the solvation would change to meet the equilibrium. But the equilibrium would be maintained REGARDLESS of what else is happening.
“That’s not what the data is telling us.”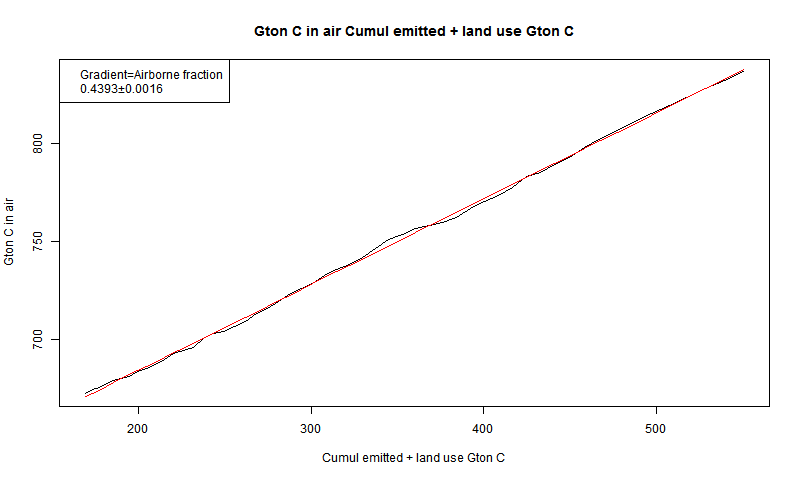
Yes it is. Here is a plot of annual (no seasonal) CO2 in air (Mauna Loa) vs cumulative emissions. Very linear (here is why).
Further to comments by Fonz and Nick, extracted from my previous posts
I have stated since January 2008 that:
“Atmospheric CO2 lags temperature by ~9 months in the modern data record and also by ~~800 years in the ice core record, on a longer time scale.”
{In my shorthand, ~ means approximately and ~~ means very approximately, or ~squared).
It is possible that the causative mechanisms for this “TemperatureLead-CO2Lag” relationship are largely similar or largely different, although I suspect that both physical processes (ocean solution/exsolution) and biological processes (photosynthesis/decay and other biological processes) play a greater or lesser role at different time scales.
All that really matters is that CO2 lags temperature at ALL measured times scales and does not lead it, which is what I understand the modern data records indicate on the multi-decadal time scale and the ice core records indicate on a much longer time scale.
This does NOT mean that temperature is the only (or even the primary) driver of increasing atmospheric CO2. Other drivers of CO2 could include deforestation, fossil fuel combustion, etc. but that does not matter for this analysis, because the ONLY signal that is apparent signal in the data is the LAG of CO2 after temperature.
It also does not mean that increasing atmospheric CO2 has no impact on global temperature; rather it means that this impact is quite small.
I conclude that temperature, at ALL measured time scales, drives CO2 much more than CO2 drives temperature.
Precedence studies are commonly employed in other fields, including science, technology and economics.
Does climate sensitivity to increasing atmospheric CO2 (“ECS” and similar parameters) actually exist in reality, and if so, how can we estimate it? The problem as I see it is that precedence analyses prove that CO2 LAGS temperature at all measured time scales*. Therefore, the impact of CO2 changes on Earth temperature (ECS) is LESS THAN the impact of temperature change on CO2 (ECO2S).
What we see in the modern data record is the Net Effect = (ECO2S minus ECS). I suspect that we have enough information to make a rational estimate to bound these numbers, and ECS will be very low. My guess is that ECS is so small as to be practically insignificant.
Regards, Allan
*References:
1. MacRae, January 2008
http://icecap.us/images/uploads/CO2vsTMacRae.pdf
Fig. 1
https://www.facebook.com/photo.php?fbid=1200189820058578&set=a.1012901982120697.1073741826.100002027142240&type=3&theater
Fig. 3
https://www.facebook.com/photo.php?fbid=1200190153391878&set=a.1012901982120697.1073741826.100002027142240&type=3&theater
2. http://www.woodfortrees.org/plot/esrl-co2/from:1979/mean:12/derivative/plot/uah5/from:1979/scale:0.22/offset:0.14
3. Humlum et al, January 2013
http://www.sciencedirect.com/science/article/pii/S0921818112001658
Buncha’ hand waving, Nick. Here is the real correlation:
http://i1136.photobucket.com/albums/n488/Bartemis/tempco2_zps55644e9e.jpg
That’s wrong Nick. First the amount of weight per cubic meter increase is really, really small. Second, the half part is really wrong. Pressure gradients, highs and lows, far out weigh any increase in the minute amount of weight. The o2 was always there. The only thing added was a carbon atom, many years less than one in a million. Third there is no way to account for no negative numbers from 1850 to 1910. The carbon cycle isnt/wasn’t that we’ll balanced. See the article just discussed on plants holding there breath. Did the structure of plants change ? I’m thinking that burning fossil fuels may have saved the planet and all life on it from carbon starvation of plants. And fourth, the current rate of sinking far outweighs any known mechanism.
You don’t see the paradox do you ? …. Finally, as far as I’m concerned, co2 follows temperature. Changing the data after I presented the evidence isn’t going to change my mind. NOAA is being high handed and capricious. It is doing a disservice to those in the far future and now for failing to acknowledge that co2 follows temperature. Of course, I believe they already knew. Those guys aren’t stupid. And they’ve known for awhile. I was carefully keeping track of it.
http://www.drroyspencer.com/wp-content/uploads/simple-co2-model-fig01.jpg
Above are the accumulation rates of both emissions and atmospheric co2. Clearly visible in the rate of atmospheric carbon growth is the temperature “fingerprint”. (of particular interest being the known step rises in temperature that occur circa 1980 and 2000) Parameters of cumulative emission graphs are as such that they do not show this variation in the growth rate. So, you can easily have two data sets that trend alike over time that look sexier in a cumulative graph then they actually are…
You are correct, Michael. Figure 2 from the article is a graph that takes the purported pre-industrial, steady state for granted. In this land of make-believe, there is no rhyme or reason for the natural balance – it just happened. Thus, they can decouple the natural from the human, and assume human impacts play out independently of nature, which is always there, reassuringly to rebound to its natural, Edenic state once the parasitical humans have exhausted their abusive proclivity.
It’s hooey. It is pre-Enlightenment primitivism, not science.
We should remember there are two sides to the equation. There is how much CO2 we put out/fossil fuels we burn every year and there is the natural absorption rate of plants, oceans and soils every year.
The natural absorption has been rising as the amount of CO2 in the atmosphere has increased. This is going to forestall the time when we reach peak CO2.
My best guess is something like 580 ppm in 2180 with this same idea that our emissions will eventually peak and decline very slowly starting sometime fairly soon, while the natural absorbers will go on increasing until it matches our emission rate and we have “peak CO2”, but that is a long way out. “Peak anything” is a very hard prediction of course since it is always wrong.
Before NOAA fixed the numbers for better science, from 2006 to 2014 the amount missing over and above the calculated absorption ranged form 4 BMT to 7.5 BMT, most were closer to 7.5. In 2014 the amount produced was 38 BMT 19 BMT was calculated to be absorbed. That left 7.5 BMT that went somewhere. Or in other words out of the 38 BMT, 26 BMT was sunk. The total amount sunk in 1965 was around 6 BMT, and the other 6 BMT made its way into the atmosphere. So whether you take an approximation of 1 ppm per 6 BMT, weight of the atmosphere, or molecular mole. The sink is 4 times what it was. So approximating that a little over 3 times as much co2 was produced, the sink would have come in at the 19 BMT mark. The sink is about 1 1/3 times higher than it should be The amount of ppm should have been over 3 and not closer to 2. In fact, 2009 it came in at 1.89. And 1998 to 1999 the amount that dropped out was 12 BMT.
These numbers weren’t variations, they were constant. I challenge your premise.
Concerning the minor amounts missing in 1965, could be through approximation, or actually significant. I’m treating it as approximation. Where did I get these numbers? NOAA.
When we run out of oil, there are still methane hydrates in vast amounts. Some estimate 10X more than crude oil energy reserves.
http://geology.com/articles/methane-hydrates/
Wang et al look at that. But they discount hydrates as not feasible in their 21Cen time frame.
Now all you have to do is find Japanese investors willing to give you $100 billion to produce hydrates. If you get it I want a gig running a hydrate extractor rig, I charge only $4000/day. That should be fun.
We have already had close to .6C warming in the 21st Century. Peak to peak in GISTEMP is about .4 (for now).
Willis, I think you need to add to the chart an analysis of the total reserves numbers. While fossil fuels were extracted, this number was increasing rather than decreasing. This makes the downturn on the production chart questionable.
MN, reported reserves are not relevant. Subject to manipulation (not least price assumptions). The ‘correct’ metric is TRR (technically recoverable reserves at any price). Now redo your homework using TRR.
Reserves bookings are guided by economics, regulations, and politics. This means the “official books” don’t carry everything we think we should be able to extract. In some cases the reserves are political, for example OPEC countries use these figures to jostle for quotas. Other countries manipulate them to improve their finances (they hope to get better (lower) bond interest rates). Companies booking under SEC regulations are forced to underbook, although that’s changed a bit in recent years, and now it’s getting better. On the other hand, some fields with shale production are a bit overbooked. It gets really really complicated.
When you talk the science we listen and learn.
I’m sure Al Gore and Leonardo DiCaprio have killer, fool-proof rebuttals to this argument ready to hand… for their next tragie-comedies. Complete with hysterical hyperbole and graphic images of snowmelt.
There simply are no good estimates of unconventional recoverable reserves. We have no idea where it will work, at what price, at what point in our technology curve. The gains made in reserves and production cost in the last two year in the Permian basin are staggering. Profitable at $25, enormous reserves. Then there is this little Russian shale:
———————————————————–
“Everything about Bazhenov is on almost unimaginable scale. It covers an area of almost 1 million square kilometres – the size of California and Texas combined.
The formation contains 18 trillion tonnes of organic matter, according to the U.S. Geological Survey (“Petroleum Geology and Resources of the West Siberian Basin”, 2003).
Bazhenov is estimated to hold more than 1.2 trillion barrels of oil, of which about 75 billion might be recoverable with current technology, making it the biggest potential shale play in the world, according to the U.S. Energy Information Administration (“Technically Recoverable Shale Oil and Shale Gas Resources”, 2013).
To put that in context, Bazhenov contains an estimated 10 times more recoverable oil than the famous Bakken formation in North Dakota and Montana.
Bazhenov could produce more oil than has so far been extracted from Ghawar – the super-giant field in Saudi Arabia that made the 20th century the age of petroleum.”
————————————————————————————
And that is just at “current technology”
The Permian basin looks pretty good. But wells aren’t viable at $25 per barrel. That’s touted by Morgan Stanley, and god knows they know very little about the business. They do wear very expensive suits.
I just looked at rate versus cumulative plots for several basins, and it sure looks like most reservoir sectors have a hard time achieving 200,000 barrels per well. Given well costs, and the hassles we have producing these crooked wells, it seems that $60 per barrel is the price needed to get things going to reverse the decline we have seen in the last two years.
The USGS figures for the Permian are guesswork. I happen to know Walter in person, and he’s a top professional, but their methods aren’t intended to be useable for official bookings. They are basic resource guidance.
The Bazhenov is large, but most of it is worthless. These shales have to have light oil with a fairly high GOR, the pressure has to be high (it helps to have an overpressured gradient), the rocks have to be brittle, and do require some sort of natural permeability (such as very small natural fractures), the geólogy has to allow for smooth drilling of long laterals, and the cost environment has to allow producing thousands of wells at very low rates (say 30 BOPD). This hurdle set isn’t met by most of the Bazhenov at $100 per barrel. We don’t really know what’s going to happen there, but from what I see thus far, Russian companies aren’t about to go nuts developing that stuff.
Please read essay Matryoshka Reserves. Everything you cite about Bahzenhov (I am not disputing that you have cited correctly) turns out not to be true. You have to drill down way deep. TOC is not a proper indicator. A large swath is autofractured and depleted; Bahzenov is the source for Siberias many conventional reservois like Samotlar. The Bahzenov stratigraphy is very unfavorable, the exact opposite of the Bakken used for comparison in the essay.
Just How Much Does 1 Degree C Cost?
https://co2islife.wordpress.com/2017/01/25/just-how-much-does-1-degree-c-cost/
The point of this thread by
David Long on January 24, 2017 at 2:47 pm:
There’s no doubt we will continue to have sufficient electricity after fossil fuels, even with today’s technology; necessity will overrule nuclear critics. The big issue is transportation fuel.
If you’re optimistic you would say we’re just one big battery breakthrough away from solving the problem.
____________________________________________
is:
If you’re optimistic you would say we’re just one big gold making breakthrough away from solving the problems of
Wall Street and Deutsche Bank,
Sigmar Gabriel and Barbara Hendricks,
Angela Merkel and Goldman Sachs.
____________________________________________
Alchemists golden green dreams of never ending veggie days.
Willis,
Our results agree closely with yours. The Right Climate Stuff research team at http://www.TheRightClimateStuff.com has made several presentations at Heartland ICCC and Texas Public Policy Foundation climate conferences in recent years with links to presentation videos and various reports provided on our website that agree closely with your conclusions.
We developed a supply-based RCP6.0 scenario with a maximum of 600 ppm CO2 in the atmosphere when all current coal, oil, and natural gas official world-wide reserves published by the US Energy Information Administration (EIA) are recovered and burned. Estimated world-wide coal reserves are the big driver. EIA estimates for coal reserves vary by a factor of 3 from low to high and we used the high value. Our “Business as Usual” RCP6.0 scenario assumes we will have a market driven transition to non-CO2 emitting fuels (I’m betting on new, safer nuclear reactors) to meet growing world-wide energy demand, as prices rise on depleting fossil fuel reserves. This transition will need to begin in about 2060.
Our RCP6.0 scenario has 585 ppm atm. CO2 concentration in 2100 and an assumption that other GHG and aerosols contribute their historical average of about 50% of atmospheric CO2 radiative forcing in 2100 to achieve 6.0 W/m^2 radiative forcing relative to 1750, as the IPCC AR5 defines and rates its RCP scenarios. Our simple, validated climate model, for GHG forcing, derived from Conservation of Power flows at the earth’s surface, is given by:
GMST(year) – GMST(1850) = TCS(1+beta){LOG[CO2(year)/CO2(1850)/LOG[2]}
where TCS stands for Transient Climate Sensitivity due to a slow rise in atm. CO2 concentration that is a similar metric to TCR and should have the same value, except TCS is verifiable with physical data and is defined for doubling atm. CO2 concentration with the actual variable rate of CO2 concentration rise since 1850. We estimate this doubling will occur in about 2080, 230 years after 1850.
beta is the somewhat uncertain fraction of CO2 radiative forcing provided by other atm. GHG and aerosols. While beta has significant uncertainty (see Lewis and Curry (2014)), primarily due to both warming and cooling effects of atmospheric aerosols, and with an aerosol concentration net cooling effect (not considering cloud feedbacks and other feedbacks that are incorporated into our definition of TCS) according to AR5 data. Based on AR5 CO2, other GHG and aerosol concentration histories since 1850, beta has an approximate value of 0.4 to 0.5.
However TCS(1+beta) = 1.8K with relatively little uncertainty, as this constant is dependent only on GMST rise since 1850 and uncertainty in CO2(1850) that we used as 284.7ppm, based on smoothed NOAA data from East Antarctica Law Dome ice cores. We used the smoothed ice core CO2 data up through 1958 and the NOAA Mauna Loa yearly average value for CO2(year) in subsequent years.
Using these numerical values for constants in the model and a tight upper bound on HadCRUT4(1850) = -0.22K, the forecasting equation can be written:
GMST(year) = -0.22 + 1.8{LOG[CO2(year)/284.7]/LOG[2]} deg K
The equation forecasts a tight upper bound on HadCRUT4 data scatter for all years except Super El Nino year weather events.
Since TCS(1+beta) = 1.8K, TCS = 1.2K if beta = 0.5 and TCS = 1.3K if beta = 0.4 that agrees closely with Lewis and Curry (2014) results for TCR and your TCR results in this article.
Using our above “climate model” that is actually only a validated GMST forecasting model, as a function of atm. GHG and aerosol concentrations, we project <1K additional GMST rise by 2100. For example our RCP6.0 scenario with CO2(2100) = 585 ppm and beta = 0.5, we obtain
GMST(2100) = HadCRUT4(2100) = -0.22 + 1.8{LOG[585/284.7]/LOG[2]} = 1.65K
HadCRUT4(2016) = 0.75 (preliminary) 1.65K – 0.75K = 0.9K additional HadCRUT4 rise by 2100.
Here in Texas, certainly one of the well explored oil territories on Earth, a 4BB oil field was found in the Permian Basin area, which is one of the most heavily explored oil regions in Texas. I say this not out of disrespect to Fernando or ristvan, but to say anecdotally what has been true since the petroleum age started: every time the peak of oil has been declared, and it has been declared several times, the declaration has been demonstrated to be incorrect.
Yup. Now figure the fracked total Permian as a percent of global production. Then get back.
There in Texas nothing new was found. I was being taught about the Wolfcamp and the Spraberry in the spring of 1978, when I was attending a geólogy for petroleum engineers course. In those days the shale section was mostly seen as source rock and something we had to understand so we could spot, drill, and complete better wells. But we knew that stuff was there.
What’s really new about those reservoirs is the ability to drill horizontal wells, fracture them, and make money. And as it turns out even today at $50 per barrel the oil price is higher than it was in the past. The other problem we have is that we simply don’t know where to turn to next. This is one reason why Permian lease sale prices are increasing so much. We are fighting like piranhas for whatever is left.
Peak oil again, so soon after its latest demonstrated failure? Finite minds can only imagine finite supplies, in direct proportion of one to the other. I expect there is a reason why we are continually treated to this silliness. Hint: what did P.T. Barnum say was “born every minute”?
Now all you have to do is point me in the right direction. Tell us, where are we supposed to look? Where will we be producing new oil reservoirs in 20 years? Any ideas?
And when we run out of coal we can start mining the hills.
I know of two railways that could be described as gravity lines, the first is the Ffestiniog Railway in Gwynedd, Wales. This line was built to carry slate from the mining town of Blaenaeu Ffestiniog to the harbour in the coastal town of Porthmadog where the slate was loaded onto ships. The line was constructed between 1833 and 1836 and was designed with a continuous 1 in 80 gradient down to the coast to permit the loaded slate trains to run by gravity for 13.5 miles from the mines to the sea.
The second is the Iron Ore Line a 247 mile long route used to transport iron ore from the mines at Kiruna in Sweden to the ice-free port of Narvik in Norway. These ore trains weigh 8,600 tonnes and use only a fifth of the electrical power they regenerate as they travel by gravity down to the coast.
So while we can use water falling under gravity to generate hydroelectric power the Iron Ore Line is an example of using rocks falling under gravity to generate lithoelectric power.
So here’s my latest Heath Robinson boondoggle:- Starting with quarries in The Himalayas, mine the rock, load it onto electrically powered wagons, run a gradient line and deliver the load to the plains generating electricity as the wagon load descends under gravity. The waste rock could then be transhipped onto barges, sent down river and used to create new land for Bangladesh and to build up their coastal levee defences.
A crazy idea? Of course it is, but a least it is green energy and after all this is what nature does every day in every sediment laden river in the world, delivering the rocks from the mountains back to the sea.
P.S. Now this scheme would really cause a rise in global sea level!
P.P.S. /sarc
WTF !
“Supply-driven projections” of MONEY more like !
Whether or not Wang is wite or wong, Wang wi-ceives the wonga.
Willis
as usual, an interesting article and whilst I do not disagree with your comments and conclusions drawn (other than I do not consider that we are running out of fossil fuel any time soon), I consider that one fundamental issue is overlooked.
I would suggest that if Governments adopt a policy aimed at mitigating climate change (rather than adapting to climate change) there has only ever been one key scientific question that needs to be answered, namely: Do any of our policies, such as the drive towards green renewable energy and putting a price on carbon (by whatever means the latter is achieved), actually reduce CO2 emissions, and if so by what extent? Thereafter it is simply a matter of politics and economics.
The inescapable fact is that our policy responses do not reduce CO2 emissions by any significant amount, and therefore one does not even need to address the Climate Sensitivity issue. If one is not materially reducing CO2 emissions, it matters little how sensitive the Climate is to CO2. We are not effectively reducing CO2 emissions save for economic activity depression such as the slow down in emerging markets. We know the following fundamental facts:
1. Wind and solar do not reduce CO2 emissions since they are intermittent and non despatchable and thereby require 100% back up by fossil powered generation.
2. Putting a price on carbon merely puts up the price at which the finished goods are sold; it does not take away demand, and hence does not reduce CO2 emissions.
3. Placing impediments on carbon trading, merely results in industry relocating from one geographical location to another and hence globally does nothing to reduce CO2 emissions.
With present day technology there are only a few options that could dramatically reduce our CO2 emissions, namely to go nuclear, or hydro and geothermal where geography/topography opens up such opportunities. But no Government is going down that road.
Switching from coal to gas, is partial decarbonisation, and we know that this works better than wind and solar; compare US emissions with Germany’s emissions these past 15 or so years. Fracking is obviously a sensible policy as a half way house, but again, apart from the US, no major Government is yet going down that route.
Just like the stoneage did not come to an end due to our running out of stones, the fossil fuel age will not come to an end due to our running out of fossil fuel. It will only come to an end when a cheaper and more abundant energy source opens up. The dawning of a new energy era will not be wind and solar, but will be some form of technological breakthrough probably with nuclear (whether fission or fusion) but possibly with solar located in space and beamed back to Earth.
As most politicians realise, it is the economy stupid. The economic realities are beginning to roost. Trump is a business man and he can see the farce of the present policies (prohibitively expensive, job destroying and achieving no worthwhile reduction in CO2). Much of the developed world is in near economic stagnation, and the costs of this fiasco are beginning to dawn as it is appreciated that the developed world will not get out of the economic doldrums whilst so heavily shackled by green policies. The US will lead the way, the rest of the world will follow some time later.
In the meantime, the climate will do whatever the climate chooses to do.
I agree with that mostly, except for wind and solar not reducing CO2 emissions due to need for 100% fossil fuel backup. Wind and solar will reduce CO2 emissions during the times when they can make use of wind and sunshine. Also, increasing price will cause a reduction of demand – what to argue there is how little, not that the reduction is zero.
I blame this on Global Hillary Warming
Then and now
Wasn’t climate change going to bring never ending droughts.
Yet another failed prediction.
The problem is that the world’s oil and gas resources are much more limited than the coal reserves.
Moreover, coal is in every respect the most polluting of the tree.
If we see a supply driven peak in oil or gas, we may have to replace that with coal.
This will increase several kinds of emissions including the carbon emissions. It gives more methane, more particulates, more SO2, more heavy metals, and more CO2 per energy equivalent.
/Jan
Here’s a link to work by Steve Mohr on coal resources
http://www.theoildrum.com/node/5256
Regarding: “If we want to see what temperature change we can theoretically expect during the 21st century from the possible atmospheric CO2 scenarios shown in Figure 2, obviously the value to use is the TCR”, and the Figure 3 boxplot:
To get .8 degree C temperature rise using 633 PPMV CO2 and 1.8 degree C per 2XCO2, I figure the 633 PPMV is an increase by a factor of 2^(.8/1.8) or 1.361. The effect of CO2 is generally considered as logarithmic. Log(1.361)/log(2) – .8/1.8. Meanwhile, 633 PPMV / 1.361 is 465 PPMV. So, a high side transient climate response of .8 degree C is not all of the (high side) warming to occur this century. This gets added to the warming resulting from increasing CO2 to 465 PPMV.
A more realistic high side warming this century using 1.8 degree C per 2X CO2 high side TCR and 633 PPMV as high side CO2 considers the CO2 increase to 633 PPMV during the preceding 70 years, which looks to me as being from 2005 to 2075 according to the Figure 2/5 graph. 2005 CO2 was about 379 PPMV. Log(633/379)/log(2) is .74. That times 1.8 is 1.33 degree C warming from 2005 to 2075. Although the few years centered around 2005 had global temperature being boosted about .1-.11 degree C by AMO and maybe other multidecadal oscillations, the amount of warming “still in the pipeline” from CO2 increasing to 379 PPMV was probably at least that much, leaving 1.33 degree C intact as a high side warming from 2005 to 2075.
And the warming won’t stop in 2075 but merely slow down using this scenario. The 633-PPMV-peaking curve in the Figure 2/3 graph is down only to slightly above 580 PPMV at the end of the century. Using that and high-side ECS of 3.1 degree C per 2XCO2 (according to “with the transient climate response (TCR) now re-estimated at 1.8 °C per doubling of CO2 (ECS increases to 3.1 °C/2xCO2)”): 3.1 x log(580/379)/log(2) means 1.9 degree C warming. Since this exceeds 1.33 degree C, high-side means warming will continue from 1.33 degree C in 2075 to somewhere between 1.33 and 1.9 degree C (although probably closer to 1.33 degree C) in 2100.
I follow this up using middle-of-the-road figures of 519 PPMV according to the Figure 3 boxcar plot and TCR of 1.3 degree C per 2XCO2:
It looks to me that a good choice of year for CO2 to be 519 PPMV is 2070. 70 years before that is 2000, when CO2 was about 371 PPMV. Log(519/371) / log(2) x 1.3 is .48 degree C warming from 2000 to 2070, and in this scenario the warming won’t stop but merely slow down around 2070.
The .3 degree C figure shown in the Figure 3 boxcar plot using TCR of 1.3 degree C per 2XCO2 and 519 PPMV CO2 means 519 is an increase by a factor of 2^(.3/1.3) or from 442 PPMV. Log(519/442) / log(2) x 1.3 = .3.
Willis,
I can’t remember out of all the posts on WUWT whether you’ve said anything about health, but with regards to your comment
“I’m going to go outside, take my shirt off, and charge my solar batteries.”
Have you seen this,?
https://people.csail.mit.edu/seneff/sulfur_obesity_alzheimers_muscle_wasting.html
Scroll down to point 8.
8. Is The Skin a Solar-Powered Battery for the Heart?
You may very well be closer to the truth than you think…
Dave