
Guest essay by Eric Worrall
Climate scientists finally seem to be learning from the acute embarrassment of colleagues who rashly trumpet the predictions of their climate models, as if they mean something.
Northeast warming more rapidly than most of US
New England is likely to experience significantly greater warming over the next decade, and beyond, than the rest of the planet, according to new findings by climate scientists at the University of Massachusetts Amherst.
The region’s temperatures are projected to rise by an average of 3.6 degrees Fahrenheit above pre-industrial levels by 2025, according to the study, published this week in PLOS One, a journal published by the Public Library of Science.
The scientists found that the Northeast is warming more rapidly than any other part of the country except Alaska — and that the 3.6 degree Fahrenheit rise in the region is likely to come two decades before the rest of the world gets to that point.
“I tell my students that they’re going to be able to tell their children, ‘I remember when it used to snow in Boston,’” said Ray Bradley, an author of the study and director of the Climate System Research Center at the University of Massachusetts. “We’ll have occasional snow, but we won’t have weeks and weeks of snow on the ground.”
…
The press release may seem assertive, but delve into the referenced study, and you find a little more caution about the claimed reliability of the predictions. That abstract starts reasonably confidently;
Consequences of Global Warming of 1.5 °C and 2 °C for Regional Temperature and Precipitation Changes in the Contiguous United States
Ambarish V. Karmalkar, Raymond S. Bradley
Published: January 11, 2017
The differential warming of land and ocean leads to many continental regions in the Northern Hemisphere warming at rates higher than the global mean temperature. Adaptation and conservation efforts will, therefore, benefit from understanding regional consequences of limiting the global mean temperature increase to well below 2°C above pre-industrial levels, a limit agreed upon at the United Nations Climate Summit in Paris in December 2015. Here, we analyze climate model simulations from the Coupled Model Intercomparison Project Phase 5 (CMIP5) to determine the timing and magnitude of regional temperature and precipitation changes across the contiguous United States (US) for global warming of 1.5 and 2°C and highlight consensus and uncertainties in model projections and their implications for making decisions. The regional warming rates differ considerably across the contiguous US, but all regions are projected to reach 2°C about 10-20 years before the global mean temperature. Although there is uncertainty in the timing of exactly when the 1.5 and 2°C thresholds will be crossed regionally, over 80% of the models project at least 2°C warming by 2050 for all regions for the high emissions scenario. This threshold-based approach also highlights regional variations in the rate of warming across the US. The fastest warming region in the contiguous US is the Northeast, which is projected to warm by 3°C when global warming reaches 2°C. The signal-to-noise ratio calculations indicate that the regional warming estimates remain outside the envelope of uncertainty throughout the twenty-first century, making them potentially useful to planners. The regional precipitation projections for global warming of 1.5°C and 2°C are uncertain, but the eastern US is projected to experience wetter winters and the Great Plains and the Northwest US are projected to experience drier summers in the future. The impact of different scenarios on regional precipitation projections is negligible throughout the twenty-first century compared to uncertainties associated with internal variability and model diversity.
Read more: http://journals.plos.org/plosone/article?id=10.1371/journal.pone.0168697
The content of the full study seems much less certain, with lots of qualification of the confident sounding assertions in the abstract and the press release.
… Under RCP8.5, all models indicate 1.5°C warming over CONUS before 2040 and 2°C warming before 2060, but the TCTs for RCP4.5 are distributed throughout the century. Notably, the ensemble mean temperature projections over CONUS reach 2°C warming by early to mid 2030s and 1.5°C warming by early 2020s despite large differences in TCTs for individual models. The observed warming over CONUS by 2014 relative to the baseline was roughly 1.0°C but a number of models suggest it to be over 1.5°C. Such disagreements could result from the mismatch in observed and simulated variability on decadal timescales
…
The lower bounds of temperature projections in Fig 3 typically represent how low climate sensitivity models respond to RCP4.5 whereas the higher bounds are determined by the responses of high climate sensitivity models to RCP8.5. Since the low sensitivity models indicate very little warming globally as well as regionally throughout the century, the lower bounds of projections are comparable across regions.
…
The Northeast is projected to cross the 2°C threshold about 15 years earlier than the South and about two decades before GMAT. For instance, about 80% of the projections indicate 2°C global warming by 2060 whereas the same percentage of projections cross the 2°C threshold in the Northeast by 2040.
…
All regions in the contiguous United States are projected to cross the 2°C warming threshold about 10-20 years earlier than the global mean annual temperature. While there is a large spread in TCTs across all regions, 75% to 90% of the models reach 2°C warming by 2050 for every region in the US. We believe that our estimates of TCTs based on 5-year means of annual mean temperatures may be conservative since we require that all the subsequent 5-year means beyond the identified threshold crossing time exceed the selected temperature threshold. The unpredictable nature of internal climate variability could advance or delay TCTs by a few years to a couple of decades regionally as demonstrated using the initials conditions ensemble. But this uncertainty in regional TCTs is smaller than the spread arising from using different models and two different scenarios. The consequence of large climate variability at regional scales, however, suggests that it may prove difficult to distinguish between the consequences of global warming of 1.5°C and 2°C for regional changes.
…
A cooling trend in the southeast US, the so called “warming hole”, in the second half of the twentieth century was not captured by CMIP5 models.
…
On the other hand, the eastern US is projected to reach the 2°C target in the 2020s regardless of the scenarios.
…
The CMIP5 multi-model ensemble used in this study samples the structural diversity in model formulation, but was not designed for systematic exploration of uncertainties, and therefore may not span the full range of outcomes in climate projections [39]. Additionally, the use of one realization for every model is inadequate to capture the effect of internal variability that plays a significant role in driving regional changes from years to decades.
…
If future generations of models reduce contributions from internal variability and model uncertainty substantially, studying precipitation response to different scenarios may become important. This, however, is unlikely given that the internal climate variations over CONUS remain large and highly unpredictable over the next 20-50 years.
Read more: Same link as above
Climate science – where any observation is acceptable, any uncertainty can be accommodated, and no theory is falsifiable.
Lovely stuff. Post-truth science.
Perhaps not post-truth so much as Faith-Based Science.
Cosmic revelation needs no evidence. Since climate has some connection with the Cosmos, this must apply to climate science as well.
As Dr Tim Ball said somewhere, GIGO means Garbage In Garbage Out – which applies to this stuff. But, GIGO also means Gospel In Gospel Out, which applies even more to this stuff .
Nobody can predict future weather–full stop. Most of us now consider The Weather Channel “entertainment.” This BS has about as much traction as my boots in the New England mud!
Well it seems we now have a totally new branch of mathematics. What should we call it ?
Well considering the algorithmic processes it seems that “unstatistics” would be a good descriptor.
And just like ordinary statistics; it is akin to Numerical Origami. You take a 100 mm square piece of special paper, and you fold it according to algorithms, sometimes thousands of years old, and you get an object which you can give a name, such as “jumping frog” or “swimming swan” or “whatever”.
Statisticians do a similar process, but they do it with a finite set of finite real accurately known numbers (any such set). And they publish the results under various names; like ” GISSTemp ” or ” HADCrud “, which don’t look anything like frogs or swans.
So now they have this new game to play. You take a wad of crumpled paper that somebody tossed into the circular file, and you apply new rules that follow a successive unfolding of the blob of paper, until you get to some sort of flat sheet without folds. So it’s an Unorigami game, and what you end up with might be some unrecognizable shaped plane figure; or it might have some script on it that might be intelligible or not, which you can publish for credits.
So now we try this unstatistical unorigami game on the planetary climate.
We change the global mean Temperature from 288.0 K and we increase it to say 288.3 K or perhas even 288.7 K.
Now using our terafloppy computer and the input data of a 0.3 or perhaps 0.7 deg. C rise in global Temperture; we apply the new principles of unstatistics, and we unfold all the creases and come up with a map of the globe, in some Mercator projection or other distortion, showing what the temperature change at Martha’s Vineyard, or Miami Beach, or Cabo San Lucas; well even “whatever”.
So think how useful this is. Instead of jetting all over the globe to measure the local temperature; you just measure the global average Temperature (maybe that can be found in Paris), and then you untrapolate that to get the desired local data map to show to people.
You can even unogami it in time space to find out how it will change with the four seasons.
I think the CSRC may be on to something here. Think of all the climate research you don’t need to do, and all the unnecessary climate scientists you can redirect to useful work.
You just pick a number, and then unorigate it to get the six Pm T&V weather news.
If you can develop this new mathematics of unstatistics to a greater degree, who knows, you might be able to eliminate the Library of Congress, and Just replace it with a single word projected onto the Washington Monument, or Maybe the Massachusetts State House Dome.
This could take texting to an entirely new level; unscrambling long acronyms into intelligent essays.
g
A little recent history about Winter weather forecasts:
The National Weather Service (NWS) of the USA forecast a warm winter for 2014-15 and my friend Joe d’Aleo told me in October 2014 that the NWS forecast was seriously incorrect, and that the next winter would be particularly cold and snowy, especially in the populous Northeast. This was the second consecutive year that the NWS has made a very poor (excessively warm) Winter forecast, in Joe’s opinion – and he and his colleagues at WeatherBell have a great track record of accurate forecasts.
Joe and I had been working together on a paper on Excess Winter Mortality, and I suggested to Joe that this false “warm winter” NWS forecast was dangerous, especially if the country and its people were unprepared. Joe agreed, but did not know how to tackle the problem.
I proposed an approach, and we prepared a presentation for my friend at the US Energy Information Administration (EIA). Joe then prepared his own monthly Winter Forecast by region for the EIA, who re-ran their winter energy demand calculations. Using Joe’s forecast, the EIA projected 11% more winter energy required for the USA than the “warm” NWS forecast had projected.
After that brutally cold and snowy winter, a back-analysis showed that the actual energy used was 10% more than the NWS forecast projection, and just 1% less than Joe’s forecast projection.
(Note: all numbers are from memory.)
So I think we did a good deed.
As far as the subject 2017 paper is concerned, I expect the climate in the US Northeast to get colder, not warmer, starting soon. Those states that have adopted foolish green energy schemes will soon find that green energy is not green and produces little useful energy.
Regards to all, Allan
Postscript:
I got another Boy Scout merit badge this summer, for shutting down a very dangerous sour gas threat near Calgary.
For all you warmist scam artists out there: This is what real credibility looks like.
You make a prediction that actually proves to be correct – you should try it sometime.
https://wattsupwiththat.com/2016/08/25/svensmark-publishes-solar-activity-has-a-direct-impact-on-earths-cloud-cover/comment-page-1/#comment-2288041
_____________
Posted two years ago – Feb 2015 – re the cold winter in the USA 2014-15:
http://wattsupwiththat.com/2015/02/16/new-paper-confirms-the-hiatus-is-not-occurring-at-the-poles-undermining-the-efforts-of-cowtan-and-way/#comment-1861633
This post is dedicated to the good people of New England, buried under record depths of snow,,,
“Children just aren’t going to know what snow is.”
– Dr David Viner, Climatic Research Unit (CRU), University of East Anglia
http://www.independent.co.uk/environment/snowfalls-are-now-just-a-thing-of-the-past-724017.html
Boston already has set a new record for monthly snowfall this February, and it’s only the middle of the month!
OK you warmist imbeciles, repeat after me, v-e-r-y s-l-o-w-ly: “I blame global warming.”
_____________________
MORE SNOW, INTENSE COLD COMPOUND THE MISERY
http://www.bostonglobe.com/metro/2015/02/15/snow/2IO1E0ibEJ1PK1sC1wPAyO/story.html
By Jennifer Smith and Jeremy C. FoxGlobe Correspondents February 15, 2015
Boston braced Sunday night for a life-threatening deep freeze after a blizzard bombarded parts of the region with nearly 2 feet of snow and gale-force winds.
The sixth winter storm in three weeks made February Boston’s snowiest month on record, with 58.5 inches, besting by more than 15 inches the previous record set in January 2005.
Temperatures were forecast to plunge below zero overnight Sunday, with wind chills as low as 20 to 30 degrees below zero, and to remain well below normal all week, according to the National Weather Service. Forecasters warned that another storm could hit the area beginning Tuesday evening.
***************************
You think?
Well, who would guess that the energy involved in powering the water cycle could be a magnitude higher than radiative effects?
It’s not like there is much weather on Earth to make it obvious, is it?
What are you going believe, me or your lying eyes…. 🙂
I think I read that Boston averages 35 days with an inch or more of snow on the ground. Record was over 80 days sometime in the 1940s. Idea that it won’t snow in Boston in the possible timeline Bradley gives is indefensible. Hopefully they actually give it 10 seconds of critical thought. But the realization that they are paying tuition or taking on loan debt to be taught by people like this…must be painful.
Winter of 2014-2015 Boston all time record snowfall 108.6″
http://www.bostonglobe.com/metro/2015/03/15/historic-winters-have-delighted-frustrated-and-imperiled/TXXRIMmcPbVDyj3JvXP2YI/story.html
naaah they used snowcannons to fool the skeptics to achieve that record….or it’s a hoax false news….
(do i need sarc tags?)
Are you implying that some idiot authoresses a salary payment for these morons ?
Hi there, I was “given” a degree from the “University of Moronachusetts”
Say, Ray Bradley? Ray Bradbury told more truth in his science-fiction!
I was thinking that same thing, but didn’t want to soil Bradbury’s image.
Otter
…Ray Bradley? Ray Bradbury…
Should The Professor rename his classes to…Fahrenheit 4.51…or…Something Wicked This Way Comes?
Too Much Dandelion Wine?
I suppose some places will rise and fall faster than the global mean. And other places will rise and fall slower than the global mean. That what the mean means.
It’s like 50% of the population is below average intelligence !
Actually below median intelligence.
Or both, depending on the distribution. Me, I think both. Skewed low, not high. Probably also mode below median. Else we would not have CAGW ‘settled science’.
i don’t understand what you guys are talking about.
DonM, a great joke. If you didn’t you would not have posted. Plus many yuks.
Well if I’m below the mean it’s cos too many of you are above it.
Don’t be so mean!
What do the above average average folks say?
For example Richard Feynman? Oh that’s right, he died in 1988. I guess they didn’t have real climate back then, only weather. The climate models were so primitive they were laughable, couldn’t predict 50 years ahead, even.
Weather’s still only good for about 3 days.
Here in Sydney OZ, we see the weather pattern nightly and it takes about 3 days for the highs/lows to move from Perth in the West to Sydney in the east.
No need for maths and models, just say Sydney in 3 days will be like Perth now.
Only roughly right of course but works for most people. Plus you don’t have to worry about the models giving you shonky output! Better to be roughly right reliably than precisely wrong or right unpredictably.
I’m willing to bet that people with above average intelligence also have an above average carbon-footprint.
What, go behind the PR to the abstract? Then find that suspect and actually read the peer reviewed paper itself? For shame. That is not how clisci is done. What is this world coming to?
(If you think a sarc necessary, please go find a new think.)
ristvan: So true. I am constantly hit with someone commenting about this or that prediction and I find if you actually read the paper, that prediction is half or more fabricated. Studies quite frequently show less certainty than their abstracts. Yet those who claim to “know” about the science generally have no idea what the study said and don’t care for that matter.
Sheri, yup. I did that for years, and posted some of the worst offenders as examples in sections two and four of my ebook Blowing Smoke. Enjoy especially section four Greenhouse Effects, NonScience, Bad Good News, and Last Cup of Coffee. Foreword from Judith Curry worth a read in itself.
After the 2014 book published, see my subsequent CE guest post on the Totten glacier alarm for yet another example. If there ever is a second edition. totten is in it.
“Yet those who claim to “know” about the science generally have no idea what the study said and don’t care for that matter.”
Reminds me of Eric Hoffer in The True Believer:
Yes, sexed-up press releases are the norm now relying on journalists to not bother or have the time to read anything of the actual report. You can only laugh or cry at the stupidity of it all. We have had press coverage of a report on Brexit here that trumpeted claims made in the report that were not.
All universities now have PR departments whose whole purpose in life is to keep the government gravy train on track.
Weather – what you can remember. Climate – 30 years of weather, averaged.
Yes.
Wow. I decided to look up an old saying before sending –
“Climate is what you expect. Weather is what you get.”
http://www.goodreads.com/quotes/84044-climate-is-what-you-expect-weather-is-what-you-get
It turns out that the famous Climate Scientist Robert A. Heinlein said it. That would be consistent with another observation here about a quote from Climate Scientist Ray Bradbury.
Climatology is what you expect. Whether you get it is another matter.
Neil: Interesting, but totally irrelevant. Climate scientists and meterologists are the ones who came up with the 30 year averaging of weather being “climate”. Climate is defined very loosely in many places, such as the “typical weather”, etc. As for the cute saying, it’s actually based on reality and not any one speaker—you know, like science is supposed to be.
Or as Mark Twain quoted Climate lasts all the time and weather only a few days.
Sheri at 3:53
The “30 year” thing comes from a meteorologists meeting in 1935 (?) in Poland, I think, where they sought a common method of reporting weather data.
Before Computers (BC) they went with a period that changed only every 10 years, such as 1971-2000 or 1981-2010. The numbers therefrom (averages, etc.) are called “Normals” despite folks objecting that nothing about weather is normal. Next period will be 1991-2020.
Another part of the choice was to present to the citizens a set of weather parameters that a young adult could relate to. My mother would hold her hand at her waist and tell us she had to walk to school 3 miles (true) in snow that deep, and then home again – uphill both ways. Because things long before our own time are hard to relate to the meteorologists thought to give us something in the newspaper or on the radio we could relate to.
This was not meant for “climate science” and if one wants to understand “climates” look to the early Köppen classification that used vegetation boundaries.
I have always regarded the 30-year average as a totally arbitrary, hand-picked figure. What would be wrong with using the actual long-term average, stating the start year? It would not bother me in the least to see that today’s average high since records began is 45, the average low for the same period 25, mean 35. If records in Richmond VA began to be kept in 1800 (let’s say–I don’t know), that reading would look like this:
hi 45 lo 25 mn 35 [1800 on].
Or, if several locations are listed, a heading above the list could state:
All figures are from complete-term records, with the start year in brackets.
Perhaps I am ignorant of a perfectly sound reason for the 30-year average, but until I know that reason, I will continue to harbor my suspicions that “they” are hiding something.
See my comment just above.
Aren’t these the same people that blamed the California drought on global warming or climate change or whatever they now call the meme?
I wonder if their climate grant-generating nirvana will ever end!
How To Read Original Research
* Title
* Author affiliations
* Three to five sentences of the abstract
* blah blah blah, skip all that materials and methods crap
* blah blah blah, skip all that discussion crap
* Conclusion, focusing ONLY on the words you’re interested in reading, while ignoring all qualifications.
Hope this helps.
Nope. Read the MSM PR released by the Univeristy about it. Full stop.
Examples in my most recent ebook include Burning NonScience, Shell Games, Lets play hockey again, Good bad news, and eponymous Blowing Smoke.
Rud, I think the modern way is to read your Facebook pal’s comment on the MSM presenting or misrepresenting the university PR staff. The errors included at that stage are:
– Conclusions are not necessarily supported by the actual observations, if there were any observations
– The PR staff ignored the mays and mights of the conclusions
– The MSM didn’t understand the former or latter, but wanted to make an even better front page
– Your FB friend didn’t understand any of the above, but cites hir interpretation as a scientific fact.
After this has happened, you role is to be the stubborn science denier, even when you point out the fact that the original paper does not support the claim. It’s like trying to talk to a mob.
If you complain about a national public radio for spinning, they will claim they didn’t make a substantial error in quoting the university PR. They are more interested in denying the need to think than making sure their message is truthful. They think they are morally right even if they could be proved to be technically wrong. And they won’t do the thinking for themselves, i.e. they will not follow any path of thinking that would cause them to realise they were totally and unacceptably missing their fact-checking.
I’ve long ago decided that since this is a political movement, it will last until its internal energy has been used. That is, we will have to take all this crap until the communists find another thing to be concerned on. Historically I expect that would take no more than a couple of decades. Much depends on how insignificant the future consequences of global warming are. If I’m right, this era will end before 2040, where new issues will replace the position of the climate change as a number one moral topic. I’m pretty certain the migration crisis in Europe is driving the local atmosphere towards less interest on climate and more interest on how to combine a easy-peacy welfare society and poorly controlled mass immigration. So the communists will be busy finding rules how to talk about religions instead. Not that I’d enjoy that, it has been too horrible already.
Oh, I used the word denier. Pardon me.
A simpler way: do a text search for the term computer models, if positive, stop reading.
What utter baloney, akin to all their other previous failed predictions of an overheated, ocean-flooded, snowless world. What a joke:
“Entire nations could be wiped off the face of the Earth by rising sea levels if the global warming trend is not reversed by the year 2000.” -Noel Brown, ex UNEP Director, 1989
A billion people could die from global warming by 2020.” -John Holdren 1986
“By 1995 somewhere between 75 and 85 percent of all the species of living animals will be extinct.” -leftist Senator Gaylord Nelson, 1970
“European cities will be plunged beneath rising seas as Britain is plunged into a Siberian climate by 2020.” -Paul Harris, 2004, UK Ecojournalist
Plus: 1988: a 1988 news report on the findings of the UN’s World Meteorological Organization, the forerunner to the IPCC, warning that the seas will surge 83 Feet inland and the planet’s average temperature will go up by 2°F by 2020: https://hauntingthelibrary.wordpress.com/2011/07/03/flashback-1988-michael-oppenheimer-warn-seas-to-surge-83-feet-inland-by-2020/
I am going to go out on a limb and predict that the next fifty years will be more or less like the last fifty…more of the same, with normal variability superimposed over all.
In other words…nothing dramatic.
I’m not going to give you any grant money for that feeble effort. What happened to the unicorns dying in the heat, armies of dwarves drowning because the water rose too high for their short legs, etc?
Hivemind, don’t forget FATBOG. Invented by NumberWatch, it stands for Fairies At The Bottom Of the Garden. It is all their fault. And if you say there aren’t any fairies, then you are a Fairy Denier, and must be shunned.
December 28, 2016,
By John R. Ellement and Olivia Quintana Globe Staff and Globe Correspondent
“Boston may dodge the worst of a coming winter storm, but parts of New Hampshire and northwestern Massachusetts are bracing for up to a foot of snow on Thursday. The National Weather Service has issued a winter storm warning in effect from 9 a.m. Thursday to 10 a.m. Friday for many areas north and west of Worcester. The snow could cause hazardous driving conditions with snow-covered roads and poor visibility. The heavy, wet flakes could also bring down tree limbs and wires, causing scattered power outages.
Temperatures will be in the high 20s.”
So, no more snow in New England, Eh?
From what I see everything these idiots predict the opposite occurs. If I lived in Boston I would be looking at snow blowers.
billions of dollars on climate research…
…and all they can do is extend a straight line
The timeline is only 8 years out, I keep a 10 year calendar, this is all ready tagged, linked, the reminder is set for 1/13/202, at 8:25 am … oh what fun …
Dag, Mark,
I think your alarm clock didn’t go off. You’re almost 2000 years too late! :>)
Phil , LOL but for the sake of science, 1815 years. ( if he meant AD.) 🙂
Wow! CYA for sure. Try to deconstruct all the conflicting factoids presented, at the end of it, did they say anything at all?
Well, actually, they did:
“the eastern US is projected to reach the 2°C target in the 2020s”
So how did they come up with this dramatic statement? Ray Bradley has been looking out his window, I can tell.
Allow me to explain:
The Connecticut River flows right along side of the UMass campus. For whatever reason, the winter weather along the river and in the river valley can be uncommonly mild. I have driven through the UMass and Amherst area and seen the grass is still green in December, and the ground is bare in January. This kind of mild weather is unheard of just 5 miles either side of the river valley. But near the river, it is quite common, and the abrupt change from a solid snow pack to bare ground as you travel along can be quite dramatic.
So the good climate scientist looks out his window, observes mild conditions, sees Global Warming, and writes a paper.
So just how exactly is the eastern US going to warm by 2C in the 2020’s.?
How about they give some details in to just how this state of affairs is going to take place.
Or would that require thinking, rather then just been simply lead by any crap that turns up on their climate models.
taxed: Simple. Newton’s law of cooling will simply stop applying.
Trebla
Yes without any details in to how this would happen in the real world, then this claim is utterly Micky Mouse.
The only way l could see it happen.
ls there to become a persistence of high pressure blocking just off the eastern coast of the USA.
Which would place the eastern side of the USA on the “warm side” of this blocking. Thus keeping any Arctic air from pushing south down across the area.
” trumpet the predictions of their climate models ”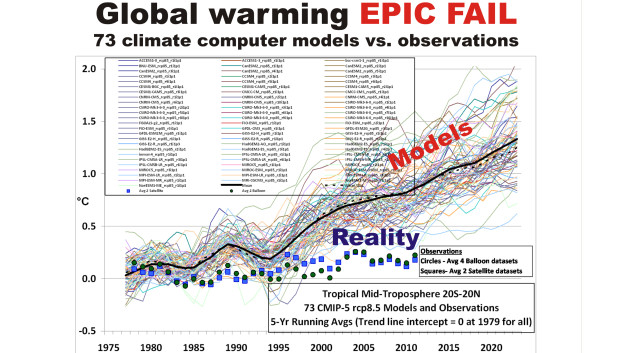
I’d think that’s something they’d not want to do any more, if Crying Wolf means anything:
Eric:
This is a post from Spencer’s blog giving a “peer-review” of that graph.
There was no response from Roy.
Would you care to answer for him?
From:
http://www.drroyspencer.com/2013/06/still-epic-fail-73-climate-models-vs-measurements-running-5-year-means/#comments
“Glenn Tamblyn says:
June 8, 2013 at 1:02 AM
Roy
Some comments.
You have plotted TMT from UAH & RSS against models for 20N to 20S.
Exactly what is the model data? Surface Temps; temps at some altitude; temps averaged over the entire troposphere; some weighted average of the troposphere results? This is unclear and needs to be spelled out if there is to be any meaningful comparison.
Surely you recognize that the TMT channel is biased low due to the fact that around 1/4 of the signal for TMT originates in the Stratosphere which has been cooling significantly. Thus TMT is not an accurate measure of what has happened in the middle Troposphere. You most definitely should be aware of that since you and John Christy produced the first version of the TLT product many years ago in part to try and remove this cool bias from TMT. So a direct comparison between TMT and the models isn’t valid.
Alternatively you might apply the weighting function for the TMT channel to the temperature profile produced by each model in order to produce what the TMT channel would expect to see for each models output. That would be the a valid way of comparing them.
But just comparing TMT to unweighted model output isn’t valid.
Why didn’t you also include the TTT product from RSS that is based on the methods of Fu & Johansson 2005 which is an alternative approach to showing a mid tropospheric temperature series with much of the stratospherics cool bias removed? This is giving a trend of 0.128/decade vs the TMT product from RSS which gives 0.091/decade – a significant difference.
Then there is the 3rd group producing temperature satellite products at STAR/Nesdis which you have not included. (http://www.star.nesdis.noaa.gov/smcd/emb/mscat/index.php)
Why didn’t you include their results? They produce a TMT product that is reporting a trend of 0.124/decade without any compensation for stratospheric cooling. If the ratio between the RSS TMT and TTT products is any indicator, STAR/Nesdis with the Fu & Johansson algorithm applied might well give a trend something like 0.17 which would bring it up into the range of the model results
Surely also you recognize that many researchers don’t believe that the balloon data is terribly reliable, with upper atmosphere data particularly being biased cool due to equipment design issues.
Are the model results single runs or do they represent multiple runs for each model?
If you used some of the approaches I suggest then up to 2000 you might actually see reasonable agreement between the models and data.
There is divergence after 2000. Did you evaluate the models to see which ones reproduce the change in vertical distribution of heat buildup in the oceans that has been observed in the ARGO data in the last decade or so? These would be the models that one would wish to compare observations against to evaluate how well they are performing.
As to looking at Climate Sensitivity from this data, as I point out, when some approach is used to compensate for the cooling bias in the satellite data then model/observation agreement from 1975-2000 is likely to be fairly good.
And with the change in heating distribution in the oceans over the last decade any attempt to estimate CS from atmospheric temperatures during this period will significantly underestimate the value. One decades data is too short a time to attempt this anyway.
Even then, this approach at best can still only estimate Transient CS. Full Equilibrium Sensitivity can’t be found by looking at short term data.”
There is now more up to date data that shows that the tropospheric sat temp data is in error, which I have posted several times here.
You and others may choose to ignore it.
But both UAH and RSS have said there IS a problem.
The old MSU sensor onboard NOAA14 is NOT in agreement with the current AMSU sensor on NOAA15.
It is running cold.
Hence a major “adjustment made from RSS v3.3 to v4 and the move to TTT.
UAH’s change? …. nothing.
They simply ignore it and state that the new sensor is of “Cadillac quality”.
Still don’t agree with the sonde data though ……
http://postmyimage.com/img2/792_UAHRatpacvalidation2.png
If our projections fail, we just stretch out the projection timeframes until the end-points are safely beyond reach in our lifetimes, or, at least, during our working careers.
Unless the memory hole is extremely efficient these sorts of reports will stand as stark reminders of just how badly extremists will corrupt science – and society- if given the chance.
Can anyone point to a single global warming prediction that has actually come true?
Just one…..?
Good question. And I don’t think there are any. Not one!
I’m too tired of all this nonsense to check “The List” but you can give it a try:
http://www.numberwatch.co.uk/warmlist.htm
“A complete list of things caused by global warming”
And I doubt it is complete.
I have not checked, but add this to the list :
Yesterday’s tv news channel in Montreal said the dreaded potholes were the result of climate change.
I don’t imagine the New England farmers will mind having a longer growing season nourished by higher atmospheric CO2 if the prediction does come to pass.
From the model output analyses, anything could happen and the projection will be correct. And that folks is Garbage science.
( Enter anything ) is worse than we thought!
Like a highway billboard that displays (Your Ad Here).
Eric, your credo “Climate science – where any observation is acceptable, any uncertainty can be accommodated, and no theory is falsifiable.” is a keeper.
It should be on the sign in front of the Model Fellowship of Mann, Church Of Omnipotent Greenhouse In Carbon.
I like: “Climate science – where any observation can be adjusted, any uncertainty can be accommodated, and no theory is falsifiable.”
How about: “…any adjustments of observation are acceptable…”?
The AMO probably stays positive until close to 2025 so they might get lucky with little cooling but I can’t see any warming. If the AMO drops a little quicker then they are SOL.
Comparing warming over land to global warming. The goal of limiting warming to 1.5 K or 2.0 K (as stupid as that goal is), was based on the expectation that surface temperature over the land would be rising faster than over the globe as a whole. A 1.5 K or 2.0 K “regional threshold” exists only in the imagination of the authors. In a few months, neither threshold is likely to remain part of US policy.
Wait, can’t these guys let the existing predictions expire before they repeat them?
Check this one out (again):
SHUMLIN: Any reasonable scientist will tell you that we’re going to rise anywhere between another two and three degrees in the next 30 years. That means that New Jersey’s climate is moving to Vermont in the next decade. That has tremendous implications in our economy’s ski, maple-sugar making, leaf-peeping and the list goes on and on. So we are — I at least am — looking at this with a major sense of panic.
Check out the date on that one:
http://www.marketplace.org/2007/04/18/sustainability/when-theres-less-white-green-mountain-state
Only three months to go!
…where any observation is acceptable, any uncertainty can be accommodated, and no theory is falsifiable.
Well, hopefully the bartender is a good listener.
Of course you can’t falsify theories. That would be worse than a micro-aggression. I need to go to my safe place now.
Here is the January snow totals for Boston, MA from 1920 to 1916. I don’t see anything indicating a reduction in recent years. Wish I had a graph:
http://weather-warehouse.com/WeatherHistory/PastWeatherData_BostonLoganIntLArpt_Boston_MA_January.html
Was looking for snow totals for the entire winter for Boston…
Your 1916 should be 2016, right?
Oops yes, 2016…thanks
Looks like the record year for snow in January in Boston was 2005 with 43.30 inches. That’s a lot more recent than 1920 to 2004.
I’m going to go out on a limb here, but my research shows that it’s likely that by 2025 Ray Bradley and his predictions will elicit a “What? Who?” from anyone. Let me know when we get there. I’m sure of my analysis.
Slow learners, this climate fear mongering, idol-worshiping crowd.
Meanwhile, back on the actual Earth…Northern Hemisphere total snowfall totals smashing all records.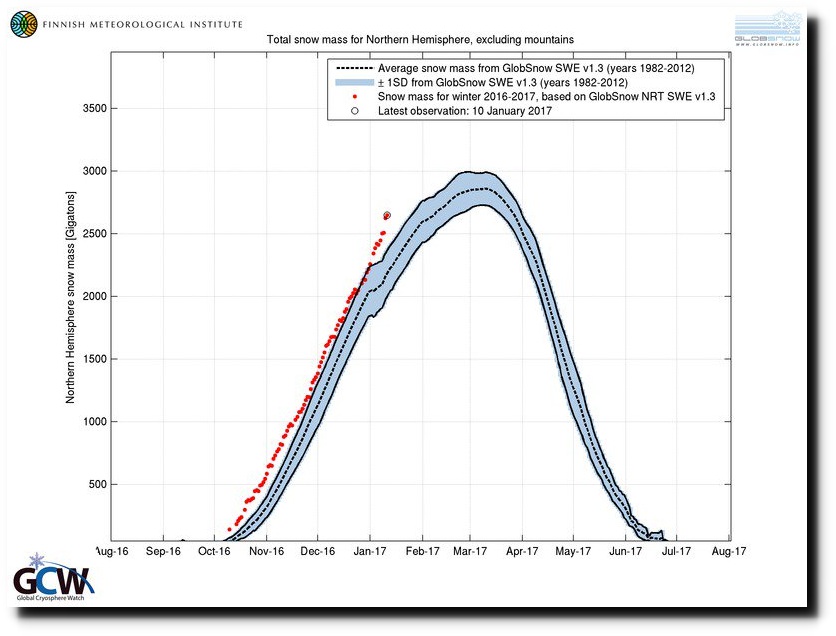
Men old soul,
I am not quite sure about ‘smashing all records’.
Now, certainly above the one SD line, so clearly in the top sextile.
Do you – we – have access to the 2 SD limits?
Do we not need to be fairly careful with our claims on here?
We can be a little short with some watermelons – Karmalkar and Bradley most recently . . . .
Auto
My first thought was it looks like 2 SDs, not too exciting yet.
interesting…..
I see the Boston Globe are also parrotting 7 feet sea level rise by the end of the century-
https://www.bostonglobe.com/metro/2017/01/13/rising-seas-threaten-jewel-trump-real-estate-empire/bsleB73TesDoLcVxJBK9LP/story.html?p1=Article_Recommended_ReadMore_Pos4
Well that’s an inch a year so we should be able to check that 4 inches at the end of Donald’s first term.
My parent remember the 1960s, when snow used to drift so high that you left home via second story windows sometimes.
Yeah, I drove through the White Mountains in ME/NH in a late 60’s winter.
One town had 13 Ft overnight. The lucky ones lived in 2 story homes…
“Climate science – where any observation is acceptable, any uncertainty can be accommodated, and no theory is falsifiable.” – Love the ending! Absolutely. Hallelujah and pass the grant money.
TRM
“Hallelujah and pass the grant money.”
Brilliant. And spot on.
Maybe the new POTUS, next week, will cut the budget deficit by the climastrophe billions.
I’m not holding my breath – but certainly hoping.
Auto, to the right of the Pond [with North up], and so near the French bits, where they do excellent wine.
“Climate science – where any observation is acceptable, any uncertainty can be accommodated, and no theory is falsifiable.”
Not sure what this means. Their figure 1, for example, clearly shows the full model range of projections. If observations fall outside that range then clearly the models will be falsified. If they fall outside the upper or lower 5% of the range for more than 10% of the projected period then they will also be falsified, etc.
As of 2016, the thick black line in figure 1 (CRU CONUS observations) will probably be at or above the CONUS RCP8.5 mean. That is, annual observations will likely be warmer than the multi-model average for the highest emissions scenario, some 11 years into the projected period. The models are nowhere near being falsified. In fact, if anything, they are currently supported by observations.
Another Al Gore moment in time….
Fake News or Fake Science…. They both have the same credibility..
Who you going to believe, your lying Data or the Model?
“The observed warming over CONUS by 2014 relative to the baseline was roughly 1.0°C but a number of models suggest it to be over 1.5°C”
Mods, I have a comment that seems to have gone to moderation.
Can you check for it please?
Global Warming will make climate predictions extinct? It’s worse than we thought!
We’re doomed.
Your final paragraph is a classic:
“Climate science – where any observation is acceptable, any uncertainty can be accommodated, and no theory is falsifiable.”
Ambarish V. Karmalkar, Raymond S. Bradley:
Their lips are moving and all I can hear is blah blah blah…
You can see it clearly on this graph of annual accumulated snowfall at the Revelstoke, BC ski hill. Heck, I’ll have to get my rock skis out in JUNE if this keeps up:
http://www.revelstokemountainresort.com/conditions/historical-snowfall
And then of course there is Mamoth, currently digging out – no snow you say? Really?
http://mammothsnowman.com/mammoth-mountain-snowfall-history/
Not to mention Central Oregon! We’ve had snow on the ground here in Bend for going on seven weeks now. Total amounts are challenging records.
They are not embarrassed themselves, of course. Only their colleagues are embarrassed.
Anything to avoid admitting they were wrong…..
For anybody concerned about reduced precipitation (which this year has fallen primarily as snow), they only have to look this far:
http://www.wrcc.dri.edu/cgi-bin/sno_narr3_pl
Snowpack is accumulating in the Western US to the point that if it continues, there will be flooding in the spring.
So – it mentioned Alaska: “the Northeast is warming more rapidly than any other part of the country except Alaska ..”
Well Alaska is certainly hotting up, isn’t it?
http://www.ktuu.com/content/news/2016–409402135.html
“In 2016, at least 14 communities around the state recorded their highest average temperatures ever. That includes Anchorage, where the average temperature was 4.5 degrees above normal. And in some places like Utqiaġvik, on the North Slope, the average temperature increased more than 7 degrees.”
“In 2014, the state of Alaska recorded its warmest year on record – records that in some cases have been kept since the 1920’s. 2015 was another warm year, before 2016 temperatures shattered the record. “Three years in a row now, the three warmest temperatures on record,” ”
shouldn’t this site be posting articles on the extraordinary situation in Alaska?
Oh, and the sea ice is still at a record low and expected to drop in this week’s continuing storms:
“…shouldn’t this site be posting …”
Griff,
You just did so. Thanks.
Griff, You can see your same account of arctic ice on Weatherbell.com’s weekend video, along with why it was predicted and why it is not a tragedy. Give it a try, bloke.
Yawn, there are about 13 Wadhams of ice floating in the place,Griff.
During most of last Glaciation period,there were less snow and Ice in most of Alaska than now. Meanwhile you continue to ignore the massive areas of cold and snow in Europe,Asia,Canada,America, Saudi Arabia,Greece and more.
Examples:
Black Sea Freezes For First Time in 62 Years – Video
Colorado ski resort closes – Too much snow
Snowfall tops 200 inches in CA, OR, NV and WA
Greek islands buried under 2 meters of snow – Before and after videos
Perth, Australia – Coldest winter in more than 20 years
Record snowfall on Prince Edward Island
Coldest Orthodox Christmas in Russia in 120 years
Record snowfall in Istanbul – More than ½ meter (19 inches)
Idaho – Most snow on the ground, any day of the year, any year
Snowing in New Zealand – In high summer
Record snowfall in Newfoundland – And no snowplows at night
Billings breaks snowfall record for entire month of December
Baker City, Oregon, closes in on snowfall record
Heavy snowfall on Island of Crete
Rare snowfall in Athens
Biting cold in Pakistan
Strongest blizzard in 80 years to hit Palestine
and more…….
https://www.iceagenow.info/
You bore me with your stupid Arctic is dying drivel.
Sunsettommy:
Then why does NH data from UAH v6beta5 TLT not indicate that “cold”
Nov 0.41
Dec 0.19
And North Pole …
Nov 0.96
Dec 0.00
Re a baseline of 1981-2010:
(Used due denizens preference and data availability)
http://www.nsstc.uah.edu/data/msu/v6.0/tlt/uahncdc_lt_6.0.txt
Snow is not a measure of cold.
In fact the closer to 0C then the more will fall.
It is more a measure of atmospheric water content.
Which is greater at warmer temps.
Shouldn’t you be apologising to Dr. Crockford for attempting to impugn her professional credentials, you nasty little liar?
http://www.bbc.co.uk/news/world-europe-38623669
“Ski World Cup: Lauberhorn race cancelled because of too much snow”
ruined the piste apparently.
Hmm… avalanche conditions?
Also, from that article:
Here in Colorado, years ago, climate “scientists” were getting ski operators worried about the forecasted lack of snow in the area — saying that ski areas would no longer be able to stay open. Lately, they’ve been having the opposite problem — too much snow. A few ski areas were closed either because of the avalanche danger created by the high snow amounts, or problems accessing the sites, due to impassable roads. BTW, I’d like someone to explain to me why CA is having so much precipitation, when dry weather was predicted, due to La Nina.
No snow on the ground in Boston. Gee, that would be great. Denver’s average high in mid-winter is about 10 degrees F higher than here outside Boston. There are many years when there is snow on the ground for weeks in Denver – and many years when there is very little snow on the ground. I don’t think a 2 degree C difference would get rid of snow on the ground. It’s much more a function of how much it snows.
Unless the author expects his students to live many hundreds of years, he can’t possibly be telling the truth to his students.
http://www.abc.net.au/landline/content/2006/s1844398.htm
‘SALLY SARA: What will it mean for Australian farmers if the predictions of climate change are correct and little is done to stop it? What will that mean for a farmer?
PROFESSOR TIM FLANNERY: We’re already seeing the initial impacts and they include a decline in the winter rainfall zone across southern Australia, which is clearly an impact of climate change, but also a decrease in run-off. Although we’re getting say a 20 per cent decrease in rainfall in some areas of Australia, that’s translating to a 60 per cent decrease in the run-off into the dams and rivers. That’s because the soil is warmer because of global warming and the plants are under more stress and therefore using more moisture. So even the rain that falls isn’t actually going to fill our dams and our river systems, and that’s a real worry for the people in the bush. If that trend continues then I think we’re going to have serious problems, particularly for irrigation.’
Hold yer horses there folks-
http://www.smh.com.au/environment/more-rain-on-the-horizon-as-climate-change-affects-australia-study-finds-20170115-gts0l1.html
“New findings from the ARC Centre of Excellence for Climate System Science, published in Nature Climate Change on Tuesday, reveal that a two-degree rise in average global temperatures would lead to a 10-30 per cent increase in extreme downpours.”
“There is no chance that rainfall in Australia will remain the same as the climate warms,”
“With two degrees of global warming, Australia is stuck with either more aridity, much heavier extreme rains, or some combination of the two.”
Well that’s cleared that up.
Didn’t get that CYA acronym.
But maybe he’s that all academian “WH” type calling for “warming holes”.