Yet another study tries to erase "the pause" – but is missing a whole year of data

From UC Berkeley Earth comes this paper that tries some new statistical techniques to get “the pause” to go away, following on with the infamous Karl et al paper of 2015, that played tricks with SST measurements done in the 40’s and 50’s to increase the slope of the warming. This aims to do the same, though the methods look to be a bit more sophisticated than Karl’s ham-handed approach. The paper link is below, fully open sourced. I invite readers to have a look at it, and judge for yourselves. Personally, it looks like ignoring the most current data available for 2016, which has been cooling compared to 2015, invalidates the claim right out of the gate.

If a climate skeptic did this sort of stuff, using incomplete data, we’d be excoriated. yet somehow, this paper using incomplete data gets a pass by the journal, and publishes with 2015 data at the peak of warming, just as complete 2016 data becomes available.

The results section of the paper say:

From January 1997 through December 2015, ERSSTv3b has the lowest central trend estimate of the operational versions of the four composite SST series assessed, at 0.07°C per decade. HadSST3 is modestly higher at 0.09°C per decade, COBE-SST is at 0.08°C per decade, whereas ERSSTv4 shows a trend of 0.12°C per decade over the region of common coverage for all four series. We find that ERSSTv3b shows significantly less warming than the buoy-only record and satellite-based IHSSTs over the periods of overlap [P < 0.01, using an ARMA(1, 1) (autoregressive moving average) model to correct for autocorrelation], as shown in Fig. 1. ERSSTv3b is comparable to ERSSTv4 and the buoy and satellite records before 2003, but notable divergences are apparent thereafter.

zeke-allsets-fig1

What’s missing? Error bars showing uncertainty. Plus, the data only goes to December 2015They’ve missed an ENTIRE YEAR’s worth of data, and while doing so claim “the pause” is busted. It would be interesting to see that same graph done with current data through December 2016, where global SST has plummeted. Looks like a clear case of cherry picking to me, by not using all the available data. Look for a follow up post using all the data.

Here’s what the world’s sea surface temperature looks like at the end of 2016 – rather cool.

global-sst-12-29-2016

Compare that to December 2015, for Hausfather’s end data period – they ended on a hot note:

global-sst-12-31-2015


I did ask Zeke Hausfather, the lead author about this paper via email, about it and the data, and to his credit, he responded within the hour, saying:

Hi Anthony,

We haven’t updated our buoy-only, satellite-only, and argo-only records to present yet (then still end January 1st 2016), but we are planning on updating them in the near future.

By the way, the paper itself is open access, available here: http://advances.sciencemag.org/content/3/1/e1601207.full.pdf+html
We also have a background document we put together here: http://www-users.york.ac.uk/~kdc3/papers/ihsst2016/background.html
I’m attaching the data shown in that figure. All series have been masked to common coverage (though we we do three different variations of tests for coverage effects, as we discuss in detail in the paper).
The data are:
acci97Mm.temp – Satellite radiometer record from 1997 (from ATSR and AVHRR)
buoy97Mm.temp – Buoy-only record from 1997
cobe97Mm.temp – COBE-SST (Japanese record)
had97Mm.temp – HadSST3
v3_97Mm.temp – ERSSTv3b
v4_97Mm.temp – ERSSTv4
We start in 1997 because prior to that there is insufficient data from buoys to get a global estimate, and satellite data is only available from mid-1996.
Hope that helps,
-Zeke

I have made the data available here in a ZIP file (17KB)

That’s how science should work, sharing the data, but I contend that the data should be updated in the paper before publishing it. A year long gap, with a significant cooling taking place, is bound to change the results. Perhaps this is an artifact of the slow peer-review process.

But, Zeke should know better, than to allow the word “disproved” in a headline. We’ll see how well his study claims of “pause-busting” hold up in a year without a major El Niño to bolster his case.

UPDATE: Bob Tisdale points out via email that this paper seems to be a manifestation of a guest post at Judith Curry’s a year ago:

A buoy-only sea surface temperature record

In that post, there’s some serious concerns about the buoy data used, from climate Scientist John Kennedy of the UK Met Office

Dear Bob,

You raise some interesting points, which I’d like to expand on a little. I’ve used your numbering.

First, coastal “SST” from drifters can exhibit large variations because there can be large variations in coastal areas. Also, sometimes, buoys wash up on beaches and start measuring air temperature rather than SST. It’s also common to see drifting buoys reporting erratic measurements shortly before they go offline, wherever they happen to be. Occasionally, they get picked up by ships and, for a short period, record air temperatures on deck. This paper goes into some of the problems that ship and drifter data suffer from:

http://onlinelibrary.wiley.com/doi/10.1002/jgrc.20257/full

Second, drifter design was standardised in the early 1990s. Since then, the only major change I know of has been in the size of the buoys: modern mini drifters are smaller than their non-mini predecessors. Different manufacturers make buoys to the specifications laid down in the standard design. Metadata for buoys is not especially easy to get hold of (for ships there’s ICOADS and WMO publication 47), but work is ongoing to organise the metadata and to see if there are measurable differences between drifters from different manufacturers. Work has also been done to fit a small number of drifters with higher-quality thermometers alongside the standard thermistor. See e.g.

http://journals.ametsoc.org/doi/abs/10.1175/2010JTECHO741.1

The results suggest that individual buoys can exhibit a variety of problems. On average, though, they seem to be unbiased relative to the true SST. Individually, they are higher or lower, with calibrations that vary by a few tenths of a degree.

There can occasionally be large calibration errors (of a degree or more). Nowadays, there is constant monitoring of the drifter network by a number of different centres. Large calibration errors are usually identified quickly. Sometimes these can be fixed remotely, sometimes they can’t and the buoy goes onto a list (see, for example, http://www.meteo.shom.fr/qctools/ ). Monitoring of the early data was less thorough.

As a result of the above considerations, everyone who uses drifting buoy data applies some level of quality screening to it. What is generally accepted is that the average drifter makes a much better SST measurement than the average ship (though there are exceptions, of course, in both directions).

Third, I’d note that drifter coverage is not so great prior to 1995 (I think Kevin said the same), so the relative effect of calibration errors would be more pronounced as well as the difficulty of making a solid comparison with fewer data points. I think, more generally, it’s useful to know how consistent the trends are across a variety of periods. As your graphs show, looking at a variety of periods can reveal different aspects of the data.

Fourth, (I think you mistyped HadSST2 when you meant HadNMAT2, or did I misunderstand?). Question: are the coverages of HadNMAT2 and ERSSTv4 in your plot the same? Coverage of NMAT is confined to areas where ships go, and ship coverage has declined somewhat over this period, whereas ERSSTv4 is more or less global.

The closeness with which NMAT and ERSSTv4 should track each other is something to consider also. The ERSST ship adjustment is smoothed so that variations of shorter than a few years (approximately) are not resolved. My understanding of this is that it’s necessary to reduce the effect of random measurement errors on the estimated bias. By smoothing over several years, the effect of random measurement errors average out, so what’s left is largely due to systematic errors (which is good because that’s what they are trying to assess). On the other hand, it means that the method can’t resolve changes in bias that happen faster than that.

Fifth, the uptick in the number of ICOADS SST observations in 2005 coincides with a large increase in the number of drifting buoy data. Depending on the version of ICOADS used, there’s also often a change in the number and composition of observations at the switch from delayed mode to real time. I think for ICOADS 2.5, that’s the end of 2007.

Sixth, don’t forget that there are 100 different estimates of HadSST3 – which together span estimated uncertainty in the bias adjustment – and additional measurement, sampling and coverage uncertainties which can also affect the trends over shorter periods such as the ones being discussed here. In brief, the trend over this period as estimated by HadSST3 is uncertain. The same goes for ERSSTv4: there is an uncertainty analysis (Liu et al. 2015 published at the same time as Huang et al. 2015). One should be wary about drawing conclusions from a comparison based only on the medians.

http://journals.ametsoc.org/doi/abs/10.1175/JCLI-D-14-00007.1

Best regards to one and all,

John Kennedy

One wonders of Hausfather and Cowtan saw this concern, and if they did, heeded it.


Global warming hiatus disproved — again

By Robert Sanders, Media relations

A controversial paper published two years ago that concluded there was no detectable slowdown in ocean warming over the previous 15 years — widely known as the “global warming hiatus” — has now been confirmed using independent data in research led by researchers from UC Berkeley and Berkeley Earth, a non-profit research institute focused on climate change.

A NEMO float, part of the global Argo array of ocean sensing stations, deployed in the Arctic from the German icebreaker Polarstern Bremerhaven. (Photo courtesy of Argo)

After correcting for this “cold bias,” researchers with the National Oceanic and Atmospheric Administration concluded in the journal Science that the oceans have actually warmed 0.12 degrees Celsius (0.22 degrees Fahrenheit) per decade since 2000, nearly twice as fast as earlier estimates of 0.07 degrees Celsius per decade. This brought the rate of ocean temperature rise in line with estimates for the previous 30 years, between 1970 and 1999.The 2015 analysis showed that the modern buoys now used to measure ocean temperatures tend to report slightly cooler temperatures than older ship-based systems, even when measuring the same part of the ocean at the same time. As buoy measurements have replaced ship measurements, this had hidden some of the real-world warming.

This eliminated much of the global warming hiatus, an apparent slowdown in rising surface temperatures between 1998 and 2012. Many scientists, including the International Panel on Climate Change, acknowledged the puzzling hiatus, while those dubious about global warming pointed to it as evidence that climate change is a hoax.

Climate change skeptics attacked the NOAA researchers and a House of Representatives committee subpoenaed the scientists’ emails. NOAA agreed to provide data and respond to any scientific questions but refused to comply with the subpoena, a decision supported by scientists who feared the “chilling effect” of political inquisitions.

The new study, which uses independent data from satellites and robotic floats as well as buoys, concludes that the NOAA results were correct. The paper will be published Jan. 4 in the online, open-access journal Science Advances.

“Our results mean that essentially NOAA got it right, that they were not cooking the books,” said lead author Zeke Hausfather, a graduate student in UC Berkeley’s Energy and Resources Group.

Long-term climate records

Hausfather said that years ago, mariners measured the ocean temperature by scooping up a bucket of water from the ocean and sticking a thermometer in it. In the 1950s, however, ships began to automatically measure water piped through the engine room, which typically is warm. Nowadays, buoys cover much of the ocean and that data is beginning to supplant ship data. But the buoys report slightly cooler temperatures because they measure water directly from the ocean instead of after a trip through a warm engine room.

sst-berkeleynoaa
A new UC Berkeley analysis of ocean buoy (green) and satellite data (orange) show that ocean temperatures have increased steadily since 1999, as NOAA concluded in 2015 (red) after adjusting for a cold bias in buoy temperature measurements. NOAA’s earlier assessment (blue) underestimated sea surface temperature changes, falsely suggesting a hiatus in global warming. The lines show the general upward trend in ocean temperatures. (Zeke Hausfather graphic)

Hausfather and colleague Kevin Cowtan of the University of York in the UK extended that study to include the newer satellite and Argo float data in addition to the buoy data.NOAA is one of three organizations that keep historical records of ocean temperatures – some going back to the 1850s – widely used by climate modelers. The agency’s paper was an attempt to accurately combine the old ship measurements and the newer buoy data.

“Only a small fraction of the ocean measurement data is being used by climate monitoring groups, and they are trying to smush together data from different instruments, which leads to a lot of judgment calls about how you weight one versus the other, and how you adjust for the transition from one to another,” Hausfather said. “So we said, ‘What if we create a temperature record just from the buoys, or just from the satellites, or just from the Argo floats, so there is no mixing and matching of instruments?’”

In each case, using data from only one instrument type – either satellites, buoys or Argo floats – the results matched those of the NOAA group, supporting the case that the oceans warmed 0.12 degrees Celsius per decade over the past two decades, nearly twice the previous estimate. In other words, the upward trend seen in the last half of the 20th century continued through the first 15 years of the 21st: there was no hiatus.

“In the grand scheme of things, the main implication of our study is on the hiatus, which many people have focused on, claiming that global warming has slowed greatly or even stopped,” Hausfather said. “Based on our analysis, a good portion of that apparent slowdown in warming was due to biases in the ship records.”

Correcting other biases in ship records

In the same publication last year, NOAA scientists also accounted for changing shipping routes and measurement techniques. Their correction – giving greater weight to buoy measurements than to ship measurements in warming calculations – is also valid, Hausfather said, and a good way to correct for this second bias, short of throwing out the ship data altogether and relying only on buoys.

Berkeley’s analysis of ocean buoy (green) and satellite data (orange) and NOAA’s 2015 adjustment (red) are compared to the Hadley data (purple), which have not been adjusted to account for some sources of cold bias. The Hadley data still underestimate sea surface temperature changes. (Zeke Hausfather graphic)

“In the last seven years or so, you have buoys warming faster than ships are, independently of the ship offset, which produces a significant cool bias in the Hadley record,” Hausfather said. The new study, he said, argues that the Hadley center should introduce another correction to its data.

“People don’t get much credit for doing studies that replicate or independently validate other people’s work. But, particularly when things become so political, we feel it is really important to show that, if you look at all these other records, it seems these researchers did a good job with their corrections,” Hausfather said.

Co-author Mark Richardson of NASA‘s Jet Propulsion Laboratory and the California Institute of Technology in Pasadena added, “Satellites and automated floats are completely independent witnesses of recent ocean warming, and their testimony matches the NOAA results. It looks like the NOAA researchers were right all along.“

Other co-authors of the paper are David C. Clarke, an independent researcher from Montreal, Canada, Peter Jacobs of George Mason University in Fairfax, Virginia, and Robert Rohde of Berkeley Earth. The research was funded by Berkeley Earth.

The paper: Assessing Recent Warming Using Instrumentally-Homogeneous Sea Surface Temperature Records (Science Advances)

0 0 votes
Article Rating
297 Comments
Oldest
Newest Most Voted
Inline Feedbacks
View all comments
Reply to  Robert Kernodle
January 4, 2017 4:31 pm

Thanks for that, Robert Kernodle. 🙂
Including just minimal systematic error, the temperature uncertainty bars would go right off the page in Figures 1, 6 and 7 in the head-post. Those plots are all physically meaningless.

Michael Kelly
Reply to  Pat Frank
January 4, 2017 5:27 pm

Wow! Excellent essay!

bit chilly
Reply to  Pat Frank
January 6, 2017 3:52 am

“these plots are all physically meaningless”
that is the only meaningful takeaway from this .

jeanparisot
Reply to  Robert Kernodle
January 5, 2017 4:57 am

I made my kids read that, thank you.
And, after all the instrument error you have to account for the spatial error in sampling. Even if you embrace the CO2 armeggedon, this error budget should concern you. After all (sorry), ‘you can’t manage what you can’t measure’ is a truism every good little Marxist should fear.

P Wilson
Reply to  jeanparisot
January 5, 2017 9:07 pm

Yes a fine essay. I wonder, however, if the global warming proponents actually read around the subject, to more truthful accounts than theirs, or whether they live completely in their own darkness?

Reply to  jeanparisot
January 6, 2017 6:42 pm

Jeanparisot,
How about having your kids read some real science:
This graphic compares the year-to-date temperature anomalies for 2016 (black line) to what were ultimately the seven warmest years on record: 2015, 2014, 2010, 2013, 2005, 2009, and 1998. Each month along each trace represents the year-to-date average temperature anomaly. In other words, the January value is the January average temperature anomaly, the February value is the average anomaly of both January and February, and so on. The average global land and ocean surface temperature for January–November 2016 was 0.94°C (1.69°F) above the 20th century average of 14.0°C (57.2°F)—the highest global land and ocean temperature for January–November in the 1880–2016 record, surpassing the previous record set in 2015 by 0.06°C (0.11°F)
Source: https://www.ncdc.noaa.gov/sotc/global/2016/11/supplemental/page-2
Jenaparisot: You do understand that the odds of consecutive warmest ever years is much greater than 1 in 10,000?
When your children’s taxes go out the roof in an attempt to deal with sea level rise and deal with which all the refugees which will be flooding in from some Central America or South America country you can explain how you and the deniers stood by and did nothing.

Reply to  jeanparisot
January 7, 2017 1:04 pm

Benjamin Wright, you understand, don’t you, that when ±0.5 C systematic measurement error (869.8 KB) is properly included, your temperature anomalies are shown to be the scientific nonsense they actually are, instead of NCDC’s disingenuous presentation of false precision.
You also realize, don’t you, that when air temperatures are rising out of a global cool period (the LIA), that a series of record annual high temperatures is inevitable, i.e., 1 chance in 1.
As soon as the AGW hysteria is ended, taxes will go down because huge tranches of money will not be wasted on nothing.
The rate of sea level rise hasn’t changed for as long as we’ve been measuring it. Your worries are completely vacuous. No one should pay attention to them.

jeanparisot
Reply to  Pat Frank
January 8, 2017 8:00 am

Pat, I agree with you, with the exception that our government will continue to fund some nonsense.

January 4, 2017 1:34 pm

I commented on Twitter on this paper.
The authors claim they validate and/or cross-check Karl et al adjustments by comparing ERSST4 against ‘instrumentally homogenous’ temperature records (IHSST) from buoys, and the like. Karl et al adjustments were made on the reasoning that buoys had a cool ‘bias.’ Now, the authors say they see the adjusted SSTs match buoys. This is circular reasoning. Additionally, the other IHSSTs used by the authors are themselves buoy-dependant, as the authors themselves admit.
When will we put a full stop to flawed non-independent reasoning in climate science? Of course, I could be wrong and I am happy to be educated but this sort of thing seems to repeat itself in climate science a lot. The author list is not confidence-inspiring either.

Reply to  Shub (@shubclimate)
January 4, 2017 2:22 pm

Hey Shub I asked you a question before this paper was published..
Would you believe in satelllite data?
You were silent…
Do you now want to deny satellite data
Karl got it right.
Come Jan 20th, Trump will have full and total control of the NOAA data.
1. No skeptic has shown that karl got it wrong.
2. An independent team of scientists looking at independent data, some data never considered before,
have demonstrated he got it right.
3. The showed the data and the CODE.
The best response?
The blog writer here complains that a papeer submitted in March 2016… doesnt have data through the end of 2016
Some skeptic…
[Hey Mosher, does the pause remain “busted” when you plot the 2016 data? Is a pause busted one year, but returning in the future via cooling still “busted”. Plot it and let’s see. Some scientist…-Anthony]

Reply to  Steven Mosher
January 4, 2017 3:09 pm

” No skeptic has shown that karl got it wrong.”
Karl et al took a Frankenstein of a dataset and compared it buoys. They declared the buoys have a ‘bias’ and adjusted them.
Where is the question of ‘right’ or ‘wrong’ in this? There are only choices. There is no methods of verification, or cross-validation. If you add numbers to numbers, you get bigger numbers period. There is little science in all this

Reply to  Steven Mosher
January 4, 2017 3:34 pm

Yours is a treffer reply, AW. Evidence is the ‘violent’ negative reaction to David Rose pointing out to UK readers the sharp T decline past 9 months as El Nino dissipated. ‘Cherry pick’ not. Just what happened after the El Nino peak. ‘Land only cheat’ when Rose explained he chose that because less thermal inertia so a lead indicator. Then followed up with land plus sea when that showed the same conclusion. Apoplexy amongst warmunists.
Here, Zeke and friends got their desired MSM headline. Won the PR skirmisch but will lose the battle and then the war. Failed to notice that with DOTUS, MSM doea not rule any more. Truth has found a way (like WUWT) to speed up and around roadblocks.

O R
Reply to  Steven Mosher
January 4, 2017 3:53 pm

“Hey Mosher, does the pause remain “busted” when you plot the 2016 data? Is a pause busted one year, but returning in the future via cooling still “busted”. Plot it and let’s see. Some scientist…-Anthony]”
Well, they have left out the whole year 2016, which actually is the warmest ERSST4 year on record. So if you are going to accuse them for anything, it should be to hide the warming.
But I guess you have missed the aim of the paper. It is not to analyse data that came in ofter submission of the manuscript, it is to validate ERSST4 against other modern independent datasets..

Reply to  Steven Mosher
January 4, 2017 4:06 pm

Steve,
Why the preoccupation with data, so much of which is demonstrably cherry picked, adjusted and manipulated towards a preconceived conclusion? I strongly suggest that you look at the physics to discern what is and is not possible and you will find that even the low end of the assumed sensitivity of 0.8C +/- 0.4C per W/m^2 is far beyond what can be justified by any physical laws.
Based on the sensitivity being the slope of the Stefan-Boltzmann LAW, it’s somewhere between 0.2 and 0.3 C per W/m^2 and which is readily validated with data, at least relative to solar forcing. The SB LAW is immutable physics that has been settled science for more than a century. What physical laws do you propose can override the sensitivity predicted by the SB LAW and do so by multiple factors of 2?
You should be able to agree that the SB LAW works exactly to predict the temperature and sensitivity of the Moon (I’ll refer you to the data from the Lunar Reconnaissance Orbiter), so how can you connect the dots between the SB sensitivity and the sensitivity assumed by the IPCC? The atmosphere is completely passive and in no way shape of form can add the amount of energy to the surface that the IPCC sensitivity requires.
While you’re at it, what physical law can explain how 1 W/m^2 of forcing can result in 4.3 W/m^2 of incremental surface emissions (to manifest a 0.8C increase), while each of the 240 W/m^2 arriving from the Sun results in only 1.6 W/m^2 of incremental emissions? It it your opinion that 1 W/m^2 of ‘forcing’ from CO2 is 4 times more powerful at warming the surface than 1 W/m^2 of solar forcing? Perhaps you believe that different Joules are capable of doing different amounts of work?

Reply to  co2isnotevil
January 4, 2017 6:29 pm

The atmosphere is completely passive

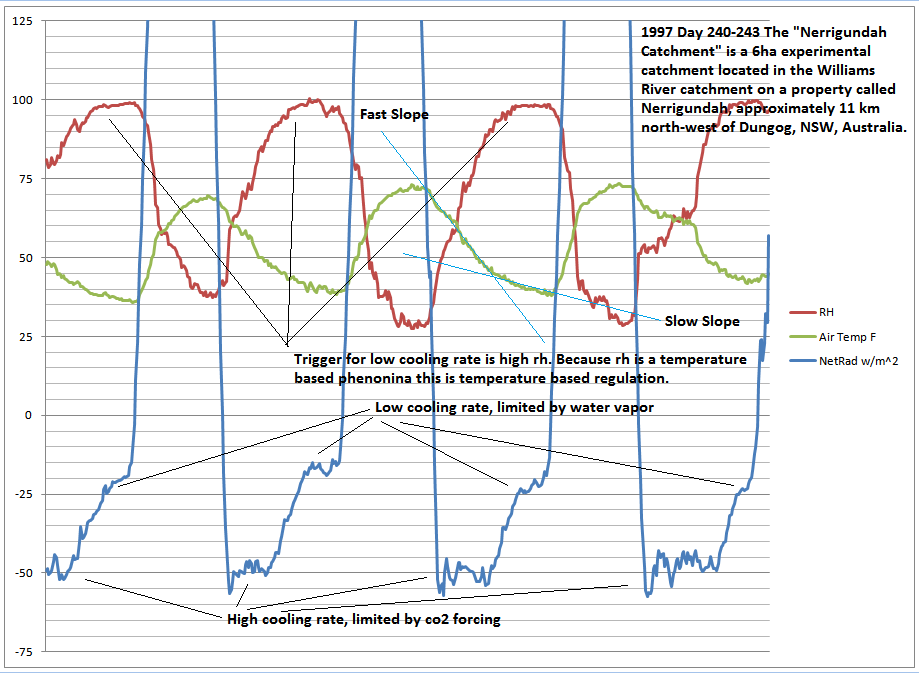
Co2, it isn’t passive. It’s active, with a variable nonlinear cooling rate. Herecomment image
Detains, data source, and paper referencing exponential decay in cooling rates. Here http://wp.me/p5VgHU-2A
But I identified the same change in cooling rate, prior to my finding the paper, in the original version it was not there at all. But I was surprised by their lack of correlation with rel humidity, then I remembered you don’t get the same results with linear correlation functions when applied to nonlinear relationships, looked at the data, and there it was in living color, the outgoing radiation being regulated.

Reply to  micro6500
January 4, 2017 7:19 pm

micro6500,
“Co2, it isn’t passive. It’s active”
It depends on your definition of active. The standard meaning is that active means it relies on an implicit, infinite source of Joules to supply as much energy as required. Things like resistors, capacitors, inductors and delay lines are passive while things like transistors, mosfets, vacuum tubes, op amps and anything else with an implicit power supply input are active.
Many confuse dynamic with active, but even a collection of R, L and C will exhibit dynamic behavior when driven by a dynamic stimulus. Even a system whose transfer function has dependencies on the stimulus is still a passive system, unless it also contains active elements.
Consensus climate science ASSUMES that the Sun is the implicit power supply of an active amplifier controlled by feedback, but if it was, the power delivered to the surface (output we care about) would be limited by the power available from the power supply and the surface would never emit more power than is supplied by the power supply, independent on the sign or magnitude of the ‘feedback’.
The atmosphere is more accurately modeled as a passive system with delay and its the delayed absorption returned to the surface (whether by GHG’s or clouds) that makes the surface warmer than it would be otherwise. The energy emitted by the atmosphere, whether out into space or back to the surface is limited to the energy absorbed by it, which is mostly originating from the surface. There’s no active amplification involved and the concept of feedback, positive or negative, is irrelevant.

Reply to  co2isnotevil
January 4, 2017 8:32 pm

For expediency I’ll accept passive. But that model as passive with delay is wrong, and the response of the atmosphere to radiation rate is very important, it renders the cooling process independent of any co2 forcing.

scraft1
Reply to  Steven Mosher
January 4, 2017 4:29 pm

Zeke Hausfather said they would update the study soon with full 2016 results. His history indicates that he is trustworthy. Shouldn’t his pledge to update be enough? Hold his feet to the fire and let’s see what the result is.

Evan Jones
Editor
Reply to  Steven Mosher
January 4, 2017 4:34 pm

Hullo, Mosh. What strikes me as odd is the choice of end date. Seems to me like one shouldn’t ride up one side of a blip and not down the other side. Include both of ’em in — or both ’em out. Not only that, but a blip (unless followed by an equivalent net dip) — even with both the ups and downs included — wreaks havoc on a linear trend if it occurs on either end of the graph.

Nick Stokes
Reply to  Steven Mosher
January 4, 2017 7:51 pm

” wreaks havoc on a linear trend if it occurs on either end of the graph”
What sort of havoc do you have in mind? All that counts for the trend is whether the added data is above or below. Adding more 2016 data just increases the trend. I gave trends starting June 1997 below, but it would be the same for any strat before about 2011. Here’s the table:

dataset       End 12/15  End 11/16
NOAA SST       1.099     1.316
HADSST3        0.763     1.026
rogerthesurf
Reply to  Steven Mosher
January 5, 2017 12:07 am

Steven
“Come Jan 20th, Trump will have full and total control of the NOAA data.”
True, and by Trumps own words it will not be politiczed. That is, it will return to being a scientific organization.
Do you have a problem with that?
Cheers
Roger

Ens Josh
Reply to  Steven Mosher
January 5, 2017 4:29 am

[Hey Mosher, does the pause remain “busted” when you plot the 2016 data? Is a pause busted one year, but returning in the future via cooling still “busted”. Plot it and let’s see. Some scientist…-Anthony]
Yes, it probably remains “busted”. Why don’t you try it?

MarkW
Reply to  Steven Mosher
January 5, 2017 9:09 am

I wonder how Nick would react if someone were to pick the bottom of an extreme La Nina as the end point of a temperature trend chart?

See - owe to Rich
Reply to  Steven Mosher
January 5, 2017 10:51 am

Anthony, I am a great supporter of yours, but I think you are out of line with your criticism re 2016. The first thing is that, unfortunately, peer reviewed papers do tend to be a bit out of date because of delays in the review system. In an ideal world that wouldn’t happen of course, but we know we’re not in an ideal world. In fact a single year’s missing data is relatively benign.
The second thing is that it seems unlikely to me that 2016, which has been similar to 2015 by most accounts, is going to help to stop the imputed break in the Pause.
Whether the new adjustments are justified is another question altogether…
Rich.

Reply to  Steven Mosher
January 5, 2017 2:42 pm

You know Steve, a while back everybody was saying all kinds of bad things were going to happen if Global Air Temperatures went up 2K a century; now the temperature rise in the air has stalled (at least statistically) and instead the Oceans have gone up 0.12 degrees Celsius (0.22 degrees Fahrenheit) per decade since 2000; I’m just not getting the angst here, the sense of urgency is underwhelming!
Additionally when these guys flip flop between warming (a temperature thing) and heating (a calorie thing) so easily, it’s hard not to feel like the goalposts are being moved.

Reply to  Steven Mosher
January 5, 2017 9:40 pm

The pause has never been an SST phenomenon. The pause has been atmospheric. Global SST’s have continued to warm throughout the pause, although VERY unevenly. Atmospheric temperature is controlled principally by tropical SST’s. When ninos spread stored solar energy across the surface of the Pacific, atmospheric temperatures rise, spectacularly in the stratosphere. When ninas stack the energy in the warm pool and upwell cold subsurface water across the Pacific, the reverse.
Meanwhile, the unevenness of local warming and cooling of SST’s argues against control by a well mixed greenhouse gas, and if you choose the deviation from perfect CO2 atmospheric mixing shown by OCO, it does not match that either.
Fundamentally, the atmosphere does not warm the ocean.

Reply to  Steven Mosher
January 5, 2017 10:13 pm

No one I am aware of (or with a clue) ever claimed there was a pause in global SST’s. The pause is TLT. Steven is all crowing that buoys and satellites agree since 2000 for SST’s. So what? Karl’s error is preferring ship data to buoy data before the millenium.

Nick Stokes
Reply to  Shub (@shubclimate)
January 4, 2017 5:32 pm

“Now, the authors say they see the adjusted SSTs match buoys. This is circular reasoning.”
The reasoning is fine. It doesn’t matter which you choose as the standard. It especially doesn’t matter with anomalies, which is all they are ever really used for. After subtracting a mean, you get exactly the same numbers whichever you chose as the standard.

Hivemind
Reply to  Nick Stokes
January 4, 2017 7:04 pm

The reasoning is deeply flawed. The assert that the buoys are wrong, even though the collection methodology avoids some notable defects in the methodology of both bucket collection and engine intake measurements. After altering the superior buoy data, they fail to validate it against the real world. Only asserting that it matches the defective bucket and engine intake data better.
The conclusion is completely meaningless.

Nick Stokes
Reply to  Nick Stokes
January 4, 2017 7:17 pm

“The assert that the buoys are wrong”
What nonsense! They don’t assert that the buoys are wrong. They have gone to a lot of trouble to create and maintain them. All that happens is that they find a 0.1C difference (varies a little with the ocean). You can either A) add 0.1C to the buoys or B) subtract 0.1C from the ships. The only difference is that set A will be, for all types, 0.1C warmer than B. And that difference totally disappears when you form anomalies by subtracting a mean.
I extpect they prefer A because they still have more ship data than buoy. Just means less arithmetic.

Reply to  Nick Stokes
January 4, 2017 10:09 pm

ERSSTs uses 0.12C adjusted buoy data. It is no mystery ERSST which contains adjusted buoy data matches the buoys. They are the same thing.
Non-independent data cannot be used to validate one another. The flaw in reasoing is not about the choice of standard.

Nick Stokes
Reply to  Nick Stokes
January 4, 2017 10:49 pm

Shub,
” It is no mystery ERSST which contains adjusted buoy data matches the buoys. They are the same thing. “
No, they aren’t the same thing. They say that separately, buoys, ARGO and satellites, give a similar recent trend. They are homogeneous sets. Then they say that if you mix ship and buoy data with the appropriate offset, as in ERSST4, you get a similar trend to those. If you don’t offset, you get a different trend. The offset is validated by the observed homogeneous trends. That isn’t circular.

Reply to  Nick Stokes
January 4, 2017 10:57 pm

Nick writes: “The only difference is that set A will be, for all types, 0.1C warmer than B. And that difference totally disappears when you form anomalies by subtracting a mean”
It does? How do you figure that Nick? If you add .1C to everything and you keep the old mean it adds .1C to everything. You keep making these strange claims, where do those originate? Why would you write something like that?
This is the second time in a week I’ve read something you’re written about measurements and statistics that are patently wrong. Did you get your degree returning coupons on cereal box?
None of this even bothers with the idea 0.1C is withing the uncertainty of the measure. It’s an exercise that adds no information, only bias.

Nick Stokes
Reply to  Nick Stokes
January 5, 2017 12:19 am

Bartleby,
“How do you figure that Nick?”
Very simple. I’ll use R notation, which I’m sure all statisticians know. Let s be the vector of ship readings, b the vector of buoy.
Suppose you add offset d to b. Then the combined vector S1 = c(s,b+d)
Suppose you subtract offset d from s. Then the combined vector S2 = c(s-d,b)
And S2+d=c(s,b+d)=S1

Reply to  Nick Stokes
January 5, 2017 8:07 am

“No, they aren’t the same thing.”
Yes, there is more data in ERSSTv4 etc, etc, but analytically they are the same thing.
One contains an adjusted version of the other within it, and the purpose fo the adjustment was to make the former match the latter. It is circular to use either to ‘validate’ the other.
I believe using the use of satellite radiometer measurements on the other hand, is independent, on inferential grounds. Unlike buoy data. But then of course, one needs to look to see against what the satellite radiometer data are calibrated and verified.
I know you love to parse words and play games. Let’s get back when you have a substantive counter-argument.

Clyde Spencer
Reply to  Nick Stokes
January 5, 2017 12:51 pm

Stokes,
I beg to differ! The expediency of NOT adjusting a lot of ship data is a weak excuse in this day of computers. The rigorous approach should be used, which means adjusting the data with a known bias to agree with the high quality modern data, and let the chip fall where they will. One of the consequences of not adjusting the so-called “cold bias” buoys is that the claim of 2016 being 0.02 deg C warmer than 1998 would probably fall by the wayside. Anomaly slopes MAY (or may NOT, because the ratio of ship data to buoy data is changing over time) stay the same, but average actual temperatures will undoubtedly change.

Nick Stokes
Reply to  Nick Stokes
January 5, 2017 1:15 pm

Clyde Spencer,
” One of the consequences of not adjusting the so-called “cold bias” buoys is that the claim of 2016 being 0.02 deg C warmer than 1998 would probably fall by the wayside. “
No, it wouldn’t. That is the point of my little demonstration above. The only effect of changing the reference set (buoys or ships) is a constant and uniform 0.12°C added to all data for all time. It changes no relative differences, even with absolute temperatures. And it disappears entirely with anomaly.

bit chilly
Reply to  Nick Stokes
January 6, 2017 4:00 am

the very notion of “anomalies” in regard to air or ocean temps in earths history i find quite comical .

January 4, 2017 1:36 pm

Averaging the sea surface temperatures around the globe to create the global anomaly makes little sense, particularly if that is done over a short period of couple of decades.
About 3 years ago (it needs updating) using the NOAA data, I compared the SST for two strips of the Atlantic Ocean at high latitudes (north and south hemispheres).
http://www.vukcevic.talktalk.net/AOHL-SST.gif
Rise and fall of the SST in the two hemispheres periodically moves in and out of phase.

jorgekafkazar
Reply to  vukcevic
January 4, 2017 3:50 pm

Looks essentially 100% out of phase to me.

Reply to  jorgekafkazar
January 4, 2017 9:10 pm

From the early 1950s to the early 1960s, and again from about 1969 to about 1978, and again in the years before 2010, they are clearly “in phase.”

Reply to  vukcevic
January 5, 2017 12:33 am

If it is assumed that the NOAA data is good enough (within the reason) then:
– if two hemispheres are compared like for like (longitude x latitude is 10 x 10 degrees in both cases) these two parts of the same ocean do their own thing regardless of what CO2 was up to.
– while global ‘warming’ was apparently surging ahead these two patches of the Atlantic refuse to comply.
– ergo: sun provides the energy to keep oceans warm, but the oceans’ currents govern how the absorbed energy is distributed.

commieBob
January 4, 2017 1:36 pm

re. Bias correction. Dr. Lindzen observed a long time ago that it is indeed strange that the climate corrections seem to operate in one direction only.

Chris Hanley
Reply to  commieBob
January 4, 2017 2:18 pm

It’s astonishing with the constant one-direction post hoc adjustments or ‘corrections’ to recorded data that so-called ‘climate science’ as practiced by many is still taken seriously, that the science community in general doesn’t “smell a rat”.

Bartemis
Reply to  commieBob
January 4, 2017 2:33 pm

The problem is… well, part of the problem is they are only looking for corrections in one direction. You tend to find what you are looking for. Confirmation bias at work.

Evan Jones
Editor
Reply to  Bartemis
January 4, 2017 4:39 pm

Case in point: they found TOBS bias — but completely missed microsite bias.
(And don’t get me stated on MMTS vs. CRS bias.)

Jared
Reply to  Bartemis
January 6, 2017 6:44 am

They still don’t think UHI happens in rural sites because these ‘scientists’ have never stepped foot in the real world to do real science. They sit behind computers and make up codes of what they think is happening. I live in a rural setting and our local town has a mere 6,000 people in it yet on cold winter days UHI can cause that little town to be as much as 12 degrees Fahrenheit warmer than half a mile outside of town. (The land is all flat for miles around). Yet these ‘scientists’ sit behind their little computers and tell me my town is rural (first town with over 10,000 people in it is over 20 minutes away) and that UHI doesn’t really exist in my town because it’s rural and not urban. Maybe they should get out of in the real world and experience that 12 degree difference. I’ve had either Mosher or Stokes tell me UHI is adjusted for, and I’ve explained to them it’s impossible for it to be adjusted for because 100 years ago our little town had 1,000 people, now it’s at 6,000. How do they know how much to adjust the temps for UHI in 1920 of a 1,000 person town to 2017 in a 6,000 person town? In 2017 it can be as much as 12 degrees one day and 5 degrees the next day. It’s not a static number.

Kiwiseven
January 4, 2017 1:38 pm

Surely if they used consistent measurement techniques from buoys from 1998 to 2016, the fact that buoy measurements were slightly cooler than ship measurements is entirely irrelevant.
The amount of warming should be similar even if measured from a slightly lower baseline?

Nick Stokes
Reply to  Kiwiseven
January 4, 2017 2:06 pm

The point is that the proportion in the mix changed, with buoys increasing relative to ships.

Kiwiseven
Reply to  Nick Stokes
January 4, 2017 2:15 pm

But why try and integrate different datasets with different measurement techniques.
Why not create a buoy based dataset and a separate ship based one?

Latitude
Reply to  Nick Stokes
January 4, 2017 2:49 pm

But why….so you can play with it of course

Nick Stokes
Reply to  Nick Stokes
January 4, 2017 5:27 pm

“Why not create a buoy based dataset and a separate ship based one?”
Because the global indices need a continuous dataset. Buoys cover mainly the last 30 years, diminishing as you go back. Combining them is really not difficult; observation pf paired readings shows buoys are only about 0.1°C lower. That’s easy to measure, and you have to adjust for it, but it isn’t much. It had an effect in the last 20 years because of the rapid increase in buoys. That will stabilize.

Reply to  Nick Stokes
January 4, 2017 6:06 pm

Creating a buoy-based dataset is exactly what we did in the paper. Also created a satellite radiometer-only dataset. And an Argo-only dataset. These are each instrumentally homogenous, so need for adjustments for changing instruments. And all show pretty much the same warming as the new NOAA dataset and a lot more warming than the old NOAA dataset.
This is really a pretty simple paper…

Reply to  Nick Stokes
January 4, 2017 10:11 pm

Some of these datasets have just 10 years worth of data. Weak.

Ens Josh
Reply to  Nick Stokes
January 5, 2017 4:27 am

Some of these datasets have just 10 years worth of data. Weak.
Similar to 10 years of “pause”?

MarkW
Reply to  Nick Stokes
January 5, 2017 9:11 am

1) The pause is not a data set, it is the result of analyzing a data set.
2) 18 years and some months, not 10 years.

tom s
Reply to  Nick Stokes
January 5, 2017 3:14 pm

What I find fascinating with all this teeth mashing is the fact we are talking about an insignificant blip in a chaotic system. Who T F CARES? Now please arctic airmass, get the hell out of my country!!

george e. smith
Reply to  Kiwiseven
January 4, 2017 4:48 pm

People have a natural tendency to place more credibility on a story if some of it agrees with their own experience. And they do that, even if the story makes assertions that are completely contrary to their own experience.
We grab on to the good an brush off the bad.
This can be seen for example in the daily newspaper publishing of Horoscopes.
So if I’m a Leo, I will read the Leo column, and blow me down if that doesn’t describe me to a T. Well no there are some things in there that really aren’t me.
So I’ll try the Sagittarius, and now we are cooking; this really says who I am. But there are those couple of pesky assertions, that are just plain wrong; but mostly they pegged it.
By the time I have read all 12 entries, I will see that any one of the 12 describes exactly who I am, with just a few errant parts.
There is a whole branch of mathematics for concocting streams of evidence that lead in one direction in excess of the standard probability that this is true.
And those methods are employed in writing horoscopes, so there is a greater than even chance of the description matching virtually anyone who reads it.
You can for example construct sets of dice other than those having 1, 2, 3, 4, 5. 6 on their faces. One dice for example may have three ones, and three sixes on its faces.
The average score for a large number of rolls will still be 3.5 per roll.
So you can craft say three sets of dice; A, B, C, with say four dice per set, and every dice gives the same average score of 3.5.
But if for example you choose set A to play , and I choose set B, my set will end up beating your set, given that each roll of the dice is a different game.
But if you choose set B, I will choose set C, which is so constructed that per roll, it will beat set B more often than not.
So what if you have already chosen set C.
Well I happen to know that set A will beat set C more often than not, so I can always end up winning if I know that sequence order.
Fortunately; no physical system actually reacts to the statistics of the already known results.
And if you rely on the statistics to determine what you are going to do, you might as well be reading your horoscope, because there is no more credibility in what you are doing.
The results as observed is the most information you can ever have about your system.
G

January 4, 2017 1:47 pm

Correct me if I am wrong, but the trend differences seem to be larger than the limit of precision of the measuring instruments. I am certainly no expert in instrumentation, but just a quick Google of “surface temperature sensors” brought up a page showing an instrument whose instrumental uncertainty looked like this:
temperature Uncertainty
±0.2°C tolerance (-40° to +70°C)
±0.5°C tolerance (71° to 105°C)
±1°C tolerance (106° to 135°C)
Now, I don’t know what the specific instruments in all these measurements are, but the small range in which significant differences appear to be noted seem to be meaningless, if the actual measuring instruments are anywhere close to this.
We need an instrument expert to chime in, I guess, to point out how ignorant I might be or how close I might be to being right.

Reply to  Robert Kernodle
January 4, 2017 1:51 pm

I was referring to the Hausfather et al. paper that is the subject of the main post.

Bitter&twisted
January 4, 2017 1:47 pm

Is’nt it amazing? Climate psyientists can always manage to find a “cold bias” in the data, but never a “warm bias”.

Reply to  Bitter&twisted
January 4, 2017 2:24 pm

B&T, I think you are wrong. They find an even number of warm and cold biases in the data. Most of the warm biases are in the past, and cold biases are in the present, of course, but it’s obviously even overall!

Reply to  Jer0me
January 4, 2017 3:39 pm

Plus many, as my essay When Data Isn’t in ebook Blowing Smoke showed over and over and over… NOAA, NASA, BOM, Meteoschweiz…. USCHRN, GCHN, ACORN,….

January 4, 2017 1:49 pm

“From UC Berkeley News…”

From the radical leftists at Berkeley, just like Michael Mann is a radical leftist graduate of Berkeley. And just like almost all the leftist climate scientists: they’re conformists with a cause.
Climate ‘science’ is politicized science. What we got is a bunch of wingnut activists like Mann constantly hobnobbing with the most radical leftist politicians like Jerry Brown. Politicized science is political advocacy not science, and it is not credible at all.

January 4, 2017 1:50 pm

Hi Anthony,
I challenge you to find me an Ocean temperature record that was cooler on average in 2016 than in 2015. I for one haven’t been able to.comment image
The reason that the figures shown in the paper end on January 1st 2016 is that we submitted the paper for publication in March 2016. No nefarious hiding of the data involved.
[“No nefarious hiding of the data involved.” Your words, not mine – don’t put words in my mouth, very uncool. I simply say that you had a perfect opportunity to update the data set, when the timing was such that you could have. If it wouldn’t change your conclusions, why not do it then? – Anthony]

Reply to  Zeke Hausfather
January 4, 2017 1:59 pm

Monthly values from Jan 2012 through Nov 2016 for reference. Note that the MSU data shown is for ocean areas only (to match the SST series).comment image
Note that the satellite data we use in our study actually comes from radiometers (ATSR and AVHRR) rather than MSU, as it measures the skin temperature of the ocean rather than the temperature of the troposphere a few miles above.

Reply to  Zeke Hausfather
January 4, 2017 4:36 pm

The satellite SST radiometers have a ±0.3 C accuracy limit. Why doesn’t that uncertainty show up on your plot?

DWR54
Reply to  Zeke Hausfather
January 5, 2017 12:04 am

Pat Frank
“The satellite SST radiometers have a ±0.3 C accuracy limit. Why doesn’t that uncertainty show up on your plot?”
95% confidence intervals are clearly set out in Figure 2 of the paper: “Trends and 95% confidence intervals (°C per decade) in difference series for each IHSST and composite SST series, masked to common composite SST coverage.”

Reply to  Zeke Hausfather
January 5, 2017 9:40 am

DWR54, my point was about the ±0.3 C accuracy of the radiometric data itself, which does not average away.
The 95% confidence intervals are actually set out in Figure 4 of the paper, and they’re ludicrously small.
We find out why when reading the section Uncertainty estimation. Measurement error is assumed to be random. This is the standard mistake that infects all of the estimates of global air temperature.

MarkR
Reply to  Zeke Hausfather
January 6, 2017 4:56 pm

Pat Frank,
For the ATSR and AVHRR radiometer-based dataset, Merchant et al. (2014, doi: 10.5285/79229cee-71ab-48b6-b7d6-2fceccead938 ) provide uncertainty quantification through standard Bayesian Optimal Estimation, and pointwise validation statistics against surface measurements.
For global averages and trends, of the analysis in Hausfather et al., looks fine. Unless you have found something wrong in the ESA work.

Reply to  Zeke Hausfather
January 7, 2017 2:56 pm

MarkR, Merchant, et al.’s Bayesian scheme was applied to cloud detection, not to error propagation or uncertainty analysis.
My value for systematic error in the AATSR satellite SSTS comes from such calibration experiments as reported by Wimmer, at al., (2012) Long-term validation of AATSR SST data products using shipborne radiometry in the Bay of Biscay and English Channel Remote Sensing of Environment 116, 17-31; doi: 10.1016/j.rse.2011.03.022
They made thousands of calibration passes against AATSR SSTs using high-accuracy (±0.1 C) ship-borne radiometers. The mean AATSR error relative to the ship-borne measurements was about ±0.3 C. This is an empirical calibration, showing that the satellite radiometers pretty much achieved their resolution specification.
That ±0.3 C represents the AATSR resolution limit of accuracy. Supposing ±0.05 C accuracy is completely unrealistic.

Reply to  Zeke Hausfather
January 4, 2017 2:37 pm

Also, we have in fact talked to John Kennedy, and we address the issues he raised in Figure 5, Figure S19, and Figure S20 in the paper, as well as in the discussion of buoy data in the Methods section. We have a rather lengthy 25-figure supplementary materials examining the sensitivity of our results to a number of different factors that I’d encourage interested readers to check out.

Bill Illis
Reply to  Zeke Hausfather
January 4, 2017 3:01 pm

Why did we we get rid of the Bouy’s trend then ???
You are showing it is exactly the same as the new record.
Previously, Karl said it had a cooling bias. Now you are showing that it is exactly the same.
This is just too weird for me. It is the same now after we adjusted the record up by 0.12C because the buoys were lower by 0.12C. But they are now the same as the record that got adjusted up. So, did the bouys now get adjusted up by 0.24C. That is how the math works.

Reply to  Zeke Hausfather
January 4, 2017 3:25 pm

Bill Illis,
The cool bias was with regard to absolute temperature. You have a grid cell with some combination of buoy readings and ship readings. The buoys read 0.12C cooler than ships.
Year 1: grid contains 4 ships, 0 buoys. Ships measures 20degC. Grid cell average is 20degC
Year 2: 3 ships, 1 buoy. Ships measures 20degC. Buoy measures 19.88degC. Grid cell average is 19.97degC
Year 3: 2 ships, 2 buoys. Ships measures 20degC. Buoys measures 19.88degC. Grid cell average is 19.94degC
Year 4: 1 ship, 3 buoys. Ship measures 20degC. Buoys measures 19.88degC. Grid cell average is 19.91degC
Year 5: 0 ships, 4 buoys. Buoys measures 19.88degC. Grid cell average is 19.88degC
————————-
Both buoys and ships show the same trend in the grid cell (zero) but there is a spurious cooling trend due to the changing mix of measurements and the offset absolute bias.

Bill Illis
Reply to  Zeke Hausfather
January 4, 2017 4:36 pm

Zeke, you have completely repudiated the “rationale” for the adjustment in Karl 2015.
There is NO bias in the buoys’ trend (eliminated in ERSSTV4 and Karl 2015) or the satellites’ trend (eliminated in the move to ERSSTV3b from ERSSTV3).
So, now I have to say that the positions taken (yours versus Karl) and (yours versus the people who made the change in ERSSTV3b) is completely contradictory.
Somebody needs to be TRANSPARENT about what happened here.

Reply to  Zeke Hausfather
January 4, 2017 5:15 pm

Hi Bill,
Paulski0 gets it right. Put simply, if you take two instruments that have the same trend but an offset between them and mix them together, you will get a different (biased) trend.
Though in this case it turns out that both 1) ships measure temperatures warmer than buoys and 2) ships show less warming than buoys over recent years (due to changes in the composition of the ship fleet). This second factor explains most of the difference between the ERSSTv4 and HadSST3 records, since NOAA gives more weight to buoy data in their reconstruction.
Here is what a ship-only and buoy-only record look like (our figure S13 from the paper):comment image

Bill Illis
Reply to  Zeke Hausfather
January 4, 2017 5:34 pm

Zeke maybe you are less of a numbers guy than I previously gave you credit for.
NOW you have shown in this chart that the buoys had a “higher” increasing trend than the ships had.
So, now you have declared that you are right and Karl 2015 actually got it completely “backwards” and the trend should have been adjusted “downwards” because the buoys had a “warming” bias versus the ships.
This is MAJOR problem for someone. Hopefully it is not you but it is for the NCDC and Karl.
I have saved your chart so there is no going back now.

Bill Illis
Reply to  Zeke Hausfather
January 4, 2017 5:55 pm

At.some point, there has to a reckoning in this science.
It is not really a “science” but more of a “legend”.
I am completely mind-boggled by this latest turn of events.
The NCDC actually adjusted the trend of SSTs upwards because the buoys had more warming than the ships. Except they threw out the trend of the buoys and used the ships instead.
In actual fact, they should thrown out the “ships” to justify the adjustment they have made.
The whole science is based on this type of contradiction in the actual evidence versus the way they spin it. I had noticed this before in many, many different instances of course. The basic data presented along with a climate science paper most often completely contradicts the conclusion made in the paper.
But here we have somebody who I thought was one of the rare climate guys who understood the math and, yet, it turns out NONE of them have any basic numbers understanding at all. And these are the people who we are relying to tell us how much temperatures have increased as a result of CO2 and running the climate models to tell us how much temperatures will increase as a result of CO2.

kim
Reply to  Zeke Hausfather
January 4, 2017 8:54 pm

Bill, I wanna know what you really think, pretty please.
==========

Bill Illis
Reply to  Zeke Hausfather
January 5, 2017 5:25 am

I think we need to go back now and reverse this up adjustment.
It should be an adjustment DOWN instead.
A change in trend downward of 0.24C from the current NCDC ERSSTv4 record is what the data says.

michael hart
Reply to  Zeke Hausfather
January 5, 2017 12:43 pm

“And these are the people who we are relying to tell us how much temperatures have increased as a result of CO2 and running the climate models to tell us how much temperatures will increase as a result of CO2.”
I’m not relying on them, Bill.

Nick Stokes
Reply to  Zeke Hausfather
January 5, 2017 2:20 pm

“I think we need to go back now and reverse this up adjustment.
It should be an adjustment DOWN instead.”

OK, you don’t like adding 0.12°C to buoys. You think it should be subtracted from ships.
Suppose you added the 0.12 to buoys, and then subtracted 0.12 from everything. Net result; buoys unchanged, ships 0.12 down. What you are asking for, So what was the step that got everything right? Shifting all the numbers, for all time, by 0.12. This won’t affect the trend of anything. And it will make absolutely no difference to anomalies.

Bill Illis
Reply to  Zeke Hausfather
January 5, 2017 3:43 pm

You know what we need to do Nick Stokes,
We need to make an “adjustment” in WHO we are getting our climate data from because all these people who are now officially in charge of the data gathering and dissemination have a huge bias toward skewing the results so that they show global warming.
For the last 30 years, the only people who got hired in these agencies and promoted in these agencies is the pro-global warming people and even the fervent-global-warmists. The objective people were fired and demoted and sent to a cold weather observatory.
It is basic human nature on how organizations become biased.
It is time for someone objective like the national statistical agencies to take over.
I think we can throw out all the surface temperature records now because it has been nothing but adjustments and sketchy reasoning (as Zeke demonstrated).
“Start over” time is what it is.

Johann Wundersamer
Reply to  Zeke Hausfather
January 10, 2017 2:58 am

Nick Stokes,
‘Net result; buoys unchanged, ships 0.12 down.’
‘This won’t affect the trend of anything. And it will make absolutely no difference to anomalies.’
‘Shifting all the numbers, for all time, by 0.12. This won’t affect the trend of anything. And it will make absolutely no difference to anomalies.’
______________________________________
And that’s your wrong conclusion:
– You COMBINE 2 temperature data sets
instead of honestly
– showing 1 dataset next the other: the second PERMANENTLY calibrated to 0.05 °C higher temperatures than the first.
______________________________________
– So you get ‘cooler’ 20.ctry SHIFTING to warmer 21.ctry
instead of truly
– 20.ctry STEPPING to constantly 0.05 °C ‘warmer’ reported 21.ctry – a bias to ‘climate warming’.
: and yes ::
This WILL affect the trend of anything. And it will make absolutely A DIFFERENCE to anomalies !

Hivemind
Reply to  Zeke Hausfather
January 4, 2017 7:21 pm

Was your graph of real data, or homogenized?

Robert from oz
Reply to  Zeke Hausfather
January 5, 2017 1:03 am

Can I ask what is the worth of a study on climate that covers such a short time historically , what can you possibly gain in terms of scientific advancement of climate science other than it was hot yesterday ?

ironargonaut
Reply to  Zeke Hausfather
January 5, 2017 3:15 am

Zeke did you really say this “But the buoys report slightly cooler temperatures because they measure water directly from the ocean instead of after a trip through a warm engine room.” Isn’t the temperature taken at the INTAKE and not the outlet therefore, no “trip through a warm engine room”. I do realize that a there still is a difference, but don’t you think this is making people think the temperature is measured after it went through the engine, which is kind of insane to think any useful measurement could be had after water ran through and internal combustion engine. I sincerely believe it is just sloppy journalism but would like your clarification.

MarkW
Reply to  ironargonaut
January 5, 2017 9:18 am

He said engine room, not engine. Biiiiig difference.
The temperature is not taken at the intake port. They are taken just before the water enters the engine, after it has passed through a number of feet of piping that travels through the engine room.
The number of feet of piping depends on the type and size of the ship.
The temperature of the engine room likewise will vary from ship to ship.
As we all know, the temperature of the water being sucked in will depend on the depth of the water intake port. That depth depends on both the type of ship and how heavily it’s loaded.
All three of these factors will impact the temperature being measured.
None of these factors are recorded in the data base.
Finally, The quality and maintenance of the temperature sensors in ships is well below that of the sensors in the floats.

ironargonaut
Reply to  ironargonaut
January 5, 2017 10:37 pm

Mark W. so the engine is not in the engine room? What room is it in then the head? Reading comprehension article states AFTER the engine room not in the engine room “Biiiiig difference”. So just before the engine would not be after the engine room. Nothing I said was incorrect or inconsistent. Save the smart cracks for when you are actually correct.

Bruce Cobb
January 4, 2017 1:50 pm

Confirmation bias. On steroids.

Jon
January 4, 2017 1:51 pm

Didn’t NOAA reject buoy temperature in favour of ship temperature to get a higher reading years ago? Now it’s back to buoys! Sounds like the Apocalyptics go wherever it’s hottest to get the result they want.

Nick Stokes
Reply to  Jon
January 4, 2017 2:09 pm

“Didn’t NOAA reject buoy temperature in favour of ship temperature to get a higher reading years ago?”
I wish people would look up and cite, instead of just proceeding from an unanswered question. The answer is they didn’t.

Felflames
Reply to  Nick Stokes
January 4, 2017 7:15 pm

Can you cite that Nick?

Nick Stokes
Reply to  Nick Stokes
January 4, 2017 7:18 pm

Let’s have a cite for the original claim.

Brett Keane
Reply to  Nick Stokes
January 5, 2017 2:36 pm

Stokes
January 4, 2017 at 7:18 pm
Let’s have a cite for the original claim.: Of course you cannot cite, Nick. And note, he was asking a question….Flamin’ driveby’s

Hivemind
Reply to  Jon
January 4, 2017 7:22 pm

“Now it’s back to buoys”, yes, it’s back to buoys, but the data has been modified to support the global warming narrative.

Bill J
January 4, 2017 1:54 pm

Saying “the oceans warmed” implies that the entirety of the oceans warmed which certainly doesn’t seem to be the case.
When the hiatus became undeniable they said “but the oceans warmed, the surface temperature doesn’t matter!” and when the El Niño resulted in record high surface temperatures they said “2016 is the hottest year on record!” claiming that now the surface temperature matters again. I don’t think we’ll be seeing any headlines about surface temperature in 2017.

ironargonaut
Reply to  Bill J
January 5, 2017 3:25 am

Bingo. And everyone keeps playing the game responding to the latest proclamations as if they are relevant.
The stop in global warming was/is about global surface temperatures not about global sea surface temperatures. Yet, the first paragraph of the press release states calls it a global hiatus then goes to talk only about oceans. Apples and oranges.
Is global warming about temperature rise or is it about energy rise? Temperature rise where? Surface or deep oceans? Energy in atmosphere only or land, water, gas, etc?

January 4, 2017 1:55 pm

“In the grand scheme of things, the main implication of our study is on the hiatus, which many people have focused on, claiming that global warming has slowed greatly or even stopped,” Hausfather said. “Based on our analysis, a good portion of that apparent slowdown in warming was due to biases in the ship records.”

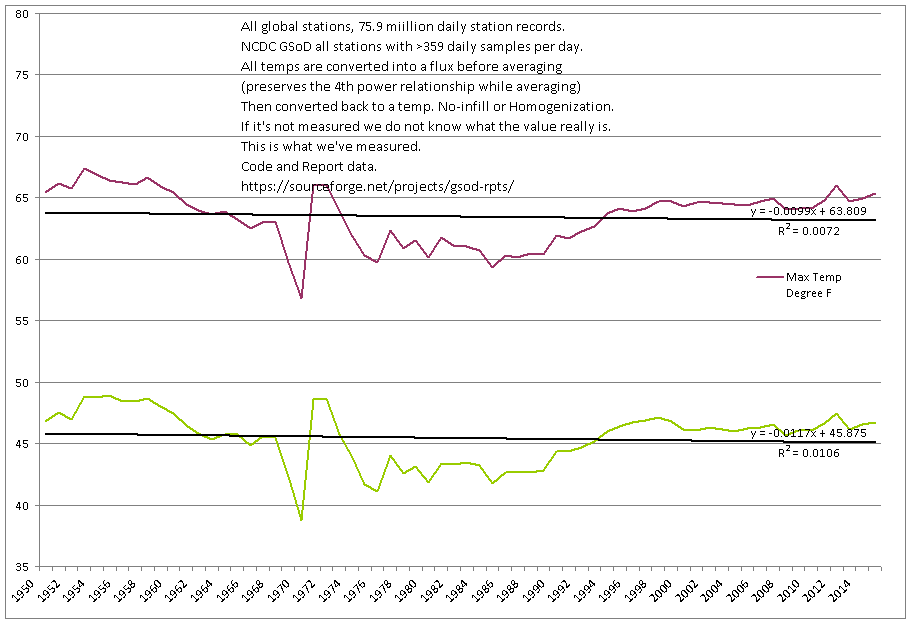
Does not pass the stink test. The surface stations measured a pause.comment image

Reply to  micro6500
January 5, 2017 3:10 pm

That’s cool, I was trying to do something like that with HadGHCND at ftp://ftp.ncdc.noaa.gov/pub/data/ghcn/daily/grid and was getting nonsensical results,, well actually zero anomaly to 8 decimal places nonsense!

Resourceguy
January 4, 2017 1:56 pm

Accounting for El Nino years above a certain threshold like maybe one or two SD might be more insightful.

January 4, 2017 1:58 pm

Measuring with 0.01 °C accuracy? An ocean-sized sample? Over decades? I want to see the equipment. Beam me up Scotty.

Reply to  jaakkokateenkorva
January 4, 2017 3:41 pm

Plus many. An obvious and telling point. No error bars is a classic warmunist tell.

Reply to  ristvan
January 4, 2017 8:37 pm

Would it matter if they did show error bars really?
GISS has already been shown to make adjustments that go way beyond their own error bars.
Is it any real surprise that teams of highly motivated people can, given years and years to come up with something…can come up with something?
Does this fact speak to the objective reality of the state of the climate, or to the character of the people who come up with this, um…stuff?

2PetitsVerres
Reply to  ristvan
January 5, 2017 1:06 am

There are errors bars in the paper.

MarkW
Reply to  ristvan
January 5, 2017 9:20 am

As I’ve been saying for years. If the signal you claim to have found is smaller than the adjustments you had to make to the data, then you haven’t found anything.
These guys make adjustments of up to a degree or two, then claim to have found a signal that’s only a few tenths of a degree.
Nonsense.

January 4, 2017 2:02 pm

One does not need another scientific study to prove the “Pause” is gone. All you have to do is recognize that Monckton is no longer publishing his “XXX months with no global warming” articles on WUWT. “The Pause” ended when he stopped writing the articles.

Reply to  Donald L. Klipstein
January 4, 2017 2:14 pm

Yesterday we hear that the 2016 El Nino year was just 0.02°C hotter than the 1998 El Nino year. If you want to call a rise of .02° over 18 years the end of the pause, then this “warming” will amount to 0.16° over 144 years. The latest scary phrase from the leftists may be global milding: catastrophic death from climate boredom.

bit chilly
Reply to  Eric Simpson
January 6, 2017 4:13 am

anyone claiming we can accurately measure the difference in global temperature between two different years to 0.02 c is either a liar or an idiot.

Reply to  Donald L. Klipstein
January 4, 2017 2:15 pm

Monckton has only made it to the exclusive club of ‘climate scientists’, but also as an overriding authority in the field? Might as well, Monckton seems to know as much about metrology as his new peers.

RWturner
Reply to  Donald L. Klipstein
January 4, 2017 2:23 pm

We’ll be glad to hear back from you in a few months when the pause is 20 years long.

Reply to  Donald L. Klipstein
January 4, 2017 4:04 pm

Perhaps ‘causality’ flows the other way around: when the Pause ended, he stopped writing the articles…

kim
Reply to  lsvalgaard
January 4, 2017 9:21 pm

Ah, but do they come when you do call them?
============

afonzarelli
Reply to  Donald L. Klipstein
January 4, 2017 5:14 pm

Ah, but Lord M. did promise that he would be back! (just wait and see)…

ironargonaut
Reply to  Donald L. Klipstein
January 5, 2017 3:30 am

So, you admit it existed? For something to be gone it must have been here. They are claiming it never was.

January 4, 2017 2:06 pm

Note that Mosher was skunked again as an author.

TonyL
January 4, 2017 2:13 pm

Kewl, I see how it is done.
ARGO, some of the most carefully crafted scientific instrumentation ever made is put into service. The data is compared to ship cooling water data, taken at the heat exchangers, which makes sense for the ship engineers.
The ARGO data is different (cooler) than the ship engineering data, so obviously the scientific data is wrong. So the ARGO data gets corrected upwards.
Now compare the hacked up ARGO data to another hacked up data set and find they are in good agreement. They must be right, the corrections to both are justified. Now let things run for a while. What happens?

In the last seven years or so, you have buoys warming faster than ships are, independently of the ship offset, which produces a significant cool bias

Surprise!
You did not overcorrect the buoy data, no, no, no. We need a new correction on the ship data to warm it up. Then we will eventually need another round of corrections to the buoy data to match the new ship data.
All warming trends are climate and are never questioned. All cooling trends are network bias, calibration error, measurement error. They must be corrected for.
It is breathtaking to see examples of where people actually think like this and actually believe they are doing the right thing.
Man Made Global Warming indeed.

Reply to  TonyL
January 4, 2017 2:30 pm

It’s unabashed data manipulation by the politicized scientists. On every front. And in most cases it’s totally open for everyone to see. They don’t care in the least that their manipulations are open to view and obviously altering the trends in the data, because they know that few will see or be informed of that, as it’s only the final figures or their final conclusions that will be handed off to their lapdogs and accomplices in the politicized media.
It’s shameful, and unethical. But they could care less as they think they are above “mundane normal ethics” as they are the superior ones chosen to perpetrate their leftist cause:
“It is clear that current lifestyles and consumption patterns of the affluent middle class… are not sustainable.” -Maurice Strong, 1989, ex UNEP Director (and pioneer of the global warming scare)
“Isn’t the only hope for this planet the total collapse of industrial civilisation?” -Maurice Strong

Reply to  Eric Simpson
January 4, 2017 8:42 pm

Exactly Eric.
This result has been trumpeted in media outlets around the world as “proving’ there was never any pause.
The number of people who read the headline dwarfs the number who are able to understand how this result was obtained. Most just read the headline anyway.
As expected, the lies will only intensify as the day of reckoning nears.

MarkR
Reply to  TonyL
January 6, 2017 5:02 pm

“All warming trends are climate and are never questioned. All cooling trends are network bias, calibration error, measurement error. They must be corrected for.”
Overall, “cooling” adjustments are bigger than the “warming” adjustments. Unadjusted data show more global warming. http://bit.ly/2j0kcR2

January 4, 2017 2:14 pm

“Personally, it looks like ignoring the most current data available for 2016, which has been cooling compared to 2015, invalidates the claim right out of the gate.”
Wrong
First off the paper was done and completed before 2016 ended.
Second the claim is that Karl got it right
And he did

Reply to  Anthony Watts
January 4, 2017 2:36 pm

The trend lines using the 2016 data, will in fact be different than the data ending on the hotter than normal December 2015.
Yes, they’ll be higher ending December 2016. But this is really not addressing the point of the paper at all.

Bartemis
Reply to  Anthony Watts
January 4, 2017 2:42 pm

This is an important point – the authors were well aware of the El Nino conditions. They knew they would retreat in time. They knew about how long it would take to retreat, and they knew about how long publication would take. I think they dost protest too much.

Reply to  Anthony Watts
January 4, 2017 3:05 pm

Thanks very much for your response to Mosher the Marketer. He is what would be called in the old days an insufferable boor. The substance of his comments is negligible and the style is arrogant. He is a squeaking precursor of the rats who will soon flee the sinking ship of the climate scam. Please keep calling him out when he can’t keep a civil tone.

Joel Snider
Reply to  Anthony Watts
January 4, 2017 4:04 pm

‘Put a sock in it.’
Thank you Anthony. Mosher’s been needing that for a long time.

afonzarelli
Reply to  Anthony Watts
January 4, 2017 5:24 pm

Yeah, this paper is going to be absolute rubbish in a few years time. Nino gone, solar min on the way. This one’s not worth getting all worked up about…

Reply to  Anthony Watts
January 4, 2017 6:22 pm

As far as “erasing the pause”, SST data never had much of a pause anyway. But inclusion of 2016 data radically increases trends. That is because the temperatures in 2016, while slowly declining, were way above the long term trend lines, and so increase the trend. Starting June 1997 was a popular “pause” marker; here are the trends in °C/decade ending Dec 2015 and Nov 2016:

dataset       End 12/15  End 11/16
NOAA SST       1.099     1.316
HADSST3        0.763     1.026
Reply to  Anthony Watts
January 4, 2017 6:36 pm

Correction – units are °C/Century

Lance Wallace
Reply to  Anthony Watts
January 4, 2017 11:21 pm

As Nick and others below point out, the trend will actually INCREASE when 2016 is added in, the reason being that most of the months in 2016 are higher than the best-fit line. I illustrated this by using UAH data and calculating the trend from 1997 through 2015 and then through 2016. The trend through 2015 for the Ocean was NEGATIVE (slightly) at -0.00009 but adding in 2016 made it positive at +0.005. (Of course, both trends are insignificantly different from zero and Oh, by the way, here’s that pesky pause back again!)

Reply to  Steven Mosher
January 4, 2017 4:16 pm

Second the claim is that Karl got it right

A big reason why you are so lost Steve, define “right”?
What zeke got was about the same. Right has nothing to do with it.

Phil R
Reply to  micro6500
January 4, 2017 5:35 pm

micro6500,
To paraphrase a famous ex-president and serial sexual offender, “it depends on what the meaning of “right” is.”

Bartemis
Reply to  Steven Mosher
January 5, 2017 11:18 am

True enough, Lance. But, temperatures are still heading down. We won’t know the bottom until we reach an extended period of reduced rate.
When that happens, will the newly settled values be above, or below, where they started? I’d bet below.

Bryan A
January 4, 2017 2:19 pm

The 2015 analysis showed that the modern buoys now used to measure ocean temperatures tend to report slightly cooler temperatures than older ship-based systems, even when measuring the same part of the ocean at the same time. As buoy measurements have replaced ship measurements, this had hidden some of the real-world warming.

So which is correct then? The old fashioned way which measures warmer or the new high tech way that measures cooler?
Would seem to me that the more modern way would be more reliably accurate even if it is cooler. OOPS, i guess cooler doesn’t fit the mantra.
In a warming world only warmer temperature measurements are correct. anything that indicates cooling must therefore need adjustments

MarkR
Reply to  Bryan A
January 6, 2017 5:04 pm

Bryan A, whether you adjust buoys up or ships down, those have no effect on the trend. The correction is necessary when you change from ships to buoys, and this was worked out by checking results when buoys and ships measured the same bit of ocean at the same time.

RWturner
January 4, 2017 2:21 pm

Anyone else seeing a trend in “research” out of Berkley and other pseudo-universities?

MarkW
January 4, 2017 2:24 pm

Everyone, and I do mean everyone, expected the El Nino of 2015/2016 to end the pause.
That was expected 2 years ago.
Let’s wait a couple of years and see if the pause returns, either after a La Nina, or after a couple of years of back to normal temperatures have occurred.

Resourceguy
Reply to  MarkW
January 4, 2017 2:26 pm

Agreed

afonzarelli
Reply to  MarkW
January 4, 2017 5:39 pm

Mark, we also have a solar minimum on the way. AND with the el nino out of the way, we might expect to see the cool temps that we saw in ’08 without the interuption of an el nino (like we saw in ’10). It might be similar to the deep cooling seen in ’85 (at that solar min) which occurred after an early 80s el nino. A lot of us have waited a long, long time for this. So sit back, kick yer feet up, git yer popcorn ready and enjoy the show… (☺)

scraft1
Reply to  MarkW
January 5, 2017 5:27 am

Good idea. Pinning our hopes on late 2016 data is a fools errand.

ironargonaut
Reply to  MarkW
January 5, 2017 10:46 pm

Food for thought. If the direction the wind blows can change the temperature of the earth that drastically, what does CO2 have to do with anything. Could the direction of the wind just settle into a consistent El Nino and keep temps high or could it settle into a consistent La Nina and keep temps low? Are the directions of the winds the real reason for global warming?

Just Joo
January 4, 2017 2:27 pm

http://www.ospo.noaa.gov/data/sst/anomaly/2016/anomnight.1.28.2016.gif
http://www.ospo.noaa.gov/data/sst/anomaly/2016/anomnight.2.1.2016.gif.
NOAA changed their product in February 2016, so eyeballing makes no sense.
“Notice: CRW’s twice-weekly 50 km products will update around 2 pm on Mondays and Thursdays (U.S. Eastern Time) starting from 1 February 2016, using a new 50 km SST analysis (view details).
For information about these images, go to the methodology webpage.”

Coalsoffire
January 4, 2017 2:34 pm

Let’s do a trend line from a La Nina trough to an El Nino peak and see what we get. Gosh, no pause, who knew?

afonzarelli
Reply to  Coalsoffire
January 4, 2017 5:43 pm

Hivemind
Reply to  afonzarelli
January 4, 2017 8:29 pm

Nick, I think you’ve worked out the warmist’s methodology. Congratulations.

Reply to  Coalsoffire
January 4, 2017 6:39 pm

“Let’s do a trend line from a La Nina trough to an El Nino peak”
So what period would you like? Here is a plot of trends for periods of various start years (x-axis) and ending now. They reach a minimum about 1997; NOAA SST is 1.32 °C/Cen; HADSST3 is 1.03.comment image

john
January 4, 2017 2:38 pm

California Hires Eric Holder as Legal Bulwark Against Donald Trump
http://www.nytimes.com/2017/01/04/us/california-eric-holder-donald-trump
LOS ANGELES — Girding for four years of potential battles with President-elect Donald J. Trump, Democratic leaders of the California Legislature announced Wednesday that they had hired Eric H. Holder Jr., who was attorney general under President Obama, to represent them in any legal fights against the new Republican White House.
The decision by the Legislature to retain Mr. Holder, who is now a prominent Washington lawyer, is the latest sign of the ideological battlethat may play out over the next four years between this predominantly Democratic state and Washington. Hillary Clinton, the Democratic candidate for president, defeated Mr. Trump by more than four million votes here.
“Having the former attorney general of the United States brings us a lot of firepower in order to prepare to safeguard the values of the people of California,” Kevin de León, the Democratic leader of the Senate, said in an interview. “This means we are very, very serious.”
=====
I suppose Jon Corzine will be managing CALPERS too…

January 4, 2017 2:40 pm

Reply to  Steven Mosher
January 4, 2017 5:09 pm

Every time I see one of those poncey little beard/moustache combos I just know I am dealing with an egotistical liar..

Reply to  Leo Smith
January 4, 2017 6:13 pm

With 100% certainty he voted for Clinton.

Bryan A
Reply to  Leo Smith
January 4, 2017 8:21 pm

Perhaps he voted for Johnson thereby giving the election to Trump

MarkW
Reply to  Leo Smith
January 5, 2017 9:24 am

If he’s at Berkley then he voted in CA. It doesn’t matter who he voted for. CA went Clinton by something like 60%.

mountainape5
January 4, 2017 3:03 pm

You can debate the leftovers now, they spread the word out and got the cash.

Reply to  mountainape5
January 4, 2017 3:46 pm

That changes on Jan 20. See AW reply comment upthread. They won this skirmish, not the battle or the war. Ma Nature herself is notmon their side.

Chris
Reply to  ristvan
January 5, 2017 10:44 am

Not remotely correct. The corporate world is moving ahead, nothing Trump does or says is going to change their mind. That is true both in the US and around the world, with very few exceptions.

January 4, 2017 3:03 pm

Whether it’s right or wrong (and everything is wrong eventually) this is real science.
It’s open access. We can check it.
It was on date when first put out for online review.
The authors engage with criticism.
Real science looks to find truth by proposing an idea and defending it with clarity, engagement and humility.
This is real science.
Probably wrong already, though.

Bill Treuren
Reply to  MCourtney
January 4, 2017 7:04 pm

Totally agree they have shown their data and taken the response right or wrong.
In science being wrong is not a fail so long as active thought results that is happening here, my hope is that Trump allows more of this process rather than less of the the lamentable BS that now gets passed as scientific debate.
lets hope.

MarkR
Reply to  MCourtney
January 6, 2017 5:07 pm

“Probably wrong already, though.”
How? The main conclusion shows that ERSST4 agrees well with satellites, buoys and Argo. ERSST3 does not, and we know why – because of changes in the mix of ship and buoy measurements.
It’ll be very surprising if another year of data changes that conclusion, check the difference figures in the paper.

Paul Penrose
January 4, 2017 3:07 pm

My concerns with the satellite data is that you have two different types of instruments here using different methods to calibrate them. AATSR has a precision of about 0.3C and drift as much as 0.1C per decade. I couldn’t get figures on the older AVHRR, but presumably it is even less precision. The buoy data is too sparse to really give us a good picture of “global” SST. I would be interested in seeing specs for the temperature sensors used, but would not be surprised to find out they are some variety of RTD. Which means no better than 0.3C precision and maybe not even that good.
All in all, just going by the instrument precision available, it’s quite likely that the reported trends are within the error bars. The short time period is a problem too. I know that’s all the data that was available from AATSR, but still does not justify pretending the trends mean anything. Many times we just have to admit that we don’t have enough data to know, especially when the variance is so large and the potential trend so small, as it is in this case.

M SEward
January 4, 2017 3:14 pm

Same old same old amateur hour pea and thinble trick to manufacture an uptrend. Finish data sample on a ‘peak’ or uptrend ( say due to a natural event like El Nino) and hey presto the linear fit show an uptrend. You can do the same with data that conforms to a pure sine wave FGS!
Are PhD’s and professorships on discount at Walmart these days?

Rhoda R
Reply to  M SEward
January 4, 2017 9:25 pm

I doubt that PhDs are available at Wal Mart, but I begin to wonder at the amount of statistics PhD candidates are expected understand.

MarkW
Reply to  Rhoda R
January 5, 2017 9:26 am

Depending on the field, it can be as little as none.
That seems to be the case for climate science.

Don B
January 4, 2017 3:37 pm

In October, 2016, Oregon State University’s Philip Mote published a study claiming the low Western US snowpack of 2015 was primarily due to the warm temperatures caused by greenhouse gases.
Of course, the low snowpack was related to the strong El Niño. This winter season, snow has returned to normal as El Niño has disappeared.
It is unlikely Mote will issue a correction, admitting that greenhouse gases were not to blame.
http://oregonstate.edu/ua/ncs/archives/2016/oct/study-west-coast-record-low-snowpack-2015-influenced-high-temperatures
Timing is everything. Another year would have revealed snowpack was normal, just as another year of temperatures might make The Pause reappear.

Joel Snider
Reply to  Don B
January 5, 2017 12:23 pm

‘It is unlikely Mote will issue a correction, admitting that greenhouse gases were not to blame.’
If he did, he would like be sent packing, like George Taylor. ‘Open-minded’ Oregon does not tolerate dissent.

Macusn
January 4, 2017 3:38 pm

All i know is that when i took the temps of the cooling water coming into the condensers, I really did not think i could show a .1 degree accuracy! Some of those dials were only showing increments of 2 degrees. The navy taught us that you could only report accuracy of half the increment marked on a dial so 1 degree. Don’t we have significant figures anymore? I measured water temps from 36 F to 98 F on two different ships. Not 98.001 F.
Mac

Phil R
Reply to  Macusn
January 4, 2017 5:52 pm

It’s an academic thing. Years (many) ago when I was in graduate school for geology, I was taking a geophysics class from a professor that you might call a “theoretical geophysicist (i.e., brilliant at math, but not a lick of common sense).” In one lab we had a problem that was set up as a geophysical exploration on a ship. Due to the intervening time, I don’t remember exactly what the problem was, but I remember it had something to do with the location of the ship, converting coordinates and stuff like that.
The problem was set up with coordinates that had a precision of, like, eight or nine decimal places. for fun, I figured that the coordinate locations were on the scale of like a millimeter. I figured that this precision was ridiculous and that you could never get coordinates like that on a 400-foot ship moving through the ocean and being rolled by waves, so not being particularly good at geophysics but having some other classes (chemistry comes to mind) where they taught significant figures, i completed the problem but truncated the answer to what I thought was reasonable. Needless to say, I got the answer wrong (or mostly wrong) because I got the correct answer, but did not carry it out to the number of decimal places he had in his answer. Got credit for the problem, just not full credit.

Clyde Spencer
Reply to  Phil R
January 5, 2017 1:25 pm

Phil R,
It is interesting that I too got my most rigorous indoctrination in significant figures in my freshman chemistry classes. It was then reinforced in a surveying class I took in my sophomore year. Most of my other classes pretty much ignored the issue because in those days computations were pretty much restricted to slide rule precision.

Reply to  Macusn
January 4, 2017 6:13 pm

It’s all false precision, Mac. The entire AGW field has made an industry of it. And it’s paid them well.

Phil R
Reply to  Pat Frank
January 4, 2017 8:08 pm

Dang, you said in a few brief words what I tried to say in two long paragraphs! I knew I was never cut out for academia.

Reply to  Pat Frank
January 5, 2017 9:42 am

Very instructive story, though, Phil.

Reply to  Macusn
January 5, 2017 6:35 am

Macusn +1 how true! Even more important is how often were the cooling inlet thermometers calibrated and to what accuracy? I doubt they are even in the same league as the units on the buoys. How a scientist can replace an accurate reading with random garbage from various depths and different type and quality of thermometers and with what appears to be zero quality control and then call it “DATA” is beyond me. This just points out how far science has fallen. They seem to be able to publish outright lies without any repercussions. I really think that jail time is needed to correct these people ( I refuse to call these lying scum scientists), if we jail a few maybe the others might fall in line.

Bill Illis
January 4, 2017 3:40 pm

I am reposting a comment I made on December 6, 2016 on WUWT. Especially now that Zeke has confirmed that the satellites and buoys never really showed any difference in the first place.
The reason they threw out the satellite and buoy trends is for “reduced transparency” is my view.
Do you know that they have thrown out the SSTs recorded from the satellites ($ billion of dollars spent by Nasa and the NOAA putting these dozens of satellites up there and they are supposed to be very accurate) but when the NCDC moved from ERSST V3 to ERSST V3b in 2013, they just got rid of the satellite measurements.
“However, the addition of satellite data led to residual biases. The ERSST v3b analysis is exactly as described in the ERSST v3 paper with one exception: ERSST v3b does not use satellite SST data. The ERSST v3 improvements are justified by testing with simulated data.”
https://www.ncdc.noaa.gov/data-access/marineocean-data/extended-reconstructed-sea-surface-temperature-ersst-v3b
AND, then they threw out all the drifters and buoys and Argo floats in ERSST V4 recently implemented in 2015. Huang 2015 Part 1 and Liu 2015 Part 2 and finally in Karl 2015.
“Buoy SSTs have been adjusted toward ship SSTs in ERSST.v4 to correct for a systematic difference of 0.12°C between ship and buoy observations. Although buoy SSTs are more homogeneous and reliable than ship observations, buoys were not widely available before around 1980.” If you are just adjusting the buoys to the Ships (and doing this continuously ever after, then you are not using the buoys.
http://journals.ametsoc.org/doi/full/10.1175/JCLI-D-14-00006.1
Well, I had a look at these.
Throw Out Satellites:
You can’t find ERSST V3 (ships, buoys and satellites) anywhere anymore (the NCDC has scraped the record out everywhere) BUT, naturally I have an old saved copy of the last version ERSST V3.5.1 only up to July 2012 (Stephen McIntyre noted in a subsequent comment that he had a version with a few months of data).
This is why they threw out the satellite data (noting that they really only got going around 1981 or so). REALLY. This tiny difference is well within any type of error margin and made no difference whatsoever.comment image
Throw out Bouys:
And then why did they throw out the buoys (noting that they really only got going around 1980). REALLY. This tiny difference is no difference at all. Huang 2015 Part 1 and Liu Part 2 and Karl 2015 were all based on a fake premise. There is no real difference.comment image
Even if you go back to 1947, You can not say there is any real difference between the Ships and Bouys and just the Ships. There is no rationale to cherrypick different periods like was done in Huang 2015 and Karl 2015 to try to pretend there is some difference. They actually added 0.12C to the trend from 1947 to 2010 based on this difference. After 2010, who knows what was added to the trend.comment image
But then, if you have now thrown out the satellites previously, and then the buoys, you are only relying on the ships now. Since this record ends in 2010, now you have room to bump the record up.comment image
Now if we go way back now and compare the last ship, buoy and satellite record, there isn’t much difference overall, but now one has complete control over what get reported from now on because its all random ship engine intake adjustment algorithms.comment image
There you go. Now you know why. Everything can be calculated in a basement office at the NCDC with ZERO transparency.
And now all we can rely on is the lower troposphere satellite measurements because the GHCN land temperatures from the NCDC are just completely adjusted out of all imagination. And now even the Ocean SST is nothing but adjustment algorithms.
You can easily subtract 0.5C from the NCDC and GISS and Had Centre and BEST global temperatures because that is how much unjustified adjustment has been done.
All the data is here. (Except I don’t think there is a copy of ERSST V3 available anywhere on the net anymore. The NCDC seems to have been very thorough in scaping off every version of it off the internet everywhere. Like why would they do that?.
http://climexp.knmi.nl/selectfield_obs.cgi?someone@somewhere

Reply to  Bill Illis
January 4, 2017 6:51 pm

“Nasa and the NOAA putting these dozens of satellites up there and they are supposed to be very accurate”
Satellites are accurate when they can see, but are flummoxed by clouds, which creates a bias.
“If you are just adjusting the buoys to the Ships (and doing this continuously ever after, then you are not using the buoys.”
Complete nonsense, and buoys are making an increasing contribution. The adjustment is just compensating for the difference. It doesn’t matter what you treat as the standard, and certainly when you form an anomaly and subtract the mean, it doesn’t even matter to the numbers. You get the same anomaly either way.
“All the data is here. (Except I don’t think there is a copy of ERSST V3 available anywhere on the net anymore. The NCDC seems to have been very thorough in scaping off every version of it off the internet everywhere. Like why would they do that?.”
ERSST V3 is where it always was on the NOAA site, here

Bryan A
Reply to  Nick Stokes
January 4, 2017 8:30 pm

But are the buoys biased cold or are the ship intake measurements biased warm?

DWR54
Reply to  Nick Stokes
January 5, 2017 12:19 am

Bryan A
“But are the buoys biased cold or are the ship intake measurements biased warm?”
__________________
From the first paragraph of the paper’s introduction:
“Modern ship-based measurements (primarily ERI, although hull contact sensors and other devices are also used) tend to generate temperature readings around 0.12°C higher than those of buoys, whose sensors are directly in contact with the ocean’s surface (1, 5, 6).”
So ship intake measurements are biased warm.

Paul Penrose
Reply to  Nick Stokes
January 5, 2017 4:17 am

Nick,
What you linked to is the ERSST V3B version without the satellite measurements, as Bill pointed out. It’s the A version (or whatever the pre-B version was called) that he claims has been disappeared. He was very clear about the difference, so either you were being disingenuous or just sloppy.

January 4, 2017 3:40 pm

“Perhaps this is an artifact of the slow peer-review process.”
More likely it’s the result of a peer review process driven by preconceived expectations and confirmation bias.

JasG
January 4, 2017 3:57 pm

Once again all the warming comes purely from adjustments which makes it unfit for policy. Starting at the start of an el nino and ending at the peak of an el nino is either a basic schoolboy error or confirmation bias. The language they use however betrays it as bias.
The pause will be even more evident with the coming la nina. Honest scientists have admitted that the pause will likely continue for another 10 years. And in any event none of these bogus adjustments are big enough allow the data to validate the even more pessimistic models.

knr
Reply to  JasG
January 4, 2017 4:24 pm

when your grant hunting you use ‘bait ‘ that attracts grants .

afonzarelli
Reply to  JasG
January 4, 2017 5:54 pm

“…the pause will likely continue for another 10 years.”
Or perhaps we might get a little “global cooling”(!) No one really knows what’s ahead. Now with this (expletive) nino out of the way, we will finally get to see where things are headed…

TomRude
January 4, 2017 3:59 pm

A little bit here and there… and hop, it is always, always warming…
Good boy. Line up and get funding.

JasG
January 4, 2017 4:05 pm

The satellites, buoys and radiosondes all agree with each other and none agree with Berkeley Earths toy-town amateur effort. The response from Berkeley Earth is that the satellites, buoys and radiosondes must all be wrong by the same amount. It’s like arguing with children!

ReallySkeptical
January 4, 2017 4:06 pm

AW: “Personally, it looks like ignoring the most current data available for 2016, which has been cooling compared to 2015, invalidates the claim right out of the gate. If a climate skeptic did this sort of stuff, using incomplete data, we’d be excoriated. yet somehow, this paper using incomplete data gets a pass by the journal, and publishes with 2015 data at the peak of warming, just as complete 2016 data becomes available.”
Zeke Hausfather: “The reason that the figures shown in the paper end on January 1st 2016 is that we submitted the paper for publication in March 2016. No nefarious hiding of the data involved.”
AW: “No nefarious hiding of the data involved.” Your words, not mine – don’t put words in my mouth, very uncool. I simply say that you had a perfect opportunity to update the data set, when the timing was such that you could have. If it wouldn’t change your conclusions, why not do it then? – Anthony
Uncool? It seems he captured your intent perfectly. Fact is, he answered your questions in detail, very nicely and politely, and in another post correctly argued that with the record 2016 data the results would be unchanged, and now he’s “uncool”. Good way to get real scientists to comment on your blog. Good job.

afonzarelli
Reply to  ReallySkeptical
January 4, 2017 6:00 pm

(better than calling him a bastard… ☺)

JasG
Reply to  ReallySkeptical
January 5, 2017 4:47 am

‘Uncool’ must be the weakest insult ever heard.

MarkW
Reply to  ReallySkeptical
January 5, 2017 9:30 am

If you know that your end point is going to create a problem with your analysis, a reputable scientist either waits until more data is in, or chooses a different end point for his analysis.
Zeke did neither.

Philip Schaeffer
Reply to  MarkW
January 6, 2017 4:19 am

What exactly do you think he was analyzing, and how would changing the end point to include figures from after the paper was submitted, change anything important about it’s conclusions? Have at it.

willhaas
January 4, 2017 4:06 pm

The radiant greenhouse effect has not been observed anywhere in the solar system and is hence fiction. Since the AGW conjecture is based upon the fictitious radiant greenhouse effect, the AGW conjecture is nothing but fiction itself. Sceince fiction authors, manipulate data anyway they want but we must all keep in mind that it is just fiction.

FTOP_T
Reply to  willhaas
January 4, 2017 8:33 pm

Exactly Willhaas,
From the climategate e-mails through the Karlization of the SST data, the ocean temp has been the target de jour for the climate cabal to continue to defend a flawed theory. UAH and RSS place limits on the ability of land based measurements to diverge too much from reality, but the SST measurements are fertile ground for temperature massage therapy.
The absurdity is that leveraging ocean temp to prove AGW is a direct violation of physics:
Air does not heat water due to the dramatically different heat capacities
The ocean heat capacity is infinitely greater than the atmosphere and it is already warmer than the air
CO2 “forcing” doesn’t penetrate beyond the thin surface layer because LWIR is completely absorbed in the first 50 microns
Oceans are heated by the sun and cool primarily through evaporation
There is NOTHING humans can put in the air to warm the oceans
Even if you believe in the fairy tale of CO2 warming, based on the IPCC calculations a100 ppm increase in CO2 has less warming capability than a 2 MPH wind has in cooling capability of water through evaporation.
Using SST to prove AGW literal falls apart in a 2 MPH puff of wind.

Reply to  FTOP_T
January 4, 2017 8:55 pm

FTOP_T
There’s a lot wrong with consensus climate science, but the radiative GHG effect is not one of them and the 3.7 W/m^2 of equivalent radiant solar forcing arising from doubling CO2 is not at all unreasonable and within a few percent of what I get from a HITRAN driven analysis on the standard atmosphere with nominal clouds. Of course, its important to understand that doubling CO2 keeping solar input constant is equivalent to adding 3.7 W/m^2 of solar input keeping CO2 concentrations constant. Otherwise, you count the effect twice.
The idea that each W/m^2 of forcing increases the surface temperature by 0.8C (4.3 W/m^2 increase in emissions) is off by about a factor of 4 and this is the keystone error that most of the other errors depend on.
Also, the GHG effect has been observed on Mars. It even has an effect on Venus, but no so much on the surface below, but on the virtual surface high up in the atmosphere that’s in direct equilibrium with incoming solar energy.

willhaas
Reply to  FTOP_T
January 4, 2017 9:47 pm

What also happens when the amount of CO2 in the atmosphere is doubled is that the dry lapse rate is lowered enough to reduce the radaition effect, if one believes that it is actually there, by a factor of more than 20. So instead of .8C it should really be .04C, a rather trivial abount. The high temperatures on the surface of Venus is all due to pressure and the planet’s proximity to the sun. Despite all the CO2 in the atmosphere of Venus, no radiant greenhouse effect has been observed. The Earth’s surface being on average 33 degrees C warmer because of the atmosphere is all caused by gravity and the heat capacity of the atmosphere as derived from first principals. There is no room for an aditional radiant grenhouse effect.

Reply to  willhaas
January 4, 2017 10:05 pm

willhass,
Gravity certainly establishes the lapse rate, but the direction of the temperature profile depends on which end of the lapse is bound to the surface in DIRECT equilibrium with the Sun. On Earth, the lapse is bound to the ‘surface’ and the temperature decreases as altitude increases. On Venus, the lapse is bound to a virtual surface high up in the atmosphere that is in direct equilibrium with the Sun and the temperature increase as the altitude decreases. These are fundamentally different manifestations of the same basic gravitational effect. And on Venus, the GHG effect does increase the temperature of the virtual surface in equilibrium with the Sun, but the magnitude of the effect is not much different than for the virtual surface of Earth surface in equilibrium with the Sun (top of ocean plus the bits of land that poke through).

willhaas
Reply to  FTOP_T
January 5, 2017 1:49 am

As a matter of energy equilibrum, from space, the Earth appears to radiate out to space as a roughly 0 degrees F black body radiating from an equivalent altitude of 17K feet which is right at the mass vs altitude midpoint of the Earth’s atmosphere. The lapse rate determines the temperatrue profile it either direction. The lapse rate is a function of the pressure gradient and the heat capacity of the atomosphere and has nothing to do with the LWIR absorption properties of so called greenhouse gases. The temperature in the atmosphere of Venus at an altitude of one bar, as compared to the Earth’s surface also at a pressure of one bar, is a function of Venus being closer to the sun then the Earth and the difference in the lapse rate in the atmosphere of Venus vs the lapse rate in the atmosphere of the Earth. LWIR absorption properties of greenhouse gases do not figure into any of the calculations. Compared to the Earth, the temperature on the sruface fo Venus is a function of now much closer to the sun Venus is, the lapse rate on Venus, the pressure gradient on Venus and the depth of the atmosphere. If there were a radiant greenhouse effect on Venus the surface would be much hotter than it actually is.

knr
January 4, 2017 4:23 pm

Science 101 to know the value of something you have to have the ability to accurately measure it .
Nowadays, buoys cover much of the ocean , not even close in reality given the surface area involved and the number of buoys its like claiming you know all about the the geological characteristics of a whole planet based on ‘one rock’ .
Therefore you cannot accurately measure this and cannot know it , You can guess it , you can ‘model ‘ it but you cannot know it at the level of scientific validity that is supposed to be used.

JasG
January 4, 2017 4:39 pm

knr
There are still a heck of a lot more buoys than there ever were bucket measurements and they are pretty well distributed unlike ships which were only on standard routes. The buoy network was specifically set up to end the uncertainty about the inadequate SST measurements which everyone already accepted were totally unfit for purpose. Everyone expected this expensive hi-tech buoy network to settle the issue that man-made warming was obvious. They instead showed no warming, man-made or otherwise. In fact prior to the first set of adjustments they were showing cooling – much to Josh Willis’ embarrassment. Now the trouble is that when everyone expects to see warming then they only ever look for ‘errors’ that adjust the record up the way. This is compounded by the problem that defunding is imminent if you show there is no actual problem to solve. Try as they might though there was no getting a significant warming trend even after ‘error correction’. Hence NOAA decided the buoys had to be ditched in favour of data well known to be unfit for purpose but, crucially, much easier to adjust. The amazing thing is Zeke complaining about skeptics being political. Can they really not see the the beam in their own eye?

January 4, 2017 6:34 pm

Temperature measurements in fluid media and particularly turbulent fluid media are notoriously tricky. Have a go. Obtain a calibrated state-of-the-art sensor plus appropriate signal conditioning unit and attempt to take the temperature of the room in which you find yourself and you will rapidly find out just how tricky it is. Or just take any old thermocouple, thermistor, PRT, pyrometer, LIG thermometer and try to get a consistent meaningful average to within +/- a degree let alone tenths of a degree.
The efforts towards global temperature measurements through a combination of sparse and often inappropriately sited surface station data combined with sparse ocean buoy data and satellite measurements are ridiculous beyond belief.
How anyone with even the most basic training in the physical sciences buys into this is properly beyond me.

Patrick MJD
Reply to  cephus0
January 4, 2017 10:04 pm

“cephus0 January 4, 2017 at 6:34 pm
How anyone with even the most basic training in the physical sciences buys into this is properly beyond me.”
I’ll have a go. I see three possibilities;
1. They are gullible/scientifically illiterate.
2. They are paid.
3. 1 or 2 or all of the above.

tony mcleod
Reply to  Patrick MJD
January 5, 2017 3:12 am

It’s quite possible this year Patrick. After years of low volumes this year’s freezing has had this to contend with this:comment image
The volume is down by over to a quarter of what it was 35 years ago and what is there now is almost entirely thin, 1st year ice in really poor shape – fractured and weak.
It would astonishing if there is much more than a remnant clinging onto northern Greenland and Canada.
Many who watch it carefully are predicting the same.
And so what? First, there’s no going back. Once the ice is gone it’s a very short trip to an ice-free winter and that’ll be a death knell for the Greenland ice sheet.
Geo-forming a frozen desert into a temperate ocean in less than a human lifetime. What could possibly go wrong?
I sincerely hope I am required to admit I was mistaken.

Reply to  tony mcleod
January 5, 2017 4:41 am

First, there’s no going back. Once the ice is gone it’s a very short trip to an ice-free winter

No even close, it’s more propaganda, open arctic water is a net sink to space, not a source of warming.

MarkW
Reply to  Patrick MJD
January 5, 2017 9:35 am

Ice has dropped from the coldest point of the PDO/AMO to the warmest point. You could knock me down with a feather.
Regardless, where does this nonsense that once the ice is gone, it’s gone for good come from?
Loss of ice is a negative feedback, not a positive one.
Lack of ice in the arctic means more snow in Greenland.

tony mcleod
Reply to  cephus0
January 4, 2017 10:35 pm

Would you “buy into” an ice-free Arctic for the first time in 2.5 million years cephus0?
http://www.alpineanalytics.com/Climate/DeepTime/WebDownloadImages/Plio-PleistoceneTs.7.5w.600ppi.png

Patrick MJD
Reply to  tony mcleod
January 5, 2017 12:14 am

Looking forward to see you retract this claim of yours this year.

richard verney
Reply to  tony mcleod
January 5, 2017 3:03 am

The balance of evidence suggests that the Arctic was ice free during the Holocene Optimum only 6000 to 8000 years ago.
I do not know where you get the idea that this would be the first time in 2.5 million years. The balance of evidence does not support that claim.

tony mcleod
Reply to  tony mcleod
January 5, 2017 3:23 am

Your right. I should have said “for most of the last 2.5my. It does seem there have been a few ice free periods including the early holocene.

Patrick MJD
Reply to  tony mcleod
January 5, 2017 3:29 am

“tony mcleod January 5, 2017 at 3:23 am”
Onus on you Tony.

Paul Penrose
Reply to  tony mcleod
January 5, 2017 4:32 am

Yea! An ice free Arctic would be great. Ice is a navigational hazard in the ocean. Great in drinks though.

MarkW
Reply to  tony mcleod
January 5, 2017 9:35 am

The arctic was ice free during the Holocene optimum.

John@EF
January 4, 2017 6:50 pm

Bit of an odd desperate yet petty sounding post title … which is echoed at various points within the reply/comment section. Wasn’t the 2016 temperature record warmer than 2015?

Reply to  John@EF
January 4, 2017 9:06 pm

Wasn’t the 2016 temperature record warmer than 2015?

Yes. For Hadsst3, the 2015 average was 0.592. The average after 11 months in 2016 is 0.627. See:
https://crudata.uea.ac.uk/cru/data/temperature/HadSST3-gl.dat

Paul Penrose
Reply to  Werner Brozek
January 5, 2017 4:37 am

Putting aside whether we can even measure the global temperature to thousands of a degree with the kind of instruments used, is the difference between 2015 and 2016 even statistically meaningful? At .035C I would think that are statistically a tie.

Reply to  Paul Penrose
January 5, 2017 9:43 am

“At .035C I would think that are statistically a tie.”
Anything less than 0.5C would be a statistical tie which means that other than La Nina minima and El Nino maximum, whose extents are about at the limit of rational detection, any absolute claim of warmest or coldest years are meaningless.

Reply to  Werner Brozek
January 5, 2017 4:56 am

At .035C I would think that are statistically a tie.

That is correct. And the difference will be even less when December’s number comes in. However as others have pointed out earlier, when 2016 is included, the slope is larger than when it is not included.

O R
Reply to  Werner Brozek
January 5, 2017 7:28 am

December ERSST4 data is in, the year 2016 is complete
Global Absolute annual temperatures in degrees C from KNMI climate explorer
2015 18.63611
2016 18.64894

thingodonta
January 4, 2017 6:53 pm

the oceans will continue to warm for a certain period after the surface stops warming.

noaaprogrammer
Reply to  thingodonta
January 4, 2017 10:32 pm

It’s the pause that refreshes.

Kailer
January 4, 2017 7:12 pm

I have a lot more confidence in Berkely Earth than NOAA, mostly because of Richard Muller, who I find to be the closest thing to an honest broker in the climate change debate. He’s someone who took it upon himself to look at the actual data and came around to the idea that global warming was caused by humans. At the same time he never failed to condemn the behaviour of the CRU and Mann as frauds, which proves he’s not a zealot with blind faith in the climate priests. The fact that they were so quick to respond to your requests and so transparent with their analysis only reinforces my opinion of them. I have to constantly remind myself to not make the same mistakes alarmists do and blindly reject anything that doesn’t agree with my priors.

O R
Reply to  Kailer
January 5, 2017 7:57 am

So You trust BEST l/o more than Gistemp loti?
Well the trend of BEST l/o is 0.180 C/decade in the satellite era, whereas that of Gistemp loti is “only” 0.172 C/decade

Reply to  Kailer
January 5, 2017 9:15 am

Sorry Kailer but Richard Muller was not a skeptic. He has always been a warmer. You are reading the garbage published by the MSM.

MarkW
Reply to  Kailer
January 5, 2017 9:37 am

Muller? Would that be the guy who claims that he was once a sceptic, but his previous statements contradict this claim?

Julien
January 4, 2017 7:35 pm

It seems to be looking more like they’re cherry picking the end date for misleading the readers.
Besides, they also claim that their result was achieved thanks to “adjusting” 2 disjoint datasets, according to the description on phys.org. Yet another politically motivated and untrustworthy study as a result.

January 4, 2017 8:56 pm

These kinds of studies are completely useless. The minimum period is a solar cycle in the case of climate change. The media will tell stories about the warmest year 2016 in the history and they do not even bother to mention that it was El Nino year – the strongest of the recorded history.

Chris
Reply to  aveollila
January 6, 2017 1:41 am

Except that the article above says it was weaker than the El Nino in 1998, so clearly not the strongest in recorded history.

Patrick MJD
January 4, 2017 9:59 pm

Picked up by our alarmist media here in Australia.
http://www.smh.com.au/environment/climate-change/no-cooking-the-books-new-study-confirms-global-warming-hiatus-didnt-happen-20170104-gtlujo.html
The media are all over this like a rash, an expert from The Climate Council, not Flannery, received copious amounts of air time on ABC stating that the “window of opportunity to reverse climate change is closing”, or some other such rubbish. Sigh…

Reply to  Patrick MJD
January 5, 2017 3:53 am

It was on channel 10. Some [pruned] called Steffen sprouting the the usual time is running out scenario. The usual scenes of unprecedented storms and heat waves, bush fires.It was the warmest Evah .At no time was the actual anomaly mentioned. The ABC news wasn’t as alarmist surprisingly. We’re all doomed for a fraction of a degree.The inmates are in charge of the asylum.

January 4, 2017 10:50 pm

The sun heats the oceans, the oceans heat the atmosphere. So if there is any global warming, it’s the sun what did it, not CO2. These people yet again shoot themselves in the foot.

Chris
Reply to  Phillip Bratby
January 6, 2017 1:43 am

CO2 traps more heat in the earth’s atmosphere. More CO2 in the atmosphere, more heat gets trapped. That’s what has changed, not the sun, and it’s the change that matters, not the source of the earth’s heat.

David S
January 4, 2017 11:02 pm

i find it fascinating that there is this big argument about historic data. There are big arguments about what adjustments are appropriate if any. There are big arguments about what was the actual data prior to satellite. How the hell can any normal person think that with this level of uncertainty about the past there can be any certainty about future prediction. My suspicions are that the real error bars would exceed the amount of change. With that level of uncertainty why would any normal human being allow his government to adopt measures that significantly impact current living standards without any likelihood they would have meaningful impact. Who also decided that 2 degrees warmer would be bad anyway. No one seams to be too traumatised if their work circumstances mean they have to move from Canada to say Hong Kong. The lack of logic behind the whole AGW scare indicates to me that globally a large number of people have lost their collective minds.

TA
Reply to  David S
January 5, 2017 12:54 pm

“The lack of logic behind the whole AGW scare indicates to me that globally a large number of people have lost their collective minds.”
It looks that way, doesn’t it. A lot of people seem to be living in a different reality. CAGW is giving us a lesson in human psychology

January 5, 2017 12:13 am

The MSM is all over this like a rash. The average punter doesn’t want to know about the problems in measuring the data, just the headlines. The average innumerate journalist too. However there is something inherently implausible about taking three measurement systems (all of which have defects) across maybe 70 years of data and claiming to be able to measure average ocean surface temperatures to 0.1C accuracy, and identify a trend. And I have to say, taking the period 1998 to 2015 just looks odd. The oceans seem to involve cycles decades long so why not use the whole period for which data – however flaky – is available? But top marks for publishing what they have.

mothcatcher
January 5, 2017 1:40 am

Hi, Zeke, if your are still listening!
Please let me record, as someone from the sceptical side of the argument, my embarassment at the way your paper has been treated by the commenters here, and even by AW ( for whom I have a high regard). Let me also record my thanks for the clear and polite way you have responded to some pretty middle-earth stuff.
There may be good reasons why your results can be criticised, but until I see them laid out in a coherent fashion, I’m okay with your exposition. Would seem confirmation bias is far from confined to the warmist side.

Simon
Reply to  mothcatcher
January 5, 2017 10:30 am

Well said.

JTK551
Reply to  mothcatcher
January 5, 2017 11:11 am

Gotta agree with mothcatcher. This is how science is supposed to work. Transparency. Not perfection, or a search for the ultimate truth, but published studies that folks can study and challenge. Cudos to Zeke for engaging.

basicstats
January 5, 2017 2:07 am

The basic problem here is the data. A mish-mash of different instruments whose relative proportions (and coverage) in the combined sample change drastically over time is difficult, if not impossible, to assemble into a single metric. Reading the authors twisting and turning over obvious issues of spatial coverage (and baseline), it becomes a matter of trust that there has not been wholesale datamining. Kriging, with its typically much too smooth interpolation functions, does not inspire confidence.
One basic point about Karl-type offset corrections using the mean difference. This might be ok if there is a systematic 0.12C ship-buoy difference. But common sense (could be wrong of course) suggests the discrepancy is actually made up of a lot of small errors (say 0.01-0.02) together with a small proportion of very large outliers where something has gone badly wrong. The mean difference is a very poor summary of this type of discrepancy.

richard verney
Reply to  basicstats
January 5, 2017 3:00 am

i see this as a significant issue.
What ships are actually being used for ship data?
Are these trading vessels?
If so they are measuring ocean data over narrow trading routes/lines.
Further, trade has changed over the years, so the routes have also changed?
Also, whilst ships may still be sailing similar routes, the way in which they are sailing these routes may have changed. Eg., some legs may now predominantly be ballast voyages, or some routes which in the past were ballast voyages, are now laden voyages. All of this would have a material impact upon the depth at which a ship draws its inlet water (via the inlet manifold which is situated low down towards the keel of the vessel) and thus the depth at which the ship is measuring sea temperature.
At the end of the day, ships are not measuring SST.
Surface Station have design regulations with respect to Stevenson screens etc. But is there any similar quality control with ships, or is it nothing more than a general mish mash of data?
We live on a water world. The vast majority of energy is stored in the oceans, and yet we have the least reliable data on the oceans when the measurement of the oceans is the most important metric.
In my opinion, pre ARGO, the data is worthless. ARGO data is too short and there is spatial coverage issues. Further, shortly after ARGO was set up, the buoys that were showing ocean cooling were simply discarded and not returned to laboratory to check whether there was some problem/error with equipment/calibration. This alone raises serious issues as to the merits of ARGO data.

MarkW
Reply to  richard verney
January 5, 2017 9:39 am

Over years, ships themselves have changed dramatically.
That’s another factor that has to adjusted for.

January 5, 2017 2:08 am

Zeke along with rest of the authors are doing a Reddit AMA(Ask Me Anything) on January 9th around noon Pacific Time. He comments to the minions of /r/science about the paper, here.
https://www.reddit.com/r/science/comments/5m11tu/new_study_confirms_that_global_warming_never/dc0qbgq/
The AMA Subreddit is here, for those that want to chime in or ask a question. https://www.reddit.com/r/IAmA/
If you are unfamiliar with Reddit, it’s the 7th ‘most popular site’ in the US. 2 spots above Twitter.

richard verney
January 5, 2017 2:40 am

@ Zeke Hausfather
Very good to see you commenting on and clarifying some of the points raised by your paper. I would appreciate your clarification on the following:
1. At what draft do buoys measure SST?, ie., how many cm below the surface is the temperature measured?
2. At what draft do ships measure sea temperature via the engine intake? ie., how many metres below the surface is the intake situated?
3. What adjustments are made to take account of the fact that the draft of a vessel, and thus the depth below the surface at which the vessel’s engine intake is situated, varies between vessels, and even with the same vessel its draft varies on a daily basis as consumables are used,,as trim is adjusted etc.
4. What adjustments are made, and how are these assessed, to take account of differences in ship design over the course of the last say 40 years which has an impact upon the depth at which vessel’s engine inlet is situated below the surface? If the fleet and composition has changed over the years, then it follows that the depth at which sea temperature is being drawn for measurement has also changed over these years.
5. Is it not the case that buoys, buckets, and ship engine inlet all measuring different things? Is it not more correct to view them as giving an insight into the temperature profile of the ocean, rather than to consider that they are interchangeable and can be compared on a like for like basis?
6.. Whilst this is only a guess, I would have thought that most ships were intaking water at least 5 metres below the surface, and many very considerably deeper than that. Isn’t one of the major issues here that ships are not measuring SST?
Your comments/clarification would be appreciated.

jaffa68
January 5, 2017 2:47 am

Alarmists must love the amount of time they get sceptics to waste arguing over peripheral issues like this.
Even if sceptics were to accept that every year is hotter than the last all it tells us is that the planet, which has always warmed and cooled, is warming – so what?
The only relevant issues are
1. how much warming is unnatural
2. are the implications (of any unnatural warming) negative
The alarmist answers seem to be…….
1. models & proxy analysis prove it is unnatural
2. models prove it is going to be a catastrophe
When questioned about their analysis the alarmist scientist response is, my pals agree with me and I agree with them, you can’t see what we did because you’re not part of our club and if you don’t accept what we say you must be evil.
We need to stop being diverted by talking points that allow alarmists to hide their work. Activist scientists can’t be trusted unless they hand over all their models, programs and data for analysis by every interested party. Since they claim the entire planet is at risk there’s no reasonable excuse for hiding this information. Clearly it’s weak at best but probably garbage.

Reply to  jaffa68
January 14, 2017 8:48 am

JAFFA 68 WRTOTE:
“Alarmists must love the amount of time they get sceptics to waste arguing over peripheral issues like this.
Even if sceptics were to accept that every year is hotter than the last all it tells us is that the planet, which has always warmed and cooled, is warming – so what?”
MY COMMENT:
How dare you bring such common sense to this comment section !
Where are your data?
Where are your numbers?
Where are numbers to two and three decimal places?
Do you have a PhD?
In my opinion, the only relevant questions are:
(1) Is the climate in 2017 causing problems for people and the crops they grow?
The obvious answer is no, but assuming some people will say yes — then
(2) What are the problems caused by a slight warming since 1850 ?
(considering that half of the “warming” is from “adjustments” to the raw data, and the warming seems to be mainly affecting the Arctic and the surrounding, barely inhabited land).

Editor
January 5, 2017 4:06 am

I note that the graph starts in 1999, ie in the middle of La Nina
Why did it not start in 1998?

Thomho
January 5, 2017 4:28 am

A concluding comment in the wake of this study made by the lead author is “based on our analysis a good portion of the apparent slowdown in (global) warming was due to biases in the ship records”
Ie there was no real pause in global warming
Well if so I cant help idly wondering how come all those climate scientists (eg Prof Malcolm England) at the time earnestly wrote learned academic papers purporting to explain the cause of the pause ?? Eg it was due to faster or weaker winds across the Pacific ocean etc etc

Reply to  Thomho
January 5, 2017 5:46 am

“Well if so I cant help idly wondering how come all those climate scientists (eg Prof Malcolm England) at the time earnestly wrote learned academic papers purporting to explain the cause of the pause ?? Eg it was due to faster or weaker winds across the Pacific ocean etc etc”
Because, at the time there seemed to be ….. though on inspection of the impact that the PDO/ENSO, one can see why.
Yes, natural variation is there as well.
Thing is, the IPCC use an ensemble of forecasts that eliminate that natural variation – which is why there are increasingly wide 95% cl’s with the median, and which the obs stayed within.
That is what scientists do, investigate stuff if it don’t fit.
I remember a paper that pointed out that the GCM runs that had the correct ENSO cycle were on the money FI.
It should also be noted that the forcing, turned out to be less than expected for the IPCC projections.
Now with the PDO cycle gone +ve the full warming trend has resumed.

bit chilly
Reply to  Toneb
January 6, 2017 4:43 am

i think i am beginning to understand what the problem is/was with uk weather forecasting.

JasG
January 5, 2017 4:36 am

The BBC are on it too. The only time they actually mention the consensus-established pause is when there is a pause-buster paper out. They ignore all papers that say the opposite. They now call the NOAA adjustments “controversial” only because they can now say the new paper validates it.
The plain fact that anyone with any understanding of the issue – including the authors – can see it as trash. Obviously they are trying to influence policy while complaining about skeptics doing the same. The difference is that only the skeptical side is honest while alarmists are deliberately lying to protect their own fallacious concept of the greater good. A concept that will lead to widespread poverty & misery if unchecked.

January 5, 2017 6:28 am

A. Watt mentioned in the article:
“What’s missing? Error bars showing uncertainty. Plus, the data only goes to December 2015. They’ve missed an ENTIRE YEAR’s worth of data, and while doing so claim “the pause” is busted. It would be interesting to see that same graph done with current data through December 2016, where global SST has plummeted. Looks like a clear case of cherry picking to me, by not using all the available data. Look for a follow up post using all the data.”
There is a common misconception that including the downward part of an up-spike of a graph temperatures will make a lower trend. The opposite is the case. As I had only the Hadsst3 data, I made the excercise with it.
http://www.woodfortrees.org/plot/hadsst3gl/from:1997/plot/hadsst3gl/from:1997/trend/plot/hadsst3gl/from:1997/to:2016/trend
As you see, including the missing cooling phase after Jan 2016 gave a steeper trend than the graph until Dec 2015, being on the top of the spike. Every value within a spike is above average and will thereby steepen the trend.
If one wants to have a realistic trend, he has to make it without extreme events like ENSO. Just like Judith Curry said: To see if the pause is still there, we have to wait until the comming La Nina has levelled out. Say two years or so.

Resourceguy
Reply to  Johannes S. Herbst
January 5, 2017 6:34 am

Exactly, but the headlines are already out now and all over. The details are another matter. I seem to recall the use of strawman arguments in the early attempts to kill the pause notion by saying it was pinned to a strong El Nino on the starting point (wrong). Now we have an actual case of pinning the end of the data series to another strong El Nino year. You know it’s all a big con when they get their way going and coming.

January 5, 2017 6:46 am

For comparing apples with apples, we should stick to global temperatures and not using sea surface or land only graphs.
Hadsst3 never had a pause, even before El Nino in 2014.
Hadsst2 had a pause form 1997 until July 2012.
http://www.woodfortrees.org/plot/hadsst3gl/from:1997/plot/hadsst3gl/from:1997/to:2014/trend/plot/hadsst2gl/from:1997/to:2012.5/trend

Reply to  Johannes S. Herbst
January 5, 2017 11:14 am

Hadsst3 never had a pause, even before El Nino in 2014.

Hadsst3 did have a significant pause a while ago.

5. For Hadsst3, the slope is flat since March 2001 or 13 years, 4 months. (goes to June)

That is from my article here:
https://wattsupwiththat.com/2014/08/23/midyear-prognosis-for-records-in-2014-now-includes-june-data/

Aaron Edwards
January 5, 2017 7:23 am

Here is a link to a paper describing the difficulty of measuring SST from ship data. Accounting for and fully understanding the vagaries involved in compensating for a number of highly variable factors is far from an exact science. Similar to extracting temperature from tree ring data one should be regard any assumptions made about adjustments that favor the idea of cooling off the old data set to amplify the warming trend should be taken with a critical eye. The idea of an adjustment is sound but I cannot understand why any one would be so naïve as to proclaim that their particular adjustment scheme is the truth. One could think of reasons why the old data was too cold and therefore should be adjusted downward. I wouldn’t put much stock into the idea that we know enough to posit the idea that we have revealed a massive trend of SST catastrophic warming by any such educated adjustments downward.
LINK: J.B.R Mathews Comparing Historical and modern Methods of SST Measurements PART 1
http://www.ocean-sci.net/9/683/2013/os-9-683-2013.pdf

Editor
January 5, 2017 7:45 am

On the contrary, the fault with the paper, if it is indeed faulty, is not that the data set ends in 2015, though that is convenient if one wants a big uptick at the end.
The fault in the paper is contained in a single sentence, the last sentence, in conclusions section:

Overall, these results suggest that the new ERSSTv4 record represents the most accurate composite estimate of global SST trends during the past two decades and thus support the finding (14) that previously reported rates of surface warming in recent years have been underestimated.

Their implication, and this is certainly confirmed in their press releases and interviews, is that this SST re-evaluation means that Global Surface Temperatures trends have been underestimated — blown up to be “pause busting” everywhere (but NOT in the paper itself).
They start the paper with this perfectly reasonable sentence:

“Accurate sea surface temperature (SST) data are necessary for a wide range of applications, from providing boundary conditions for numerical weather prediction, to assessing the performance of climate modeling, to understanding drivers of marine ecosystem changes. “

No mention of global surface (land and sea) temperatures in there….no mention of climate change in there.
I feel that Judith Curry’s take is probably correct — we really can’t know what is going on here until the data sets get sorted out.
It is improper to say that “here we show that over the last 15 years, SSTs are increasing by trend therefore there has been no global warming pause.”
If one looks at the “data” files linked in Zeke’s email, they look like this: [very tiny excerpt]

1997.79166667 0.0177318198296
1997.875 0.0537548223484
1997.95833333 0.105809554399
1998.04166667 0.169285042633
1998.125 0.132279643598
1998.20833333 0.122622513514

These single numbers, like the one bolded, for each time/data, are claimed to be a valid representation of a reality that looks like this:comment image
My very personal opinion is that this all is mathematics gone mad …

January 5, 2017 7:49 am

… different instruments for different eras, … different methodologies for different measuring instruments, … differing skill levels, … different standards of strictness, … errant wash ups because actual humans are not present all the time monitoring, exerting the same exacting standards everywhere consistently, … what a nightmare !
… and how does one homogenize all this within the seemingly small range of concern that we are talking about, again? … with more models ? … with more room to apply best guesses, maybe in critical areas of uncertainty?
There just seems to be considerable … flexibility, shall I say, for creativity in all this.
How can we agree on a trend, if we cannot even agree on how it is measured, or that we CAN measure it?

MarkW
Reply to  Griff
January 5, 2017 9:43 am

I wonder why Griff never includes articles from sites that actually do science?

Joel Snider
Reply to  MarkW
January 5, 2017 12:17 pm

Because that would undercut his messaging, so he has to rely on self-described ‘evangelists’ like ol’ Phil from Slate , who makes a living selling alarmism, and is currently begging for money (offerings?), to keep his crusade alive.

Caligula Jones
Reply to  MarkW
January 5, 2017 12:49 pm

Give him a break. That’s “Cut and Paste 201”. He’s still a freshman.

Chris
Reply to  MarkW
January 6, 2017 1:44 am

I almost never see you post links to sites of any kind, just comments.

Reply to  MarkW
January 7, 2017 1:04 pm

If you’ you had bothered to look you would have seen that there were 3 links included in the article pertaining to and of the subject in question.
And really?
on WUWT you say … “I wonder why Griff never includes articles from sites that actually do science?”
Oh the irony and the word beginning with “h”.

RBom
January 5, 2017 8:23 am

Looks like the buoys tend to congregate toward equatorial waters and the satellite clocks tend to sow down (on ascending and descending orbits the “clock” position trails the real position so that the reading-time minute-daily of the clock over years are occurring across the equatorial waters). This means all the “data sets” have a “warm” bias. But as written above, the real errors (lack of accuracy, precision and incalculable uncertainty) are so large makes the analysis and conclusions irrelevant.
Boys will be boys when attempting to reconcile the phallus with the chalice using Lunar Laser Ranging and VLBA interferometry. The phallus always wins.

knr
January 5, 2017 8:43 am

It has achieved the most important the most important thing any piece o climate ‘science research’ can. Lots of free and unquestioning plugging through the national news media . The authors must be very happy , and for them the even better news is there will be zero coverage when the paper gets demolished .

January 5, 2017 9:56 am

The REAL question, would you drive over a bridge or occupy a multi-story building designed and built by any of these guys doing supposed CLI-SCI and massaging previously recorded data?
Neither would I …

Steve Oregon
January 5, 2017 11:17 am

There is one absolute. This WUWT page demolishes the alarmist’s constant claim that the science is not discussed here.
This thread is likely the most both sides attended, thorough, germane, open, frank and public discussion anywhere. Including participation by the author of the study itself.
One would hope there would be some or more uniformly accepted, incremental baby step conclusions produced.
But the resistance by some to accept some of the most rudimentary realities regarding the limits to the reliability and meaning of global measurements perpetuates an unnecessary obstruction to healthy dialogue progression.
Such a rigid impediment cannot be good for any kind of science.
But what do I know?

January 5, 2017 12:35 pm

Again, if we cannot agree on what the measuring instruments are doing, what the measuring instruments are measuring, whether the measuring instruments ARE measuring what we are in disagreement over what they are measuring, and what methods we use to homogenize what we seem to disagree we are even measuring, then I think that there is a more basic problem here …
… maybe using the common words “global temperature” is the problem, in that these words themselves do NOT describe a real measure at all. … I know that dwelling on this possibility messes up a lot of people’s fun or professional dedications, but at some point, we might have to get down to mass deconstructing the very foundation.
There is already a dedicated group trying to slay the dragon — “heat-breathing” CO2 monster. Maybe we need a dedicated group to slay the “mathmyth” (another monster sort of like the Kraken, except more insidious, in that it attacks the processes of the mind).
Let’s review, for example:
https://www.corbettreport.com/?powerpress_embed=17190-podcast&powerpress_player=mediaelement-video

Reply to  Robert Kernodle
January 5, 2017 1:04 pm

There is already a dedicated group trying to slay the dragon — “heat-breathing” CO2 monster.

The greenhouse effect from co2, has no affect on cooling or min temp.comment image

Reply to  micro6500
January 5, 2017 1:55 pm

I have no idea what I am looking at, micro. Go ahead, call me Ig Nor Ramus.

Reply to  micro6500
January 6, 2017 7:13 am

[still trying to clarify]
So, what you are trying to visualize is the rhythmic relationship between four variables on a two-dimensional graph where most people are used to seeing only two variables at a time visualized. This is what confused me. Plus all those radiating arrows pointing to peaks and valleys cluttered my first-impression view of the graph.
Just to make sure I understand, … am I correct in thinking that there are two other scales implied on the left — one for relative humidity, and one for temperature ?
If so, then is my crude (I emphasize “crude”) redrawing of your figure anywhere close to correct ? If so, then this is visually more clear to me.comment image
Over the elapsed time of a day, radiation is low, when relative humidity is high, and radiation is high, when relative humidity is low. Yes ?

Reply to  Robert Kernodle
January 6, 2017 7:31 am

The simple answer is yes. If you masked off the Sun, the surface radiates 24×7, and as you say when rel humidity is “high” there is measurably less energy being radiated away from the surface. And when humidity is low, the rate is high. During a sunny day, there is a large net incoming energy rate. But once the sun starts to set, temps fall at the rel humidity limiting rate if it’s over about 70%, when it’s less than that it cools about 3 x higher which is the co2 limiting rate. Since rel humidity is a temperature effect, this temperature regulates cooling to dew points, then slows down.

Reply to  Robert Kernodle
January 5, 2017 2:28 pm

It’s 3 clear sky days in Australia, net rad is measured delta radiation from the surface, then there’s temp and rel humidity. Every night after air temps drop near dew point temps, and rel humidity start getting into it’s upper range, the outgoing radiation drops by about 2/3rds. It did not get foggy or cloudy. While this is happening you can still use a telescope.
But because the transition is temperature based, any excess warming from co2 would get radiated prior to the slowing of the cooling rate, until that excess had been radiated from the surface.

Reply to  micro6500
January 5, 2017 3:33 pm

Okay, thanks.
For further clarification, if you don’t mind, what is the scale on the left (and units), and what is the progression as we move from left to right?

Reply to  Robert Kernodle
January 5, 2017 5:19 pm

Left scale is W/m^2, there are just under 4 days, the horizontal sampling scale was I think every 10 minutes and excel couldn’t display a usable x scale. It is easiest just to reference min and max to make the passing of time.

Reply to  micro6500
January 5, 2017 3:42 pm

I clicked on your handle and went to your website, micro, and I’ll study that too.

Reply to  Robert Kernodle
January 6, 2017 7:34 am

Here is a less annotated uncropped versioncomment image

Reply to  micro6500
January 6, 2017 7:36 am

The jagged edges in the afternoon, is scattered clouds. The days are warm enough to get some clouds in the afternoon, then as it cools it clears again. See that in Ohio as well on clear days.

Reply to  micro6500
January 6, 2017 10:44 am

To my novice mind, this seems like profound insight, and so forgive me if I need to dwell on it further.
Could you summarize what this means ? That is, In those high cooling-rate “valleys”, where relative humidity is high and radiation is low, what’s going on with the heat transfer ? Is water vapor heating, while CO2 is sort of “hanging out” ? Or is CO2 transferring heat to the water vapor that is heating, thereby putting that heat into a place that will rise upward via convection to transfer out in the upper atmosphere ?, … which means that CO2 is transferring heat into a cooling mechanism, as I seem to understand that you might be saying ?

Reply to  Robert Kernodle
January 6, 2017 11:09 am

I’m not sure. My lead theory is that it is just an IR fog, that is not visible (redundant). And many times I’ve thought fog felt “warm”, and I wonder if that’s not from a high IR flux, ie the fog is brightly lite, and we feel that IR.
Consider (since rel humidity is near 100%) it’s the equivalent of a laser cavity as all of the lasing materiel is discharging, only in the case of the atm, there are no mirrors.
“this seems like profound insight”
I think so, hence why I’m being annoying about it and keep bringing it up. The lights will come on…

Reply to  micro6500
January 6, 2017 12:03 pm

I just had my mind blown by the physics exchange between one of the latest article authors and Nic Stokes.
Now this adds yet another mind-blowing dimension to THAT !
All this backroom technical obscurity eventually comes to light in some simple-minded generalization in the future that a fifth-grader can understand, hopefully. It’s hell what you have to go through to reach a basic conclusion. Glad somebody is doing the work, since it’s out of my little league. (^_^)

michael hart
January 5, 2017 1:23 pm

“The research was funded by Berkeley Earth.”

…Who list several anonymous foundations as donors.
I guess that’s alright then /sarc. Maybe Willie Soon should be afforded the same luxury.
The saddest thing is actually the answer you come up with when you ask yourself “why would any genuine scientist actually want to spend time producing a paper like this?”. It is clearly done for ephemeral political/funding purposes.

Shub Niggurath
Reply to  michael hart
January 5, 2017 10:10 pm

BEST is funded by the Novim group.

Gonzo
January 5, 2017 1:36 pm

I’m calling BS on their graphs/data. How can 2010 mini el nino SST’s be warmer than the monster 1998 el nino SST’s? This is the same kind of “climate science” that shows 1930’s US temps cooler than 1980’s/90’s

January 5, 2017 2:00 pm

… and I am reminded of THIS:
https://wattsupwiththat.com/2011/12/31/krige-the-argo-probe-data-mr-spock/

One problem here, as with much of climate science, is that the only uncertainty that is considered is the strict mathematical uncertainty associated with the numbers themselves, dissociated from the real world. There is an associated uncertainty that is sometimes not considered. This is the uncertainty of how much your measurement actually represents the entire volume or area being measured. …
… Now recall that instead of a bathtub with lots of thermometers, for the Argo data we have a chunk of ocean that’s 380 km (240 miles) on a side with a single Argo float taking its temperature. We’re measuring down a kilometre and a half (about a mile), and we get three vertical temperature profiles a month … how well do those three vertical temperature profiles characterize the actual temperature of sixty thousand square miles of ocean? (140,000 sq. km.)

O R
Reply to  Robert Kernodle
January 5, 2017 4:21 pm

How well can we estimate UAH TLT v6 global temperatures if we discard 99,83% of the spatial information, and only measure in 18 points worldwide? Quite well seemingly…
http://postmyimage.com/img2/581_image.png

jpatrick
January 5, 2017 7:20 pm
TomRude
January 5, 2017 10:08 pm
Katatetorihanzo
January 6, 2017 4:16 am

The arguments against global warming seem consistently based on a variety of short-term and regional variations that seem intuitively inconsistent with the more obvious longer term trend. For example, I lost 20 lbs of weight over 200 days and plotted the daily weighings. The weekly trends mostly appeared as if my weight-loss took a ‘hiatus’ depending on the beginning and end of my trend line. To those not ideologically opposed to the idea that the total climate system is simply gaining heat energy on average, I suggest the following cartoon explaining the difference between superimposed short and long term variation. https://youtu.be/e0vj-0imOLw.

albertkallal
January 6, 2017 8:41 am

Well, in place of a 270+ posts, it would have been great for WUWT readers to cook up a reasonable response to this pause busting paper. This paper hurts our talking points in a rather bad way. What surprises me is how much the left have upped their game. Usually such papers can be blasted full of holes like Swiss cheese – not in this case. Looking at the comments here – you skeptic folks just got your faces bashed and the crap beat out of you on this round. Ouch! All of the major newspapers are having a field day with this new headline – we needed a “good” counter response here while this issue is hot – sadily, I came here to this thread expecting some great counter points – all I saw was our side getting pounded and our you know what soundly roosted on this! We will recover, but I was hoping for a better counter punch and found none here.

Reply to  albertkallal
January 6, 2017 1:15 pm

… a reasonable response, albertkallal ?
Reason doesn’t seem to work, so let’s try something like this:
“On first look, a recent, undoubtedly desperate attempt at a … scientific [clearing my throat, laughing] paper, Assessing recent warming using instrumentally homogeneous sea surface temperature records by Zeke H. and his heathen, climythology cohorts, uses all the right technical vocabulary to impress those who have no clue what the words mean [but, hey, who cares, all these guys have professional curricula vitae, so we HAVE to believe them]. This marketing piece posing as scholarly writing seems to drive the final nail into the brain-sucking, vampirish skeptic arguments of the … d-e-n-i-e-r-s. A closer look, however, reveals a masterful manipulation of professionalism and jargon to realign small numerical ranges by even smaller margins of correction to shift an already feeble mole hill into an even less impressive mole hill tilting merely a little more in one direction than it started out tilting. This comes to us courtesy of the mathemagic of global temperature averaging and data correction, enabling its high priests to make catastrophic projections of human doom, using little more than the same old climyth models, which these authors try to raise to heights predating their current downward trend in respectability.”
[ … more charged lofty language, character assassination, straw men arguments, ad hominem attacks, false analogies, trendy words, begging questions, noble-cause-blinded calls to action, etc., etc., … ANYTHING but a reasonable response]

January 7, 2017 6:59 am

AW writes: “…I contend that the data should be updated in the paper before publishing it. A year long gap, with a significant cooling taking place, is bound to change the results. ”
This is just too hilarious. Anyone with any sense has to realize that adding in 2016 data will simply *increase* the trend – not make it less.
And then to have someone(AW) complaining about lack of up-to-date data when that would require the authors have a crystal ball since the paper was submitted in March of 2016 is a bit silly. Really, really difficult for those of us without a crystal ball to include *future* data.
And to top it off I have open in another browser window AW’s 2015 AGU poster that has data thru — wait for it — 2008! LMAO 🙂
Of course none of the brilliant laymen scientists here even noticed these slight problems. It takes a Mosher or a Stokes to add even the slightest bit of sanity to this place.

AndyG55
January 7, 2017 9:24 pm

Interestingly, If we take the zero trend line in RSS from 1997 to just before the 2015 El Nino,
The global temperature has now dropped just below that zero trend line
In this graph , the black trend line is calculated on the green data, then manually extended in crimson.
The blue data is the El Nino transient and decay.comment image

AndyG55
Reply to  AndyG55
January 7, 2017 9:35 pm

Looks like I might have tilted the red line up ever so slightly, somehow.
Still, we are back to where we started before the El Nino, with more cooling to come.

Katatetorihanzo
Reply to  AndyG55
January 8, 2017 7:33 am

The slope of your 18-year trend line is biased by the 1998 and 2016 El Nino’s. This makes the trendline misleadingly sensitive to start and end dates. You can test this notion using the trend line plotting feature in the link. One reliable way to avoid this bias is to measure a larger data set, which is available, or to plot the trend line between 2000 and 2015, excluding the bias of extreme weather phenomena. Plot the data in the first series and plot the linear trend in the second series to obtain an overlay.
http://www.woodfortrees.org/plot/

Nigel in Santa Barbara
Reply to  Katatetorihanzo
January 9, 2017 8:14 pm

Do you have a slop where the 1998 and 2016 El Nino’s have been removed? The plot you linked to shows a temp change of about ~0.5degC in ~40 years. That’s about 1.1degC/century. Is that what we can expect in the next century? Not too bad!

Reply to  Nigel in Santa Barbara
January 10, 2017 9:24 am

My suggestion was intended to demonstrate the pitfalls of over-analyzing an 18-year dataset. Others have mathematically subtracted the effects of short term fluctuations (weather). Another example of over analyzing is assuming that the trend is linear. It’s likely to be exponential due to feedback. When we lose Arctic summer ice in about 20 years, energy that used to be reflected will then be absorbed. I anticipate WUWT would no longer fulminate about about a fictitious pause.
https://youtu.be/W705cOtOHJ4

January 8, 2017 12:12 pm

Ocean and land temperatures rising, atmospheric levels of CO2 increasing – I like Zeke’s graphs, because here the physical science would point away from CAGW and toward a perspective on the large degree to which ocean heat can influence CO2 levels and land temperatures. Thanks Zeke and Berkeley Earth. Keep up the good work.

Pete Wilson
January 10, 2017 2:04 pm

FYI, I just posted a comment on reddit r/science, linking to this story.
This was the result
Hello there!
Mark is being too kind here: https://www.reddit.com/r/science/comments/5mxdig/science_ama_series_we_just_published_a_paper/dc8e5ki/
I will be a little bit more blunt.
It appears as though you are repeating an incorrect claim alleged on climate contrarian blogs, such as WUWT. I suggest this because there is no factual basis to the idea that 2016 would have shown cooling- in fact the 2016 data will be hotter than 2015. And the blogger Anthony Watts appears to have been the person originating the meme that data were cherrypicked to end at a certain time, rather than the facts that one of our datasets ends at that time and we wrote the paper some time ago (it takes a while to get a paper from submitted manuscript to final publication).
So I would like to turn the tables a little bit and ask you a question: Why do you take claims you read on blogs or social media at face value? Would it not be prudent to exercise skepticism about allegations made by random people on the internet, and give a little more weight to the consensus views of a relevant scientific community?
Feel free to discuss this with me further at /u/past_is_future.
~ Peter
contextfull comments (936)reportblock userreply
You’ve been temporarily banned from participating in /r/science
subreddit message via /r/science[M] sent 9 hours ago
You have been temporarily banned from participating in /r/science. This ban will last for 10 days. You can still view and subscribe to /r/science, but you won’t be able to post or comment.
If you have a question regarding your ban, you can contact the moderator team for /r/science by replying to this message
I thought I might give the originator of “the meme” a chance to respond. Despite the invitation to do so, I cannot, being banned.

Reply to  Pete Wilson
January 10, 2017 2:28 pm

Would it not be prudent to exercise skepticism about allegations made by random people on the internet, and give a little more weight to the consensus views of a relevant scientific community?

What a buffoon!
Sure be more skeptical, but give the people who have stretched every bit of fact they have so far past credible only the foolish accept the consensus has more weight.
Gads!