Guest essay by Angus McFarlane
Introduction
In this article I pose the following questions:
- Was the Medieval Warm Period (MWP) a global event?
- Where the MWP temperatures higher than recent times?
The reasons for asking these questions are that climate establishment have tried to sideline the MWP as a purely local North Atlantic event. They also frequently state that current temperatures are the highest ever.
I attempt to answer these questions below.
Mapping Project for the Medieval Warm Period
I use the mapping project for the Medieval Warm Period (MWP) developed by Dr Sebastian Luening and Fritz Vahrenholt to establish the global extent of the MWP. This project is a considerable undertaking and I commend the authors for their work.
Luening states on Research Gate that,
“The project aims to identify, capture and interpret all published studies about the Medieval Climate Anomaly (Medieval Warm Period) on a worldwide scale. The data is visualized through a freely accessible online map: http://t1p.de/mwp.”
I show a screenshot from the project in Figure 1 but I recommend that you use the online version at http://t1p.de/mwp because it contains a wealth of data, including abstracts and links to the individual papers.
(Note – The t1p.de/mwp URL given may or may not be reachable by some viewers as it’s one of those mangled “URL shorteners” that may or may not work. It does not work for me. The author claims the URL is valid, and offered no alternate, I independently found this link to a Google maps document which might work better for some readers – Anthony)


Figure 1: Screenshot of MWP Mapping Project (Source: Luening http://t1p.de/mwp downloaded 27-Dec-2016)
A cursory inspection of Figure 1 indicates that there are a large number of warm study locations dispersed throughout the world. However, to determine the global numbers for the Warm-Cold-Neutral-Dry-Wet studies, I downloaded the mapped data for the 934 studies that were available on 30 December 2016 and these are summarised in Figure 2.


Figure 2: Results from MWP Mapping Project (Source: Luening http://t1p.de/mwp downloaded 30-Dec-2016)
The following observations are evident from Figure 2;
a. The number of Warm studies (497) greatly exceed the other studies, namely, 53% of the studies when temperature and hydroclimate date is used and 88% when temperature only data is used.
b. The number of Cold studies (18) is very small, at 2-3% of the overall studies.
c. The number of Neutral studies (53) is comparatively low, at 6-9% of the overall studies.
d. The number of studies that report only Hydroclimatic data is not insignificant. The number of Dry studies (184) and the number of Wet studies (182) are 20% and 19% of the overall studies respectively.
In summary, the overwhelming evidence from the Luening MWP Mapping Project to date is that the MWP was globally warm but it is not immediately obvious what the definition of warm is?
Descriptions of warm or cold are given the individual studies. For example, Kuhnert & Mulitza (2011: GeoB 9501) (extracted from Luening) states that the,
“Medieval Warm Period 800-1200 AD was about 1.1°C warmer (50 years mean) than subsequent Little Ice Age.”
Now, whilst this description is useful, it does not allow us to compare MWP temperatures with modern warming. Therefore, I compare modern temperatures with the MWP below.
How Warm was the MWP?
Several of the references in the Luening MWP Mapping project are also so referenced in Ljungqvist (2010), therefore the latter may be used to estimate the temperature in the Northern Hemisphere (NH) during the MWP.
Note that I have used the Ljungqvist (2010) NH paper because I already had the data available on my laptop. However, readers could carry out a similar exercise by using their preferred study to derive appropriate temperatures for global or hemispherical temperatures for comparison with the present day.
Ljungqvist published his data along with his paper (other climate scientists should do the same) and Figure 3 shows my version of the Ljungqvist chart (reproduced using his data). I have also annotated the chart to show previous warm and cold periods.
Figure 3: Estimate of Extra-tropical Northern Hemisphere (90–30°N) Decadal Mean Temperature Variations (after Ljungqvist, 2010)

Notes to Figure 3:
a. All values are decadal mean values.
b. Proxy temperatures are shown in the thick black line and are relative to the 1961–1990 mean instrumental temperature from the variance adjusted CRUTEM3+HadSST2 90–30°N record.
c. Two standard deviation error bars are shown in light grey shading.
d. CRUTEM3+HadSST2 instrumental temperatures are shown in the red line.
The following observations are evident from Figure 3:
a. The Medieval Warm Period (MWP) temperature is warmer than the Modern Warm Period proxy temperature – at no time do the modern proxies exceed the MWP proxies.
b. The recent instrumental temperature is warmer than the Medieval Warm Period temperature.
c. The MWP is obviously preindustrial and it would be logical to use the MWP temperature as preindustrial temperature instead of the Little Ice Age (LIA) favoured by the climate establishment.
Observations (a) and (b) above are based on Ljungqvist’s comments. He states that [emphasis added],
“…the Medieval Warm Period, from the ninth to the thirteenth centuries, seem to have equalled or exceeded the AD 1961-1990 mean temperature level in the extra-tropical Northern Hemisphere.”
He also adds the following words of caution [emphasis added],
“Since AD 1990, though, average temperatures in the extra-tropical Northern Hemisphere exceed those of any other warm decades the last two millennia, even the peak of the Medieval Warm Period, if we look at the instrumental temperature data spliced to the proxy reconstruction. However, this sharp rise in temperature compared to the magnitude of warmth in previous warm periods should be cautiously interpreted since it is not visible in the proxy reconstruction itself.”
Regarding Ljungqvist’s note of caution and item (b) above, comparing instrumental temperatures with those derived from proxies is not an, “apples for apples” comparison because proxy temperatures are damped (flattened out) whilst thermometers respond very quickly to changes in temperature.
Ljungqvist describes the dampening proxy temperatures thus [emphasis added],
“The dating uncertainty of proxy records very likely results in “flattening out” the values from the same climate event over several hundred years and thus in fact acts as a lowpass filter that makes us unable to capture the true magnitude of the cold and warm periods…What we then actually get is an average of the temperature over one or two centuries.”
However, the flattening out of proxy records is not the only problem when comparing proxies with instrumental temperatures – there is also the “divergence problem.” We examine this for the Ljungqvist’s 1850-1989 calibration period in Figure 4.

Figure 4: Comparison of Proxy & Instrumental Decadal Mean Temperature Variations (after Ljungqvist, 2010)
The decadal correlation (r = 0.95, r² = 0.90) between proxy and instrumental temperature is very high during the calibration period AD 1850-1989. However, note that the 1990-1999 instrumental peak is not used in the calibration. Probably because Figure 4 shows that the instrumental peak temperature is 0.39°C for 1990-1999, which diverges from the proxy temperature of 0.06°C – a difference of 0.33°C.
This divergence is outside the 2 standard deviation error bars of ±0.12°C reported by Ljungqvist and it illustrates the divergence problem in a nutshell – proxies do not follow the instrumental record for recent high temperatures. The reason for this divergence is that the proxy response is probably nonlinear instead of the linear response that is assumed in all climate reconstructions to date.
Ljungqvist explains the nonlinearity [emphasis added],
“One circumstance that possibly has led to an underestimation of the true variability is that we must presuppose a linear response between temperature and proxy. If this response is nonlinear in nature, which is often likely the case, our interpretations necessarily become flawed. This is something that may result in an underestimation of the amplitude of the variability that falls outside the range of temperatures in the calibration period.”
As a structural engineer, I agree with Ljungqvist that nonlinearity is often likely to be the case for proxies. Most natural materials, e.g., timber, rock, etc., exhibit linear-nonlinear behaviour. However, this concept is difficult to explain in words, therefore, I explain the concept diagrammatically in Figure 5.

Figure 5: Indicative Nonlinear Response for a Temperature Proxy
For clarity, I show the positive part of the temperature response in Figure 5 but it should be noted that there would be a similar negative response. I now explain Figure 5 as follows:
a. Line OAB represents the linear proxy response to temperature currently used in reconstructions. Parameter P1 yields a temperature T1 (via point A) and the response increases linearly so that parameter P2 indicates a higher temperature T2 (via point B).
b. Line OACD represents the indicative nonlinear proxy response to temperature. Parameter P1 is in the linear portion of the curve and therefore results in the same temperature T1 as that in item (a) above.
c. In addition to item (b), parameter P1 at point C is in the nonlinear portion of the curve, which would result in the temperature T2, which is significantly higher than the value of T1 obtained from the linear response via point A.
In summary, a nonlinear proxy-temperature response can result in two temperature values for a single proxy value, which could be problematic in deciding which temperature result to use.
However, for modern temperatures, the nonlinear response of the proxy can be calibrated against the instrumental record. For example, if the temperature results in Figure 4 were for a single proxy then the following procedure could be used:
a. The nonlinear curve would be calibrated so that temperature T1 = 0.08°C would be in the linear portion of the curve in Figure 5.
b. The temperature T2 = 0.39 °C would be calibrated to be in the nonlinear portion of the curve in Figure 5.
Note that the linear response used in Figure 4 shows T2 = 0.06°C but the nonlinear response procedure above allows the calibration T2 = 0.39°C. This type of nonlinear calibration would mean that historical temperatures would be higher than those currently estimated by using a linear proxy-temperature response.
Furthermore, the calibration in modern times is relatively straightforward because we can compare proxies with instrumental temperatures to determine which temperature is correct, T1 or T2. However, historical temperatures are more problematic because we do not have instrumental records for several thousands of years to determine the correct temperature, T1 or T2. Nevertheless, we can estimate the correct temperature by deploying a similar methodology to that used by earthquake engineers as explained below.
Earthquake engineers routinely design structures for 1-in-500 year seismic events and for special structure (e.g., nuclear installations) 1-in-5,000 year events. However, they have only had the seismograph to measure the strength of earthquakes from 1935, when it was invented by Charles Richter. Earthquake engineers solve this short instrumental record dilemma by investigating historical descriptions of seismic events.
For example, the historical record for an earthquake may include a description such as, “The earth boiled.” This literal description does not mean that the earth actually reached boiling. It means that the groundwater in the soil bubbled to the surface – a process known as liquefaction of the soil. Earthquake engineers can then use this description to estimate the amount of shaking that would cause liquefaction and thus estimate the strength of the earthquake at that location.
In climate science, the temperature, T1 or T2, could also be estimated from historical descriptions by using changes in vegetation, human habitation, etc. For example, if our proxy were in Greenland then the following outcomes are possible:
a. If the land were in permafrost at the date of the proxy then the lower temperature T1 would be used.
b. It the land was being cultivated by Vikings at the date of the proxy (i.e., no permafrost) then the higher temperature T2 would be used.
The above nonlinear methodology would obviously require more work by paleo scientists when compared with the current linear calibration methods but this work is no more than is routinely carried out by earthquake engineers.
Additionally, up-to-date proxies for the post-2000 period would be useful to determine if the divergence between proxies and instrumental temperatures has increased. The proxies would also enable a more accurate nonlinear proxy-temperature calibration, say, point D in Figure 5. Strangely, there seems to be a reluctance in the climate establishment to publish up to date proxies.
Using a nonlinear proxy-temperature response would result in historical high temperatures being calculated to be higher and historical low temperatures being calculated to be lower.
Conclusions
A review of the global extent of the MWP is presented and the following conclusions are offered:
- The MWP was a global event and a large number of studies show that warming events overwhelming outnumber cold events.
- However, the not insignificant number of dry or wet events recorded in the MWP Mapping Project would suggest that perhaps the Medieval Climate Anomaly would be a better description than the MWP.
- NH temperatures during the MWP were at least as warm those in 1980-1989 instrumental record.
- Recent instrumental temperatures show higher temperatures when compared with the MWP proxies. However, instrumental temperatures should not be compared directly with proxy temperatures because this is not an “apples for apples” comparison. Proxy temperatures are dampened (flattened) out on decadal or greater scales.
- Recent proxy records diverge from instrumental temperatures – instruments show higher readings when compared with proxies.
- The divergence problem in item (e) above is probably due to a linear proxy-temperature response being assumed in current temperature reconstructions. A nonlinear proxy-temperature response would achieve more accurate results for historical high and low temperatures and achieve a better correlation with recent instrumental data.
Until there is a good correlation between instrumental temperatures and proxies, no reputable scientist can definitely state that current temperatures are the highest ever.
Afterword
Regarding the 2°C limit proposed by the climate establishment, the following phrase (based on the facts presented in this article) does not sound nearly as alarming as is currently promulgated in the media:
“We know that the preindustrial MPW temperatures exceeded those of the LIA by ≈ 1°C without CO2 but we also think that a similar temperature rise from the LIA to 1980-1989 was caused by CO2. Therefore, we think that we need to limit CO2 emissions to stop a further (dangerous) 1°C rise. We think.”
I think that there is too much thinking going on and not enough real climate science.
A good start would be to use nonlinear proxy-temperature responses to establish accurate historical high and low temperatures.
“The reasons for asking these questions are that climate establishment have tried to sideline the MWP as a purely local North Atlantic event. They also frequently state that current temperatures are the highest ever.”
One can easily show the problem with their argument. Last year was NOT the hottest year ever in all places, it wasnt even the hottest year of the past 3 years, see valentia temp record in Ireland here, which by the way is a station not affected by urban heating effect :
http://www.met.ie/climate/monthly-data.asp?Num=2275
Angus
I think this is a very useful piece. There are lots of studies out there about the MWP but they need bringing together in a rigorous manner and publicised more broadly.
I wrote a companion piece about the LIA a year or so ago from which I excerpt this paragraph
—– —— —–
As Brian Fagan noted:
‘The pendulum of climate change rarely paused for more than a Generation.’
The climate appears to be achieving some stability over the last century after the observable violent perturbations that punctuates the record. In trying to determine likely future behaviour we need to look to the past, and our mistaken popular notion of a monotonically cold period lasting 500 years does not help our understanding.
Bearing in mind the scientific definition of ‘The Little Ice Age (see 3.9) as having lasted some 4000 years, perhaps we need to determine if this period has as yet definitively ended and that can only be done with hindsight.
https://judithcurry.com/2015/02/19/the-intermittent-little-ice-age/
—– ———
I was genuinely surprised by the intermittent nature of the LIA. It undoubtedly happened, was often very severe, but the entire globe was not locked into a permanent deep freeze for 500 years or so.
Whilst my research into the MWP is less intense I think the period can be characterised as ‘ a generally mild and settled climate but punctuated by bursts of much colder and unsettled weather’.
So the MWP was likely not monotonically warm and settled for 400 or 500 years, just as the LIA was likely not monotonically cold for 500 years or so, but both periods can be ‘characterised as being ‘generally warm and settled’ or ‘generally cold and unsettled’ but with many short term periods when the weather was uncharacteristic of the period.
tonyb
Well (Willie) Wei Hock Soon and Sally Baliunas did a very extensive survey of hundreds of peer reviewed papers from all over the globe demonstrating (to them) that the LIA and the MWP were in fact global events; not local climate anomalies.
In fact it was this survey and their paper about it that set the hornets buzzing after their hides.
Evidently the author of this present essay, is unaware of the Soon Baliunas paper.
G
Very useful indeed. It gathers together information to give a global picture of the MWP, and then, for the sake of those of us who are easily confused (just me, perhaps?) sums up all the numbers and wriggly lines in a clearly comprehensible conclusion.
Excellent work.
.
I used to naively believe that scientists wished only to discover truth, whatever that truth turned out to be. I thought that was their passion, their reason for entering their fields of study, to learn new, exciting things, or take pride in making great advances, etc.
I was mistaken. All the corruption w this AGW jive has opened my eyes. Egos, greed, politics, & lies etc. w this movement have cost us billions, & we’re nearly bankrupt as it is.
The book, ‘Science Discovers God’, reveals that Einstein believed the universe was ‘static,’ infinite past & future. A ‘beginning’ was senseless & irritating to him. Yet, his equations showed an expanding univ, indicating a starting point. So, he proposed an unknown force to account for this. Ultimately, other sci data convinced him the idea was ‘the greatest blunder of his life.’ He realized it wasn’t static, it had a specific beginning.
The point is, a ‘real’ scientist goes wherever the facts lead, even if it contradicts their intuition. Real scientists set aside egos, prejudices, & politics (wealth redistribution) to pursue truth using scientific methods, letting the chips fall wherever the hell they fall.
What’s the point of feeding garbage into a computer, only to receive garbage out? What’s the point of artificially producing “outcome based’ results? How does that improve human life? Think of the great advances in physics that would’ve been lost if Einstein had operated that way.
I attribute AGW crap to 2 things. The 1st is that gov only provides $ to scientists working to affirm CW, no $ to dissenters. 2nd, those who do dissent are ostracized or pressured to keep quiet bc it’s pc to believe. My hope, now that MrT is in the WH, is that masses come out of the closet, bc there’s a new sheriff in town who isn’t pc & not afraid to say ‘the king ain’t got no clothes on.’
.
One should leave “thinking” to horses. Have bigger heads.
Sorry, that used to be the advice given in the no-nonsense port city of Rotterdam.
I’m pink, therefore I’m Spam.
Another questions is: were the 1930s hotter than today?
Well, from the guy who exposed Mann’s bs hockey stick which suppressed both the Medieval Warm Period and the Little Ice Age:
The 1930s are Getting Colder by Steve McIntyre:
https://climateaudit.org/2007/02/15/ushcn-versions/
Official temperature charts from the 1970s to 1999 show the 1930s as hotter. What happened? Data manipulation happened. Add to the manipulations the urban heat island effect and vanishing rural stations and what we got is parking lot warming, and spreadsheet warming. But not warming in reality. The 1930s were hotter!
This is of course, a crucial issue, that needs to be properly investigated.
The reason why it is so crucial is that approximately 95% of all manmade CO2 emissions have taken place since the late 1930s/early 1940s and IF today is about the same temperature as that of the late 1930s/early 1940s then that suggests that Climate Sensitivity to CO2 is very small, if any at all.
We have never had good data on the Southern Hemisphere. It is mainly ocean and not greatly populated. In truth, we do not know what the position is on a global scale, but we ought to have a reasonable insight into what the position is with respect to the Northern Hemisphere which is much better sampled.
If one reviews the ‘accepted’ position in the mid 1970s, the Northern Hemisphere dramatically cooled from the highs of the late 1930s/early 1940s by more than 0.6degC. See:
http://realclimatescience.com/wp-content/uploads/2016/12/Screen-Shot-2016-12-21-at-5.27.38-AM-down.gif
If there has been some 0.6degC warming since the mid 1970s through to date. it would appear that we are today at about the same temperature as that observed in the late 1930s/early 1940s.
There are a number of lines of evidence (including tree ring data which is why it could not be used post 1960 in the Mann reconstruction) to suggest that nothing much has changed since the late 1930s/early 1940s but it would be sensible to get a good handle on this.
It would be a good idea to examine just the best sited stations which have no material station change and no encroachment of urbanisation/environmental changes (whether manmade structures or changes in nearby ecosystem) and have an uninterupted record going back to 1930. If possible just examine those stations that have not changed TOB. Thus the only consideration would be screen degradation, equipment change, and change from Fahrenheit to Centigrade. The key is to to identify rural stations where no or as few adjustments as is possible is required to be made to the raw data. .
If one were to look at say just a dozen stations in each major country across the Northern Hemisphere, one would quickly get a good indication as to whether anything of substance was happening. Perhaps to get better spatial coverage with the US, Canada, Russia and China, one may include say 24/30 stations. If the data is good quality, one does not need that many stations.
One only needs to consider data over say two 10 year periods. Say 1935 to 1944 and say 2005 to 2014 (making sure that one is not starting or ending the period with an ENSO event). One does not need to assess an anomaly, just absolute temperatures as observed just to see whether it is significantly warmer today than it was back in the late 1930s/early 1930s.
It would not be that big a task, and would be something that would be done if the ‘science’ was genuine. Unfortunately, of course, it appears that matters are going in the opposite direction with cooling the past and warming the present
The northern hemisphere has better coverage, but it is still nowhere close to adequate. You would need an increase of at least two orders of magnitude in the total number of sensors to even get the error bars down to 1C. That’s assuming that you have proper spacial coverage, which of course we are no where close to getting, since the oceans are almost completely sampled.
Did just that back in… hmmm… 2009 for a statistics class.
Took the information from the Station Project, found stations that had 1) were well-sited; 2) had, as far as I could determine, no major changes in their environment; and 3) had a long record available. (The intersection of these three conditions was, actually, quite small.)
Ran the trends – and found a very slight cooling trend from about 1900 to the last year I had data for (2008). Not a statistically significant cooling, mind you, IIRC without referring to the paper I did, it was somewhere around -0.04 C per century. (Actually, a bit more “cooling” for the 30 years prior to the end year.)
Interestingly enough – I looked a couple of months ago for the same stations to update the numbers for a blog post I was thinking of doing. Just about all of those stations are now gone from the official records, replaced by very dodgy ones. For example, the Tombstone station data that I used as a specific example is now gone, replaced by the records from Sierra Vista, which underwent a “boom” of urbanization beginning in the late 1990s. I won’t claim conspiracy here – but it is rather convenient, yes?
If a researcher excludes more than about 15% of the data, there will be selection bias, whether the researcher intends it or not. An attempt has been made to quantify UHI effects, but since the original data is generally not available, no firm conclusions can be made. I previously thought that one could correlate local CO2 levels with temperature and UHI, but since only the lower atmosphere is poorly mixed, the CO2 differentials are too small to make hay. Add in poorly understood evaporation details (theory is good enough; the data isn’t) and we can barely predict the weather for 5-7 days. I get from 0.2 to 0.6 C increase from a doubling of CO2 levels, too small to boost long-term effects any higher than 1.2 C, including feedbacks.
The following history on the subject of the MWP may be of interest – I wrote this article for E&E in 2005.
Willie Soon has managed to hang on despite many attacks, but my friend and co-author Sallie Baliunas was driven from Harvard-Smithsonian, reportedly through the actions of John Holdren, now Obama’s Chief Scientific Advisor.
I suggest that the conduct of people like Holdren and those who collaborated with them should be thoroughly investigated by the new Trump administration.
Regards, Allan
DRIVE-BY SHOOTINGS IN KYOTOVILLE
The global warming debate heats up
by Allan M. R. MacRae
Energy and Environment, Feb 2005
https://wattsupwiththat.com/2011/11/28/the-team-trying-to-get-direct-action-on-soon-and-baliunas-at-harvard/#comment-811913
[excerpt]
In the April 2003 issue of Energy and Environment, Willie Soon and Sallie Baliunas of the Harvard-Smithsonian Center for Astrophysics and co-authors wrote a review of over 250 research papers that concluded that the Medieval Warm Period and Little Ice Age were true climatic anomalies with world-wide imprints – contradicting Mann’s hockey stick and undermining the basis of Kyoto. Soon et al were then attacked in EOS, the journal of the American Geophysical Union.
…
In both cases, the attacks were unprofessional – first, these critiques should have been launched in the journals that published the original papers, not in EOS. Also, the victims of these attacks were not given advanced notice, nor were they were given the opportunity to respond in the same issue. In both cases the victims had to wait months for their rebuttals to be published, while the specious attacks were circulated by the pro-Kyoto camp.
*****************
Entirely justified attacks: taking money from organisations dedicated to a particular position on the science without declaring it amounts to fudging your science for money, or fraud as it is often called.
Grifftroll
Didn’t you get eaten by a Polar Bear, your the only fraud here take your BS somewhere else, all those charges were totally debunked, its was a lynching pure and simple.
There you go again Griff. Are you incapable of telling the truth about anything?
1) Soon did not take money from anyone, his employer did.
2) The amount was small, only a few percent of their yearly budget, and it was several years prior.
3) There has never been any indication that Soon was aware of the donation.
4) Intelligent people attack the science, trolls attack the scientist.
5) The donation was disclosed by the organization at the time it happened.
Mod’s?
Why is my comment in moderation, but Griff can baselessly and repeatedly attack one scientist after another and is still allowed to be on this site?
[lynching is a word that requires inspection -mod]
Faulty logic. Even if the money were supplied on the assumption that the results would support “a particular position”, the scientific product should be evaluated objectively, not presumed to be fraudulent or “fudged”. All moneys supplied by or through the UN and the US Government are with the expectation that the study result will support their policies; nevertheless, not ALL officially supported studies are fraudulent. One can suspect fudging when confronted with statements like “Why should I give you my data when you want to prove me wrong!”
Gee Griff, Isn’t this the same thing that AGW accepted climate scientists do today?
Take money from organizations dedicated to a particular position on the science…
Careful what you say Griff, there is an old saying about pots and kettles…….
You lack integrity Griff. Time to take your ‘Snake Oil Elixer’ wagon on down the road.
Griff,
A clue;
“Entirely justified attacks…”
Those words imply, under the circumstance, that if one feels there’s been some insufficient attention payed to where a researchers funding is ultimately coming from, then it’s perfectly fine to do the sorts of things mentioned in the comment you’re responding to.
To avoid people seeing you as implacably biased, I suggest toning such comments down, to leave some room for the potential that at least some of the behavior of accusers was inappropriate, excessive etc.
Perhaps; *Some criticism was justified, I feel, because….*.
Can you see how such language makes you seem reasonable, and perhaps even empathetic, yet preserves the core claim you are trying to highlight? Without that sort of “human touch”, you really do come off as rather dogmatic and . . cold, it seems to me anyway.
(Yer welcome ; )
The corrupt climate “science” establishment needs both the MWP and the little ice age to both disappear so that the present age can be called “extreme” when in fact it is not unusual at all. Since alarmists and other liars are in charge of the “official” temperature records, it takes all the skeptics time to debunk whatever the latest delusional claim comes around.
By the way, I understand that the “dust bowl days” in the US was just a mass hallucination and never really happened. Or so some say.
I have also noticed over the years that the greatest modern warming comes in places where we can not directly measure. Those “estimated” temps are always what makes “the hottest year evah”.
It’s politicized science. They are faking the data to suit their (leftist) ends.
Btw, politicized science has exactly zero credibility.
In figure 4 above the instrumental data in comparison to the proxy data looks just like the warming adjustments of current data vs data from the year 2000 and before. Cool the past and warm the present, fancy that.
Oh, Academia started blaming the dust bowl strictly on agricultural practices long ago and I would bet if you asked one of the few HS students that pay much attention to history in class these days you would find that is what they’ve been taught. It is ALWAYS mans fault in the Ivory Towers it seems.
Typos where for were in introduction.
Conclusions point e when it may mean point 5.
A site called CO2 science used to show something similar – global extent of MWP
This is an excellent piece. It’s hardly surprising that Mann and co. have done all they could to “get rid of the MWP”.
However, I have one criticism. In trying to explain the divergence problem, the author assumes that the problem lies in the proxies. The slow response of proxies, compared to thermometers, is an important consideration and, let’s face it, trees make very poor thermometers. But he seems to be ignoring two rather large elephants in the room: urban warming (UHI) and the massive “adjustments” to the temperature record.
When climate science regains its integrity, I think it’s likely that the amount of global warming will be dramatically revised down. My guess is that the actual amount of global warming since 1900 is closer to 0.3C compared to the establishment figure of 0.8C or even 1.0C You just have to look at the NOAA graphs showing the temperature adjustments to smell a very large and nasty rat.
With half a degree of possibly fraudulent warming removed, it will become clear that the MWP was indeed significantly warmer than today. This would be consistent with the ice core data. It shows a series of warm periods over the last several thousand years, and each warm period is cooler than the previous one.
Here in England it’s been a freezing cold night. Suddenly global warming sounds like rather a good idea!
Chris
Comparing anything to the adjusted temperature records of today is pure fiction, I would think.
Comparing old proxy to new proxy, don´t know.
HB
Typo: “date” should be “data” in:
Another typo in the introduction, second bullet point: “Where the MWP temperatures…” should be “Were the MWP temperatures…”
This essay eschews the critical point of debate.
A warm period peaking in the 9th century should rightly be called a Carolingian warm period. The original MWP identified for mid lat Western Europe peaked in the 12th century. In many of the NH and global mean graphs used to make the case for a generalised MWP, the 12th cent is a period of sharp decline. Therefore theses graphs only serve to refute the schematic proposal of the global trend in IPCC SAR — the one so loved by sceptic which was carelessly based on Lamb’s middle England trend. Lamb saw the trend changing east across Europe with the 12th C. MWP entirely truncated by Moscow.
See more here: https://enthusiasmscepticismscience.wordpress.com/2013/09/22/hubert-lamb-and-the-assimilation-of-legendary-ancient-russian-winters/
The critical question of the debate is one that sceptics continue to keep at the margins. What needs to be shown is that warming in one region during 9th C is not cancelled by another region where the peak is in the 12th C. There may be a case for NH but there may not yet be enough data to make a case for a global peak. The common confusion among sceptics can be presented thus: they think that if they were to showed that every single region in the world had a peak higher than the present at some time between 800 and 1200 (or even out to 1400, as I have seen) then that this would make the global case. Not at all! Even the Hockey Stick comes close to this.
There is a boatload of evidence given that during the MWP it was hot all over the world.
Just like there is plenty of evidence that it was hotter than now in many or most places in the world during the 1930s, as in the USA of course. But also Antarctica. Greenland. England. Australia. Much of Africa, and arguably the entire Northern Hemisphere.
The modern warming is also mostly Northern hemisphere, so it is the same as the MWP in that regard – with some warming in other parts of the world as well. What makes it “global” is the modern temperature records and how they are reported. Since we don’t have that for the MWP, it is comparing apples and oranges to say the MWP was not “global”. Look at the proxies in both cases OR just look at the NH in both cases and see if the NH warming is similar, since in both MWP and now, the effects are larger in the NH. In this sense, saying the modern is global, based on temperature records, while the MWP is mostly NH, bases on the proxies, (even though the current article shows many non-NH proxies also show warmth) is changing the subject, rather than arguing in good faith.
The settlement of Greenland by the Vikings occurred during the MWP, and continued for a couple of centuries (IIRC). The pattern of the highest rate of warming in arctic areas observed today may well have happened then as well. The question is what would cause this latitudinal variation in warming to be repeated during warm periods. Has anyone addressed this pattern? I also would think that since current warming does not allow agricultural settlement of the area, that the MWP was not only warmer, but also warmer longer than current conditions.
It’s not called the Carolingian WP because it lasted well past the end of that dynasty.
The Medieval WP endured from c. AD 800 to 1400. Like all natural, centennial-scale secular climate trends, it had some countercycles within it. Peak warmth, warmer than today, occurred from c. AD 950 to 1250, with a bit of a dip in the middle.
In the 16th century Willem Barentz was convinced that the NW passage existed or must have existed in the past. He got this belief most probably from those living very high up north. He died trying to find it. I think the NW passage was there, around 1000 AD and it gave the Vikings a big advantage. A NW passage would still be interesting today, if it were to happen, as it would reduce shipping costs between the east and the west.
Cannot believe anyone thinking here that a NW passage will be catastrophic?
?
Considering what we can do with tunnels, I am suprised no one has considered an east-west tunnel system.
Expensive maybe, but completely free of weather influences.
how long wd that tunnel have to be?
I was watching a rather excellent series about South American civilisations where they mentioned the droughts around 1100, that lasted a couple of centuries.
Climate (temperature) variability is characterised by natural cycles. There could be more than one cause for such cycles, but two most likely are solar and tectonic activity.
There are hundreds of articles and papers (and possibly thousands comments) written about solar activity, but very little about tectonic cycles.
One better known is by Rhodes W. Fairbridge (1987)
“Isostasy and eustasy of Hudson Bay
In the eastern Hudson Bay area, a “staircase” of 185 Holocene strand-lines provides a continuous record of emergence from about 8,000 yr B.P. (sidereal) to the present. Ages were obtained from corrected radiocarbon analyses of shells and from application of a newly discovered 45-yr cycle in beach building that is presumed to be related to the ‘double Hale’ solar cycle. Thus, we deduced a record of climatic storminess.”
Study just published from Leeds University (2017) claims
“Although it is possible that (volcanic) ash clouds can occur on an annual basis, the average return interval for the last 1,000 years is around 44 years”
It might be just coincidence that two studies found same periodicity, or more likely there is a cause-consequence link between major volcanic ash clouds and storminess in the N. Hemisphere than previously assumed.
It is interesting that the two major recent events are separated by 63 years, occurring in 1947 and 2010.
Hello Vuk and Happy New Year!
Thank you for citing Dr. Rhodes Fairbridge, a pioneer in the study of climate change.
Dr. Fairbridge took his undergraduate degree at Queen’s University, Kingston, Ontario.
His eulogy is here, and well worth the read:
http://www.lavoisier.com.au/articles/greenhouse-science/solar-cycles/RichardMackeyForum2008.pdf
Best, Allan (Queen’s Science ’71)
Thanks Alan
and a very Happy and Prosperous New Year to you too.
I have seen a paper that tried to discount the MWP by saying that it wasn’t constant. The temperatures went up and down and the warm temperatures were an anomaly.
The trouble with the above argument is that the vikings were able to sustain agriculture for hundreds of years. Every farmer is familiar with the occasional crop failure. There might even be a couple of failures in a row but that’s the limit before people start leaving.
One important feature of the MWP is that the warm climate was reliable enough that the vikings could survive in Greenland for hundreds of years.
They even exported butter and other types of food, during the existing famine in Scandinavia at the time. All these activites they had on Greenland are not possible today, simply because it is to cold.
It is not only silly, but also verges on “scientific stupidity”, to addend thermometer temperature data to proxy temperature data ….. and then claim the results are scientific factual evidence of “whatever”.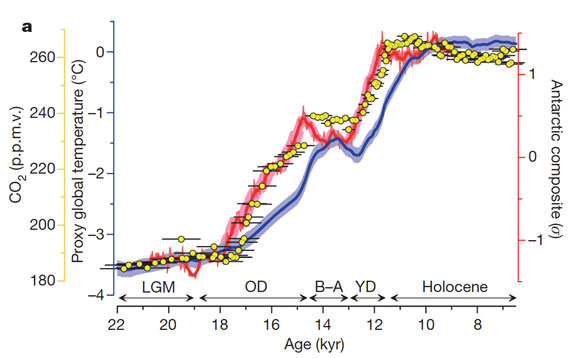

Given the above, my question is:
How’s come the post glacial sea level rise proxy data (melting glacial ice) ……. doesn’t agree with the post glacial surface temperature proxies during the period from year 15.5K BP to year 13K BP as defined on the following graphs?
Proxy graph of past 22K years of CO2 and surface temperatures
“Figure 2: Average global temperature (blue), Antarctic temperature (red), and atmospheric CO2 concentration (yellow dots).”
Proxy graph of past 22K years of post glacial sea level rise
How does one explain the portrayed proxy discrepancy of 1,000 years of decreasing global temperatures (blue) from year 14,000 BP to year 13,000 BP ….. combined with the portrayed proxy discrepancy of 2,000 years of decreasing Antarctic temperature (red) from year 15,500 BP to year 13,500 BP ….. with no concurrent decrease or slow-down in the melting of glacial ice and/or the post glacial sea level rise?
The surface temperatures were decreasing ……. but the glacier ice continued to melt and the sea levels kept rising.
Samuel,
I think you are confusing the two scales on the graph. The first graph, although not listed, starts at 6K years ago. The second starts at 0K years. Visually you cannot overlay them. Secondly, the slowdown of sea level rise might have less to do with temperature and more to do do with available ice/snow to melt. Once the NH glaciers all melted the available volume of melt water was limited to Antarctica and Greenland. So there was a huge melt water ‘pulse’ initially, once exhausted it slowed dramatically.
As a side note, I am not familiar with this graph but I find it interesting the “proxy” global temperature stops rising at exactly Zero degC. Could your question also have something to do with the latent heat of ice. Water at zero degC can be either melting or freezing. Also note, the Antarctic Temperature is not a “temperature” but a “composite” (of what I do not know).
Further, if you do overlay the two graphs correctly, temperature rise preceded the accelerated sea level rise by about 4000 years. Then temperature stopped rising rapidly about 4000 years before the deceleration of sea level rise. Again this could have something to do with latent heat of melting ice initially and exhausting of available ice to melt at the end.
Because the temperature only went down ~0.3 degrees and you had “inertia” from the temperature increase of ~ 2 degrees over the previous thousands of years? Plus, the meltwater pulse (IIRC) was due to a large plug of ice melting and allowing water to escape past a barrier down to the sea ?? So, that would continue even if the temp. went down a few tenths of a degree?
SC, the first figure is from Shakun’s 2012 paper. It is a deceptive statistical,hash bordering on academic misconduct. Itbis simoly wrong. I dissected it and showed how and why in essay Cause and Effect in ebook Blowing Smoke.
“bordering on academic misconduct”
It’s amazing how often this comment shows up when discussing the work of the alarmist camp.
A CYA response from: ristvan – January 3, 2017 at 8:18 am
Ristvan, you know damn well what I was alluding to so don’t be trying to blow smoke up my aboral orifice just to appease your ego.
And Ristvan, ….. who the ell cares, other than you, that the Shakun’s 2012 paper is little more than deceptive statistical hash? I sure as hell don’t care because I didn’t cite the paper as a credible reference, ….. I only cited a portion of the temperature graph, without even knowing its source, simply because the temperature decrease during the Younger Dryas was plainly visible, …. even to you.
Ristvan, how about this composite graph of sea level rise and temperatures, to wit:
http://i1019.photobucket.com/albums/af315/SamC_40/HoloceneInterglacialmeltwatertemperatureMediumWebview.jpg
Is it your opinion that the above graphic of my doing is also “deceptive statistical hash bordering on academic misconduct” by yours truly, Samuel C Cogar?
Now Ristvan, take a look-see at this temperature proxy graph to 20K BP …… which also plainly shows the temperature decrease during the Younger Dryas, to wit:
http://cdn.antarcticglaciers.org/wp-content/uploads/2012/07/shakun_marcott_hadcrut4_a1b_eng.png
So again, Ristvan, is it also your expert opinion that the above temperature proxy graph is “deceptive statistical hash bordering on academic misconduct”?
If not, why not, Ristvan, …. the plotted temperature proxy on it is pretty much a “duplicate” of the proxy graph that you were “badmouthing” with the gusto of degreed climate scientist.
Ristvan, maybe you would care to explain the Meltwater Pulse 1A on the Post Glacial Sea Level Rise graph ……. which occurred at year 14.8K BP ….. which was during …. and/or smack-dab right in the middle of, ……. the cold arsed Younger Dryas Period, to wit:
“DUH”, via the proxy data there was a tremendous surge in meltwater from the glacier ice ….. at the same time ….. that there was a sudden and tremendous cooling of the near-surface temperatures.
Samuel,
There is no discrepancy. Neither Greenland ice cores nor Antarctic ice cores represent global changes at the millennial time scale, so no inferences should be drawn from them regarding deglaciation or the Holocene. You have to go with a stack of global oceanic cores, like LR04:
http://i.imgur.com/aatCBMM.png
Greenland has a lot of noise, but as you can see LR04 and sea levels agree very well.
The dates in Shakun et al. 2012, are all f****d up. It is useless. Use GISP2 or NGRIP for Greenland and EPICA for Antarctica.
Younger Dryas on a global level was not as important as on Greenland and the North Atlantic. There are some indications that it was a Heinrich event, like for example detritic carbonate in the North Atlantic, or its timing.
http://i.imgur.com/oumF89c.png
Its start also coincided with a low in the 2400 year Bray solar cycle which might have cooled matters globally. It appears to have ended with a Dansgaard-Oeschger event (0 in the following figure).
http://klimat.czn.uj.edu.pl/media/archive/11503.gif
Since Heinrich events and DO events are mainly a North Atlantic feature that affect Antarctica and other places through teleconnections, It is easy to see why globally they essentially produced only a temporary halt in the melting and sea level rise and an inflection point in the LR04 stack. Globally it was a long hiatus of several centuries in the deglaciation. If you look carefully enough you can see its effect on sea level rise and global oceanic temperatures (LR04). That was the global impact of the Younger Dryas.
So thinkith ….. Javier – January 3, 2017 at 8:17 pm
Javier, given your above comment, …… I really don’t think you should be trying to edumucate me on “discrepancies”. Or should I say, …… “idiotic rebuttal comments”.
Javier, just how in hell would you or anyone else determine the “dates” or “rates” of deglaciation via the contents of “ice cores” taken from Greenland and/or Antarctica glaciers?
Javier, most everyone knows how many vertical feet of glacial ice now (2017) resides atop Greenland …… so why don’t you do one of those “junk science” studies so that you can tell me ……… approximately how many vertical feet of glacial ice resided atop Greenland at the last glacial maximum at 21K BP, ……. and how many vertical feet of that glacial ice melted and reformed during the next 13,000 years leading up to and including the Holocene Climate Optimum. You know, like, melt 6″ in the summer heat, but re-freeze 2″ during the winter cold.
And Javier, while you are at it you might as well tell me exactly why you told me this, to wit: “You have to go with a stack of global oceanic cores, like LR04:”
Just what is that “LR04 stack of global oceanic cores” going to tell me about meltwater run-off due to deglaciation VERSES the yearly snowmelt and rainwater run-off, ….. given the FACT that you wouldn’t actually know the specific source of the “sediment” in your afore stated “global oceanic cores”.
Javier, here is but one (1) REALLY GOOD source of the “sediment” in your afore stated “global oceanic cores” that was primarily eroded during the last “glacier maximum” ….. and continued erosion of surface material as the sea levels rose during the next 13,000 years of Holocene interglacial.
Javier, the following is a graphic depicting the Hudson River channel and its erosive effect that created the Hudson Shelf Valley and especially the Hudson Canyon as the outflow of the river water cut through the outer portion of the Continental Shelf, to wit:
http://www.nefsc.noaa.gov/press_release/2010/SciSpot/SS1003/HudCanFinderMap.jpg
So, Javier, be mighy, MIGHTY careful about “dating” those oceanic sediment cores.
Cheers
And ps, Javier, on the above graphic, please take note of the fact that the lowest extent of the Hudson Canyon is situate at 200 meters (656 feet) below the current sea level …….. which is proof-positive that that “point” was once the paleo historical “current” sea level.
Samuel,
You asked for an explanation, and I provided one. You don’t like it that’s your problem.
So you say, but as the crust moves as much up and down as sideways, I don’t think that means what you think it means.
Sorry bout that, Javier, ….. but avid beliefs in “junk science” is not one of my problems, ….. although it appears to be one of yours.
And Javier’s response to the Hudson Canyon graphic was, to wit:
Shur nuff, Javier, ….. and when I tell you that the Grand Canyon in Colorado, …. to wit:
http://www.maverickairlines.com/images/plane-gc-opt.jpg
…… was originally created by the erosive force of a tremendous “outflow” event that occurred via the Colorado River channel, ….. then you would surely respond with your same ole, same ole “junk sciencey” response of ……..
One can only provide the opportunity and offer the factual science so that people might educate themselves on the subject matter ……. but one can’t force them to accept what they have been offered.
I personally have doubts that tree rings can provide accurate data on temperatures of the past. The key statement in this post is for me that proximates of recent times (probably mostly tree rings) can not reproduce the measured temperatures. Why should they be able to do this for the past? The magic word also means manipulation (called calibration) of the data in the desired direction.
From the ZAMG/ Austria: “The greatest difficulty in dendro-climatology is the filtering of the desired climate signal. Other influences such as the soil texture, nutrient supply, shading by fast-growing trees, long-lasting snow cover or windbreaks superimpose the purely temperature- or precipitation-dependent growth. In addition, trees grow faster in the first few years than later. It is only after the implementation of statistical methods such as the establishment of a solid relationship between growth and temperature or precipitation for the period in which the tree ring data overlap with climatic data (calibration), or adaptation to the age of the growth layer (cambial age) References to past climatic conditions.” https://www.zamg.ac.at/cms/de/klima/informationsportal-klimawandel/klimaforschung/klimarekonstruktion/baumringe
If, on the other hand, the reports of the Romans or Carthagies from the time of the crossing of the Alps were made clear, the glaciers were smaller in Roman times than nowadays. Also, tree discoveries in glacier regions indicate that the tree boundary was then at least 200 meters higher than nowadays. Upstairs, the dead trees will hardly have migrated. Also reports of the settlement of Greenland by Norwegian Vikings during the MWP show that at that time Iceland and Greenland had a warmer climate than at present days. The expeditions of the Vikings also point to a growing population of Norway without the simultaneous abandonment of their actual settlements in Norway. So it will be warmer also in Norway. In contrast to the dark cold times here no escape was before, but the Vikings expanded due to population explosion. This is easily dismissed by the prophets of the AGW as a regional peculiarity. However, I wonder which small-scale, unique feature in the past climate history could have led to such a warmer climate in these regions. This was not just for decades, but for centuries. We’re talking about almost 400 years. The answer is still pending.
In Germany in the late 2000s there was a violent dispute between Professor Mangini, a professor of Paleontology at the University of Heidelberg and his opponents from the AGW side. This professor and his research team from the universities of Innsbruck, Heidelberg and Bochum had discovered through many studies using stalagmites and stalagmite proxies that the climate in the northern hemisphere was subject to the same fluctuations during the last 10 millennia, sometimes even in decades and thus even faster, Than in the current “one-time” phase, which is supposed to be caused by the increase in CO2 emissions. Those who can translate the texts or read German can look at the following links: http: //www.faz. Net / current / knowledge / climate / worldclimate-your-know-the-true-gruende-nicht-1433559.html
http://www.uni-heidelberg.de/presse/ruca/ruca07-3/klima.html
If the new presidency seeks evidence of natural climate change, it will be found in a variety of ways as well as from the original post. Our time of warming was not unique, but has happened several times in the past. It would not be difficult to prove this in a modified political climate. It was difficult to date only by the political and social pressure of the protagonists of the great transformation.
The first Link:
http://www.faz.net/aktuell/wissen/klima/weltklimabericht-ihr-kennt-die-wahren-gruende-nicht-1433559.html
“I personally have doubts that tree rings can provide accurate data on temperatures of the past. The key statement in this post is for me that proximates of recent times (probably mostly tree rings) can not reproduce the measured temperatures. Why should they be able to do this for the past?”
Excellent question. The science is not settled.
I’m hoping that with a new administration in D.C. that tampering with the citizens weather data will be treated like the vandalism to public property that it is. Hopefully complete and unsullied records exist in overlooked dark corners that can be reinstated into the weather, and consequently, the climate records.
In addition to being informative, I want to commend the author for such a clear presentation of ideas – both the writing style and flow of logic Well done!
There are MWP reference lists arranged by continent at http://www.co2science.org/data/mwp/mwpp.php
The MWP and many other temp fluctuations are well shown in the oxygen isotope GISP2 ice core data. These temp variations are specific to Greenland but correlate very nicely with the global records of glacier advances and retreats. Details of the isotope data may be found in the 2016 Elsevier volume “Evidence-based Climate Science.” What the ice core data shows very well is that the first 8,500 years of the Holocene were several degrees warmer than present, then 1,500 years of fluctuating cooler temps. The MWP data show temps slightly warmer than the top of the core (1950).
Don Easterbrook January 3, 2017 at 7:10 am
The MWP data show temps slightly warmer than the top of the core (1950).
Correction, the top of the core is at 1855AD. The MWP from the core peaked around 950-1000 about 1ºC above the top of the core, the next 200 years were the same as the top of the core.
Phil–you’re confusing the ice core temp data of Cuffy (also by Alley) with the oxygen isotope data. If you look at the original data of Stuiver and Grootes, the top of the core is 1950. There is a lot of confusion about the Alley curve and Alley himself told me he isn’t sure himself.
yeah Phil.
listen to Don.
At least we [seem to] agree on that the NW passage was open 1000 years or so ago
nothing unusual about that
is there?
“Phil–you’re confusing the ice core temp data of Cuffy (also by Alley) with the oxygen isotope data. If you look at the original data of Stuiver and Grootes, the top of the core is 1950. There is a lot of confusion about the Alley curve and Alley himself told me he isn’t sure himself.
Don:
Then why did you not contradict this poster back in 2011?
Or indeed get the “facts” straightened out about the graph dating as posted here…..
https://wattsupwiththat.com/2013/04/13/crowdsourcing-the-wuwt-paleoclimate-reference-page-disputed-graphs-alley-2000/
From…
https://wattsupwiththat.com/2011/01/24/easterbrook-on-the-magnitude-of-greenland-gisp2-ice-core-data/
Richard C (NZ) January 26, 2011 at 12:11 pm
@tty
“Have you considered my two previous posts. GISP2 goes to 1987, not 1855”
There may well be data available to 1987 but the temperature reconstruction starts (stops) at 1855 I checked the XML metadata and noticed a discrepancy so queried the NOAA contact. The following is the query and response:-
Hello Bruce from New Zealand.
I’ve seen a dispute in the blogosphere between Don Easterbrook WA and
Gareth Renowden NZ re the “present” date of the GISP2 temperature
series and I had a look at the NOAA source myself.
GR states that he checked with Richard Alley who confirmed that the
start [stop] date is 1950 but I note that there are 2 series: 1)
Temperature 2) Accumulation rate (m. ice/year).
The NOAA GISP2 page shows Start Year: -107175 AD End Year: 2000 AD:-
http://www.ncdc.noaa.gov/paleo/metadata/noaa-icecore-2475.html
On that page is a link to an XML page at NOAA that describes the data
“Complete XML Record: noaa-icecore-2475” (bottom of page above) :-
http://www.ncdc.noaa.gov/oai/provider?verb=GetRecord&metadataPrefix=dif&identifier=noaa-icecore-2475
The XML metadata seems to set the temperature Paleo_Stop_Date at 2000
AD and the Accumulation rate (m. ice/year) Paleo_Stop_Date at -50 cal
yr BP. The latter being the date used by Richard Alley as the stop
date for temperature when that is not the case.
A 2000 AD Stop_Date would make the first temperature data point 1905
instead of 1855 that GR has up on his latest blog post.
I’m not an expert in XML and may have got this wrong so I am asking
you to confirm or otherwise that the “present” Paleo_Stop_Date for the
GISP2 temperature series is 2000 AD.
Regards
Richard Cumming
Hello Richard,
Sorry, we appear to have an error in our database regarding the time span of the Alley 2000 temperature and accumulation data. I suspect we picked up the entire age range for the GISP2 ice core when generating the web page, rather than only the portion used by Alley for this study. I will correct the database and regenerate the web page (and the XML file, it is also generated from the same source database). The link to the data file is correct, and that data file:
ftp://ftp.ncdc.noaa.gov/pub/data/paleo/icecore/greenland/summit/gisp2/isotopes/gisp2_temp_accum_alley2000.txt
contains the full set of temperature and accumulation data from Alley.
The age units are thousands of years before present, with “present” defined as 1950 AD. As an aside, many geologic time series are dated via radiocarbon, which is unreliable after 1950 AD due to atmospheric testing of H-bombs, so 1950 AD was adopted as “present” by radiocarbon dating scientists, and adopted in paleoclimatology as well.
The date ranges in the data file are correct. Temperature data extend from 0.095 to 49.981 thousand years before 1950 AD, so the corresponding calendar dates would be 1855AD to -48031 AD. The accumulation data are reported from 0.144 to 49.0034 thousand years before 1950 AD.
Sorry for the date range error on the Alley 2000 web page. We have migrated through several versions of databases with different age scales, and obviously ended up with the wrong age range for this study.
Sincerely, Bruce
This is poster Richard C (NZ)’s ….. blog page on the subject …..
http://hot-topic.co.nz/easterbrooks-wrong-again/
Any comments Don?
I should also mention that the GISP2 data correlate very well with the Central England Temp record back to 1658 and the temp reconstruction of Lundquist (2010) based on temp proxies for the past 2000 years.
Excellent article. I think a published one in a journal beefed up with compelling historical data would give the ‘team’ a thorough ‘cauchemar’. I also am convinced that good temperatures can be calculated from historical factors an exercise studiously avoided by mainstream climate toughers, itself very telling about their real thoughts on climate. These would be superior proxies, too. For example grapes for a documented wine industry were grown in Scotland in the middle ages. Now they can be grown in England grace of hybrid development only, except, perhaps for some micro climate cottage industry stuff.
In the LIA, how cold did it get to freeze the Bosphorus, New York harbour and the NJ coast? Put a meter of ice on the Thames? Have Swiss glaciers come down to and along the main valleys and crush 100s of years old villages? Kill 30-40% of Finns whose crops failed over a number of years – oh and they have Baltic sea ice forming and melting get dates for the period. How warm on Viking farms that are only now emerging from under retreating ice. How warm would it be for drift wood (Holocene Optimum) to accumulate on the solidly ice locked, well developed beaches on the north coast of Greenland?
The reason they go for ‘sea shell’ isotopes tree rings and the like is that you have more error to fiddle with and the lay reader has to essentially accept it. There is less error and no divergence problem with historical proxies and the lay reader is as expert as the researchers! Ive always felt these compelling facts would put an end to the whole scam if properly presented to a broad audience. Maybe this is a job for a structural engineer if climate scientists won’t touch it.
Or how did tree stumps get under glaciers; “The Mendenhall Glacier’s recession is unveiling the remains of ancient forests that have remained frozen beneath the ice for up to 2,350 years.”
http://jun-cdn.com/sites/default/files/imagecache/story_slideshow_thumb/12619318.jpg
http://jun-cdn.com/sites/default/files/imagecache/story_slideshow_thumb/12620182.jpg
http://juneauempire.com/outdoors/2013-09-13/ancient-trees-emerge-frozen-forest-tomb
Gary Pearse January 3, 2017 at 7:18 am
For example grapes for a documented wine industry were grown in Scotland in the middle ages. Now they can be grown in England grace of hybrid development only, except, perhaps for some micro climate cottage industry stuff.
There isn’t good documentation of such a wine industry in Scotland, a wine industry did exist in southern England and present english vineyards grow further north than they did around 1100 AD.
In the LIA, how cold did it get to freeze the Bosphorus, New York harbour and the NJ coast? Put a meter of ice on the Thames?
The main cause of regular freezing in the Thames was blockage of the flow by the old system of bridges which no longer exist, that said it occurred recently, 1963:
http://www.thamesweb.co.uk/windsor/windsorhistory/63images/130163WindsorBridgeBus07.jpg
and 1947
http://news.images.itv.com/image/file/148879/image_update_bcc84e4b497645a7_1358451318_9j-4aaqsk.jpeg
Phil,
“The main cause of regular freezing in the Thames was blockage of the flow by the old system of bridges”
This is not true. Bridges do not cause freezing, cold causes freezing. If anything, bridges or restrictions speed up water flow preventing freezing. Ice Jams due to bridges can/do happen but the ice was not created by the blockage. Usually if there is a blockage, it can cause flooding upstream as it acts like a dam.
These two pictures are a channel on Canadian Lakes. In the channel the water will not freeze as it moves faster than the lake water.
http://1.bp.blogspot.com/_inztztbPyfk/SaC_nE42LnI/AAAAAAAABDA/m3kHOFQi2XQ/s320/feb+20+2009+007.JPG
http://4.bp.blogspot.com/_inztztbPyfk/SaC_nJ2d8kI/AAAAAAAABDI/7Pht3AS02WA/s320/feb+20+2009+009.JPG
This is an Ice Jam. The bridge is not making the ice.
http://c8.alamy.com/comp/A3MAGE/hartland-covered-bridge-hartland-new-brunswick-canada-with-ice-jam-A3MAGE.jpg
I did find one of the historical bridges in a painting you mentioned. I can assure you, living in Canada as an avid outdoors-man, to make ice over a meter thick takes a lot of cold. I have never seen ice this thick in all my years of ice fishing and snowmobiling (-20C days to -40C at night). This is also not an ice jam, as all the ice is still in the horizontal position as it froze. If it was an ice jam, the blocks would be crushed and turned sideways in all directions. The reason why it is exposed so high out of the water, the level of the Thames dropped after the initial freezing. As all the water on land freezes, not adding fresh water to river, the river level naturally drops exposing the ice high and dry (unless there was a dam upstream ding it). The new water level is where people are skating on refrozen ice. I see it frequently, just not to this magnitude.
Painting 1677:
http://www.historic-uk.com/assets/Images/frozenthames1677.jpg?1390903061
Duncan: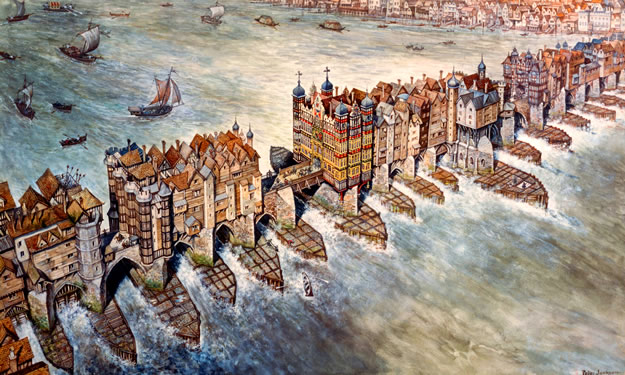
“This is not true. Bridges do not cause freezing, cold causes freezing. If anything, bridges or restrictions speed up water flow preventing freezing. Ice Jams due to bridges can/do happen but the ice was not created by the blockage. Usually if there is a blockage, it can cause flooding upstream as it acts like a dam.
These two pictures are a channel on Canadian Lakes. In the channel the water will not freeze as it moves faster than the lake water.
This is an Ice Jam. The bridge is not making the ice.”
The main blockage was caused by just one bridge .. the old London Bridge and it was medieval.
And had buildings on it.
There were a lot of arches, which slowed/restricted the water flow a tad.
http://middle-earth.xenite.org/files/2013/02/london-bridge.jpg
http://www.historic-uk.com/HistoryUK/HistoryofEngland/The-Thames-Frost-Fairs/
“The other catalyst was the medieval London Bridge and its piers, and specifically how closely spaced together they were. During winter, pieces of ice would get lodged between the piers and effectively dam up the river, meaning it was easier for it to freeze.”
Tonyb
“There were a lot of arches, which slowed/restricted the water flow a tad.”
No you have the physics backward. Any time you place obstacles in a flow stream, the flow speed must increase to move the same volume through a smaller area. Bridge design needs to take this into account, as the increase speed can scour away the foundation around the bridge pier. It does not get “slowed”. And it sure does not cause ice to freeze as Phil suggested, it was just really cold then. Having parties on ice jam is not a lot of fun, unless you have a death wish and like crawling over bolder sized chunks of ice.
http://www4.kke.co.jp/kaiseki/en/service/environment/images/kankyou04-08L.gif
http://www.pepevasquez.com/independencia1.jpg
Duncan January 3, 2017 at 12:53 pm
Tonyb
“There were a lot of arches, which slowed/restricted the water flow a tad.”
No you have the physics backward. Any time you place obstacles in a flow stream, the flow speed must increase to move the same volume through a smaller area.
And you have forgotten that the Thames is tidal so that for a significant fraction of the day there was no flow! Also upstream of each of the supports there is a stagnation point where ice can form 24/7. Given the very short distances between the supports, at times of no flow the surface can freeze over, that’s how the Old London Bridge led to freezing over. Also at that time there was no embankment on the river so the river was wider, slower and shallower so upstream of the bridge in cold winters led to freezing over. Now with the narrower channel, embankments and the lack of obstruction by the bridge even in a very cold winter such as 1949 and 1963 freezing over for months at a time is less likely.
You guys are all over the place, bridges, tides, shallower, wider, no embankments, stagnation points, etc. All to avoid saying there was a Little Ice Age. Even the painting looks like there are whitewater rapids flowing between them (foamy white stuff). I can tell you from spending a lot of time outdoors in Canada, stationary ice does not form well with flowing water. It just eats away at the ice that does form. Ice can only form in these conditions through brute force when it is very very cold. My life depended on knowing this at times. ?w=700
This is the excerpt from page 13 of the PDF.
“The rush of water through narrow gaps between the starlings created treacherous eddie and currents. Passing between these by wherry, known as ‘shooting the bridge’ was extremely dangerous and there was a popular saying “wise men walk over London Bridge and only fools pass under it”
http://totallythames.org/images/uploads/documents/River%20of%20the%20World%20Info%20Packs/River_Thames_UK.pdf
Duncan:
We are on the same page in many respects, however….
Thank you – but yes I am familiar with Bernoulli’s principle
And yes, also I am aware that the Thames is tidal.
“It does not get “slowed”. And it sure does not cause ice to freeze as Phil suggested”
At some measure of constriction, a river’s flow must be constricted.
Taken to an extreme – suppose there was only 1 gap for all the arches. All the other gaps did not exist.
The constricted flow could not reach a speed high enough to match the mass flow backing up behind enough to get it through the gap and keep up with the river flow behind.
I do not know at what point that is however with regard to the dimensions of the medieval LB.
The point the quote was making however (as I read it) is that the narrow gaps caught the broken ice and caused the “ice-jam” ….
From: http://thames.me.uk/s00051.htm
“….. quite a lot of the above accounts can be put down to the old London Bridge acting as a weir, and when frozen as a barrier. There must have been almost no salt water above the old bridge, indeed there were water wheels pumping water out of the river as the domestic water supply so this is almost certain (though there must have been times when that was not quite true). Fresh water would have frozen much more readily and once the bridge was well and truly blocked the tides would have ceased above the bridge. (With presumably the ice at a high tide level). This may go some way to explain why we have seen no comparable phenomenon since the last episode in 1814. The bridge opened in 1830 permitted a much freer flow of tide and presumably there is a mixture of salt water and freshwater right through London.]”
“In 1282 there was a most terrible frost, the like of which had never been known. The pressure of ice heaped up against [London] Bridge, and unable to pass through from the narrowness of the arches of the bridge, carried away five arches of it, and rendered it, of course, impassable for the time until they were rebuilt.”
“On Sunday, the 30th of January, [1814] the immense masses of ice that floated from the upper parts of the river, in consequence of the thaw on the two preceding days, blocked up the Thames between Blackfriars and London Bridges; and afforded every probability of its being frozen over in a day or two. Some adventurous persons even now walked on different parts, and on the next day, Monday the 31st, the expectation was realized. During the whole of the afternoon, hundreds of people were assembled on Blackfriars and London Bridges, to see people cross and recross the Thames on the ice. At one time seventy persons were counted walking from Queenhithe to the opposite shore. The frost of Sunday night so united the vast mass as to render it immovable by the tide.”
Tonyb. Yes everything that is described is an ice jam (not bridges freezing ice & where all this started). Trust me, you do not have winter festivals on ice jams, except for “some adventurous persons even now walked on different parts”. This is ice flowing from the upper river and collecting at this impasse. I have walked on wind blown ice on Lake Ontario, about a kilometer out from shore. Winds blows thinner ice onto shore and it re-freezes. There is no current but watch for the holes into nowhere. It was a very cold winter that year. I would never walk on a river ice jam, it is moving.
Ice dams are usually associated with the spring ice break-up, not deep winter. Winter forms all this land-locked ice, spring sends it all crashing downstream in a short order, sometimes failing bridges. You need thick/dense ice to resist water pressure. The initial ‘plug’ has to form quickly. Stationary ice does not do this, the type of ice you can play on.
Ultimately we’ve beat this one to death again, see you back on anther post sometime. I’ll read your reply if you choose. Later.
Duncan January 3, 2017 at 2:36 pm
You guys are all over the place, bridges, tides, shallower, wider, no embankments, stagnation points, etc. All to avoid saying there was a Little Ice Age.
Not at all, just pointing out that those structural changes in the river were necessary for the formation of sufficient ice for the ‘Frost Fairs’.
All of those differences existed prior to the replacement of the old bridge and were all instrumental in the ice formation.
Even the painting looks like there are whitewater rapids flowing between them (foamy white stuff).
Exactly what you’d expect on the outgoing tide, particularly after a lot of rain. Apparently you’re not very familiar with tidal flows in your part of Canada.
Here’s an account by Charles Mackay about the break up of the ice in 1814:
“January 27th. [1814]
Yesterday the wind having veered round to the south-west, the effects of thaw were speedily discernible.
The fall of the river at London Bridge has for several days past presented a scene both novel and interesting. At the ebbing of the tide huge fragments of ice were precipitated down the stream with great violence, accom- panied by a noise equal to the report of a small piece of artillery. On the return of the tide they were forced back again ; but the obstacles opposed to their passage through the arches were so great as apparently to threaten a total stoppage to the navigation of the river.”
“February 7th. [1814]
The ice between London Bridge and Blackfriars gave way yesterday, in consequence of the high tides. On Saturday, thousands of people walked on the ice from one bridge to the other notwithstanding there were evident signs of its speedy breaking up, and even early yesterday morning some foolhardy persons passed over from Bankside to Queenhithe. About an hour after this the whole mass gave way, and swept with a tremendous range through the noble arches of Blackfriars Bridge, carrying along with it all within its course, including about forty barges.”
“At this time the appearance of the river Thames was most remarkable. Vast pieces of floating ice, laden generally with heaps of snow, were slowly carried up and down by the tide, or collected where the projecting banks or the bridges resisted the flow. These accumulations sometimes formed a chain of glaciers, which, uniting at one moment, were at another cracking and bounding against each other in a singular and awful manner with loud noise. Sometimes these ice islands rose one over another, covered with angry foam, and were violently impelled by the winds and waves through the arches of the bridges, with tremendous crashes.
Near the bridges, the floating pieces collected about mid-water, or while the tide was less forcible, and ranged themselves on each other; the stream formed them into order by its force as it passed, till the narrowness of the channel increased the power of the flood, when a sudden disruption taking place, the masses burst away, and floated off.
The river was frozen over for the space of a week, and a complete Frost Fair held upon it, as will be mentioned presently.”
@ Duncan – January 3, 2017 at 2:36 pm
Duncan, you are doing fine and I have been enjoying your commentary, cause I spent 20 years in upstate NY when the winters were extremely cold and the snow was deep.
But, as you have now figured out, it is damn near impossible to RE-edumacate those persons who learned all of their science knowledge about the natural world from “talking head” teachers and professors and from book “readin” ….. and thus they will likely argue with you “until the fat lady sings” that your learned knowledge and experiences gained by “living all or part of your life in an extremely cold environment” …. is simply untrue and a figment of your imagination.
They know what they were taught, …… and it doesn’t jive with your “real life experiences” …… and therefore it is their opinion that your commentary has to be utterly FUBAR.
One (1) winter in Canada, iffen they survived, would surely give them a different perspective on/about surviving weather and climate.
“HA”, most places in the northern latitudes they only have two (2) Seasons, ….. Winter and 4th of July.
Toneb – January 3, 2017 at 3:18 pm
Toneb, ……. iffen ”there was only 1 gap for all the arches” …… then there is no point in worrying about any ice blocking or restricting the river flow …….. because it would be the “water pressure” that would blow the ice restriction out of the arch ……. iffen the whole damn bridge didn’t collapse before that happened.
“Toneb, ……. iffen ”there was only 1 gap for all the arches” …… then there is no point in worrying about any ice blocking or restricting the river flow …….. because it would be the “water pressure” that would blow the ice restriction out of the arch ……. iffen the whole damn bridge didn’t collapse before that happened.”
I think you missed my hypothetical point.
Notice I did not mention ice in it – just that (obviously) a small outlet for a large mass of water would to a large degree “dam” the river.
IOW: At some point the constriction would go from being able to speed up the water to match the mass flow behind, to …. not being able.
A slower flow down stream is more able to freeze.
Less salty tidal water got through downstream … making it more able to free.
Duncan January 3, 2017 at 2:36 pm
You guys are all over the place, bridges, tides, shallower, wider, no embankments, stagnation points, etc. All to avoid saying there was a Little Ice Age.
No at all, the point is that without all those changes even the extreme cold wouldn’t have caused the Thames to freeze over at that location. Subsequent to the replacement (1830) of the Old London Bridge with one with far fewer arches and a much less obstructed flow the river never again froze in that location despite similarly cold winters.
Even the painting looks like there are whitewater rapids flowing between them (foamy white stuff). I can tell you from spending a lot of time outdoors in Canada, stationary ice does not form well with flowing water.
Perhaps the painting represents the situation when there is a strong ebb tide when the tide and river flow are in the same direction, as opposed to the times of day when the tide and river flow are in opposite directions and there is no flow through the arches.
Duncan January 3, 2017 at 3:57 pm
Tonyb. Yes everything that is described is an ice jam (not bridges freezing ice & where all this started). Trust me, you do not have winter festivals on ice jams, except for “some adventurous persons even now walked on different parts”. This is ice flowing from the upper river and collecting at this impasse. I have walked on wind blown ice on Lake Ontario, about a kilometer out from shore. Winds blows thinner ice onto shore and it re-freezes. There is no current but watch for the holes into nowhere. It was a very cold winter that year. I would never walk on a river ice jam, it is moving.
In Canada where you live perhaps but it is clear from contemporary accounts that that is exactly what happened at times in London.
Some examples:
“At this time the appearance of the river Thames was most remarkable. Vast pieces of floating ice, laden generally with heaps of snow, were slowly carried up and down by the tide, or collected where the projecting banks or the bridges resisted the flow. These accumulations sometimes formed a chain of glaciers, which, uniting at one moment, were at another cracking and bounding against each other in a singular and awful manner with loud noise. Sometimes these ice islands rose one over another, covered with angry foam, and were violently impelled by the winds and waves through the arches of the bridges, with tremendous crashes.
Near the bridges, the floating pieces collected about mid-water, or while the tide was less forcible, and ranged themselves on each other; the stream formed them into order by its force as it passed, till the narrowness of the channel increased the power of the flood, when a sudden disruption taking place, the masses burst away, and floated off.”
And yet after this:
“The river was frozen over for the space of a week, and a complete Frost Fair held upon it, as will be mentioned presently.”
About a month after the freeze up:
“The Thames, from London Bridge to Blackfriars, was completely blocked up at ebb-tide for nearly a fortnight. Every pond and river near the metropolis was completely frozen.
On the 26th, [January, 1814] the wind veered to the south-west, and a thaw was speedily discernible.
The great fall of the Thames at London-bridge for some days presented a scene both novel and interesting. At the ebbing of the tide, huge fragments of ice were precipitated down the stream with great violence, accompanied by a noise, equal to the report of a small piece of artillery. On the return of the tide, they were forced back ; but the obstacles opposed to their passage through the arches were so great, as to threaten a total stoppage to the navigation of the river. The thaw continued, and these appearances gradually ceased.”
“On Sunday, the 30th of January, [1814] the immense masses of ice that floated from the upper parts of the river, in consequence of the thaw on the two preceding days, blocked up the Thames between Blackfriars and London Bridges; and afforded every probability of its being frozen over in a day or two. Some adventurous persons even now walked on different parts, and on the next day, Monday the 31st, the expectation was realized. During the whole of the afternoon, hundreds of people were assembled on Blackfriars and London Bridges, to see people cross and recross the Thames on the ice. At one time seventy persons were counted walking from Queenhithe to the opposite shore. The frost of Sunday night so united the vast mass as to render it immovable by the tide.
On Tuesday, February 1, the river presented a thoroughly solid surface over that part which extends from Blackfriars Bridge to some distance below Three Crane Stairs, at the bottom of Queen Street, Cheapside. The watermen placed notices at the end of all the streets leading to the city side of the river, announcing a safe footway over, which attracted immense crowds, and in a short time thousands perambulated the rugged plain, where a variety of amusements were provided. ”
“On Thursday, Feb. 3, [1814], the number of adventurers increased. Swings, bookstalls, dancing in a barge, suttling-booths, playing at skittles, and almost every appendage of a fair on land, appeared now on the Thames. Thousands flocked to this singular spectacle of sports and pastimes. The ice seemed to be a solid rock, and presented a truly picturesque appearance. The view of St. Paul’s and of the city with the white foreground had a very singular effect; – in many parts, mountains of ice upheaved resembled the rude interior of a stone quarry.”
Ice dams are usually associated with the spring ice break-up, not deep winter. Winter forms all this land-locked ice, spring sends it all crashing downstream in a short order, sometimes failing bridges. You need thick/dense ice to resist water pressure. The initial ‘plug’ has to form quickly. Stationary ice does not do this, the type of ice you can play on.
Clearly the Londoners of 1814 were made of sterner stuff and your preconceptions based on the behavior of non-tidal lake ice in Canada don’t translate to the river Thames of 200 years ago.
Duncan January 3, 2017 at 2:36 pm
You guys are all over the place, bridges, tides, shallower, wider, no embankments, stagnation points, etc. All to avoid saying there was a Little Ice Age.
Not at all, the cold weather on its own was not sufficient to freeze the Thames at that location, the other factors were all needed to make it happen. Once the Old London Bridge was rebuilt (1830) that part of the river didn’t freeze over in the same way despite similarly cold winters.
Even the painting looks like there are whitewater rapids flowing between them (foamy white stuff). I can tell you from spending a lot of time outdoors in Canada, stationary ice does not form well with flowing water. It just eats away at the ice that does form. Ice can only form in these conditions through brute force when it is very very cold.
That happens on tidal estuaries when the tide is with the river flow, when its against it at other times of the day the flow stops.
Trust me, you do not have winter festivals on ice jams, except for “some adventurous persons even now walked on different parts”. This is ice flowing from the upper river and collecting at this impasse. I have walked on wind blown ice on Lake Ontario, about a kilometer out from shore. Winds blows thinner ice onto shore and it re-freezes. There is no current but watch for the holes into nowhere. It was a very cold winter that year. I would never walk on a river ice jam, it is moving.
Ice dams are usually associated with the spring ice break-up, not deep winter. Winter forms all this land-locked ice, spring sends it all crashing downstream in a short order, sometimes failing bridges. You need thick/dense ice to resist water pressure. The initial ‘plug’ has to form quickly. Stationary ice does not do this, the type of ice you can play on.
My detailed rebuttal of this has apparently been blocked twice so I’m not going to waste any more time. Suffice it to say that you are wrong, contemporary accounts make it clear that that’s exactly how the ice formed. There’s much detail on the 1814 event for example.
“On Sunday, the 30th of January, [1814] the immense masses of ice that floated from the upper parts of the river, in consequence of the thaw on the two preceding days, blocked up the Thames between Blackfriars and London Bridges; and afforded every probability of its being frozen over in a day or two.”
“On Thursday, Feb. 3, [1814], the number of adventurers increased. Swings, bookstalls, dancing in a barge, suttling-booths, playing at skittles, and almost every appendage of a fair on land, appeared now on the Thames. Thousands flocked to this singular spectacle of sports and pastimes. The ice seemed to be a solid rock, and presented a truly picturesque appearance. The view of St. Paul’s and of the city with the white foreground had a very singular effect; – in many parts, mountains of ice upheaved resembled the rude interior of a stone quarry.”
January 4, 2017 at 8:40 am
But, but, but, Toneb, ….. my hypothetical point was ….. that your hypothetical point was FUBAR.
Toneb, that would never have happened …… simply because the bridge construction would have been “washed away” long before it was ever completed.
With any “flowing” river constriction or construction, ….. if the “outflow” of water at the downstream side of the constriction/construction is not equal to …… the “inflow” of water at the upstream side of the constriction/construction, …… then the “inflowing” water will begin ponding at the upstream side of the constriction/construction ….. and iffen the constriction/construction does not disintegrate and wash away ….. then the water will soon be overflowing said constriction/construction.
And ps, look again at the picture of the Thames River Bridge and you will notice that the engineers made sure there was plenty of “headroom” in those arches in case of EXTREME rainfall events occurring in upstream locales.
Phil, you are missing the point, I am not disputing conditions for ice formation where better/different at that time. What I responded to was the bridge making ice. You do not get “several feet” (ref BBC link below and previous paintings posted here) of ice on ANY body of water unless there is long sustained cold, very cold (brute force cold). Even more so on a moving ‘salty’ river where tides cause many feet of level change twice a day. I have only seen “several feet” of ice a few times in my life and only during the coldest winters here in the far north of Canada. Cutting a hole through it to fish is not easy. I have driven my car just on one foot of ice, several feet is a lot of ice. Lets just face it, it was just really cold at times regardless of the ice forming conditions.
http://www.bbc.com/news/magazine-25862141
Here is a ‘scientific’ graph for ice formation. Assuming a uniform temperature of -20F [-30C], ice will grow 36 inches (3ft) in one month. That is a lot of cold.
http://www.outdoorcanada.ca/media/image/62595_max.jpg
http://www.outdoorcanada.ca/How_Fast_Does_Your_Lake_Make_Ice
Duncan – January 5, 2017 at 6:57 am
Duncan, the above “boldfaced” portion of your comment is an extremely important scientific fact ……. that the clueless, dueless, gullible, …… and a big majority of the college educated, ……. and for what it’s worth, …… all partisan proponents of the ”junk science” of CAGW, …… should all take the time to write those “boldfaced” words on a Post-It Note and stick it on the front of their PC screen.
Then afterwards, every time those aforementioned persons hear or read anything about a part or portion of the Antarctica Ice Shelf breaking or fracturing “off” and floating away, …. they should then “read the writin on their Post-It Note” …… and it will remind them of one (1) of the two (2) primary causes that is responsible for the, per se “calving” of the Antarctica Ice Shelf. (The other cause is the forces exerted by ”wind-driven” wave action due to storms in the Southern Ocean.)
Phil documentation exists, so the grapes also existed.
Modern grapes are using hybrids that did not exist in the middle ages, as has already been commented on. Perhaps if you weren’t so quick to disagree you might have noticed that your point has already been refuted.
Grape-growing wine making was also becoming big-business in Germany, ….. but then along came the LIA ……. and Germany as henceforth been a “beer-drinking” country ……. and t’was the German immigrants of the 18th and 19th Century that were responsible for making America a “beer-drinking” country.
OK Mark, how about a reference to the documentation of the scottish vineyard?
Also some assert that the modern English and Welsh vineyards use hybrids that did not exist in the middle ages without providing evidence. Most grow Chardonnay and Pinot noir, the same as has been grown in France since the 1200’s. Castel Coch vineyard was planted with french varieties in 1873. Early varieties used in the recent revival were Müller-Thurgau from germany (a cross of two german/swiss grapes which date back to the early medieval period. Another variety which was discovered growing wild in england and is said to be a natural variant of vines introduced by the romans is Wrotham Pinot (now also grown in california). EU rules regarding the use of ‘hybrid’ grapes tend to restrict the growth to well established european varieties.
Duncan January 5, 2017 at 6:57 am
Phil, you are missing the point, I am not disputing conditions for ice formation where better/different at that time. What I responded to was the bridge making ice.
Actually that’s exactly what you did dispute.
I responded to the original question about the thick ice formation on the Thames and pointed out that the cold wasn’t sufficient to form the ice coverage but that the blockage to the flow by the bridge was a necessary condition for the ice to form in such a manner as to allow the ‘frost fairs’ etc. Despite sufficiently cold weather in winters since the removal of the Old London bridge no such ice coverage has been experienced there.
You do not get “several feet” (ref BBC link below and previous paintings posted here) of ice on ANY body of water unless there is long sustained cold, very cold (brute force cold).
And on the river Thames in that region you only got it when the flow was also obstructed by the bridge!
In 1282 the build up of ice against the bridge was sufficient to destroy 5 arches of the bridge.
A good ref for fig 5 on nonlinearity of the response:
Loehle, C. 2009. A Mathematical Analysis of the Divergence Problem in Dendroclimatology. Climatic Change 94:233-245.
The warming of 1980 – 2000 is referred to as the modern warm
period by many researchers. Figure 3 infers that this modern
warm period is the 1000 year return of the medieval period.
But 1000 years ago we were just beginning to enter the Oort
minimum which lasted about 72 years.
The recent signs of low solar activity suggest that we have a
mild re-occurrence of the Oort minimum to contend with before
we actually enter the medieval phase.
Please visit Weathercycles.wordpress
” Earth’s climate liked to . . . . “
“1. The MWP was a global event and a large number of studies show that warming events overwhelming outnumber cold events.
2. However, the not insignificant number of dry or wet events recorded in the MWP Mapping Project would suggest that perhaps the Medieval Climate Anomaly would be a better description than the MWP.”
WR: About the Cold events shown on the map fig 1. (the online version):
Many of the cooling area’s that lie along the coasts are upwelling areas (reflecting cold upwelling waters). The special thing is, that they mostly are situated at the EAST coasts of continents, different from the present well known upwelling area’s that are located on the WEST coasts of continents. This reflects ANOTHER WIND PATTERN. Those cooling effects of upwelling might (!) be local and so might differ from a regional or global warming pattern.
Examples of anomalous cold East Coast Area’s as shown in the map are:
1. East of Oman
2. East of Baffin Island (2x) (WR: not upwelling but growing glaciers were noticed. Northern and Western winds are able to cause upwelling)
3. East and Southeast of Newfoundland (2x)
4. East of Brasil near Rio de Janeiro
5. South of South Africa (nowadays we find most upwelling West of Africa)
Of the seven area’s on the East coast of Continents at least 5 speak about cold coastal upwelling.
Two of the other ones (not East coast) mention upwelling effects:
– India, off the coast of Mangalore: extra upwelling noticed due to a stronger monsoon (wind)
– SE of South Africa, Ile de la Possession. In the research diatoms in a local peat sediment core are examined. (WR: a local effect of upwelling on a specific part of the island could be present, it is an island, but I did not check the survey itself)
– Southeastern Beaufort Sea, North of Alaska. Increased sea ice is noticed. (WR: increased sea ice could be an indication of fresher Arctic waters, indicating more river runoff)
– Galapagos. Note: “Cold phase 1000-1300 AD. But note that Galapagos is an upwelling area. MWP cooling therefore might only increased local upwelling rather than regional cooling (see comment by McIntyre 2006).”
Wim
the problem I have is that the current modern warm period [MWP} is really not global.
there has been no heating much of any kind in the SH, going by my records on minima.
in fact I already discussed here that the most logical explanation for the MWP is that earth’s inner core has been moving, as indicated by the movement of the magnetic north pole/
@Vukcevic
Can you perhaps elaborate on this?
relevant comment may appear further down, currently either in the moderation or stuck in the ‘wordpress’ machinery cogs.
oh dear
hopefully it has not gone ‘lost’
that happened to me a couple of times, exactly when I had not ‘saved’ the comment……
Henry January 3, 2017 at 9:16 am
“the problem I have is that the current modern warm period [MWP} is really not global”.
Yes Henry, I saw the difference with the Medieval map. I was somewhat astounded. But perhaps the Medieval Warm Period started the same way?
Thanks for this.
Way back in the 90s, I ran into the (even then) petty and wimpish William Connolly on Usenet (ask your parents), who informed me, when I pointed out the MWP, that the MWP was a minor, local incident.
He ignored all the evidence I gave him.
His loss, I guess.
“He ignored all the evidence I gave him.”
Some things never change.
Like much of the left, he sees something work in practise, but it blows his mind because it shouldn’t work in theory.
So, instead of changing his theory, he attacks. Like being nibbled by a duck, let me tell you, but I find myself in great company.
Its really just a repeating the “how to sound all sciency when actually being political”:
1) I don’t believe you because I only believe peer-reviewed science. Show me some and I’ll believe it.
2) That’s only one peer-reviewed submission to a minor journal and can’t balance all the stuff I believe
3) Repeat as needed
Good article Angus.


You don’t need obscure proxies to document that the climate has changed in many areas around the world since the MWP. All you need is a camera and knowledge of the local history. I have done this in the Mediterranean, Cambodia and my favorite, the Urubamba Valley in Peru. Think Machu Picchu. One might hypothesize that all climax civilizations arise during warm periods.
In Peru, the study sited on the Google map showed increased organic sediments during the MWP.
Local history reveals that the Inca tribes began growing around 1000AD. By 1250, they united into the Inca nation and rapidly expanded into an empire with a sophisticated economy and thriving agriculture. Warm and wet weather = more crops = more population = extra bodies for grand works of architecture and military adventures.
By 1532, when the Spanish first arrived, helpfully bringing smallpox and gunpowder, the Incas were apparently already in decline. The Spanish optimistically built their “Capital of the Americas” at Cusco. Failing crops and the end of the gold rush sent them back to Lima on the coast.
This is the Urubamba valley today:
Nothing but cactus and subsistence farming.
You can see the sophisticated terraces fed by irrigation canals running for miles high up in the mountains which delivered water to the upper terraces. Obviously, when built there was a great deal more water available than today.
About the same time, this was a large government building and military garrison in a major metropolis near Nazca down in the Atacama desert. Today nothing grows more than 100 meters from the river.
“You can see the sophisticated terraces fed by irrigation canals running for miles high up in the mountains which delivered water to the upper terraces.”
WR: I also read somewhere that the uplift of parts of the mountains destroyed or could have destroyed the canal system and so the agricultural system. Which could be so, the Andes is a tectonically active region. As we see more often, a big earthquake can result in a strong lifting or sink of an area. And it is clear that they can use the irrigation water well.
I think this article gives some additional information. It’s not paywalled.
http://www.clim-past.net/12/2107/2016/
Research article by Chantal Camenisch et al
01 Dec 2016
The 1430s: a cold period of extraordinary internal climate variability during the early Spörer Minimum with social and economic impacts in north-western and central Europe
A comment to the norse name of Vinland (probably on the north-east coast of Canada): “According to wine historian Edward Hyams and wine expert Jancis Robinson, Vitis labrusca was probably the species seen by Leif Ericsson growing wild along the coast of Vinland in the 11th century. There is ample evidence that the labrusca was growing wild in North America before Europeans arrived.”
The interpretation of the name has been that it could have no connection with wine grapes, as there were not growing grapes so far north as the vikings settled. But when it comes to the change from MWP to LIA, perhaps it is possible.
Northern Hemisphere climate variability is to a high degree regulated by N. Atlantic Arctic oceans interaction. One factor could be appearance and disappearance of the North Icelandic Jet current , which in turn may be activated by rise in tectonic activity along Mid Atlantic Ridge to the north of Iceland.
Changes in the magnetic field in the area are most likely the best available proxy for such activity.
Multi-decadal changes in the magnetic data (derived from paleomagnetic sampling and direct observations) show reasonable correlation with the two better known temperatures reconstructions (Loehle an Ljungqvist) going back 1000+ years including the MWP, with one major exception of reverse correlation (<a href="http://www.vukcevic.talktalk.net/LL1.gif see here “> .
must say
I am quite puzzled about this map
http://www.ancientdestructions.com/piri-reis-map-of-antarctica/
shows that Antarctica must have been ice free not that long ago…..
[must also say that some shores here in South Africa seems to have been 30 m lower than it is now]
….
a guess from anyone on this riddle/?
Two possible explanations:
– It is not a map of Antarctica, but of some other place. It casually bears some resemblance to Antarctica.
– It is fake.
@Javier
You are right. I found the answer here:
https://www.uwgb.edu/dutchs/pseudosc/piriries.htm
interesting read though
So in response to people who ask how to explain why the Piri Reis Map shows the coastline of Antarctica accurately, the answer is – it doesn’t. It especially doesn’t show the subglacial coastline of Antarctica, which corresponds to the existing coastline of Antarctica around most of the continent anyway.
Did not some infamous person say “It would be foolish to graft thermometer reading onto proxies”
Lets do the current temperatures from the proxies.
Here’s a nice proxy from foraminifera isotopes in the gulf, showing a warm MWP. I posted it on Realclimate and got banned.
http://www.marine.usf.edu/PDFs-and-DOCs/publications/J.Ritchie-Holivar2006.pdf
A couple of questions with the Concluding Issues
Griffie:
I hope and pray that you are crapping your panties now that the new year is setting in, and the reality of what is coming now for you & yours is setting in – reality for a change of our climate here :). The Trumpster is coming. Be afraid. Be very afraid. Veritas, indeed.
Terry Burch
…….. ANGUS summarizes:
“””””The MWP was a global event and a large number of studies show
that warming events overwhelming outnumber cold events”””””
The most important conclusion has to be added:
“All those studies, which claim/maintain/insist. that the MPW was only
a restricted Northern Hemisphere event ARE MISTAKEN/False/Incorrect
and have to be withdrawn or corrected…
Furthermore, the 2-3% of studies, which show cooling in the MWP
are false, need to be REDONE again in the same location, and
their unscientific authors should admit Mea Culpa.
Climate/weather affects crops, so people notice this, and record their observations.
Glacier advance or retreat may be uncertain over a few years, but over centuries there are trends.
Historical reports of climate in chronological order, from 800AD. from peer reviewed sources.
http://academic.emporia.edu/aberjame/ice/lec19/holocene.htm
Another example of the MWP is the colonization of New Zealand by the Maori people. These people came to NZ from Polynesia during the MWP. They left Polynesia because of the reduced rainfall at that time so needed to live somewhere else where they could grow their crops. According to NZ paleontologists, at that time NZ was more tropical in the north and quite temperate in the south so tribes of the Maori people were able to populate the whole of NZ, including Stewart Island in the far south. The Maori found another ancient people living in NZ and these people were eventually wiped out. Could they have been tribes from the same area of the Pacific that came during the Roman Warm Period? They definitely weren’t related to Australia’s aboriginal people but apparently were genetically similar to the Maori (and most likely interbred with them).
During the little ice age that followed the MWP NZ got a lot cooler and the tribes that lived in the far south of NZ had to move north to be able to grow their crops and survive. These movements caused the Maori wars. By the time of white settlement only one tribe (the Ngai Tahu tribe) remained in the South Island.
“The reasons for asking these questions are that climate establishment have tried to sideline the MWP as a purely local North Atlantic event.”
Reason, singular?
Quite frankly I don’t think there is a way to tell if MWP was warmer or not than Modern WP. In my opinion it is quite likely that it is warmer now.
@Javier
it seems to there is ample evidence suggesting that the NW passage was open in the Mideviel Warm Period.
Otherwise, why would all these people living in the 15 and 16th century still go looking for it? {Willem Barentz and his men died trying to find the NW passage, hence “the Barentz sea”}
At the moment there is as yet no NW passage. Would be nice if it came as it could save us a lot in shipping costs…. However, I doubt if it will still come open now, as we already entered a cooling period.
Same explanation as to why they would go looking for El Dorado. They simply believed in its existence without any solid evidence.
I’m not sure that there is ‘ample evidence’ for that, Mercator’s map of 1595 shows a NW and NE passage, however it also shows the North Pole as a large black rock.
“In the midst of the four countries is a Whirl-pool, into which there empty these four indrawing Seas which divide the North. And the water rushes round and descends into the Earth just as if one were pouring it through a filter funnel. It is four degrees wide on every side of the Pole, that is to say eight degrees altogether. Except that right under the Pole there lies a bare Rock in the midst of the Sea. Its circumference is almost 33 French miles, and it is all of magnetic Stone” Mercator letter to John Dee.
Clearly much of this goes back to legends and much of it is rather fanciful.
By the way Henry, there is a NW passage open for about a month each year at present. The Crystal Serenity sailed through from Alaska to NY last september and hardly saw any ice.
Retreating glaciers are still uncovering tree stumps and other organic material that has been dated to the medieval period.
The medieval period was 7000 years ago? http://www.livescience.com/4702-melting-glacier-reveals-ancient-tree-stumps.html
Nope, they are uncovering lots of organic material that was buried 5000 years ago, like Ötzi, the ice-man from Tirol, dated 5150 years ago,
Mods, I’m wondering why my posts in this thread are apparently being blocked?
Why isn’t this study https://pubs.er.usgs.gov/publication/70037386 and dozens of other studies involving coral samples and sea floor core diatom samples included in your map? it appears that you have neglected the SST record for the period which showed significant cooling in the Pacific (strong persistent La Nina) why would you do that? oh right. . .
v’