By Andy May
Chapter 10 of the 2013 IPCC Working Group 1 Assessment Report (WG1 AR5) report on climate change deals with how man-made climate change is detected and how much of the total change is due to man. They call the chapter “Detection and Attribution of Climate Change: from Global to Regional,” but in the critical calculation they assume the natural contribution is zero, so we consider “man-made” an appropriate addition to the title of this post. In summary, it says that the Earth’s surface has warmed since 1880 and over half of the warming from 1951 to 2010 is due to man. That humans have some influence on climate is not in dispute, all major species have some influence on climate. Phytoplankton occupy most of the Earth’s surface and, since they photosynthesize, they consume CO2 and produce sugars and oxygen. In all probability, they have the largest effect on climate, but we don’t know how much. Humans mostly live in urban areas that occupy 3% of the Earth’s land area and 1.3% of the Earth’s surface. We burn fossil fuels and biomass, producing greenhouse gases (GHGs), that may have some net warming effect on the climate. Some laboratory measurements show a warming effect from CO2 and methane, but no measurements have been made in the real world (see pages 883-884 in WG1 AR5).
Using satellite data, we can show that the radiative effect of greenhouse gases, has increased from 1970 to 1997. But, measuring the net surface temperature effect of this increase has proven elusive. For an excellent discussion of the problems of predicting the warming effect of GHG’s see Richard Lindzen’s Remarks on Global Warming. In Lindzen’s remarks he notes that the measurements of global warming that we have are ambiguous regarding man’s GHG emissions and:
“Finally, we must turn to the models. It is from model results that our fear of profound greenhouse warming arises. …doubling CO2 will increase the downward flux at the surface by about 4 Watts/m2/sec; the solar flux in existing models must be adjusted by many times this quantity simply in order to get the present day global temperature correct.”
In the classic paper Lindzen and Choi, 2011, they argue that CERES satellite data suggests that natural feedback to an increase in CO2 is negative. That is, it reduces the temperature increase due to CO2 rather than increasing it as the CMIP5 global climate models predict. So, despite the absence of measurements how has the IPCC separated the warming due to man from natural warming? After all, surface temperatures have been rising since the Little Ice Age which only ended in the late 19th century just as we began to keep track of surface air temperatures worldwide.
According to WG1 AR5, the IPCC chose to run an ensemble of climate computer models using two scenarios, one estimates what would happen with no man-made “climate forcing” and another includes both natural and man-made “climate forcing.” Figure 1 shows how the climate forcings are defined in the models used. The graph shows the assumed effect of each forcing for the period 1951-2010. “GHG” is the effect of well mixed greenhouse gases, “ANT” are the forcings due to man, “OA” are man-made forcings other than greenhouse gases, for example land use changes and aerosol emissions. “NAT” are the assumed natural forcings and “Internal Variability” is the natural variability due to ocean oscillations like ENSO, the Pacific Decadal Oscillation (PDO) and the Atlantic Multidecadal Oscillation (AMO). Natural climate variability is known to be significant, but as you can see in figure 1, the IPCC assumes it is essentially zero over this period. The only natural forcing they investigated is total solar radiation (TSI) variability. There are many estimates of total solar variability in the peer-reviewed literature, but they chose one that showed it to be quite small (see here for a discussion).
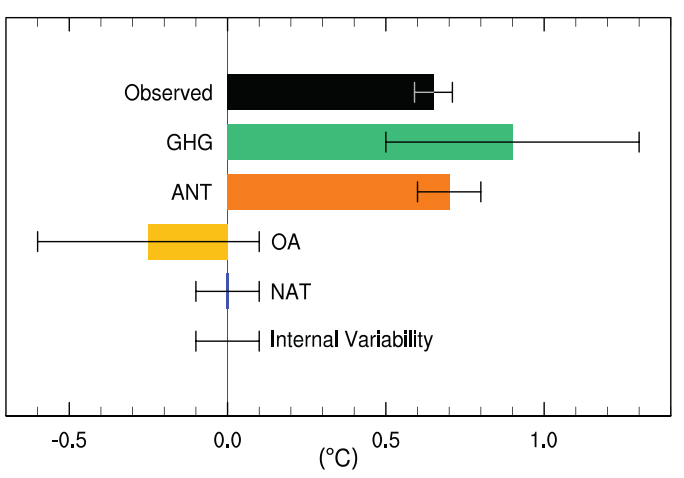
Figure 1 (page 66, WG1 AR5)
For a discussion of natural climate variability due to ocean oscillations see here, especially figures 8 and 9. An overall look at natural climate variation can be seen here. The shorter-term ocean oscillations cause climate to vary on a roughly ~60 year period that Wyatt and Curry have called a “Stadium Wave.” Because the IPCC used the period 1951 to 2010 (59 to 60 years) for their computation of man’s influence they may have assumed that the ocean ~60-year variability was the only “Internal Variability” and since their period was approximately 60 years the effective natural variability for the period was zero. I did not see this idea discussed in Chapter 10, but I can see how they could have made that assumption. They do allude to this idea on page 894:
“Climate variability without forcing – called internal variability, such as El Nino-Southern Oscillation (ENSO) fluctuations in the Pacific Ocean, is the dominant source of internal climate variability on decadal to centennial time scales.”
While the quote above from WG1 AR5 only mentions ENSO as an example of natural variability, Wyatt and Curry found that the Atlantic Multidecadal Oscillation (AMO) and the sea ice extent in the European Arctic sea appeared to drive the timing of the overall stadium wave. They also found that the Pacific Decadal Oscillation (PDO) and the Pacific Circulation Index (PCI) are important. On page 885 of WG1 AR5, the IPCC concludes that the “contribution of the AMO to global warming is very small” and that “AMO variability is accounted for in uncertainty estimates.” Most of their reasoning seems to be that the AMO doesn’t fit their computer models, so it can’t be that important. Wyatt and Peters (2012) and others (see Dr. Wyatt’s blog here for a discussion) have looked at CMIP3 and CMIP5 model output for a stadium wave signal and have not found it. This alone, is evidence that the models are not successfully modeling natural variability.
Besides the stadium wave, there are longer and stronger climate oscillations or cycles that have been observed in the geological and historical record, these are discussed here, here and here. While the evidence for some of the cycles, like the 1000-year Eddy cycle or the 2400-year Bray (Halstatt) cycle is strong, the mechanism behind the cycles is a subject of much debate. Even if the stadium wave could be ignored over a 60-year period, the longer trends may have overlain a secular trend of warming so that the stadium wave does not come back to where it started after ~60 years, but stops at a higher temperature. Thus, the assumption that natural variability is zero, or very close to zero from 1951-2010, may be in error. Since the depths of the Little Ice Age (1300AD to 1750AD or so) the Bray and Eddy cycles have been rising in tandem, see figure 2.
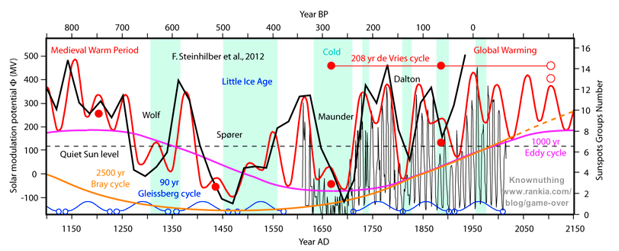
Figure 2 (from Javier, here)
The only natural forcing that the IPCC considered important over the period was the episodic impact of large volcanos. Large volcanic eruptions do have a noticeable effect on climate for a short period, some of the more famous are identified in figure 3. Each of the major volcanic eruptions with a volcanic explosivity index (VEI) of 5 or greater, corresponds with the beginning of a short period of cooler temperatures in all the curves.

Figure 3 (source, Excel spreadsheet here)
In figure 3 we show the natural run data from here, the CMIP5 RCP 2.6 run output from here, the CMIP5 RCP 4.5 output from here and the HadCRU 4.5 temperature record from here. The full spreadsheet with the actual data used to construct figure 3 is here. The CMIP5 data displayed in figure 3 is from the wonderful KNMI climate explorer website maintained by Dr. Geert Jan van Oldenborgh. It is newer and thus different from the data used to make the IPCC WG1 AR5 graphs in figure 4. Figure 3 is also extended through October, 2016 so the impact of the recent El Nino can be seen. The El Nino has taken the HadCRU 4.5 temperatures nearly up to the CMIP5 RCP 2.6 and RCP 4.5 projections. Time will tell if the temperatures will stay that high or not, lately temperatures appear to be falling rapidly.

Figure 4 (source WG1 AR5, FAQ 10.1, page 895)
The IPCC computation of man’s influence on climate is based on the difference between the “natural forcing” model results and the “natural and human forcing” model results, then the temperature effect is reduced based on uncertainty computed by the models. No observations or data are involved in the calculation, other than the data used to tune and calibrate the models. As always, we need to observe that the models do not match the natural warming from 1910-1944 or the “hiatus” from 1998 to 2014. This means that 32% of the 156-year record is poorly matched by CMIP5. Thus, at least in my opinion, they are not validated and using them to compute something as important as man’s influence on climate is questionable. The process is explained in WG1 AR5 page 894 as follows:
“Formal climate change attribution studies are carried out using controlled experiments with climate models.”
If the models capture all climate forcings and natural variability the calculation is accurate. If they do not, the calculation is not accurate. In figure 3, the natural curve (blue) drops under the observations (gray) and the two model scenarios (yellow and orange) about 1920. The observations and the model scenarios really take off around 1970. Visually, one would say (assuming the models are correct) that all warming from 1970 to 2010 is due to man. They drop the estimate to “more than half” (page 17) due to uncertainty, they write on page 884 of WG1 AR4:
“Overall there is some evidence that some CMIP5 models have a higher transient response to GHGs and a larger response to other anthropogenic forcings … than the real world (medium confidence).”
As part of their argument and to support their conclusion that man has caused most of the warming they write on page 869:
“The observed global-scale warming since 1951 is large compared to climate model estimates of internal variability on 60-year time scales. The Northern Hemisphere (NH) warming over the same period is far outside the range of any similar length trends in residuals from reconstructions of the past millennium.”
Wow! Talk about blatant and obvious cherry picking. A very similar rapid rise in global temperatures took place just over 1100 years ago during the Medieval Warm Period according to Richard Alley’s central Greenland temperature reconstruction here. Many other reconstructions also show similar dramatic temperature increases over the last 4000 years, see here. In fact, over the last 4000 years there have likely been several warming events similar to the one we are experiencing today in combination with an over-all declining temperature trend since the Holocene Thermal Optimum due to the Earth’s declining obliquity (see Javier’s Figure 9 here).
The IPCC believes that there is evidence man has contributed to the warming of the Arctic and Antarctic. However, the Antarctic, which contains 90% of the world’s ice, is now cooler, contains more ice and the Antarctic sea ice is at a record extent. So, with respect to global warming, this assertion is a non-starter.
The IPCC claims on page 870 of WG1 AR5 that man has made a substantial contribution to upper ocean warming and sea level rise based on computer model results. Sea level has been increasing since the last glacial maximum and it will increase until the next very cold period. Early CSIRO sea level rise data (before about 1960) is very uncertain, the uncertainty is plotted in figure 5 in mm (data from here). After 1960 they estimate an uncertainty below 7 mm as you can see in the graph. From 1960 to 2014 the trend of rise is about 2.2 mm/year (see figure 6), less than the uncertainty in the measurement. From 1880 to 2014 the rise is 1.6 mm/year. From 2000 to 2015 it is 4 mm/year and from 2010 to 2015 it is 2.3 mm/year, both less than the uncertainty. The fluctuations in the rate of sea level rise are tiny and meaningless considering the error of measurement and the short time period. The rate of sea level rise was as much as 10 times the present rate 7000 years ago during the Holocene Thermal Optimum according to a sea level reconstruction by Robert Rohde and according to NASA here.

Figure 5

Figure 6
The IPCC summary is:
“From this combined evidence it is virtually certain that human influence has warmed the global climate system.”
OK, most would agree that man has influenced climate by increasing warming to some degree. But, the amount of man’s influence is unknown and unmeasured in nature. Their evidence of the “more than half” claim totally relies on computer models, which they acknowledge might not match the real world. It also relies on their assumptions about internal variability and natural forcings. There is abundant evidence (some cited in WG1 AR5) that both internal variability and natural forcings over the period from 1951 to 2010 are greater than zero. To the credit of the IPCC, they do address some of the uncertainties on pages 881-887. It is this statement on page 60 of WG1 AR5 that appears to be an overreach of the data:
“It is extremely likely that human activities caused more than half the observed increase in GMST [Global Mean Surface Temperature] from 1951 to 2010.”
Their models suggest virtually all the warming over the period is due to man, so they add with uncharacteristic honesty (page 869):
“Uncertainties in forcings and in climate models’ temperature responses to individual forcings and difficulty in distinguishing the patterns of temperature response due to GHGs and other anthropogenic forcings prevent a more precise quantification of the temperature changes attributable to GHGs.”
Then we read the following on page 882:
“Individual model results exhibit considerable spread among scaling factors, with estimates of warming attributable to each forcing sensitive to the model used for the [analysis] …, the period over which the analysis is applied …, and the Empirical Orthogonal Function (EOF) truncation or degree of spatial filtering …. In some cases the GHG response is not detectable in regressions using individual models …, or a residual test is failed …, indicating a poor fit between the simulated response and observed changes. Such cases are probably due largely to errors in the spatio-temporal pattern of responses to forcings simulated in individual models …, although observational error and internal variability errors could also play a role.”
The model ensemble used for attribution is a mean of model results that have a “considerable spread.” Some of the models averaged do not detect a greenhouse effect and some fail statistical tests. The amount of warming attributable to each forcing is different in different models. Yet, the model ensemble mean “looks” better. That is the essence of what they are saying. Not impressive at all. If you torture the data model results enough they will give you the answer you want.
Per a best fit line through the HadCRU 4.5 temperature record (figure 7) global mean temperature increased 0.65° from 1951 to 2010.

Figure 7
The IPCC thinks, based on computer models, that the anthropogenic increase in GHG’s likely caused 0.5°C to 1.3°C (page 869) warming over the period 1951-2010 and that other anthropogenic forcings were causing some cooling. They believe that natural variability and natural forcings are very small. So, if their climate models and assumptions are correct, it is logical to conclude that human activities caused more than half of the warming. We question both the accuracy of their ensemble model mean and their assumptions.
We will close with more of Richard Lindzen’s essay “Some remarks on global warming,” written in 1990 and still true today:
“One can only conclude that the current state of large climate models precludes their credible use in predicting the thermal effects of increasing CO2. … It is easy to see that every suggested policy designed to prevent warming will have almost no effect on warming.”
1) Per IPCC AR5 Figure 6.1 prior to year 1750 CO2 represented about 1.26% of the total biosphere carbon balance (589/46,713). After mankind’s contributions, 67 % fossil fuel and cement – 33% land use changes, atmospheric CO2 increased to about 1.77% of the total biosphere carbon balance (829/46,713). This represents a shift of 0.51% from all the collected stores, ocean outgassing, carbonates, carbohydrates, etc. not just mankind, to the atmosphere. A 0.51% rearrangement of 46,713 Gt of stores and 100s of Gt annual fluxes doesn’t impress me as measurable let alone actionable, attributable, or significant.
2) Figure 10 in Trenberth et al 2011jcli24, in addition to substantial differences of opinion, i.e. uncertainties, 7 of the 8 balances considered, 87.5%, showed more energy leaving ToA than entering, i.e. atmospheric cooling.
3) Even IPCC AR5 expresses serious doubts about the value of their AOGCMs (IPCC AR5 Box TS.3).
The sea ice and sheet ice is behaving as usual for decades (DMI) and does not affect sea levels. Polar bear population is the highest in decades, the weather (30 years = climate) is less extreme not more, the sea level rise is not accelerating, the GCM’s are repeat failures, the CAGW hypothesis is coming unraveled, COP21 turned into yet another empty and embarrassing fiasco, IPCC AR6 will mimic SNL’s Roseanne Roseannadanna, “Well, neeeveeer mind!!”
Nice review article, but Nicholas remembers the wrong character on SNL (same player, though). It was Emily Litella.
Andy, most of this rant is intended more broadly for climate science itself and not to put you down for your hard work here.
Subtract cement’s contribution. Over the life cycle of cement it reabsorbs the “lost CO2” that was emitted. I’ve corrected this error by scientists that should know better a hundred times. They just won’t let go.
Maybe that’s a bit harsh – but it is interesting that an engineer has to know his science but scientists can remain ignorant of a fact connected to the largest industry in the world. Calcined limestone (lime) for plasters, mortars, etc. similarly reclaims it’s CO2.
It also seems that chemists don’t number large as commenters on climate change either. I find myself having to deal with the nature of buffering in the ocean that resists “acidification” and the fact that calcium is NOT a rare element being readily available to sequester CO2 as calcium carbonate. The White Cliffs of Dover is an in-your-face 100m thick deposit of coccolithiphores, little dead plankton beasties that sequestered CO2 in the Cretaceous.
How can we advance the science of climate change if we don’t educate scientists on such essential fundamentals for their craft. How can we use trees as temperature proxies if we don’t understand all the resource mix that affect growth of tree rings (nutrients water, sunshine, temperature, shade, disease). I was worried about how long it would take to get political science out of the picture, but now I’m concerned our scientists will have to take remedial courses to requalify for their degrees!
The greatest problem we face is the inculcation of agenda based “science” in K12 schools since the 90’s. Hell, I believed it then. These kids, the ones that brown nosed the most, are now the outraged academic “elites” at Stanford, Berkeley, Harvard, Yale, et cetera. Just that they skated through on pass fail grading; were never taught critical thinking because how can you criticize the “truth”; and as much as I hate to say it, no child left behind.
You might be right, but what is the effect of burying cement in the ground (ie., where cement/concrete is used for foundations), what is the effect of painting cement?
I would have thought that a substantial quantity of cement is in someway sealed, so what impact does that have on its ability to absorb CO2 over its lifespan?
Do you have a link to an online resource that explains how/why calcium in the ocean will prevent “acidification?” It would serve as a great tool to refute the people who unknowingly propagate that particular myth.
I was watching Jordan Peterson the other week on Joe Rogan and he talked about this dumbing down that is so prevalent in Cultural Marxism/Modern Leftism. AGW advocates also display it. He calls it “Low Resolution Thinking”. Something that comes when you have limited responsibility and accountability.
…its CO2…
Gary,
It isn’t really quite as simple as what you suggest. The process is quite dynamic with different rates of emission versus resorption. Calcining takes place in a matter of hours, while that same batch of cement will take decades if not hundreds of years to totally reclaim the CO2. I suspect that with something as massive as Hoover Dam, the resorption will be non-linear and probably take longer than the dam will be in existence. What is done with the debris after demolition will bear on the balancing of the equation. Rates of resorption will probably be different for a dam, with only one face exposed to the air, than for a building totally surrounded by air. I suspect that buildings in windy areas will reabsorb CO2 faster than buildings in calm or sheltered areas. So, I don’t think it is warranted to just write off the emissions of CO2 from calcining as being a wash in the short term.
Paul Stevens,
You might want to start with my article here: http://wattsupwiththat.com/2015/09/15/are-the-oceans-becoming-more-acidic/
Nicholas Schroeder,
Point 1) has little value: as long as less CO2 is removed by the huge natural cycles than humans emit, humans are fully responsible for the increase in the atmosphere. That is what counts for the radiation balance, not the amounts present in the other reservoirs or how much circulates between the reservoirs…
Point 2) is true for the stratosphere: more coolng than warming, not for the troposphere: more warming than cooling, until a new equilibrium between the extra GHGs and temperature is established.
Point 3) anyway is proven right: 95% of all models are busted…
This is the heart of the whole “natural variability” con.
They DEFINE all these “oscillations” as detrended because they already “know” what the trend us due to and are just trying to define the residuals.
The natural variation is mean zero BY DEFINITION. This is not science.
“troposphere: more warming than cooling”… This is something predicted by most, if not all, of the theories (computer models). But not something that has been detected in real life.
Per Trenberth Figure 10 there is no connection between the fictional CO2/GHG/GHE loop and the ToA radiation balance.
http://writerbeat.com/articles/14306-Greenhouse—We-don-t-need-no-stinkin-greenhouse-Warning-science-ahead-
Consider the Maunder Minimum, LIA, MWP, millennia of paleo evidence, glaciations and jungles, hundreds of W/m^2 annual irradiance fluctuations due to perihelion, aphelion, the seasonal tilt and oblique incidence, the chaos and turmoil of every day’s, every year’s, weather & climate in this paper-thin atmosphere.
(BTW if the earth were 12 inches in diameter the atmosphere surface to ToA, 100 km per NASA, would be 0.094” thick. That’s not just thin, but ludicrous thin.)
This notion, which is all it is, that the earth’s climate existed in some kind of long term cosmic “balance” until evil industrialized mankind threw it all out of kilter is an article of faith, a figment of some imagination, like turtles bearing the earth on their backs, and not a provable or demonstrable tenant of science. The hockey stick is a mantra, not a theorem.
The miniscule contributions of mankind cannot be separated with confidence from natural forces, sinks and sources within the 1,000 of Gt of uncertainties.
The evidence is very straightforward. They have detected ZERO evidence of CO2 causing global warming. CO2 does not lead but *follows* changes in temperatures.
I love this 22 minute video by a hard-nosed skeptic (I can’t tell who the narrator is) debunking an ill-informed warmist parroting alarmist talking points. It’s close to the best quick / concise / super effective debunking of the entire warmist theory that I’ve seen, so spread the word about it:
Re Greenland
I recently proposed this approximate graph of the Greenland Total Ice Mass from 1979 to now
I am hoping someone can provide a better graph, using a properly zeroed vertical axis.
Any takers?
ps.. I have since considered taking the graph back some 700 or 800 years.. But I suspect it would look the same.
It would show some measurable decline during the warmest and longest interglacials, such as the Eemian.
I love that graph! But I can’t say for sure whether it’s accurate.
This is from Paul Homewood’s site.
” But I can’t say for sure whether it’s accurate.”
I’m waiting for Mosh or tone(dum)b to fix it for me.
With data , of course.
Come on guys.
AndyG55 said:
“tone(dum)b”
Really? Could you be any more childish?
No, Krause can still be an idiot and know that muons in our time frame exist longer because of time dilation. Knowledge, and that is just knowledge, is one thing, understanding and being able to evaluate contradictory data and interpretations are another.
This essay should be required reading for every single member of Congress, every state governor and every state legislator.
It should also be required reading for every educator.
While this article covers a lot of ground, it only scratches the surface of how broken IPCC driven climate science has become. If I were a consensus climate scientist I would be embarrassed by how sloppy the scientific case for CAGW is. Politics certainly plays a heavy role in how it got to be this bad, but the idea of being so incredibly wrong for decades about something so important is the kind of intellectual failure that few would be willing to admit and this will make getting the science right much harder than it should be.
politics plays a certain role for the activist pseudoscientists like Hansen, Mann, Schmidt. Money (and thus a paycheck) plays the larger role ineconomic survival for the climate scientist who chose careers unwisely. Some like Pielke Jr were able to bail out and maintain their integrity. Like Germany in 1935, most others without tenure folded and sold-out to the regime in power.
joelobryan,
Yes, money certainly plays a role, but to a lesser effect on the science itself. Hansen and Schmidt are civil servants and will get paid no matter what they are doing or how incompetently they do it. Same with Mann, as a tenured professor, he gets paid no matter what he does, nor do University researchers generally profit personally from grant money. For most consensus climate scientists, their denial of reality is more a case of abasement avoidance, especially since correcting the science now has unfathomable consequences to their political identity. This has a crossover effect to scientists in other fields who share political beliefs and who can’t accept that scientific ‘experts’ in another field can be as wrong as they are.
The money angle has more to do with with trying to circumvent market forces and where individuals, organizations and corporations attempt to profit from the climate change scare. Most on the money trail are largely ignorant of the actual science and motivated more by faith, greed and politics. Large amounts of money are also tied to the demands for climate reparations inspired by the IPCC’s stated goal to apply redistributional economics as the desired ‘solution’.
Compare the conservative validated climate model by Apollo NASA engineers and scientists at The Right Climate Stuff ‘s
Bounding GHG Climate Sensitivity for use in Regulatory Decisions February 2014
An Objective Look At The Global Warming Controversy (University of Louisiana-Lafayette) Sept. 21, 2015
In Figure 7, the liner fit shows 0.65 oC rise from 1950 to 2010. Here what is the global warming part? If we look at Figure 7,it is shows a cyclic pattern and not linear fit — at the starting and ending periods show above the linear fit and in between these two periods show the below the linear fit. These clearly show it is not associated with CO2 as it is increasing with the time and so also the urban heat island effect — in this curve rural cold island effect is not accounted due to sparse met network, though it is more than twice to that of urban areas.
Dr. S. Jeevananda Reddy
“Principles governing IPCC work
The role of the IPCC is to assess on a comprehensive, objective, open and transparent basis the scientific, technical and socio-economic information relevant to understanding the scientific basis of risk of human-induced climate change, its potential impacts and options for adaptation and mitigation.”
https://www.ipcc.ch/pdf/ipcc-principles/ipcc-principles.pdf
Natural climate change needs not apply.
Since all the money, positions, careers and privileges are for the study of human-induced climate change, it is no wonder that they find it everywhere.
Upton Sinclair: “It is difficult to get a man to understand something when his salary depends upon his not understanding it.” Regardless of what the climate does it will always human-induced until the biased funding situation is corrected.
central Greenland does benefit from the obvious fact that there’s zero UHI effect. the ocean areas too. thats why the satellite AMSU record should be the only source data to evaluate CO2 sensitivity. But alas, its GISS adjusted surface temps that allow the climate cult toclaim
The IPCC report can be characterized as the proverbial blind man grasping the trunk of an elephant and utterly convinces himself he is holding a snake.
Where to start:
Article: “As always, we need to observe that the models do not match the natural warming from 1910-1944 or the “hiatus” from 1998 to 2014. This means that 32% of the 156-year record is poorly matched by CMIP5. Thus, at least in my opinion, they are not validated and using them to compute something as important as man’s influence on climate is questionable.”
Hurray! This disclaimer should accompany every article of this kind.
Article: “As part of their argument and to support their conclusion that man has caused most of the warming
Well, you would have to reach that conclusion if you start off assuming humans are the sole cause of the warming. They have made an assumption, and now they are declaring it true, with no evidence.
Article: “The observed global-scale warming since 1951 is large compared to climate model estimates of internal variability on 60-year time scales. The Northern Hemisphere (NH) warming over the same period is far outside the range of any similar length trends in residuals from reconstructions of the past millennium.”
That’s ridiculous! The warming from 1910 to 1940 is equal to the warming from 1951 to the present. No need to go back a thousand years in the past to find a match.
Article: “From this combined evidence it is virtually certain that human influence has warmed the global climate system.”
Author: “OK, most would agree that man has influenced climate by increasing warming to some degree. But, the amount of man’s influence is unknown and unmeasured in nature.”
I would submit that we should *not* agree that man has influenced the climate by increasing warming because the warming produced by CO2 might be producing a negative feedback that cancels out the warming. So why assume humans have put extra warming into the atmosphere where it has caused the climate to do something it wouldn’t ordinarily do? There is no evidence that is happening. We shouldn’t assume there is until we see some indication of it. Human warming of the atmosphere is pure speculation at this point.
The models also don’t match the years from 1944-77, but the “data” have been manipulated to hide that fact. So at best half of the interval “matches” a shamelessly adjusted “data” set.
“natural forcing only” How can they think this is accurate. It’s the models with CO2 forcings minus the CO2 forcings. In other words, it’s only accurate if their modeling for CO2 forcing is accurate. That’s circular logic.
We don’t know what the climate would be doing in the absence of burning fossil fuels. If we did, we have all our answers. We don’t know shit.
AM, nice review article. I would, however, not rely on Lidzen and Choi 2011. It adopts dubious statistical methods to come to an unnecessarily dubious conclusion about negative net feedack (the first derivative of the operator) ECS. All calculations including Lindzen’s point to a no feedbacks ECS of 1.1-1.2. Moncktons most recent ‘error’ posts at WUWT calculate 1.16. Whatever.
Now, all the observational evidence says the main WVF is weakly (not strongly, as IPCC asserts using falsified/misinterpreted/ignored evidence) positive. Essay Humidity is still Wet for details and references. And the observational evidence also shows the second most important feedback, clouds, is roughly zero. Essay Cloudy Clouds for details and references. AR5 itself says all other feedbacks are roughly zero. And observational ECS in several papers (my preference with other citations is Lewis and Curry 2014) is ~1.65, half of AR5 models.
So the likely Bode f value for net of all feedbacks is ~1.25-1.3, positive and a bit less than half of AR4 at almost exactly 0.65, NOT the ~-0.85 of Lindzen and Choi 2011. Overstating the skeptical case is no better than overstating the warmunist case. Just state balanced well referenced observational ‘truth’.
Thanks Ristvan. Good comment. We don’t know what ECS is, my guess is around 1, your guess is a little higher. There is decent observational evidence for both guesses, but they are guesses at this point. I bet we both agree that the AR4 “best estimate” of 3 is too high. Not much observational evidence for 3. And the AR5 bunch didn’t even have the cojones to offer a best estimate!
Yes, AM, 3 is defintiely too high. See my Lindzen reviewed discussion in the long footnoted penultimate climate chapter of the Arts of Truth ebook from late 2012.
What it actually is, we will eventually find out. Whether my ‘lukewarmer ~1.5-1.65 (weakly positive) or your very skeptical 1.0 (slight negative) is unimportant to the greater debate. Either says there is no C in CAGW. And that suffices policy wise. Highest regards.
ristvan says, December 20, 2016 at 4:52 pm:
Yes. That doesn’t mean it IS 1.1-1.2. Out there in the real Earth system.
Look, what we observe is that as the ocean surface gets warmer (for whatever reason), it evaporates more. And so (at least the lower to middle troposphere) becomes more humid. That doesn’t mean this increase in WV is a positive temperature feedback. Actually, increased evaporation from a warming surface acts as a negative feedback to the warming, and further it would indirectly act as a cause of tropospheric warming, upon the release of latent heat (more cloud formation and precipitation).
“Observational evidence” shows that clouds are ultimately what controls climate. The de facto “Control Knob”. (There is ZERO evidence they act as mere feedback to CO2 warming.) Meaning, the tightly coupled ocean-troposphere system is what controls the climate, at least over multidecadal periods. And it controls the climate 1) by regulating the solar input (mainly to the tropics) through (mainly the tropical) cloud cover, 2) by regulating the global distribution of the tropical heat (ocean currents (surface and column) and tropospheric advection/convection (horizontal and vertical)), and 3) by regulation the rate of release of energy from (mainly) the ocean (winds (pressure gradients), thermoclines, upwelling, all affecting evaporation rates; bringing heat to regions where the convective coupling ocean/troposphere is weaker, like “The Blob” phenomenon, see 2)).
Global warming since ~1970 is easily explained by ocean/troposphere dynamics with the Sun as the energy provider. There is absolutely NO evidence whatsoever of an “enhanced GHE” as a contributing factor in ToA radiation flux data (since 1983-85), nor in surface radiation flux data (since 2000).
This is way too complicated. The warming in the early 20th century is almost identical with the warming in the late 20th century. We assume that the early warming was natural. If we can’t tell the difference between the two curves, the obvious conclusion is that the late warming is also natural. link
The more convoluted the argument, the more likely it is to be wrong.
Well said. One of the ‘killer’ arguments first articulated by Lindzen of MIT. And supported by AR4 WG1 SPM figure 8.2 on attribution. Which causes warmunist heads to explode.
There is no figure 8.2 in AR4 WG1 SPM
http://www.ipcc.ch/pdf/assessment-report/ar4/wg1/ar4-wg1-spm.pdf
Yup, my memory is defective. The relevant figure
Is SPM 4 in AR4. Right for wrong reasons is still wrong. But ponder SPM 4. Message was right.
I agree, way too much detail, my way of explaining it to folks is as follows:
The so called proof that man is causing the globe to warm and that it is dangerous, is based on computer models. The main problem with the models is none of the modelers agree on the details of what impacts the climate, so they all produce different results that very poorly match actual observations. In other words, the climate science is not only not settled, it is poorly understood. If the science was understood only 1 computer would be needed. Garbage in produces garbage out from the computer models. The proof that man is causing dangerous warming is BS.
Hallelujah, Commie Bob! Given our understanding of the historical record, there is no reason to assume that AGW exists. This fantastical worldwide industry of dogma and deception rolls on destroying truth and substituting economic madness. This is a war and we are on the side of right. With the electoral tide as it is we will never have a better time to go on the offensive as aggressively as possible. Q
Why bother?
In a lot of ways, showing the flaws in their argument using their data and their methods has merit.
But at the same time, you lend scientific credibility to the case which it simply does not deserve. An onlooker simply has no idea they are witnessing an argument which is nothing more than an intellectual fantasy, like angels dancing on a pin.
The Money Shot:
Figure 4, which purports to prove human influence, and does so in a dramatic way. Now look at the “observed” black line in both plots.
1) The rise ~1910 to ~1940 is half of what was shown to be the case in 1976.
2) the fall ~1940 to ~1975 clearly shown in records from the late 1970s has been wholly eliminated.
The historical record has been completely rewritten so as to comport with theory.
There is no point in pointing out flawed details in the argument when the whole argument is a total fabrication.
But, it was so much fun to use their own words to tie them into knots. Don’t deny me the simpler pleasures in life.
Plus many. I enjoy the same pleasures. Lets agree on simple irrefutable sound bites. Those work like machine guns against the warmunist charge of the light brigade.
OK, that is a good reason.
Andy I appreciate it and I’m sure it’s gratifying for many other readers here, but I have to agree it won’t sell any newspapers. Tony summarizes the problem well with “An onlooker simply has no idea they are witnessing an argument which is nothing more than an intellectual fantasy”.
We’ve all heard the old “if you can’t convince ’em with facts, baffle ’em with bullshit” strategy and it’s been used in spades in the IPCC reports. The example you give:
Is more correctly written “The global climate models developed to date don’t work”. It’s easy. But the vast majority of people reading the original sentence aren’t going to perform that reduction. I don’t really think you’ve said it clearly enough either.
Beyond that, there’s the absurd size of the report. “On page 846 we find…” Seriously? And this is a condensed, succinct overview of the “state of the art”? No. It’s a book thick enough to stun an ox, which is exactly what it’s intended for. The lesson there is that if you want to reach the intended audience, keep it short.
I agree if you try to tie them up with their own words you have no choice but to duplicate their mistakes while unintentionally lending credence to them by engaging in a serious critique of a grossly flawed work. There has to be a more approachable way to do this. It may be the general public has already rejected cAGW just because the strident and elitist tone of the alarmist camp has alienated them. If so, the best thing is to just shut the whole thing down by brute force and forget about convincing anyone further. Cut off their funding.
Wrestling with pigs and all that…
In a recent Science perspective, Gavin Schmidt and others openly admitted that the super computer GCMs are tuned to expectation.And they admit that any 2X CO2 sensitivity value between -2 C to +7 C can be tuned via the parameters.
Any hithertofore naive non-climate scientist reading that should have been, at that point, become fully aware that the climate models are junk science.
They even give GIGO a bad name. Too bad that climate models don’t have to compete in the market place like other computer games must do.
Confidence intervals:
-2 to 7 degrees C, maybe 50%
1.5 to 4.5 C, maybe 25% (IPCC WAG)
0.0 to 2.0 C, 95% (reality)
“Wow! Talk about blatant and obvious cherry picking. A very similar rapid rise in global temperatures took place just over 1100 years ago during the Medieval Warm Period according to Richard Alley’s central Greenland temperature reconstruction here. “
For heaven’s sake, can’t people get it into their heads that Central Greenland is not global. Individual locations are far more variable than a global average, where individual variations substantially cancel out. And Central Greenland ice plateau is hardly representative anyway.
Can’t alarmists get it into their heads that the whole corrupt enterprise is an anti-human, anti-freedom, anti-capitalist criminal conspiracy which puts the Mafia to shame?
Luckily, there’s a new sheriff in town who, if he keeps his word, will burn your house of cards to the ground.
I thought we would be on a science site here. Many of your comments let me think I’m at Fox News instead.
What now concerns your new sheriff: we will see what he is able to do. Until now, he has never proved anything in his life except perhaps the ability to literally walk over dead bodies.
Wait and see.
“Until now, he has never proved anything in his life except perhaps the ability to literally walk over dead bodies.”
To build a successful, multi-billion dollar enterprise, you need a lot more than this. You seem to fault him because he has good business sense while most who voted for him considered this an asset. It will be a refreshing change to have an administration that understands business and how to get things done on budget and on time. It’s a bonus that he’s skeptical of the IPCC’s conclusions and that many of his appointees are on the same page. I hope that the legacy of his administration will be to have corrected the horribly broken science that was otherwise destined to cost trillions for absolutely nothing in return, rather than just executive actions that undo the damage done by Obama.
To Nick Stokes:
“For heavens sake, can´t you get it into your head that GISP2-Alley is
the Gold Standard of global climate. When temps are significantly down
in GISP2, take as example the 6th century cooling of the Dark Age Cold
period, or take the warm MWP (check the MWP- project data base,
comprizing all Holocene studies) of GISP2…then ALL significant
warming and cooling periods of GISP2 are FOUND GLOBALLY in other
regions of the world.: Period.
JS,
“GISP2-Alley is the Gold Standard of global climate”
No, it’s a well accepted record of central Greenland. Here is a plot taken from the WUWT paleo page, comparing GISP2 with a NH recon by Moberg (fairly typical), a Sargasso Sea record, and HAD3.
The first thing to note is my above point – GISP is a lot more variable than the NH. But mostly, the variations don’t match. The MWP does, somewhat. But the Dark Age dip, the late Roman warm peak in GISP-2 just don’t show in Moberg, and if anything, the Sargasso goes the other way.
And, of course, HAD 3 runs away at the end.
Nick, I referenced a number of reconstructions besides Alley’s. But, I agree with Jo Seifert. After looking at a huge number of temperature reconstructions for the past 4000 years and comparing them to worldwide historical records, other proxies and archeological records, I like Alley’s the best. But, in this case it doesn’t really matter what reconstruction you use, if you go back 3 or 4 thousand years you will find a warming event (probably several) that rival recent warming. If you go back 12000 years the warming at the end of the Younger Dryas swamps the current warming in speed and temperature increase.
” But, in this case it doesn’t really matter what reconstruction you use, if you go back 3 or 4 thousand years you will find a warming event (probably several) that rival recent warming.”

It matters hugely whether they are single site or global. All the other recons that you linked to were single site, mostly Greenland, with one exception, showing Loehle’s global and Ljungqvist’s NH. And that plot (below) shows how different even the Greenland average is to NH and global variability. And the Greenland average varies much less than a single site. The NH plot of Ljungqvist, in particular, shows no warming in the last millenium that is comparable to present.
Sorry, I linked the wrong plot, though it does show the variability between Greenland sites that gets smoothed even in the Greenland average. Here is the one of Greenland Ave vs Loehle and Ljungqvist: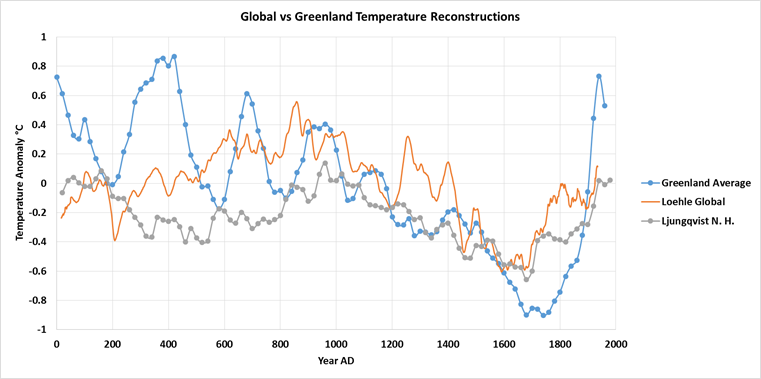
Nick, can YOU fix this graph of the Greenland Total Ice Mass since 1979 for me please.
Must use a properly zeroed ice mass axis
Nick, where are you Nick,..
Don’t tell me he’s run away again. !!
Nick, as I explained in that post, the weakness inherent in the global and hemispheric reconstructions is they use so many proxies that they cancel each other and reduce the amplitude of warming and cooling events. Due to ocean cycles global warming often occurs at different times in different places. Plus, there are dating (generally carbon dating) errors that are generally >100 years. Small errors in dating the proxies can make a huge effect on the amplitude of events in reconstructions. I’ve plotted PAGES 2K proxies together and seen this. So, IMHO we need to pick one place that shows the trends over as much of the Earth as possible to get the amplitudes correct. Alley has done that. Greenland is in a critical spot, it is affected by the AMO and influenced by European arctic sea ice (see Wyatt and Curry). These are drivers/indicators of global climate oscillations and cycles. I agree the idea is speculative and I have little evidence other than comparing history and archeology to the various reconstructions and looking at proxies, but I think this is what is happening.
“the weakness inherent in the global and hemispheric reconstructions is they use so many proxies that they cancel each other and reduce the amplitude of warming and cooling events. Due to ocean cycles global warming often occurs at different times in different places.”

Cancellation is part of the deal. It is what global and regional averages do. It’s is why they try to assemble so many proxies. And the ocean cycles thing is also present in all global averages. You compared GISP with HADCRUT 4, saying GISP has periods of more warming than HAD. HAD is a global average. Here is a plot of the 15 Greenland stations in GHCN (unadjusted, mean subtracted), with monthly readings smoothed by 12 month running mean. HAD likewise, in black. Now do you see why you can’t use warming of an individual location to compare with a global or regional average?
Now do you see why you can’t use warming of an individual location to compare with a global or regional average?
Nick is right here, and we can see what he means on a far wider range: the entire set of the 7,280 GHCN stations having contributed to the temperature record since 1880.
http://fs5.directupload.net/images/161221/km6j5k3r.jpg
No chart could show us better the difference between a set of local measurements and a global, spatiotemporal, homogenised synthesis constructed out of that set.
And BTW it helps in understanding that homogenisation, unlike what is pretended by (so) many WUWT commenters, doesn’t necessarily result in warming, but… sometimes leads in substantial cooling, as is visible when comparing the GHCN and GISS linear trends ( in °C / decade):
– GHCN unadjusted: 0.214 ± 0.006
– GHCN adjusted: 0.229 ± 0.006
– GISS land-only: 0.097 ± 0.001
Nearly the same ratio appears when comparing the two during the small satellite era (with of course fairly higher 2σ):
– GHCN unadjusted: 0.402 ± 0.265
– GHCN adjusted: 0.437 ± 0.266
– GISS land-only: 0.205 ± 0.078
bindion,
“And BTW it helps in understanding that homogenisation, unlike what is pretended by (so) many WUWT commenters, doesn’t necessarily result in warming, but… sometimes leads in substantial cooling …”
It’s all about selecting the sites targeted for homogenization. Hansen/Lebedeff homogenization assumes a normal distribution of temperatures, trends and sites. You can make the trend become anything you want because of all the uncertainty about what defines a normal distribution of samples. This is why I can only trust full coverage satellite data and not sparse, highly manipulated near surface measurements.
I should also point out that the surface temperatures from satellites are quite accurate. The LWIR sensors are looking at only small parts of the spectrum and mostly within transparent regions (except the water vapor channel). As a result, the sensor voltage becomes readily converted into the color temperature of the radiation. The color temperature corresponds to the peak radiation per Wein’s Law which is the surface temperature under clear sky conditions. This can be calibrated across the globe by matching to only a few surface measurements. The only real uncertainty arises when predicting how the surface temperature is changing when completely obscured by clouds, but this too is easily solved.
co2isnotevil on December 21, 2016 at 3:57 pm
I should also point out that the surface temperatures from satellites are quite accurate.
Of course: “CO2 isnt evil” manifestly means the very ripe technology:
“Satellite-derived land surface temperature: Current status and perspectives”
perfectly described in
http://www.sciencedirect.com/science/article/pii/S0034425712004749
and operational since many years. Very, very, very interesting!
I’m sure you had years ago, like I did, a look at Google’s output for “surface temperature from satellite using LWIR sensors”.
And I imagine your reaction if I had presented such a paper with a background you would have identified as “warmist” or “alarmist”!
Many thanks above all for your pretty good statement
This is why I can only trust full coverage satellite data and not sparse, highly manipulated near surface measurements.
Your naivity is beyond any expectation. You even are not able to imagine how simple it might be to manipulate satellite measurements if there was any need to do!
Merci, cela me suffit amplement, Mr CO2!
Bindidon,
It’s easier to get a hold of raw satellite data then the raw data used for GISSTEMP or any of the other reconstructions that show far more warming then has actually occurred. Yes, satellite data can be manipulated, but I don’t need to manipulate it to demonstrate my point, nor would I consider such manipulation good science.
What makes full coverage satellite data far more accurate is that you can apply COE directly to the samples, rather than inferentially after the homogenization of sparse samples. It’s the difference between samples 10 km apart and samples 500 km to 1000 km apart. Moreover; the 10 km pixel is the average of all the photons emitted by that 10 km piece of surface and received by the sensor which is fundamentally different than the considering the temperature of few 10’s of square meters as being representative of the average temperature across a million square meters.
Nick,
While I agree that Greenland should not be used as representative, I think you are deflecting the main point with a distraction.
Our modern times come right after probably the coldest period in the entire 11,700 years Holocene, at least judging by global glacier extension. They can hardly be considered as representative. It is not surprising in the least that after the Little Ice Age there is a multi-centennial warming trend. How do we know that the simultaneity of the warming, the increase in emissions, and modern science and instruments is not just a coincidence? Looking back 1000 years as an argument is moot and Andy May is correct that it constitutes cherry picking.
Andy is also correct in that there has been several multi-centennial cooling and warming periods in the Holocene, and that it is not clear that the present one is holding any record. The 8.2 kyr event was probably a lot more profound judging by the mark it has left in most proxies. The multi-centennial warming after 8,200 years ago was probably much steeper, as it went from a very cold point to the warmest point in the Holocene (~ 7800 BP) in just four centuries. We know it was also accompanied by a strong increase in CH4. If humans had just developed then modern science and instruments they would had immediately developed a catastrophic warming hypothesis.
Things like past El Niño look very intense when close up with thermometers, but they are nearly invisible when looking at proxies of a thousand years ago, and so it looks like in the past there was a lot less variability. That is simply a sampling problem. The past is sampled sparsely and variability gets averaged magnifying present changes by comparison. On this planet, climate stability is the exception, not the norm.
When you see government agencies like NASA GISS or NOAA, that should be guardians of propriety and neutrality, engage in propaganda tactics in claiming dubious records with zero scientific value, ignoring the huge uncertainties that come from contrasting present measurements to past highly dubious data, then you know that science is being abused in this political farce. And when you see the same going on with the agencies and institutions following sea level rise, sea ice, or any other climate variable, then the only reasonable position is one of distrust and skepticism.
Frankly, anybody claiming that the warming from 1975 to 2016 is exceptional because it is a few tenths of a degree more intense than the warming from 1910 to 1945, and claiming that we have already warmed more than the entire Holocene, and coming without good evidence to demonstrate it, should be laugh at. It seems to me that a lot of people have lost their senses over this matter.
“Every age has its peculiar folly: Some scheme, project, or fantasy into which it plunges, spurred on by the love of gain, the necessity of excitement, or the force of imitation.” Charles Mackay in 1841, just about when global warming was starting, yet little CO2 was being produced by men.
Javier,
“It is not surprising in the least that after the Little Ice Age there is a multi-centennial warming trend.”
It’s not surprising in hindsight. That’s why we now call it the Little Ice Age. But it’s just descrriptive. That’s my objection to saying that the trend is explained by saying it is a recovery from the LIA. It’s just saying that it is warmer now because it was colder before.
“The 8.2 kyr event was probably a lot more profound judging by the mark it has left in most proxies.”
We don’t know much about its global effect. It hardly shows in Marcott’s reconstruction. But it is big in some N Atlantic records, and the reason seems to be that it was associated with the last bursting of the Lake Agassiz complex.
“Frankly, anybody claiming that the warming from 1975 to 2016 is exceptional because it is a few tenths of a degree more intense than the warming from 1910 to 1945, and claiming that we have already warmed more than the entire Holocene”
The earlier period stopped. The later period has gone further, and shows no sign of stopping. But yes, Marcott’s recon shows that we are back to Holocene peaks.
Javier, one of the great ironies of climate, is that far from us being on the brink of a global warming disaster, the climate records show that we are on the brink of a global cooling disaster with perhaps 6C cooling (as measured at the poles) imminent (next 2000 years).
And as they say “what goes up must come down”. And as you said, the little ice-age was an exceptionally cold period. The question we ought to be asking in climate is this: was the little ice-age an exceptionally cold period, or is the present period and exceptionally warm period. Because, if the present period is an exceptionally warm period, then more than likely, the next shift in climate will be back to the little ice-age …. or as a remote but extremely worrying possibility, we may find ourselves about to go down the slippery slope to a much colder climate.
And indeed, one of the great ironies of climate, is that whilst the CO2 warming is almost utter man-made fabricated baloney, the global cooling scare of the 1970s actually had some credibility.
Nick,
Ah, but that is how it works. It might get very cold after a strong volcanic eruption, but after particles and aerosols deposit, the climate of the world warms. Why does it warm? Because it was cold before and it is returning where it should be due to all the factors affecting climate. And it warms without any change in all those factors. Just the disappearance of what was causing the cooling. So yes, it is perfectly possible that it is warmer now because it was colder before.
You don’t know much about the causes and effects of the 8.2 kyr event, but we do know. Try:
Rohling, E. J., & Pälike, H. (2005). Centennial-scale climate cooling with a sudden cold event around 8,200 years ago. Nature, 434(7036), 975-979.
The 8.2 kyr event shows prominently in records from China, Tibet, Oman, Lake Victoria, Kilimanjaro, Tropical Andes, Cariaco Basin. And the biosphere was hugely affected to produce such spike in methane. CO2 levels show an inflection point at that time and since then uncoupled from temperatures for the rest of the Holocene. The 8.2 kyr event does show quite prominently in Marcott et al., 2013. Things don’t get much more global than that except in the glacial cycle.
http://i.imgur.com/z07TBhB.png
There are several strong cooling periods in Holocene records followed by warming recovery that typically lasts 300-400 years. What we don’t see is the opposite. As we are within the time frame for a recovery from a cold period, and as our cold period was the coldest and longest on record, the fact that we are warming is not exceptional at all. We can discuss if we are warming more than expected and the contribution from the increase in CO2, but any alarmism at this point is premature.
It could be showing signs of stopping. There has not been significant warming in the 21st century if we discount El Niño.
Marcott et al. are wrong on that. They base their estimate on tropical warming of 0.4°C since the Holocene Optimum, and Southern cooling of only 0.4°C. However the evidence is overwhelming that they are wrong, and that they have used alkenone records from upwelling areas that display inverted temperature trends, and generally do not agree with Mg/Ca proxies. Glaciological changes, biological evidence, and model reconstructions disagree with Marcott et al., 2013. For a thorough discussion with bibliography of this particular issue see:
https://curryja.files.wordpress.com/2016/09/global-holocene-climatic-optimum-temperatures1.pdf
Nick,
Ah, but that is how it works. It might get very cold after a strong volcanic eruption, but after particles and aerosols deposit, the climate of the world warms. Why does it warm? Because it was cold before and it is returning where it should be due to all the factors affecting climate. And it warms without any change in all those factors. Just the disappearance of what was causing the cooling. So yes, it is perfectly possible that it is warmer now because it was colder before.
You don’t know much about the causes and effects of the 8.2 kyr event, but we do know. Try:
Rohling, E. J., & Pälike, H. (2005). Centennial-scale climate cooling with a sudden cold event around 8,200 years ago. Nature, 434 (7036), 975-979.
The 8.2 kyr event shows prominently in records from China, Tibet, Oman, Lake Victoria, Kilimanjaro, Tropical Andes, Cariaco Basin. And the biosphere was hugely affected to produce such spike in methane. CO2 levels show an inflection point at that time and since then uncoupled from temperatures for the rest of the Holocene. The 8.2 kyr event does show quite prominently in Marcott et al., 2013. Things don’t get much more global than that except in the glacial cycle.
http://i.imgur.com/z07TBhB.png
There are several strong cooling periods in Holocene records followed by warming recovery that typically lasts 300-400 years. What we don’t see is the opposite. As we are within the time frame for a recovery from a cold period, and as our cold period was the coldest and longest on record, the fact that we are warming is not exceptional at all. We can discuss if we are warming more than expected and the contribution from the increase in CO2, but any alarmism at this point is premature.
It could be showing signs of stopping. There has not been significant warming in the 21st century if we discount El Niño.
Marcott et al. are wrong on that. They base their estimate on tropical warming of 0.4°C since the Holocene Optimum, and Southern cooling of only 0.4°C. However the evidence is overwhelming that they are wrong, and that they have used alkenone records from upwelling areas that display inverted temperature trends, and generally do not agree with Mg/Ca proxies. Glaciological changes, biological evidence, and model reconstructions disagree with Marcott et al., 2013. For a thorough discussion with bibliography of this particular issue see:
https://curryja.files.wordpress.com/2016/09/global-holocene-climatic-optimum-temperatures1.pdf
Nick,
Ah, but that is how it works. It might get very cold after a strong volcanic eruption, but after particles and aerosols deposit, the climate of the world warms. Why does it warm? Because it was cold before and it is returning where it should be due to all the factors affecting climate. And it warms without any change in all those factors. Just the disappearance of what was causing the cooling. So yes, it is perfectly possible that it is warmer now because it was colder before.
Nick,
“It’s just saying that it is warmer now because it was colder before.”
Ah, but that is how it works. It might get very cold after a strong volcanic eruption, but after particles and aerosols deposit, the climate of the world warms. Why does it warm? Because it was cold before and it is returning where it should be due to all the factors affecting climate. And it warms without any change in all those factors. Just the disappearance of what was causing the cooling. So yes, it is perfectly possible that it is warmer now because it was colder before.
Nick,
Ah, but that is how it works. It might get very cold after a strong volcanic eruption, but after particles and aerosols deposit, the climate of the world warms. Why does it warm? Because it was cold before and it is returning where it should be due to all the factors affecting climate. And it warms without any change in all those factors. Just the disappearance of what was causing the cooling. So yes, it is perfectly possible that it is warmer now because it was colder before.
You don’t know much about the causes and effects of the 8.2 kyr event, but we do know. Try:
Rohling, E. J., & Pälike, H. (2005). Centennial-scale climate cooling with a sudden cold event around 8,200 years ago. Nature, 434 (7036), 975-979.
The 8.2 kyr event shows prominently in records from China, Tibet, Oman, Lake Victoria, Kilimanjaro, Tropical Andes, Cariaco Basin. And the biosphere was hugely affected to produce such spike in methane. CO2 levels show an inflection point at that time and since then uncoupled from temperatures for the rest of the Holocene. The 8.2 kyr event does show quite prominently in Marcott et al., 2013. Things don’t get much more global than that except in the glacial cycle.
http://i.imgur.com/z07TBhB.png
There are several strong cooling periods in Holocene records followed by warming recovery that typically lasts 300-400 years. What we don’t see is the opposite. As we are within the time frame for a recovery from a cold period, and as our cold period was the coldest and longest on record, the fact that we are warming is not exceptional at all. We can discuss if we are warming more than expected and the contribution from the increase in CO2, but any alarmism at this point is premature.
It could be showing signs of stopping. There has not been significant warming in the 21st century if we discount El Niño.
Marcott et al. are wrong on that. They base their estimate on tropical warming of 0.4°C since the Holocene Optimum, and Southern cooling of only 0.4°C. However the evidence is overwhelming that they are wrong, and that they have used alkenone records from upwelling areas that display inverted temperature trends, and generally do not agree with Mg/Ca proxies. Glaciological changes, biological evidence, and model reconstructions disagree with Marcott et al., 2013. For a thorough discussion with bibliography of this particular issue see:
https://curryja.files.wordpress.com/2016/09/global-holocene-climatic-optimum-temperatures1.pdf
Javier on December 20, 2016 at 8:28 pm
Frankly, anybody claiming that the warming from 1975 to 2016 is exceptional because it is a few tenths of a degree more intense than the warming from 1910 to 1945, and claiming that we have already warmed more than the entire Holocene and coming without good evidence to demonstrate it, should be laugh at.
Wow! I agree. But who pretends that, apart from some illuminated alarmists and media highly interested in reproducing their histeric thoughts?
No surface record shows over 1 °C / century since 1880. So we don’t need to panic, especially when looking at the graph below:
http://fs5.directupload.net/images/161221/34pxp58f.jpg
But I can tell you that people like those working in the reinsurance sector e.g. at Munich Re are not at all interested in wether or not the actual climate is a replication of what happened thousands of years ago.
They just see that insurances had to pay about 100 G$ last year and need hints on where that goes.
Sorry about the mess above. As it can be seen by the time stamp, the message refused to show, and I thought it was being swallowed by internet and kept sending it. Perhaps a mod can clean up the mess.
Bindidon,
Roger Pielke Jr. has already answered to that very thoroughly through his studies and testimonies to the US congress.
http://rogerpielkejr.blogspot.com.es/2011/11/new-study-on-insured-losses-and-climate.html
A conclusion from a study on this issue that can be found in the above link:
“Climate change neither is nor should be the main concern for the insurance industry. The accumulation of wealth in disaster-prone areas is and will always remain by far the most important driver of future economic disaster damage. . . “
Javier on December 21, 2016 at 4:33 pm
Roger Pielke Jr. has already answered to that very thoroughly through his studies and testimonies to the US congress.
Wow Javier… To be honest, never and never I would have imagined you showing such naivity.
RP Jr’s brazen blah blah you linked to (Posted by Roger Pielke, Jr. at 11/02/2011 05:45:00 PM)
is something we describe in Europe with the term “unclesamocentric”, a sweet combination of “Uncle Sam” and “egocentric”.
Pielke’s prosa pretty good reminds me another well known testimony, presented by John Christy, in which this honorable professor managed to pretend a correlation between balloon radiosonde and satellite temperature measurements by using data from “US controlled” sondes collected over the CONUS.
I compared his data with that of the average of the 127 US located IGRA radiosondes (Christy’s list is a subset of):
http://fs5.directupload.net/images/161222/e9eoqmwx.jpg
You certainly will imagine how the difference with a world average of all 1500 IGRA network looks like.
*
Let me conclude with this: I contacted a Munich Re consultant in Paris with a hint on your reply to my comment. You can’t imagine her reaction as a professional person in that domain.
Unfortunately, the lady isn’t allowed to reply here with a graph showing just that reality you managed to hide just like did Mr Pielke Jr. years ago.
Namely… that of the world in 2016.
But she gave me two links in her mail instead:
https://www.munichre.com/site/corporate/get/documents_E-1743087426/mr/assetpool.shared/Documents/0_Corporate%20Website/1_The%20Group/Focus/Climate%20Change/munich-re-climate-change-conference-bonn-2015.pdf
https://www.munichre.com/site/corporate/get/documents_E-474929177/mr/downloads/documents/amrae2016/Climate-change-on-the-rocks.pdf
Please search for valuable information, Javier, instead of replicating stuff out of concern! It may be an experience.
Bindidon,
I would be really naive if I were trusting you and your shadowy insider in the insurance business when all you provide are two links to two propaganda pamphlets that are completely devoid of any factual evidence.
There are many big companies paying lip service to the dominant hypothesis, and in the case of Munich Re they have a conflict of interest as they would like people to insure against climate change even (or more so) if they actually believe that is not going to be a problem.
I’ll stick with Roger Pielke Jr., that has provided data that can be verified and has published scientific articles on the issue.
Perfect, Javier: so we both keep on our side.
I can’t convince you nor will you ever do with such arguments.
That’s something I can live with… especially when I consider Kathrin’s degree of scientific qualification.
Good night (1 am here)
Can’t you get it into your head, Nick, that a “global average” is physically meaningless?
“physically meaningless?”
I don’t think so. But I’m not alone in that. This post wouldn’t make much sense without it. It is the subject of Figs 3,4,7. And you may find it the subject of many posts at WUWT.
Jeff,
I have to agree with Nick that averages are significant (with some caveats).
Global averages can tell us a lot, but hemispheric averages can tell us even more, but in all cases, the average is only significant when accumulated over a whole number of years. However, an average temperature is somewhat misleading since emissions (energy) and not temperature is both what the system conserves and what is physically being averaged and the average temperature is that which corresponds to average emissions as an ideal BB emitter and not the average of temperature which assumes temperature linearity.
For example, consider a planet half of which is 253K (-20C) and the other half is 313K (40C), the average temperature would be 283K (10C), but the average emissions are the average of 232 W/m^2 @ 253K and 544 W/m^2 @ 313K for a combined average of 388 W/m^2 corresponding to an average temperature of 287K (4C warmer than the ‘temperature’ average). This non linearity between temperature and energy is something that consensus climate science seems to deny by saying its approximately linear, but as can see, even across the nominal range seen in the mid latitudes, the assumption of approximate linearity is not even approximately true and in magnitude exceeds the effect claimed to arise by doubling CO2
A made up “global average” is still a made up number and given we still cannot “measure” a global temperature, an “average” is still made up and thus meaningless. Like a NOAA global average made up from the 1850’s.
Jeff Alberts on December 20, 2016 at 10:23 pm
The simplest answer here is to ask you why you can’t get into your head the simple, trivial fact that climate isn’t solely physics. It is data used by many people. Data which to process is a highly complex task.
Why, do you think, does Roy Spencer compute for all interested people, out of a 2.5° world wide grid, a set of various zonal and regional averages (the global one being, in that set, more a hint than the hit)?
Your problem, Jeff Alberts, is imho that you see global everywhere, and think, the whole discussion is reduced to that keyword.
“climate isn’t solely physics”
Thinking that this is true is precisely the problem and why climate science is so broken. This makes it too easy to implicitly deny the constraints of basic physical laws and is the only reason why 3.7 W/m^2 of forcing from CO2 is claimed to increase the surface emissions by 16.4 W/m^2 corresponding to a 3C increase. Anyone with a modicum of common sense and an understanding of Conservation of Energy should recognize that no amount of feedback can provide this much ‘amplification’ without an external source of energy powering the gain (as Bode requires). And no, the Sun is not both the stimulus and implicit power supply of the pedantic feedback model, for it it was, the output power can never exceed the input power.
co2isnotevil on December 21, 2016 at 4:04 pm
Thinking that this is true is precisely the problem and why climate science is so broken.
I’m speaking here about averaging of temperature time series: and about nothing else!
How can I manage to get you stopped boring me with your stoopid, simple-minded CO2 blah blah? There are so many people, skeptic or not, who know at least 1,000 times more than you about that!
Bindidon,
“How can I manage to get you stopped boring me with your stoopid, simple-minded CO2 blah blah? There are so many people, skeptic or not, who know at least 1,000 times more than you about that!”
Really, is this all you can muster, silly insults?
It seems that you are unprepared to discuss the the science and all you want to do is insult people who disagree with you while demonstrating your ignorance of basic scientific principles. I suggest you go learn COE and the basic physics of matter radiating photons consequential to its temperature (so you can understand why the stated sensitivity is so absurd), the assumptions made by the math describing feedback control systems (so you can understand how wrong Hansen is about positive feedback), quantum mechanics, radiative physics and EM physics (so you can learn how GHG’s actually work) and a little history (so you can understand how the conflict of interest at the IPCC arose and why climate science remains so broken).
My point stands that denying the applicability of physical laws as they apply to the climate system is a common theme among those who believe in the broken science and you simply demonstrated this by your statement, the context of which is irrelevant to my argument.
Nobody insults you, co2, and you know that. I’m simply sad of your insisting to answer to every comment with your stoopid CO2 stuff.
And please stop playing teacher here, that’s really superfluous.
Bring your thoughts into paper, publish them somewhere under your real name, and come back here with that real name and the reaction to your thoughts.
Bindidon,
“Bring your thoughts into paper, publish them somewhere under your real name, and come back here with that real name and the reaction to your thoughts.”
Since when does long settled physics quantifying how matter emits photons consequential to its temperature need to be part of ‘peer reviewed climate science’? Unless peer reviewed climate science adheres to these laws in the first place, it has no validity whatsoever and sadly, this is all too often the case. You seem to think that how the SB law applies to radiating matter, how COE must be applied to the climate system and how no amount of feedback can amplify 3.7 W/m^2 of forcing into 16.4 W/m^2 of incremental surface emissions needs papers for support. This just further demonstrates my original point that IPCC climate science does not respect the settled laws of physics and instead pushes pseudo science based on imaginary trends which they claim to be settled, but that’s unambiguously inconsistent with these laws.
There’s a reason for this which is the conflict of interest at the IPCC which needs substantial AGW to justify its existence and if they were to acknowledge the true constraints imposed by the physics in their reports, they would inevitably cease to exist. They go on and add a bunch of excess complexity and obfuscation, reinforced by fear, hoping to bamboozle people into believing in a climate catastrophe unless we stop emitting CO2 as they make it as difficult as possible to peel back the layers and see the actual physics under the hood. It’s an effective strategy and seems to have worked on you and many others. Their hope is to get far enough along so that when the scientific truth inevitably comes to light it will be too late to stop implementing the agenda. You should understand that the fear of CAGW is just a means to an end. I don’t consider this covertly conspiratorial as the UN/IPCC is pretty transparent about what they want and how they want to get there. Unfortunately, too many become blinded by fear and can’t see this evil wrapped in benevolence.
I make no attempt to hide who I am and its always amusing when someone complains that I’m ‘hiding’ or says they figured out my name. I use co2isnotevil because 1) its true and 2) its more unique than my actual name for the purpose of search. That being said, It makes it easier for you to figure out who I am and what I’ve said here and in other places since my name otherwise returns about half a billion search results.
You can also google ‘feedback fubar’ which is an article I wrote that appeared here a while ago. This explains how Hansen got feedback completely wrong and how it has never been fixed since. The bottom line is the feedback model subverted by Hansen (Schlesinger, Roe and others) assumes linearity and the existence of an infinite source of joules to power the gain. Neither of these are valid assumptions for the climate system. The input forcing and output temperature are clearly not linearly related as required and if the solar input forcing was also the implicit power supply, the planet could never produce more output power (surface emissions) than arrives as input power from the Sun and the surface would be 255K.
In my imaginary world do “individual variations substantially cancel out” – it’s this irrational belief which is what keeps you pushing the warmist dogma
Nick, HadCRU is a global average to be sure, but perfectly synchronized. No dampening other than geographic. The reconstructions are seriously dampened because the proxies are not properly aligned due to the inaccuracy of the dating. I like ice cores because they are (if well selected) generally pretty well dated. Tree rings are also if the tree is still alive. Lake sediments and ocean sediments can be, if they are continuous to the present day. But, many of the proxies used have inaccurate time scales and all they do is smear and dampen amplitudes. So, while I agree with your point on single point data versus a global average. I think the time scales of many global proxies are messed up and this greatly reduces global reconstruction amplitudes in the past. If you use GISP at least you see the more of the actual amplitude in Greenland. If you add enough proxies all you have is a straight hockey stick type line and that’s obviously not true. A minimal number and type of proxies are best.
Nick writes: “For heaven’s sake, can’t people get it into their heads that Central Greenland is not global.”
Well, some of us can anyway. Nick, the problem is there aren’t any global paleo records. They just don’t exist. Your approach is to us everything available and average it, with the hope the errors will cancel out, but that (valid statistical method) only works when the same thing is measured using the same techniques many times. Repeated measures reduce measurement error.
If you measure the same table using the same measuring tape 10 times it will give you a pretty accurate idea of teh tables dimensions. Measure it 50 times and the measures will be that much more accurate.
But if you measure two different tables using the same tape, or worse yet different tapes, you’ve just added error to the measure, not removed it. I don’t intend to complicate te concept too much, but just to make sure ther people understand, measuring two different tables from the same manufacturer (using the same tape) won’t give you more accurate measures of either table, but they can be used to tell you something about the manufacturing process used to produce them.
It’s a common misconception that repeated measure reduces error; that’s not at all true. Repeated measure of the same thing using the same instrument may reduce error. Otherwise it only tells you about differences in the instruments.
“Repeated measure of the same thing using the same instrument”
The issue is sampling, not measurement. You measure a lot of different locations on the earth, which deviate from the global trend in different ways, in the expectation that those uncoordinated differences will mostly cancel, leaving the common factor. If you wanted to know whether obesity was increasing, you’d weigh a lot of people. That isn’t to improve on your use of scales. It’s to widen the sample.
Bartleby on December 21, 2016 at 10:06 pm
It’s a common misconception that repeated measure reduces error; that’s not at all true. Repeated measure of the same thing using the same instrument may reduce error. Otherwise it only tells you about differences in the instruments.
Decades ago I was told something like this:
http://www.webassign.net/question_assets/unccolphysmechl1/measurements/manual.html
Thanks Bindidon, and your reference does a better job at describing the differences between errors, accuracy and precision. Even after doing this for decades I don’t use the correct terms in my examples and of course my examples aren’t complete anyway. It’s a much more complicated (and important) subject than most give credit to.
Stokes,
OK, I’ll buy your explanation that “uncoordinated differences will mostly cancel, leaving the common factor.” But why are temperatures reported with more precision than what they were originally measured? Bartleby’s remark is valid. Precision varies with the square root of the number of measurements of the same thing, with the same instrument, and by the same observer. The general rule is that when adding numbers, the sum should have no more figures to the right of the decimal point than the least precise measurement. When multiplying numbers, the product should have no more total significant figures than the multiplicand with the least number of significant figures. Comparing modern thermistor temperatures with old mercury thermometers, and reporting anomalies to a thousandth of a degree is pure fantasy!
Clyde, I’m afraid I have no idea what an “uncoordinated” difference is, much less whether or not it will somehow “cancel”. I can’t agree that summing and averaging will do anything at all to increase accuracy or precision in this example.
Nick writes: “in the expectation that those uncoordinated differences will mostly cancel”
How would they cancel? You’re measuring different things, and in the case of the paleo record, using different instruments (proxies). There’s no way the errors will cancel through summation and averaging. You’ve combining the error of multiple instruments, each of which is unique, with multiple things (spatial locations) each of which is unique, and you have no ideal value to even compare them with. I don’t understand this from either a measurement or sampling perspective.
Your analogy with fat people only works when you use calibrated instruments. That’s not the case in this example. It’s not a sampling problem, it’s a measurement problem.
Bartleby,
“How would they cancel?”
Very simply. You collect a whole lot of proxies. By various means, you calibrate these as local temperature anomalies. Then you form an area-weighted average to create the global or regional reconstruction. In that last averaging, variations cancel.
Nick I’m afraid no amount of hand waving is going to improve this situation; what you’re doing is incorrect. The errors do not cancel in the scenario you’ve describe, they’re in fact amplified.
“All climate change is man made, who do you think fudged those numbers, a polar bear?”
-quote of the week.
+100
Yes. The IPCC and their reports are Man Made!
They and their report have no connection to physical reality outside of their bureaucracy and their minds.
Brazil
The model most like the atmosphere, barring scaling of depth, is a gas loaded Perkins Tube. A Perkins Tube is a type of heat pipe which uses gravity to return condensed working fluid to the hot end.
What bothers me most is that theoretically the increase is due to downward dwelling IR radiation but that would mean that upward dwelling radiation must have increased more. (radiation does not know which way it travels and because of the horizon must have increased more than the downward dwelling radiation). How does this increase the ” heat of the earth”?.
Think of it this way: if you look into a wood, you can only see so far before your view is obscured be trees, and the thicker the trees the lower the distance. Likewise, if you look down from space, and view in the frequencies that interact with CO2, you will find that an increasing level of CO2 means you can “see” less far and so the average height is higher. This is also the average height at which IR leaves the planet.
The question now is what is the average temperature of those CO2 molecules from which the average IR radiation leaves the planet. The answer is given by the average lapse rate of about 6.5C/km. Or 0.65C/100m.
So, if the CO2 level increases so that the average height increases by 100m, the average temperature of the IR leaving the planet will be 0.65C lower. So, to regain equilibrium, the temperature of the earth’s surface as a whole will increase until it is 0.65C higher.
Note: there is absolutely no need to look at radiation at the surface to understand the effect of CO2. And the only reason anyone presents it this way is to “dumb down” the science to drum up political support from dumb politicians who can’t comprehend a more complex model.
Also, note, when I say “average lapse rate” (a concept entirely missing from the “noddy science” explanation you normally see) – this relies on atmospheric circulation and moisture levels which are by no means uniform either geographically or over time.
+ 10…
The IPCC has sponsored a plethora of climate models. The fact that there are so many models is evidence that a lot of guess work has been involved. Only one model can be correct. Before any conclusions can be drawn based on model results the one correct model needs to be identified and the other incorrect models need to be discarded. So all conclusions based on models made by the IPCC have to be rejected because we do not know whether any of the models involved are correct. Their probability estimates that a conclusion is true is nothing but bs.
There is no real evidence in the paleoclimate record that CO2 has any effect on climate. There is evidence that warmer temperatures cause more CO2 to enter the atmosphere and that is because warmer water cannot hold as much CO2 as cooler water. There is no real evidence that the increase in CO2 has contributed to global warming.
Apparently the initial estimates of the Planc warming effect of CO2 are too great by a factor of more than 20 because the fact that doubling the amount of CO2 in our atmosphere will slightly lower the dry lapse rate in the troposphere which is a cooling effect. Then there is the issue of H2O climate feedback which must be negative for the climate to have been stable enough for life to have evolved. H2O is the primary so called greenhouse gas but it is also a major coolant in the Earth’s atmosphere moving heat energy from the Earth’s surfact, which is mostly H2O, to where clouds form via the heat of vaporization. According to energy balance models, more heat energy is moved in this fashion then by both convection and LWIR absorption band radiation combined. The fact that the wet lapse rate is significantly less than the dry lapse rate is additional evidence at to the cooling nature of H2O in the Earth’s atmosphere. If CO2 did affect climate then one would expect that the increase in CO2 over the past 30 years would have caused at least a measureable increase in the dry lapse rate in the troposphere but such has not happened. Based upon how CO2 has affected the dry lapse rate one can conclude the the climate sensivity of CO2 is really zero.
A real greenhouse does not stay warm because of the heat trapping chacteristics of LWIR absorbing gases. A real greenhouse stays warm because the glass decreases cooling by convection. It is a convective greenhouse effect. There is no radiant greenhouse effect in a real greenhouse. The same is true on Earth. From first principals one can derive that because of the pressure gradient and the heat capacity of the atmosphere, the Earth’s surface is 33 degrees C warmer than it would be if there would be without an atmosphere. It is gravity that retards cooling by convection. The Earth’s convective greenhouse effect accounts for all 33 degrees C. There is no room for an additional radiant greenhouse effect. The radiant greenhouse effect upon which the AGW conjecture is based has not been observed on Earth, Venus, nor anywhere in the solar system. Without the radiant greenhouse effect the AGW conjecture pure fiction. An increase in CO2 is suppore to increase a radiant greenhouse effect which has yet to be detected anywhere in the solar system.
In the IPCC’s first report, they published a wide range of possible values for the climate sensivity of CO2. Only one such value can be correct. In their last report the IPCC published the exact same values indicating that after more than two decades of effort the IPCC has learned nothing that would allow them to decrease the range of their guestimates one iota. The IPCC will not admit that the climate sensivity may actually be below the range of values that they have published for fear of losing their funding. They should lose their funding anyway because of a lack of success.
Willhas, whilst you are right that the largest component causing that 33C greenhouse effect is the atmospheric pressure, you are wrong to say that CO2 has no impact.
What you are doing is setting an arbitrary point as the “top of the atmosphere” and working out the lapse rate down to the ground. This is a good first approximation, but a more detailed model requires a calculation of the exact point at which CO2 (on average) emits IR into space. And whilst doubling CO2 has a very small impact on that average height (~100m), due to the lapse rate of ~6.5C/km that small change in CO2 will cause a small change in greenhouse effect. Because it causes a small change in the height which your calculations would consider the “top of the atmosphere”.
But doubling the amount of CO2 in the atmosphere will cause a slight decrease in the dry lapse rate in the troposphere which will tend to wipe out any radiation effect. In terms of heat energy transport, conduction and convection dominates over LWIR absorption band radiation in the troposphere. The effective mean altitude of radiation to space is roughly 17k feet whish is at the mass vs altitude midpoint and is not a function of LWIR absorption properties of so called greenhouse gases.
According to the AGW conjecture. so called greenhouse gases are responsible for the Earth’ s surface being 33 degrees warmer tnen it would be without an atmosphere but that is not so. If such a radiant greenhouse effect actaully existed according the AGW conjecture then the Earth’ s surface should be on average 66 degrees C warmer than it would be without an atmosphere but such is clearly not the case. There is no real evidence that a radiant greenhouse effect actually exists.
Are you considering the atmospheric mixing height and how to reliably estimate its value here?
willhaas on December 20, 2016 at 9:33 pm
That was written pretty good, and even little layman Bindidon managed to understand it.
But if what I read here was right: why don’t you publish it so your ideas might compete with those you consider incorrect, and maybe supersede them in the official debate?
Why are all these willhaas publishing their thoughts under nickname, and above all exclusively on skeptic internet pages?
To tell you the truth, it is my opinion that Mankind’s burning up the world’s very finite supply of fossil fuels is not such a good idea and I would like to add AGW as another reason to conserve but as I have explained above. the AGW conjecture is just too full of holes to defend. Most of what I am relaying here does not originate with me and is not too difficult to find on the Internet. In reading about the AGW conjecture there were too many red flags like the idea that we need not consider the primary so called greenhouse gas because it is somehow controled by CO2. CO2 does not control anything, it is just CO2. The more I read descriptions of AGW the more I kept telling myself that things do not work that way. I have worked too much in the world of computer simulation to have much faith in it. It is not much better that make believe. One can program a computer to provide any result you want but it is all rather meaningless. They have hard coded into their computer simulations that more CO2 causes warming so that is what the results show. It all begs the question and is hence meaningless. Unitl the IPCC narrows their computer models down to just one, we should disregard all of their related results because we have no way of knowing wether the models they are using represent the real world.
I provide comments on many different sites. On some, my connemts get ignored, deleted, or they just call me a lier. It is all a matter of politics.
Then there is the consensus arguement as if consensus establishes scientific fact. If that were true the Ptolomaic model of the universe would be an establsihed fact which we would all have to abide by. In all the science and technology classis I took and taught in, consinsus was never given as a reason to believe. I figure that the “science” must be of really shakey grounds if consensus is provided as a reason to believe.
Even if they could somehow stop our climate from changing by reducing CO2 emmissions, our current climate includes extreme weather events and sea level rise. Plunging the Earth into another ice age will reverse sea level rise at the cost of the establishment of new ice sheets on land. Extreme weather events happened even during the ice ages. In the past,the Earth’s CO2 levels have been more than 10 times what it is today yet no climate tipping point ever happened. Life continued to evolve.
Green house theory relies on the concept that heat is trapped beneath a CO2 layer but cold house theory could be equally as capable of trapping cold air under this layer. I hear of the insulating effects of CO2 but it should apply equally to cold and heat just like insulation (keeps cold in, keeps heat in). Heat is actually harder to trap than cold.
The greenhouse theory is a gross (and I mean gross) simplification of what is actually happening which causes many people to rightly think the theory, and those pushing it, are bs.
CO2 is a greenhouse gas, but it is the emission of IR at the top of the atmosphere, not its absorption at the bottom which is the key to understanding how it affects global temperature.
See:
http://scottishsceptic.co.uk/2015/11/11/the-advanced-greenhouse-theory-implies-100m-rise-in-effective-top-of-atmosphere/
CO2 is not layered in the atmosphere so what they are telling you must be wrong.
If you look at CET which is the best proxy for global temperature for the last 300 years, we find that the late 20th century warming is fairly typical with I think 2 other similar events and warming from 1690 to 1730 which dwarves the recent warming. In other words, we are in a fairly typical period of small-scale climate change.
“The observed global-scale warming since 1951 is large compared to climate model estimates of internal variability on 60-year time scales. The Northern Hemisphere (NH) warming over the same period is far outside the range of any similar length trends in residuals from reconstructions of the past millennium”.
=============================================
Here oz4caster has averaged the Greenland and Antarctic ice core proxies:
Although averaging proxies would be no guarantee of accuracy there is a MWP apparent and the HadCRUT4 record since 1950 is by no means standout, even given it is at a much higher resolution — and that the course of future temperatures may be down (who knows) in which case using the same data smoothing it would disappear.
Chris Hanley on December 20, 2016 at 10:07 pm
1. My first impression is that the Central Greenland plot given as pdf link by Andy May, and visible in the comment
https://wattsupwiththat.com/2016/12/20/detection-and-attribution-of-man-made-climate-change/comment-page-1/#comment-2379690
is of greater interest, simply because Antarctica is a strange atypic corner with highly anticyclic behavior wrt the rest of the Globe. It is warming when the world cools and vice-versa.
2. You made a good point here. But is it so important that the present might vanish when compared with the ancient past? Is it not more important to try to derive the near future out of recent past and present?
Scotitsh Sceptic – I am just being a shit disturber. I understand the greenhouse theory fairly well but there are so many theories that dilute the message of greenhouse theory that I just want to point them out. Here’s another one or two – Things that get warmer radiate faster Things that get warmer cause molecules to get larger and rise to a higher radiation horizon.
How do they separate climate changes due to land use from those due to GHGs?
Well, a trivial answer is that actually, land use primarily means huge deforestation.
There are inbetween satellites informing us about that. E.g. Landsat:
http://earthobservatory.nasa.gov/Features/Deforestation/deforestation_update4.php
I am also, just pointing out that most feedbacks are negative NOT positive.
http://climate4you.com/images/CentralEnglandTempSince1659%20LARGE.gif
University research climate grant and Mann’s daughter for the gentleman, who will precisely attribute all ups and downs prior the 1950. Funny to see the present nosedive. Looks like AMO and NAO cycle go full cold soon.
“…doubling CO2 will increase the downward flux at the surface by about 4 Watts/m2/sec;”
This should read either “4 Watts/m2” or “4 Joules/m2/sec”.
Increased complexity of numerical climate models is beginning to allow for more non-linear behavior, and this phenomenon starts to be recognized by some within the climate science community. However, it will remain difficult to assess to what extent past climate & variability can be properly simulated by numerical climate models. Let alone that it is recognized that such non-linear behaviour seriously hampers attribution.
Catalogue of abrupt shifts in Intergovernmental Panel on Climate Change climate models
http://www.pnas.org/content/112/43/E5777.full
Spontaneous abrupt climate change due to an atmospheric blocking–sea-ice–ocean feedback in an unforced climate model simulation
http://www.pnas.org/content/110/49/19713.abstract
There are many estimates of total solar variability in the peer-reviewed literature, but they chose one that showed it to be quite small (see here for a discussion).
With the exception of Shapiro 2011, the estimates with larger solar variability are all quite old (15-25 years), and smaller variability relatively new (5-10 years) in a field which has been developing in understanding. Even disregarding that we can see on your plots that there is little trend from 1951-2010 in any reconstructions. Prior increase from 1900-1950 would imply some “pipeline” warming but a warming trend greater than IPCC’s 0.2ºC 95% upper bound for natural forced warming would require very high climate sensitivity. Feulner 2011 addressed the implications of the Shapiro reconstruction by incorporating it into a climate model but finds little difference in warming between that and less variable reconstructions for the 1951-2010 period – around 0.1ºC greater, well within 95% uncertainty.
Because the IPCC used the period 1951 to 2010 (59 to 60 years) for their computation of man’s influence they may have assumed that the ocean ~60-year variability was the only “Internal Variability”
The IPCC authors didn’t make any real assumptions about internal variability, which is why their best estimate is zero. Given an unknown direction of internal variability, what matters to the calculation is the potential magnitude of internal variability on 60 year timescales. For that they used climate models cross-checked with variability identified in instrumental and proxy reconstruction observations. The 95% range is then -0.2 to 0.2ºC.
The long term cycles you’ve presented wouldn’t obviously dent this conclusion even assuming they’re a real thing. Attributing nearly all observed variability over the past millennium to this 1000-year cycle indicates a peak to trough difference of about 0.5ºC. 0.5ºC/500yrs = 0.06ºC/60yrs. Given that the hypothesised influence of a 2400-year cycle appears to concur with the 1000-year cycle over the past millennium – both indicating a decline from around 1000CE – that would divide attributed influence of variability between the two. It’s therefore unlikely that their combined influence could be much greater than 0.1ºC between 1951-2010 even assuming these are real secular cycles. To put it another way, if the influence of this 2400-yr cycle were as much as 0.1ºC/60yrs that would imply a peak to trough difference of about 1.5-2ºC, which is simply not even close to observed over the Holocene at global average scale.
By secular I mean separate from solar variability, which I understood these cycles were meant to represent. It would obviously be double-counting to infer a contribution due to a solar variability cycle since that’s already included in natural forcing and shows no trend from 1951-2010.
Detection and attribution is hard (practically impossible). For example, read this paper from Lorenz: http://eaps4.mit.edu/research/Lorenz/Chaos_spontaneous_greenhouse_1991.pdf For such a complex system it’s practically impossible to infer if a change is due of origina sin of man or a simple chaotic change.
Detection and attribution of man-made global warming:
Al Gore detected the money, fame and power to be made in global warming scare. Then he attributed it to scientists by funding their research to produce man-made global warming. Yup it’s man-made. Gore is the man who made a fortune and a career peddling a pseudoscience scam
A brief history of global warming by John Coleman, with special mention of WUWT
Attribution of global warming to human beings is NOT based on any real-world, measured, causal chain of evidence, but rather on so called “proof” that consists entirely of computer-model projections that fail miserably in other respects.
That’s the one-sentence version.
The IPCC assume that all changes in climate forcing since 1750 are man-made! This is stated in Figure TS.6 of the report from WG1 of AR5. The climate models are based on this assumption, ie that there has been no natural climate change since the end of the last Little Ice Age.
This assumption is so obviously incorrect that all their conclusions should be disregarded.
That they then say that there reasonably sure that “at least half of the recent warming is due to mankind” demonstrates that they have completely lost the plot! First they assume only mankind is causing changes in forcing and then they find out the models don’t match reality. How strange!
“The IPCC assume that all changes in climate forcing since 1750 are man-made! This is stated in Figure TS.6 of the report from WG1 of AR5. The climate models are based on this assumption, ie that there has been no natural climate change since the end of the last Little Ice Age.”
Try reading.
“The IPCC assume that all changes in climate forcing since 1750 are man-made”
Not quite but close; forcings are external, so mostly man-made, but include things like solar and volcanoes.
“that there has been no natural climate change “
Quite different. The scientific word for “natural” here is unforced. There is no assumptiion that it doesn’t exist; on the contrary, it is much studied, and is plentiful in climate model output.
I agree with you Nick. As Roy Spencer says: “Climate research … into natural climate fluctuations, since the ocean-atmosphere is a coupled nonlinear dynamical system, capable of producing climate change without any external forcing whatsoever.” AR5 doesn’t say explicitly, although they come close, but I think they only consider ENSO as an unforced natural climate influence. One of the points I’m making is there are other ocean oscillations and/or cycles that may be much longer term and more powerful influencing climate. Think Bray, Eddy, etc.
Nick,
Nope. Both solar and volcanic are forced, yet very natural.
I think forced refers to exogenous to the climate system, while unforced is endogenous.
“Nope. Both solar and volcanic are forced, yet very natural.”
The writer used “natural” to refer to what is “ignored” by the models. Volcanic and solar are clearly among the forcings that they use.
NIck,
Climate science’s use of the term ‘forcing’ is misleading at best. Only an actual source of energy, like the Sun, can force the system. Aerosols from volcanoes, varying reflectivity from ice and snow, changing CO2 levels, etc. are changes to the system that is being forced by solar energy. To a some extent, changes in temperature can modify the system, most of which is considered ‘feedback’, but in a technical sense this is incorrect, at least relative to the Bode definition of feedback. One example of how the system changes is that below 0C, the surface is more reflective than above 0C and this is due to ice, snow and frost. You can say that some amount of change is equivalent to some amount of incremental solar forcing and this is what the 3.7 W/m^2 of forcing consequential to doubling CO2 means. This refers to doubling CO2 as being equivalent to 3.7 W/m^2 of solar forcing applied to the original system and not 3.7 W/m^2 of explicit forcing applied to a modified system which would count the effect twice.
More techno babble to blame mankind for a natural occurance that maybe we have accelerated to a degree, however all this is useless crap if all we ever do is play the blame game. How about some real solutions? We are becoming more advanced technologically everyday. Do we even need a solution, perhaps it’s enough for most just to know and do their part to minimize their footprint and work with the change instead of against it.
CO2 has a limited capacity for IR absorption and doubling CO2 conc from 380 to 760ppm would no affect on global temps
http://spectralcalc.com/info/about.php
If the “science is settled”, why are there a multitude of climate computer models used that give different results? Surely the “scientists” can agree on one model that can hindcast and forecast with 97% accuracy?
If a proof was needed that Andy May can escape off his cyclomania: here it is.
I just finished reading Brendan Godwin’s post, and this here is like the medicine I needed to recover from that incredibly boring stuff.
And the quality of a guest post often enough is reflected (and hence can be measured) by the quality of certain comments it was the origin of.
Good job. Instructive material.
v’