If you think it is colder than you remember last year, your’e right. Winter hasn’t officially started yet, it begins on Wednesday, December 21st. But the numbers tell a cold hard fact: as of 7 a.m. EST this morning, Sunday, Dec. 18, the average temperature across the Lower 48 states of the U.S. is colder than any time all last winter.
As this plot of hourly temperatures shows, the average temperature is 16 degrees. F, which is 4 degrees colder than any time last winter. What’s worse, the coldest part of winter is still six weeks away.

(graphic courtesy of Weatherbell.com with h/t to Dr. Roy Spencer)
I can’t wait for Monday, March 20th, 2017, when spring starts.
UPDATE: Feel like doing something good at Christmastime? Read this
The coldest day of the year in the US is, on average, Jan 26, and the hottest, July 26, I read that somewhere and it stuck.
And of course this is the warmest December ever
It can’t be both (the warmest and the coldest)
I’m 60, ive seen both warmer and colder Decembers. Different years, clearly.
Must be a slow news day.
Have you got any good prices on Spam?
Dollar Tree has 1lb can Spam for, you guessed it….$1.00 !!!!!
Spam spam spam spam spam spam https://www.youtube.com/watch?v=anwy2MPT5RE
Mike MacKenzie, unfortunately, spam not in a can is free. Only the meat can you avoid.
This is what tanks the whole “Climate Change” scam.
Carbon is either warming the planet or cooling it, it can’t do both.
Yeah but you can’t make judgements (in either direction) based on what happens in one location. It’s common knowledge that Earth, and any planet, has long term weather patterns that change over time. The surface area of the US is only 1.93% the surface area of the whole Earth.
Climate vs Weather. There is a massive difference between the two. I am a politically independent person who works in climate science with a very politically diverse group of people under a prominent military contractor answering to retired generals within the NSF. Translated: The US Military is very interested in staying up to speed and getting ahead of this citing the massive displacement of Syrians due to desertification of their breadbasket. Discrediting facts about the climate with weather reports is a devious misinformation campaign that benefits no one. This is literally a matter of national security and if you think our issues with Mexican migrants are bad now, wait until their fields go fallow.
@Politically_Unaffiliated: Are you attributing the failure of the Syrian breadbasket to climate? Good heavens! Pretending that agricultural failure in a very particular war-torn, neglected region is climate change is contradicting your point. The community here is simply reacting to the common MSM attribution of the recent El Nino to CO2 induced climate change. Blaming the plight of the Syrians on CO2 is like blaming the plight of Haitians on CO2 while the citizens of the Dominican Republic (same Island) are doing just fine. If human beings abuse creation, pull up all the plants and neglect their local environment then bad things will happen. If they nurture plants, more CO2 will help nurture them more. Pretty basic biology and physics.
CO2 may not be able to produce cooling but Global Warming does.
Don’t you read the propaganda?
“The US Military is very interested in staying up to speed and getting ahead of this citing the massive displacement of Syrians due to desertification of their breadbasket.”
There is no rule that says a U.S. military member cannot be delusional. Those members of the U.S. military, of any rank, who believe this Syrian exodus crisis is caused by CAGW, should be retired and replaced with rational people.
Politically unaffiliated, if you are honest about what you say you do and the views of whom you say you work for, your entire organization needs to be completely reformed and each and every one of you climate change kooks needs to be fired. If you are so ignorant as to buy into the con job that the Syrian civil war is due to climate, you are clearly lacking in the judgement and intelligence to be given anything more responsible than that of barrista.
Politically,
The armed forces have been ordered to “combat climate change”, so they salute and provide lip service.
The Syrian civil war has zero to do with “climate change”. The refugees are fleeing war and the destruction of their cities and towns, not “climate change”.
Syria is not desertifying. Like the rest of the planet, it is greening thanks to more plant food in the air.
Anthony writes:
And the atmospheric CO2 ppm, as measured atop Mauna Loa, is still in its bi-yearly increasing cycle, just the same as it has done every year during the SH “summertime season” as per the recorded quantities over the past 58 years.
And iffen the CO2 measurements atop Mauna Loa had begun 100 or 130 years ago, the recorded Record would show the same bi-yearly cycling of CO2, Decreasing from NH spring thru summer (May to Sept), …… and increasing from NH fall thru winter( Oct to May).
Even though it is a biological impossibility, …… most people still believe that the microbial decomposition of dead biomass during the cool, cold, frigid, freezing, snowy, icy NH “wintertime” is responsible for the “outgassing” of far, far, FAR greater quantities of CO2 …… than all of the microbial decomposition of dead biomass during the warm, damp, wet, hot NH “summertime”.
The CO2 levels always lag the temperature swings.
Typical religious fervor of the greenies, always identifying the wrong cause and sacrificing the wrong victims. In their desperation they might decide its time to double down and toss another virgin into the volcano.
“The CO2 levels always lag the temperature swings.”
“Yup”, ……. and the bi-yearly atmospheric CO2 ppm levels always lag the temperature swings of the ocean waters in the Southern Hemisphere.
Shortly after the Summer solstice occurs on June 21st, the ocean waters in the SH begin to slowly warm back up as the overhead Sun progresses southward toward its bi-yearly crossing of the Equator on September 21st (Fall or Autumnal equinox). By the time the Fall equinox occurs, the ocean waters in the SH have warmed enough to begin outgassing copious amounts of CO2 into the atmosphere. And of course, as the afore stated progresses, the little dab of ocean waters in the NH begins their wintertime cool-down
The ocean waters in the SH will continue to outgas copious amounts of CO2 into the atmosphere as it continues warming back up as the overhead Sun progresses toward its southern most point of latitude, the Tropic of Capricorn, where it will be on December 21st (Winter solstice).
After the Winter solstice occurs, the overhead Sun will begin its northward journey toward its bi-yearly crossing of the Equator on March 20th (Spring or Vernal equinox) ……. but the “cooling down” of the ocean waters in the SH takes a lot longer than the “warming-up” did, ……. thus the outgassing of CO2 from the SH ocean waters will continue for like 60 days (mid-May) after the Spring equinox. And of course, as the afore stated progresses, the little dab of ocean waters in the NH begins their summertime warm-up.
The “signature” of the SH ocean water’s bi-yearly ingassing/outgassing of CO2 is denoted on the Keeling Curve Graph of 58 years of measurements of the “steady & consistent cycling” of atmospheric CO2 ppm quantities.
“steady & consistent” ……. axial rotating and orbital revolving, to wit:
http://www.almanac.com/sites/default/files/d6/seasonalvariations-edited.jpg
Sam, Earth’s orbit is elliptical. I live in the Northern Hemisphere. Fall and Winter are the short seasons (89 to 90 days and 90 to 91 days respectively so let’s count days 8 or 9 + 31 + 30 + 31 + 31 + 28 + 20 or 21 or about 179 to 181 days out of 365. So an average year (for whatever that’s worth) 180 days of fall/winter and 185 days of spring/summer. Hmm, I wonder if there is a Julian Day calculator that could output a series by year. The leap year adds one day to winter). The vernal equinox for me is either March 20th or the 21st. The Autumnal one is either September the 22nd or the 23rd. September is about 2/3rd summer and 1/3 autumn, approximately (actually the autumnal part of September is generally 8 days, so it is even less than that!). March is 2/3rds winter and 1/3 spring approximately (and since the spring part is usually 10 days, it really is about 1/3).
Anybody need a Plumber? Sorry – not funny! but I thought it might heat you up a bit.
The Nation is getting a taste of what is come – yes, really! In the Science Journal Nature an Astrophysics Theory was recently confirmed via direct observation of the Sun’s activity. This portends three (3) decades of Planet Cooling. This is expected to be in place by 2025 and last until 2055. NO! Not an Ice Age.
What will occur is major changes in weather patterns for Regional Areas and will be subject to abrupt changes. Agriculture production will be in the most danger. Note: The Astrophysicist do not directly address the consequences.
Not to worry. If over 60 most of us will be long gone!
Had record lows in my city the last two mornings (-11 and -6 F),normally seen late December to mid January. The coldest start in December in at least 10 years.
Look at the data manipulations of the leftists at NASA:
One of things we find is that, across the world, record low temperatures typically have happened at a latter date than record highs. If we had actually just gone through a century of runaway warming we’d expect the record highs to have happened very recently, and the lows to have a long time ago. But it’s the opposite!
Like the record for the hottest day ever on the planet was set in 1913. The coldest day? 1983. That should be reversed. In 7 out of the 8 continents the record high … was set before the record low.
NASA can’t fudge the record high / low records. Those records remain the same (unless broken). In a sense the record of high & low temperatures has to be considered more reliable because they cannot be manipulated by the climate leftists.
Steven GoddardTony Heller just did a *great* post today on the brazen data manipulations of our leftist opponents as NASA, with direct links to the different versions of the NASA data:http://realclimatescience.com/2016/12/proof-of-man-made-global-warming/
This paragraph is the heart of his post:
Also, the commenter TA said downthread:
“There are charts from all over the world showing the 1930-1940’s were as hot or hotter than [today]. That is, the charts show this before NOAA/NASA modified them to conform to the CAGW speculation.”
“In 7 out of the 8 continents”
Please explain the identity of the eighth continent.
There has been a lot of very serious global warming on Atlantis. That’s why the unicorns and manticore have gone extinct.
“TallDave (@TallDave7) on December 19, 2016 at 6:27 am
There has been a lot of very serious global warming on Atlantis. That’s why the unicorns and manticore have gone extinct.”
Thank you for the clarification. I seem to have forgotten my Plato.
I meant 7 not 8 continents. The data is right here: http://www.space.com/17816-earth-temperature.html
And my bad, it’s 7 out of 7! In all these continents the record low temperature was set after the record high temperature: North America, South America, Europe, Asia, Africa, Australia, Antarctica.
The state temperature record highs speak for themselves…
https://en.wikipedia.org/wiki/U.S._state_temperature_extremes
It’s a scam.
I have never understood the concept that winter starts on the winter soltice (shortest day). It seems pretty obvious to me that all of December is part of the boreal winter. Likewise, all of December is pretty obviously part of the austral summer.
Thank the Lord for global warming! Think of how bad it could have been without it!
Cor those who believe in global warming research “the cost of building sea walls” . I know it’s dull reading but it explains why politicians are pushing hard for government action. Increasing people’s taxes is a difficult job. But with 100’s of billions in contracts at stake, these people will do whatever it takes to get you vote for it. Please educate yourself about this subject.
You must be from the USA.
Anyway, read this and the next section therein:
https://en.wikipedia.org/wiki/Winter#Meteorological_reckoning
~~~~~~~~~~~~~~~
Others, please if you tell us how cold you are, say approximately where.
I’m in central Washington State. Temp at 1/4 to 2 is: 16°F or about -9°C
…our low was 78F….and our high was 83F
In Tampa it is a beautiful 82F (28C) at 5 pm.
In Appomattox, VA, now 52 F at 1712.
PMK
It’s 20 F right now in Northeastern Oklahoma, with a low this morning of 7 F. Luckily, the wind hasn’t been blowing too hard. Supposed to be about 8 F tomorrow morning, then things are supposed to warm up a little.
My sw Wisconsin dairyfarm in the Uplands near Spring Green will be -9F this evening with wind chill between about -20 or lower. At those temperatures we had to move all the cows off pasture and into two very large feed sheds where we roll down and pin tarp wind screens to ‘seal’ them. The cattle warm the sheds into the +20F range. This is necessary to prevent udder frostbite, which is not a good way to make ice cream. Fortunately we came back to the Fort Lauderdale beach for Christmas, where it is presently 83F and only 3 degrees off the all time high for the day set in 1977. Both the cold in Wisconsin and the heat in Florida today are called weather.
A balmy 8F in central OK at rooster crow this morning. Or was it 9F…. I was busy looking for my beach blanket.
A brisk 15°F as the sun lowers towards setting in west central Colorado. -4°F for the low, +20°F for the high.
I’m in the southern interior of BC (Canada). The high today was -10C (14F) for the first time in a week. Lows have been -17C to -20 C, plus wind chill.
Southwest Missouri this morning low 1 and high 16. Tonight’s low is expected 2 below. Wind chill last night – 13 had 4 inches snow. The Reverend Al Gore from The Church of Climatology is a fraud.
Had a nice afternoon lunch down at the Fishery Restaurant, outside by the water, shorts and t-shirt, comfortable and warm. Fresh grouper with hush puppies and curly fries, mmmmmmmm
Took a short walk along the pier, watched the pelicans diving in for fish (but no pink ones yet), coconut palms swaying in the light breeze. Good thing the Bucs play at 8:30 tonight, might have missed a near perfect afternoon.
In Tasmania we had a beautiful sunny day yersterday, cloud and wind and rain back today, heater on in mu office to start the day. It snowed the other day too above 900 metres or so. Its our summer…..after our wettest year EVER. So much for endless drought and scorched earth as the alarmist would have us live in fear of.
Perhaps a smidge below normal for this time of year, here in norht-central California . . near freezing to low fifties. We have those big rocky mountain thingies blocking most of the really cold air that pours into the middle States and eastward . .
It’s 76f at 2100L. With a high of 83f at noon in Merritt Island, East Central Florida.
Go Bucs.
HA! Hate it for you… In Central Florida, I had to run the AC today! Keep warm, I’ll have an ice cold one for ya!
Sonoma county Ca and as my dad used to say, “It’s colder than a witches tit in an iron bra”
Currently 43f/6c but got down to 25f last night
Its minus 22 here 8:35 pm central time se minnesota. Our high was minus 8 today.
Norfolk, Ne last night’s low was -20f Wind chill was -31f. Right now 10:27 p.m. Central time is 8f.
[Tough night for those army, air force, navy and Marines standing guard duty nearby, and everywhere else across the country! .mod]
There is an old joke about Winnipeg, Manitoba, Canada (famous for extreme wind chill) that “The climate of Winnipeg is 10 months of Winter and 2 months of hard sledding.”
Chilly 24 degrees here, celsius.
Oh . Southern hemisphere.
Min 72F(22C) max 93F(34C)
Hey fool… We get it, it’s all about which hemisphere, which coastline, near coast or inland… I’m a meteorologist. That said I am in New Zealand Fiordland and snowlevel was 900 meters with near zero wind chills at sea level. It’s 2 days till official summer start and 20 days after what locals consider summer start…. Kiwis are freaking out… Don’t buy into any one persons post until satellite data is posted… That’s the true data from surface to stratosphere…. Not just 2m above surface, highly modified
Saturday was 26 and snowing in MA. Fairly typical for us in mid December.
Just had a week of -20 to -25 Celsius. With wind chill at times to -35. Today it is -1Celcius with a strong west wind. For Decaprio fans this is called a CHINOOK.
Dallas: 16 at 0600 local. Not a record, but certainly far below normal.
Minus ten degrees F at 7 AM this morning just north of Chicago, about six miles west of Lake Michigan.
METAR 2016/12/18 2055Z 98.6 F
In South Africa at 26 deg south, 26 deg east, height 1320 metres (4400 feet) max and min of 38 and 20 C (100 and 68 F). Not too scary.
Jer0me. I can’t agree with your statement at all as far as the austral summer is concerned. Despite the summer solstice being in December, this month is still cooler than March every time. Even though the east coast of New Zealand has been having temperatures in the low 30 degrees C, The west coast has been 8 to 10 degrees cooler. This is the Fohn effect, well known in Europe and other places that have a spinal range running tangentally to the prevailing weather.
For us a good summer starts at Christmas, and a bad one sometime in January. Our hottest days are usually at the end of the first week of February, & the coldest are usually in July but can happen anytime from early June to mid August.
Winter starting at the solstice is not a ‘concept,’ it is a fact. If the Earth’s axis wasn’t tilted the way it is we wouldn’t have seasons like we do. We would be more like Jupiter which has very pronounced ‘zones’ with very little mixing as we know it on Earth.
Astronomical winter starts on the solstice. Meteorological winter starts on December 1st, and many records maintained by the US NWS are based on that.
You’ll often see the seasons abbreviated as DJF, MAM, JJA, and SON.
OTOH, here in New England, we’ve sometimes had the biggest snow storm of the snow season in October, and we’ve had crippling snow storms in May.
Ian & Ric, astronomical winter is more complex that that and does not necessarily start at the winter solstice. In many European countries for example the solstice is considered mid winter as day length increases from that point, even though temperatures will continue to fall.
In Mass, May 17th, 1977 all the tress had their leaves and we got 12″ of cement snow. It was years before the trees recovered from the damage. Then the day of Halloween 2013 or 14 we got another foot of cement snow, the power was out for ten days. Thank god for natural gas fired steam heat.
“OTOH, here in New England, we’ve sometimes had the biggest snow storm of the snow season in October, and we’ve had crippling snow storms in May.”
I’m a 56 year old New Englander. I’ve NEVER seen a season when the biggest snow storm of the snow season was in October, nor have I seen a single “crippling snow” storm in May.
http://forums.accuweather.com/index.php?showtopic=29630
This Day In History. 30 Years Ago Today. A rare 300 year type event, like the October snow.
NY Times Headline..
The Last Hurrah of a Feisty Winter Brings the Latest Spring Snow Ever.
The winter of 1976-77 was an exceptionally cold one in the central and eastern U.S., during which snowflakes were seen in metro Miami
The latest spring snowstorm ever recorded in the New York metropolitan region blustered over much of the Northeast…closing schools, snarling traffic and cloaking newly plowed fields and the delicate blossoms of May in a harsh reprise of winter.
In New York City, snow fell briefly in midmorning and in the early afternoon as a day of intermittent rain, sleet and hail passed drearily. The snow on May 9 was the latest record in any spring since record-keeping begain in 1869. The previous record for the latest spring snow was May 4 set in 1946. And that was just sleet.
May 9, 1977 — A late season snowstorm hit parts of Pennsylvania, New York State, and southern and central New England. Heavier snowfall totals included 27 inches at Slide Mountain New York and 20 inches at Norfolk, Connecticut. At Boston it was the first May snow in 107 years of records. The heavy wet snow caused extensive damage to trees and power lines. The homes of half a million people were without power following the storm.
Snowfall Amounts included:
Norfolk: 20″
Hartford: 1.3″ (all on 5/9)
Worcester: 12.7″ (11.4″ on 5/9; 1.3″ on 5/10)
Boston: 0.5″ (Trace on 5/9; 0.5″ on 5/10)
New York City: Trace (all on 5/9)
Newark: Trace (all on 5/9)
Providence: 7.0″ (6.7″ on 5/9; 0.3″ on 5/10)
I think seasons are some what arbitrary. That each season is exactly 1/4 of the 365.25 day year or must begin on the first day of a month or an astronomical turning point is a convention with no real attachment to reality. The reality is fuzzy. The first and last frost vary greatly from year to year. Often all you can readily get is monthly data.
That’s why there is a Farmer’s Almanac—don’t you know!! (sarc) (sarc)
Sunday evening at the outdoor Carol concert in North Central, Victoria, Australia we were perishing cold. We are more usually assailed by multitudinous flies and heat! I think the forecast is for hot days around Christmas.
Even in California, it’s hard to imagine Santa in shorts!! 😉 Christmas carols must sound pretty silly to you guys.
You are correct. Meteorologists use the entire months of Dec, Jan, Feb as Winter which does make alot more sense that using the astronomical dates of the 21st.
In northern Minnesota, and North Dakota it more like November, December, January, February and March. All of those months can have temperatures of -20 or lower. In fact, Itasca Minnesota has had days -30 or lower in those months.
December 1st. is the official start of the Meteorological Winter according to the NWS and Environment Canada.
The current calendar, including the seasons was established by Pope Gregory XIII, a few centuries back. Popes don’t have a strong record when it comes to science, like the one who said Galileo was wrong about the earth orbiting the sun, or the current one who is wrong about catastrophic anthropogenic global warming.
Gregory did improve a few things with the calendar. There is a phase shift between temperature and daylight, with temperature lagging daylight by about a month, depending on your location. The Gregorian calendar has it lagging by 46 days. That’s not bad science, for a pope. If I were pope (for a day) I would specify four month winter and summer seasons, centered around the one month phase lag. The remaining four months would split between two month “change” periods of spring and fall.
High latitude summers are only about 40 days before winter returns.
Gregory didn’t give a hoot about the seasons. He was trying to get Easter back in sync with Passover.
The Gregorian shift was because of the precession of the equinox. The ecliptic rotates 30 degrees every about 2150 years, and if you don’t allow for this the equinox and solstice dates get out of synch with your calendar.
Due to the rise of Christian ignorance, which triumphed over Roman, Greek, Judaean and Gnostic wisdom, they forgot all about the precession of the equinox for nearly a thousand years (since 650 AD). And so it became apparent in the time of Gregory (1580s) that the calendar was completely wrong, and out of synch with the seasons, and had to be shifted by 13 days (or 13 degrees).
This is like modern astrology, which is out of date by about 1800 years (cannot be bothered to work out an exact figure). Again, it has not been updated with precession since the beginning of the Christian era. And so if you follow modern astrology, you will be following the wrong sign of the zodiac.
Ralph
@ralfellis
Sorry, you can’t blame that clunker on the “ignorant Christians”. Until that time, everyone in the Christian world followed the Julian calendar. You know, as in Julius Caesar, the Roman dude.
The Gregorian calendar was created by *astronomers*, principally Clavius.
When you sneer at “not bad science, for a pope”, you are sneering at work done by one of the foremost scientists of the day, NOT the pope.
PS: The Gregorian calendar has nothing to say about the seasons per se. European explorers had got to South Africa in the previous century. The mathematicians and astronomers who worked on the Gregorian calendar knew perfectly well that the seasons start at different times in different places and that the world has two hemispheres.
@ralfellis: The precession of the equinoxes was never forgotten. It was described in Ptolemy’s Almagest, which was the standard astronomical textbook of the Middle Ages. Europe didn’t need a new calendar because they had *forgotten* Roman wisdom, but because they hadn’t: they were still using the Julian calendar of Rome.
Please, people, this is supposed to be a SCEPTICAL site, where we are interested in what is TRUE about climate (and other things), not about airing our pet prejudices and our own ignorance. Everyone who spouts easily refuted rubbish about the past undermines the credibility of our claim to be interested in truth.
I’ve read a fair few ancient Gnostic works (in translation) and it’s news to me that they had any calendrical or astronomical wisdom whatsoever not shared by the cultures of their time. I’d like to see a reference for this claim.
By the average temps in my area, winter = Dec, Jan, Feb. Hard winter, with the lowest averages and records, = Jan 1 – Feb 10.
Um…That’s the definition relative to orbital mechanics. Really the heat and cold or summer and winter are artifacts of the definition. We associate the cooling/warming of the hemispheres as calendar driven, but the calendar was created from the orbital positions of the earth an its axial tilt relative to the plane of the ecliptic.
Winter is a time of year like 6:00 PM is a time of day. We associate cold in the winter because winters in the northern hemisphere are cold. Winter = Cold but Cold ≠ Winter.
BTW When its winter in the northern hemisphere its summer in the southern hemisphere. If it begins warming more quickly in the southern hemisphere due to local weather does their summer start before the north’s winter? This year it seems as though you would have the winter starting sooner in the north than summer can arrive in the south.
Definitions needs to remain as baseline anchors.
It is an astronomical thing and our calendar is based on it. The solstices happen at fixed points based on the elliptical orbit and the rotation axis’s tilt. Changing the amount of the tilt does not change the two fixed points. (Yes the orbit is actually a toroidal ellipsoid as it is perturbed by other astronomical bodies whose gravitational accelerations apply torques to the main orbit around the solar barycenter and the Earth-moon barycenter. Meteorological seasons start at the beginnings of the respective months. Local conditions don’t have to follow the calendar nor our meteorological conventions.
*as long as the tilt is greater than zero and does not cross zero, I should add.
The all time record ambient temperature for the little spot on the globe I now live on was -22 F set in January of 1994.
I’ve lived before where the temp was lower.
I don’t want to go through that again. (These older bones seem to feel it more.)
Is it too late to fire those coal plants Obama shut down?
Not sure if I should end this with a 😎 or a 8-(.
TYPO!
“record ambient temperature”
Should be:
“record low ambient temperature
Record low -16F (-12F 1983) I hope this winter is nothing like 1983.
The other day it was -35F degrees at Dunkirk just east of Shelby Montana. The F in this case is short for effing.
One morning back in 76 or 77, i came off a mid night shift as an air traffic controller and the reported temp was minus 34 with a wind chill of minus 71. My car door wouldnt close. We have block heaters on our cars in minny and i had mine plugged in to an outlet. Needed the cord to tie the doors closed. Scary . Your car breaks down in the boonies with that kind of cold your in serious dodo. No cell pho es back then either.
On the other hand it was 5 degrees on Fri and my neighbor was ice fishing. Nuts huh!
Catch and release? ; )
I believe I was returning from winter camping in the Boundary Waters then.
We’d had fun dog sledding at -10F, but temps were crashing as we left Ely.
It was -50! The rental car wouldn’t start and we had to be towed to Duluth.
Extraterrestrial cold.
Living in Minnesota and you didn’t spray WD-40 into your door mechanisms as part of the winterization? Bet you won’t make that mistake again.
“Serious dodo” = personal extinction?
Given political theater, this looks as if it is not a good year to push a evil global warming theme.
But, but AP’s Seth Borenstein wrote a column that was printed in newspapers around the country that last year represented the “new normal.” The new normal sure didn’t last long. Talk about fake news.
Mohatd
In AP’s circle – that was real!
Maybe not news, I grant you.
And wildly off for much of the whimsically called ‘fly-over’ states.
But, hey – when is Brown-tonguing the Bosses a Bad move for Borensteins?
Auto amazing appalled at awful alliteration.
Ha ha ha ha ha ha ha ha! The new normal! Over at NOAA’s Climate at a Glance if you plot a trend for maximum summer temperatures (June through September) there’s a downward trend for 20 of the lower 48 states going back to the 19th century, nearly all of it in the Mississippi and Ohio river valleys. Conversely winter maximums have trended up. As such if there really is any change, the new normal is a milder climate.
Our low Friday was -4°F, the first time that we (Boothbay, Maine) have had below zero temperatures in December since 2013.
John
Wow.
Three years.
Might this have some relation to weather?
Or was your comment encapsulating that? As I expect.
Auto.
Got to watch that global warming…
Many have written on here that the r e a l killer is cold.
This emphasises those many [thousands?] of comments.
Of course it is [directly, I know].
We in the UK ‘usually’ get what the US ‘has’ – about 4-6 weeks later.
I think I will try to spend January under about four quilts!
Maybe February, too . . . .
Auto
We also normally get this cold 4 to 6 weeks from now. Southern New England and England generally track one another.
I was in Ft. Lauderdale in middle school when an announcement was made over the intercom. Everyone go outside it is snowing! This was Plantation Middle school around 1975 or 6. The snow would melt in the air from the heat of your hand.
Mac
Macusn, I was in my junior year at Deerfield Beach High School. It was around Easter of 76, if my memory serves me (not always the best barometer). Me and my brother were walking to school and it started snowing – we were, like, “what the f…?” I seem to remember it devastated the Fla orange crop. Like you say, the snow melted instantaneously but it was a big deal.
Right now I’m in the south of Spain, there have been several strong winter storms already (flash floods across Malaga, Valencia and other provinces) and the temperatures are pretty low for autumn-winter.
The Guardian is saying that the low temperatures are due to high arctic temps melting the arctic ice, driving the jet steam south and causing a negative NAO. It also says 50,000 people died as a result of a record heatwave in Russia this summer. If so I don’t remember seeing that figure reported before.
Whoops. Just re-read the Guardian article. Says 50,000 died from Russian heatwave in 2010. Apologies for the error. Still seems a high figure though.
I remember snow flurries in the deep South on May 1st one year. It was evaporative cooling that caused the snow. I was in elementary school, so that was the 60s, either 1966 or 67. I remember walking to school (high) in 1974, in late May, the week before Memorial Day, with the morning low in the 30s F. No frost or freeze, but the wind was something else. Still, it never got to single digits or even below zero. That happened in the 80s and later.
While I am delighted to see the alarmists hoist on their own petard, I really wish it were getting warmer! I’ve lived through the warm and cool periods since the middle of the 20th C and I have had about enough of the cold ones. I remember being in south Florida when Tampa got 4 inches of snow and we got down to 28-29 in Ft. Lauderdale! It hurts to see the orange groves glittering with their coating of ice to try and save the crop from destruction, that happened in the late 80s.
PMK
“.. Think I might go work Orlando, If them orange groves don’t freeze ..” – Tom Petty
October was an unusually cold month
Casper Wyoming had a record setting -33F (-36C) on December 8th. We’re up to a balmy 15F (9C) with 23 mph wind. December 17 and 18 were way below zero again, but not record setting.
Reality, a balmy 15F is that not -9C?
It’s SO cold even the sunspots are staying in today:
http://www.spaceweather.com/images2016/18dec16/hmi200.gif
And it’s not even the Solstice.
Auto – absolutely astonished at the acceptance of adverse alliteration in all anti-media.
Auto, minor correction, what you are doing is called assonance not alliteration. 😉
Exactly! That’s WHY its cold. There is a very strong relationship between sunspot activity and average global temps.
LOL!
I see a Greyhound… No spots.
Broke the low record for Wichita (-7F) (-4F 1983) Topped out at 32F below average.
Cold SSTs are persisting worldwide including in the North Atlantic and North Pacific. Not to mention the Southern Ocean around Antarctica – that goes without saying. These could influence the NH winter.
http://weather.unisys.com/surface/sst_anom.gif
The above SST map is for October, you have to click it for the present, then see how much bluer it is!!!
Gary I just did that, what a difference and were is all this cold water coming from? It does not look promising for Jan through to April. We have had snow on the ground for 2 weeks and lows of -15C next to our large lake but at the Airport about 6 miles away from the lake it got as low as -24C. But it is warming up together with the usual heavy snowfall.
Slick through to see the current one.
So what – it’s the global average that matters, and that’s what we’d be saying if the U.S was unusually hot at the moment, wouldn’t we?
A global ‘average’ temperature is, by definition, almost required to be wrong at any given moment in time.
It is nothing more than a trend line.
Very much like the average world telephone number.
The global average temperature is about as meaningful as the global average human. No one lives there and no one as met one.
I live in Campbell River on Vancouver Island, our climate is very much like back home in southern England. Frosty mornings….lots of rain, not much snow. Last week-end we had two feet of snow dumped on us in two days, since then we have had records broken for minus temps overnight (-14 one night) and minus temps during the day and now the snow is frozen solid, today more snow. So unprepared is the city, used to a much milder climate, that it was days before all the roads were safe to use. This is unprecedented for this part of BC…….go figure!
Dear Jane,
you’ll be comforted to know that back here in good old Blighty (Kent) we have been blessed (again) with balmy (or should that be Barmy) weather recently. Days of 10 – 15 degrees Centigrade and evenings no lower than 5 degrees Centigrade. But thank’s for the head’s up, as is pointed out elsewhere on this thread, we usually get US extreme weather 4 – 6 weeks later.
Fortunately, it’s what we sceptics refer to as ‘weather’. I know, I know, a radical statement in our world of climate alarmism, but there we go.
Merry Christmas from a not so Dickensian era (I live in a cottage with bullseye windows and have never seen snow on them at Christmas, really disappointing. I have been here for 30 years!)
HoHoHo…….7 more sleeps 🙂
23.20 GMT
https://earth.nullschool.net/#current/wind/isobaric/1000hPa/overlay=temp/orthographic=359.00,66.25,271/loc=-1.508,51.389
Green = +0°C
Blue = 0 to -9°C
Lt Blue= -10 to -29°C
Pink = -30 to -60°C
Merry Christmas back to you……miss my homeland at this time of the year. Maybe you will get a white Christmas this year!
Perhaps unprecedented in recent times. When George Vancouver explored the region, he found a glacier coming out of the mouth of what is now Glacier bay.
This cold os Russian propaganda via Siberia, climate interence feom Putin. US Congress should waste some more time investigating this.
Russians hacked USHCN on Putin orders. Planned to favor Trump who is skeptical of CAGW and influence election faking polar vortex. Caused Hillary to lose (Podesta has assured us yet again today), because voters KNOW weather forecasts are accurate 6 weeks in advance, just like Climate models are accurate a century in advance. IPCC said so; must be true.
Russians have set up a huge line of diesel powered fans across northern Russia to blow their own cold air across the North Pole and into the US.
They hack our computers.
They send us their cold air.
This means war !
Evidence that the 1930s were hotter worldwide than today:
First, realize this:
In 1999 NASA’s James Hansen agreed: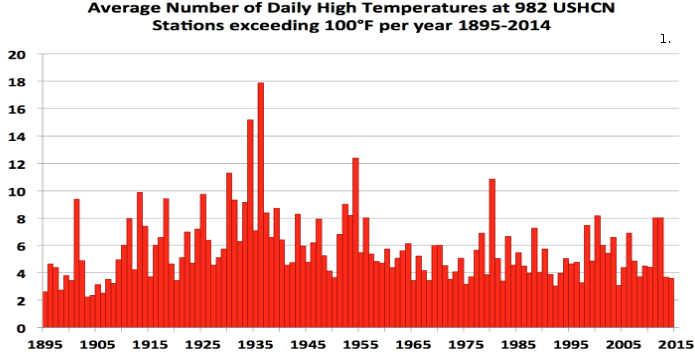
“It is clear that [in the USA] 1998 did not match the record warmth of 1934.”
In 1978 the N.A.S. showed the Northern Hemisphere to be hotter:
http://realclimatescience.com/wp-content/uploads/2016/01/Screenshot-2016-01-31-at-05.15.34-AM.png
The Northern Hemisphere makes up 64% of the earth’s land.
Plus, the Southern Hemisphere was particularly sparse at the time as far as thermometer placement.
And the USA in particular had the most extensive reliable set of ground thermometers compared to the rest of the world. So, the temperatures in the rest of the world were probably, in the 1930s, more like the USA and the Northern Hemisphere.
A final point, two days ago Judith Curry reported that the USA had much more hot days then today:
“And the USA in particular had the most extensive reliable set of ground thermometers compared to the rest of the world. So, the temperatures in the rest of the world were probably, in the 1930s, more like the USA and the Northern Hemisphere.”
There are charts from all over the world showing the 1930-1940’s were as hot or hotter than any subsequent year. That is, the charts show this before NOAA/NASA modified them to conform to the CAGW speculation.
I guess I ought to get a list of those charts together and post them.
You always get the argument from the alarmists that the 1930’s heat was limited to the U.S. and was not global, but that is clearly not true when you look at unadjusted charts from around the world.
And to top that off, as far as proving the high temperatures of the 1930’s-1940, were worldwide, we have the Climategate scandal emails that describe how the Climate Change Gurus entered into an international conspiracy to get rid of the 1940 GLOBAL “heat blip”, which confirms that this heat was worldwide and not restricted only to the U.S.
They wouldn’t have had to enter into an international conspir@cy if it were only the U.S. that was extra hot during the 1930’s. If that were the case, they could just make the same argument they make today: That it was restricted to the U.S. But they didn’t make that argument did they. Instead they went to all the trouble of changing every temperature record on the globe to delete the hot 1930-1940 record.
Now, they pretend the Hockeystick chart is the best representation of the global temperature record. The Hockeystick chart was created to order for the purpose of promoting CAGW. It’s the only visual they can show to bolster their case, and its information is completely bogus.
Considering the damage this lie has done to the entire Earth, someone, or a lot of someones, ought to be prosecuted and punished.
Here are some charts demonstrating that the exceptionally hot 1930-1940 period in the U.S. was not the only place in the world with similar temperatures. I have some charts from South Africa, too, but I can’t find them right now. They have the same temperature profile as the ones below, meaning the 1930-1940 era is as hot or hotter than subsequent years. I think you can see that high temperatures were not restricted to just the U.S. during this time period. This was a global heatwave.


Here’s Greenland
Iceland
http://realclimatescience.com/wp-content/uploads/2016/04/Reykjavik2011-2016.gif
http://realclimatescience.com/wp-content/uploads/2016/11/Screen-Shot-2016-11-20-at-10.28.02-PM.png
http://realclimatescience.com/wp-content/uploads/2016/11/Screen-Shot-2016-11-20-at-10.26.56-PM.png
http://realclimatescience.com/wp-content/uploads/2016/05/Vestmannaeyja-2011-2016.gif
England
Australia (Cairns)
Congo
http://realclimatescience.com/wp-content/uploads/2016/09/Screen-Shot-2016-09-23-at-5.53.54-AM.gif
http://realclimatescience.com/wp-content/uploads/2016/09/Screen-Shot-2016-09-23-2-at-5.53.54-AM.gif
http://realclimatescience.com/wp-content/uploads/2016/09/Screen-Shot-2016-09-23-3-at-5.53.54-AM.gif
Here’s a global graph made by prominent skeptics Jeff Condon (who has submitted articles at this blog) and Roman M. They believe their method to be superior to the institutes’.
If that doesn’t display you can view at the following link, as well as their NH as SH temperature chart.
https://noconsensus.wordpress.com/2010/03/24/thermal-hammer/
According to their methods, Recent temps were warmer globally than 1930s.
@barry
I am sure we had this conversation before
it is simply impossible to compare ‘global’ T of before the 1950’s with global T after the 70’s
1) I challenge you to show me a certificate of re-calibration of a thermometer before 1948? How could global T possibly be the same if re-calibration of thermometers was only stipulated as from the 1950’s?
2) before the 50’s we had 4 or 6 visual observations of T a day by somebody who had to be present – However, who was present 24 hours a day? really? globally? you are kidding me…
3) since the 50’s and 60’s we had wind up recorders that would go around and measure T and humidity on a daily recorder sheet, but now, what to do if the ink ran dry? And do you honestly think that anyone in those days really worried if calibration on those recorders was out by more than 1K? I think there were quite a number of days when it was simply forgotten to change the sheet or wind up the clock….
4) since the 70’s we have thermo couples that get calibrated to a tenth of a degree K every year and the computer makes a measurement every second and prints the average for the day + max and min. No dependency on anyone… everything completely automatic….
Barry, please give me your own input / data that would make you trust the graph that you favour.
I am willing to concede that due to some movement of earth’s inner core there has been more warming in the Nh then here in the Sh. Like I told you before, here where I live there has been no ‘warming’ whatsoever and last when I checked it was the same where you live in Australia. So, in any case, there is no “global” warming…..
Hello Henry.
So your answer to the people commenting that the 30s globally were possibly warmer than current is that they cannot know because the data is unreliable.
I should like to see all US December (or Winter) data for the period you think data is valid, and find out if this December is unusually cold. I read that last Winter in the US was the warmest in the instrumental record. This includes post-1950. So a cold moment this December doesn’t seem to be such a big deal, then, does it? Not after a record-breaker….
As to the chart – I refer to it because it is made by skeptics using RAW data. You should check out their work.
Outstanding work, TL!
If we establish beyond any reasonable doubt that the 1930s were hotter than today then it will make a mockery of the entire global warming thesis.
If the 1930s were hotter than today the whole AGW scam is an absolute joke.
One thing is clear: if the 1930s with all its record high temperatures were not hotter than today, then they were almost has hot. There’s no crisis here.
In fact there’s no climate problem at all. If it ain’t broke don’t fix it. These climate leftists have been spending what amounts to trillions of $$ … in an effort to restrict our quality of lives and surrender our freedoms to a leftist UN global governance. That’s their hidden goal because they also know the climate’s not broken. I hope Trump breaks this scam wide open. We have to accept nothing less.
“If we establish beyond any reasonable doubt that the 1930s were hotter than today then it will make a mockery of the entire global warming thesis.”
That’s what I’m thinking, too. No more of that “hotter and hotter” BS (Bad Science). You can’t do “hotter and hotter” when we are in a temperature downtrend from the 1930’s to the present day, like a REAL surface temperature chart would show.
Eric Simpson
this is not true and even if in some part of the world it was warmer back then, so what? Globally we are far warmer now.
Scam. Simon, you need to get out more.
Simon, as much as makes you FEEEEEL good about yourselfth to be “vitally concerned” about globull warming if you actually took the time to do even cursory research into it you’d find REALLY quickly how totally FALSE and inaccurate/adjusted/fudged the “data” is. and if you also researched how CO2 is affected by the sun and ocean temperatures AGAIN you’d stop bleating the sky is falling we need MORE taxes to save us. the ocean is by FAR the largest CO2 repository/sink. CO2 is released when the ocean warms NOT the other way around and HINT the “warming” cycle started over 800 YEARS AGO. you know, before there WERE any bad man made machines and bad oil usage.
So what?
If you go even further back, in Mark Twain’s ‘Life on the Mississippi’, where he documented a journey he made down the Mississippi in the 1880’s, he mentions Natchez as being the northernmost location where oranges can be grown outside without protection and that oranges were commonly seen growing from that point on South. Today you can only grow oranges south of New Orleans. In ‘Escape of General Breckenridge’ by John Taylor Wood, where he documented the escape of General Breckenridge, the Confederate secretary of state from Union forces at the end of the Civil War. As they made their way down Florida to Cuba, he mentions harvesting coconuts at abandoned homesteads on Merritt Island. Today you have to go south to Jupiter Inlet to find coconuts. Searching classic literature for mentions of where cold sensitive crops are found growing is another way to research past climate.
“Searching classic literature for mentions of where cold sensitive crops are found growing is another way to research past climate.”
Very Good comment. There are lots of historical records that could apply to the climate that have not been researched very much in the past.
I know that all railroads in all countries record the temperature and general weather conditions every day and have been doing so back to the 1800’s. I worked for a railroad at one time, and we recorded the temperatures four times a day and every station up and down the line would do the same and report the numbers to the central dispatcher’s office where it would be written on the trainsheet.
I have no idea if any of this data is still available, but it was available at one time. Trainsheets are what you need to look for (if you are so inclined). They list all the trains that were run that particular day, and various other items of information, including the weather conditions and temperatures of all stations within the dispatcher’s operating area.
Another valuable resource is old newspaper clippings of weather conditions and temperatures which are still out there undefiled by NOAA and NASA. They can’t erase/change that data. It’s there to be had and is as accurate as anything available.
“The Northern Hemisphere makes up 64% of the earth’s land.”
And the USA makes up ~2% of the Globe.
“And the USA in particular had the most extensive reliable set of ground thermometers compared to the rest of the world. So, the temperatures in the rest of the world were probably, in the 1930s, more like the USA and the Northern Hemisphere.”
I’m happy with that degree of agreement, Simon. 🙂
That’s what I always assumed, that the U.S. temp would be representative of the rest of the NH, because the atmosphere *does* circulate, and when you consider that the 1930’s was exceptionally hot, and the exceptional heat lasted the entire decade, I don’t see how in the world that heat would not spread around at least the NH and probably the entire globe.
We’ll agree to agree on that one.
“This is what the TOBS adjustment did to remove that warm bias.
Would you advocate they go back to that?”
I would advocate transparent, documented, reproducible changes to the temperature record.
Simon, just because some adjustments are needed doesn’t mean all the adjustments that have been done were necessary or correct.
Eric, TA:

“The Northern Hemisphere makes up 64% of the earth’s land.”
And the USA makes up ~2% of the Globe.
“And the USA in particular had the most extensive reliable set of ground thermometers compared to the rest of the world. So, the temperatures in the rest of the world were probably, in the 1930s, more like the USA and the Northern Hemisphere.”
The thermos may have been reliable, but the observers weren’t.
And no you cannot make that magical self convenient jump……
Now, let’s see if I can think of a simple way to observationally skew temperature recordings… would that be to take the max temp (and reset the thermo) in the early evening. That way it would ensure that should the next day be cooler, then the max temp at the time the thermos was reset would be recorded as the maximum for that day too!
Splendid – that’ll do it (sarc btw).
Unbelievably this is what a large number of US observers did back in the 30’s/40’s.
The clue is seeing the same max on two consecutive days, eg 33.3 and 33.3 when in actual fact if a cold front moved through (say) overnight and the actual max on the second day should have been (say) 24.4.
This is what the TOBS adjustment did to remove that warm bias.
Would you advocate they go back to that?
From Nick Stokes’ Blog:
https://moyhu.blogspot.co.uk/2012/10/a-necessary-adjustment-time-of.html
Also, AGW theory says that there will be a steady increase in minimum temps.
There has … this for the US….
Oh This gem….
“Scam. Simon, you need to get out more.”
You’ve no idea how bizarre that statement is, have you?
Did Apollo11 land on the moon??
Would take more organisation as it’s global. There are a tad more Met agencies than just the US ones.
Look, we need to know if we are comparing apples with apples. Back then nobody had any idea that their recordings would be looked at critically by future climate scientists. They have been and found to include inhomegenities.
That you turn logic and completeness so that proper comparison can be made, into a global scam is way, way, down the rabbit-hole, and sorry, it has to be said. The world just is not as wacky as your conspiracy theorising ideation has it.
TA:
First off, a few individual stations corrected for inhomegenity will have zero effect on a global mean.
Second putting up a graph of max temps in March says zero about the ave temp of England on an annual basis.
Tone, it’s been warmer the last decade because there is more water vapor getting blown over all of the surface station on the continents which hold most of the surface station on the planet. And it’s only because of the ocean decadal cycles alter the distribution of the warm surface waters over time. Same as what the El Nino/La Nina do on shorter time scales.
The only argument left is the extra energy from Co2 evaporate more water. The average solar energy of the ncdc gsod dataset of +/-23Lat tropical station is 216w/^2 for 24 hours =5,200Whr/m^2/day How much energy does co2 add? 3.7W/m^2?
1.7%
I calculated climate sensitivity from surface seasonal temperature change compared to the energy available above the clouds as it also changed, an effective sensitivity, no where is it above 0.02F/W
Times 3.7 = 0.074F
And I’ve shown water vapor controls cooling at night.
So you have nothing.
Which also means this warm spell is going to go away.
Toneb, I sincerely agree with your cutting observation that “The thermos may have been reliable, but the observers weren’t.” My favorite narrative on that subject is to ask people to envision those measures taken in 1880 by old men wearing bi-focals and bathrobes in N. Dakota, in blowing snow, in February. And we expect 0.1C resolution? Ha! That doesn’t even consider the fact the instruments used were “mail order”, never calibrated after issue (perhaps not even before issue) and the records were delivered by horse or train until the telegraph was widely available in the US.
Essentially, records made prior to modern communications are proxies. Any attempt to join them with satellite or even pre-telephone records should have large error bars.
The honest truth is we only have reliable records back to the time mass transportation and advanced communications technology became available. Everything before that is pretty much an informed guess.
For the record (and for the sake of the topic) yesterday it froze in Paso Robles CA and the low for the day (12/18/16) was 22F. It’s happened before but it’s unusual. I expected it and continue to expect that a La Nina will bring the Pacific coast a colder and much wetter winter this year.
Of course, that’s just weather.
BTW, I don’t mean to bitch about 22F in Central CA in December. I’ve spent the past 17 years in Lincoln County WY. In October of 2007 I touched a metal part on my John Deere 4630 without thinking and froze my hand to the tractor. It was -27F. That’s cold.
22F in December is why I moved here.
In my part of SW FL we got up to nearly 90F today with a low tonight of around 70.
Our refusal to participate in winter is why the FL population will increase by 10 million in about 2 weeks. In which direction are climate refugees supposed to migrate?
Yes and that is why Florida has cockroaches that wake you up at night demanding to be fed, bee’s with a bad altitude, ugly walking fish and now an abundance of the world’s top predator, pythons. I’ll stick with 4°F this morning, no mosques!
“I can’t wait for FRIDAY, JANUARY 20th, 2017, when THE AMERICAN spring starts.
There, fixed that for you.
http://www.timeanddate.com/countdown/generic?p0=263&iso=20170120T00&msg=Time%20left%20until%20Obama%20leaves%20office
thanks R. Shearer
Very timely and fun to watch!
+100, Sir!
Absolutely, positively the best comment in the last eight years anywhere!
Can’t we twitter this to Trump? Friday in Eastern Ontario it was -25C during the day. It was supposed to warm up today – it did rising from -23C to -13C but is going back to -23C tonight. Also, except for about a week or ten days in November, it has been colder than usual since October. Met Office in UK was on to a good thing when they finally acknowledged The Pause a couple of years ago and boldly stepped out and forecast cooler weather over the following 5 to 10 years. It was the only longer term forecast they have had that had a chance, but they got back on the GW bandwagon when temps were Karlized. I guess they’ll refloat the old forecast and pretend they believed it all along, because we are going to have a cold spell. That would be better than going slavishly with the NOAA/GISS flow.
This is more a reflection of how warm things were last winter than this winter so far.
Several weather events last year here near Concord NH have been exceeded this year by events this December.
Event: last year -> this year.
Coldest December low temp: 18.2 F -> -2.2, -0.6, 1.7, 3.7, 8.6. 16.4F
Coldest December high temperature: 25.1F -> 11.4, 21.4, 22.7, 24.8F
Biggest snowstorm, entire season: 4.9″ -> 5.2″ and 5.0″
Deepest snowpack, entire season: 5.0″ -> 9.0″
Note that 11.4F high temp is significantly less than the coldest we had last December!
Except for that cold day, this December is pretty average so far. Utterly boring compared to 2007/2008 which started with 52.5″ of snow in December. Last year I had 22.5″ for the entire season!
It is kind of silly that the seasons shift on the solstices and equinoxes . That’s why I’ve always had my annual parties on MidWinter ( when I lived in Manhattan ) and MidSummer since I’ve moved to the Front Range .
6 weeks seems a long estimate till the coldest point . I looked at this crudely back for my 1984 MidWinter Party , http://cosy.com/Science/CG84-tempsEnhanced.jpg , and concluded the lag was only a couple of weeks . What’s the long term average ? I’m sure it’s shorter up here at 2500m .
Here’s to welcoming perihelion coming Jan 04 14:18 at a distance of 0.9833094 AU .
For where I live, the lag is 4 +/- 6 weeks after the solstice. That’s right, the coldest days have happened, on occasion before calendar winter or just before calendar spring (superstorm/blizzard of 1993 coldest temps of the winter were in mid-March. Typically, though, my coldest month is January and the hottest one is July.
I blame global warming!
🙂
[Shrug] Who cares? Why the trolling, Anthony? The coldest part of Winter in the USofA is six weeks away? How do you know? Aren’t you going to cover the corresponding record high temperature regions of the globe?
What corresponding record high temps?…https://earth.nullschool.net/#current/wind/surface/level/overlay=temp/orthographic=-270.12,-1.69,302/loc=139.017,-22.968
Cant wait for you guys on the other side of the pond to get the hang of the newfangled Degree Celsuis scale, it would save me having to get out the calculator every time .
but then you probably dont even use real pints and gallons over there either.
Heck, I have trouble converting Celsius to Centigrade.
It’s quite simple, really. Someone at UEA gave me this formula: Take the Celsius temperature, subtract 40, then multiply times 1.8. Now add 72 and divide by 9/5. Viola, degrees Centigrade. Ask nicely, and next week I’ll give you the formula to convert from Rankine to degrees API.
I personally, like the smaller, more precise degree F.
Fahrenheit is the superior scale for humans, even if everyone didn’t carry around a pocket computer that can trivially convert values:
Kelvin: 0 = dead, 100 = dead
Celsius: 0 = cold, 100 = dead
Fahrenheit: 0 = really cold, 100 = really hot
100 F is about core body temperature for a human (note, not oral, for that one is affected by inhaled breath and ingested objects).
This is only weather. When it’s hot – THEN it’s climate.
“Democracy is the homicidal bitching that goes down in every kitchen to determine who will serve and who will eat….”
Leonard Cohen
Steve, I see you’re a poet or at least an appreciator of fine poetry. Paul Simon, Leonard Cohen, I’m sure there must be others. +100
John@EF
The only place where the high temps are of any interest is in the Arctic at the moment. As the warming of the Arctic is causing cold air to flood southwards. Care to guess what change it could cause to the climate if it became a long term trend.
@taxed
December 18, 2016 at 3:36 pm: To start with, it would pay to remember that the winter pole is a nearly infinite sink. Very low tropopause, no sun, Miscalled ‘warmth’ has c.250K gradient, short trip to the void. Plenty of room there for all the heat we can send….with no return postage.
Yes at this time of year the Arctic will just eat up all the warmth its sent, and then send down a “Arctic blast” as a “thank you”. 🙂
The coldest day will be Jan 20th.
Thereafter will the winter of our discontent be made glorious summer.
Does make you wonder exactly how cold NH winters have to be before the warmists stop calling for – however unworkable – temperature reduction measures. I mean look, the models say the World is frying and never mind that it’s like Martian spring outside, we absolutely must heave petatons of crushed rock into the stratosphere in order to haul temperatures ever lower. The dim is quite without precedent yet endlessly fascinating in a train wreck kind of way.
Now, now, only part of the US is as cold as Mars:
http://ingalls.weathertogether.us/wp-content/uploads/sites/11/2016/12/161217_Highs-1024×517.png
http://ingalls.weathertogether.us/2016/12/17/ten-states-are-colder-than-mars/
You’ll perhaps notice the correlation between “colder than Mars” and Red (fly-over) States? Does anyone wonder why the “Blue” states are on the outskirts of that region? Hmm.
I wonder how many cAGW alarmists have signed up for Mars 1?
U.S average temperature 16°F – colder than any time last winter, and winter hasn’t started yet!
Thanks for that, but near Edmonton it was -26 C here yesterday morning, and I’ve already had all the winter I want to see. That’s about two weeks now of temperatures around -20 C On a better note, it warmed up over night and was -2 C this morning.
I was just looking at national conditions as shown on Intellicast. It is frigid out there for a large part of the nation. I happened to have the interactive map centered on Holcomb Kansas. They set a new record low last night of -19F. That is 18 degrees below their average. …http://www.intellicast.com/Local/Observation.aspx?location=USKS0269
Actually, it is 36°F below the average.
I realized that after posting. I should have said 18 degrees below the previous record low for that day. It was also 2 degrees lower than their all time December record low temp. Very chilly, 20F here where I live is cold enough for me
Feel for you folk in cold norhern climes
Down here in Melbourne Australia today will be 30 c with similar temp for Chriistmas day
Santa sure sweats alot in his heavy gear which is why we leave a bottle of beer out for him and he never fails to polish it off whats more
But not unusual as we average 30 days a summer of 30 c plus with a few up in the 40’s c
Merry Christmas -if we are still allowed to say that
I guess pretty soon we’ll see the millionaire tennis players downunder whining about it being to hot to play!
40 C is our average summer late June, July and August temperature. Now that I live in Mesa Arizona. It beat the 045.5 C I saw in Ray North Dakota in 1983 or 1983, having spent 55 years in Northern Minnesotan North Dakota the last nine years in Mesa has been great, my arthritis feel fine at 40 C not at -22 C when I was back in North Dakota a couple weeks ago to meet my new grandson. I have seen -40 C far too much living in the North, I much prefer +40 c, I will even take 46 C over -50 C any day of the week. We had several days of 46 C last summer.
Where I am, Christmas reached 70F/ 21C. Nice and not unheard of and it was wonderful to not have to turn the heat on. Big cold blast happened after Christmas and it is expected to thaw briefly (again reaching near 70F tomorrow the 2nd) before another cold blast. When these strong clippers come through, it is often quite cold behind them and warm ahead of the next one. They pull real tropical air up ahead of them (thus the 70s) and real arctic air behind them (thus the below average highs in the 30s/40s (1 to 5C). Now don’t get the idea that this means no mosquitos. It does not at all. They just go dormant when cold and active when it gets above 40 to 50 (5 to 10C). To actually kill the locals, it has to get really hot (40C) or really cold (below zero) for an extended period.
Always thought that the Druids had it right, they centered the seasons on the solstices, so Dec 21 is midwinter and June 21 is midsummer.
That way we can enjoy early spring.
There should only be two seasons, summer and winter and they both start and end on the equinoxes.
Record High of 86 degrees today in SW Florida… thanks to the Nuclear Freeze that we were warned about by the same people that have brought us Global Warming… Go Figure!!!
Here in the People’s Republic of NJ, 40 miles S. of the Big Apple, it was 16 on Thursday, 23 on Friday, in the 40s on Saturday and 60 today. It is now 38. All temps in degrees F.
I escaped from the PDRNJ in part because of the cold, which isn’t even really all that cold by northern standards.
But one day I dropped my daughter off at preschool and it was 2 deg F.
At 9 am with full sunshine. Too cold for a guy raised in GA.
Global Warming anyone?
From Palm Beach Florida — Merry Christmas YOU ALL.
Current Temperature in Palm Beach: 80 degrees
Kelvin? It’s worse than we thought 🙁
This is just the kind of weather that causes alarmist to argue that you can’t conflate weather with climate. So remember that next hurricane season.
Looking at the jet stream forecast chart its looking like the Mid-west of USA will be in for a other cold blast just in time for Christmas.
For those of us here in the UK there looks like there maybe a chance of snowfall on Christmas Day. A area of low pressure looks like it will passing over Scotland during Christmas Day. When it passes through the wind will swing around to the NW and North during the night. So there maybe a fair change of some snowfall during Christmas night. lt maybe worth a putting a bet down for having snowfall at Christmas. With Newcastle at 7/2 and Edinburgh at 5/2 looking like the best bets to go for.
That global “warming” will kill a man…. 🙁
We’re in for one of the coldest winters in a century. That’s to be expected in a cooling trend, which is what we are entering despite all the hydrocarbons we have released into the atmosphere.
It’s been shown many times now that the temperature of the Troposphere does not track with the rise and fall of atmospheric CO2 – besides, plants will thrive in response to any increase and buffer it out. There are a number of greenhouse gasses, but water vapor trumps them all – buy your Al Gore atmospheric water vapor condensers now before the rush.
Drudge has picked up on this post.
Bummer! I was going to be the first to announce that! I shall accuse you of copying my homework.
8<)
81 in Miami, no problems here.
The whole Global Warming “crisis” is all emotion. The Alarmist’s claim that anthropogenic CO 2 is the cause because it’s a greenhouse gas. What they never acknowledge is that CO 2 is essential to life and human emission account for less than 4% of total carbon emissions. Also ignored is the fact that water vapor is 99.99% the result of nature and it dominates the greenhouse effect accounting for 95% while total CO2 emissions add 4% to the G.H. Effect. Even if you want to believe CO 2 is the cause of warming, do the math…..Take.4% humans produce into the 4% that CO2 adds to the greenhouse effect and you get 0.16%……..Humans add less than 2/10th of one percent to CO2’s G.H.Effect! Bottom line – we have no control over the climate!!!!.
Is CO2 the cause or the result of warming?
CO2 is the result of warming.
In reality, and contrary to the lies that Al Gore presented in his movie, there is zero evidence that CO2 causes climate warming. CO2 does not lead but *follows* changes in temperatures. This outstanding 4 minute video makes that point about CO2 clear as day:
Eric Simpson
Yes well…. this movie is a laughing stock and it really should be called “the Great Global Warming Comedy Movie.” It is so full of made up facts no one quotes it any more.
Earth’s climate history contradicts the “Carbon is the Cause” theory. During greenhouse warm periods CO 2 levels were much higher than today but it did not prevent the glacial periods that followed. Conversely, during glacial periods the climate warmed despite low levels of CO2.
Well comradegrandmuftihusseinobama can now add solving the global warming crisis to his list of “accomplishments.”
Never mind frost bites, THE PLANET IS ON FIRE!
It has to be cold in the Arctic or it doesn’t count.
Go to “the arctic” and report back.
Only a moron would go to the Arctic in the winter. A fool would go there in the summer. But does it matter how cold it gets in the USA? Climate change is fixated on the Arctic.
The good news it will still be the warmest year on record – as long as you fudge the numbers
In the early 70’s they hyped ‘cooling’. Then it was global warming followed by climate change and now extreme weather variations. Nothing like trying to play football with movable goal posts! The bunch puts the ‘o’ in wacko! It’s getting harder to tolerate them when their prognostications continue to get debunked.
What are we doing people?! I demand that we up the anty with Global warming! Stop driving your little g@y hybrids, and start driving more gas guzzlers! If Global warming is man made then, we need to make more of it before it’s to late! If we don’t get make more then we’re looking at global cooling! And that’s man made too, by not not making enough global warming! It’s simple logic people! Wake up and start polluting it’s too cold outside!
Thank God for global warming!
Global warming (aka climate change) is the religion of the stupid. Sheep, lemmings, and Leftists are easily manipulated.
zazzle.com/FirstPrinciples?rf=238518351914519699
I believe the honest scientist’s telling us we’re headed for trouble.
Cold Trouble..!
30 here in Homer Alaska 5PM
I have a new 51″ snowblower for the tractor. I’m ready.
In Honolulu, it’s a balmy 77 degrees on Sunday, 4 PM. Listen to Teddy Novak, he knows what he’s talking about.
Had enough of this loony tune globull warming hoax yet? I think you have.
Here in balmy Minnesota we have a low of -20°F and a high today of -8°F. Obviously, this is all because we are a blue state. The rest of the country should be much warmer.
Karma dude. You’ve been cursed by your neighbors’ hysteria.
Left Northern Minnesota this morning and the temps in a ten-mile radius of our home ranged from minus 27F to minus 38F actual temperature, not wind. We packed the car in those temps and headed for Florida!
21 below zero F Thursday night, without wind chill. One of the coldest nights I’ve seen in the last 20 years. Elevation 5000 ft here north central WY.
Wow! Trump isn’t even in office yet and he’s already changing the weather – Making America Cool Again!
Trump’s Making America Cool Again!
What about the LEFT and their cry about Man-Made Global Warming??? MAN-MADE GLOBAL WARMING is the second largest hoax pulled upon Mankind,…. right behind Barack Obama himself!!! ANYONE believing in this totally fake and made up bullshit, should be put out to pasture ! ! !
Despite all the Goebbels Warming, the weather where I live is almost exactly the same as it was 20 years ago. The only difference is, now I live on the TX Gulf Coast and 20 years ago I lived up on Wrong Island.
If this global warming gets any worse, we’re all going to freeze to death. Oh wait, I forgot. It’s no warmer now than it was in the 1940s.
IF that is so, and I consider that there is quite a bit of evidence suggesting that that might be the case, that is the material point. Since 1940, man has emitted some 95% of all manmade CO2 emissions, all without any measurable increase in temperature. That says a lot about Climate Sensitivity to CO2.
I read a report two months ago by a guy who is a sun spot expert. He was predicting an extremely cold winter this year, especially the ne part of the country. He went on to predict we will have 10 to 13 years of this. Were entering some kind of cycle he said. Lets hope he was wrong. It was 29 below here in se minny last night.
Currently a nice 14F in southeast Michigan, heading to a balmy 1F sunrise. Very thankful for AGW or it would be really cold.
damn global warming, oh wait, they have it covered, they are calling it climate change now, thank goodness, for a minute there I thought they were all just your average run of the mill nutjobs…
We haven’t finished revising the data yet, but trust us: it’s hot, hot, hot!
This is only my 3rd year Dasmarinas, Philippines, But it is definitely colder/cooler than the previous two. The warming alarmist better understand, and quickly, Food/crops, trees, all organic species grow and thrive in warm weather, If we are, as history tells us at the end of a 10,000 +/- year warm period, it will be followed by a 400,000 ice age. I’ll take the heat, most won’t survive the cold. In any case, none of us get of here alive .
Why is “global warming” always so cold?
The global warming folks are awfully quiet…
Satellite data indicates that there has been NO WARMING for the last 21 years!
Of course they’re quiet. They are busy trying to make the weather into the hottest (year/ month/ week/ day/ hour/ minute/ whatever) EVER!!!!! There’s a lot of adjusting being done and it takes concentration and dedication to tease the “truth” out of actual thermometer readings. Or perhaps they are composing news releases saying “it’s not a bad as we thought” (that’s a joke BTW)
It was hot in October 2015, especially in Tasmania and it had little to do with El Nino, apparently.
https://theconversation.com/climate-change-played-a-role-in-australias-hottest-october-and-tasmanias-big-dry-in-2015-70389
“There’s a lot of adjusting being done and it takes concentration and dedication to tease the “truth” out of actual thermometer readings.”
LOL! Good one, Smart Rock!
I am more interested in a truckload of coal. Do you have any of that for sale?
Oh uh! This are not working out for the global warmin hoaxers. Haaaaahaaaa
Well some still think all the Climate Change cult should be required to do their work outside with no man made heating or cooling equipment !
Sort of get the feel of it!
Too
All the farmers and ranchers out in each morning chopping ice for cows, horses, sheep and goats etal have skinin the game via the frost bite!
Blurt
Here from the Drudge link as a test
If it’s any consolation to you guys in the northern hemisphere our summer in the Southern Hemisphere is mild so far .
Will someone for the love of humanity please start burning coal !
This, of course, is just weather, but that said, it has been an El Nino year so it may not be surprising that weather patterns are not usual.
In Southern Spain, the entire year has been cold. I have regularly checked the Windows 10 weather App, and for about 85% of the time it has been about 2 to 3 degrees cooler than the average for any given time of year.
My swimming pool usually reaches about 34 to 35 degC in July, but this year is struggled around 30 to 31 degC. On a few days it reached 32 deg C, but not higher than that. the pool containing a large volume of water is a very good indicator of the average temperatures.
Today is quite typical of the year. The forecast is for a high of 12degC, and the average high for 19th December is listed as 15degC. So about 3 degC cooler than usual.
Generally the year has been quite dry, but the past month has been very wet. Hopefully, the reservoirs will now be full and there will not be water shortages next year.
It might have been the warmest year in the instrument record (not that I accept that we can accurately assess this to 0.1 degC let alone 0.01degC), but if so, this has been over the oceans. Over the land in the Northern Hemisphere where we live, I am sceptical that it has been the warmest year on record (instrument record period). I have yet to speak to anyone who considers the year to have been unusually hot.
it has been mainly over the oceans thanks to the blob we had and the el nino.
Land only data shows a different story: see hadcrut 4 data here on WFT
land only data on all sets shows even a slight cooling from 2007 to 2015 before it bumped up by the 2015-2016 el nino.
note that i talk here about land only data, the global data shows another story:
Weather changes, duh. There have been ice ages and hot ages before any industry existed. The lure of grant money, taxation and control makes the parasite politicians and accomplices in the academic community push Climate Change narratives that scares the fearful little nimrods out of their minds. Absurd.
Wouldn’t it be nice to shut down Al Gore’s heating for a week in his mansion?
Although my ancestors survived the end 1800’s mini ice age in the arctic circle region, the global warming now here in North-Eastern France hurts my bones.
The Gore effect in action. 😉
Quite chilly for autumn, but buck up. Winter is usually colder.
ManBearPig!!!!!
It is Trump’s fault of course. He asked his BFF Putin to crank up the old Russian weather machines so they would make mock of Al’s and Leo’s global warming money making scam.
The cold I do not mind. It is the ICE! And I had to drive to NoVA in it this weekend! Apparently there are still a lot of drivers that do not know to stay off the road.
NoVA = Not Moving.
You people down there are funny. If we styed off the roads every time there was ice, we would be stuck at home for 4 months every year. I was in Baltimore 3 years ago during a snow storm. I think people need to learn how to drive in snow and on ice. The drivers had no idea. In fact the whole city shut down. It was ridiculous.
Dallas, tx 0830 -7 C.
Its still sauna weather at NIOAA HQ
It was cold up here for weeks in the Great white north, -30C, but then a DiCaprio blew in, (Chinook) and now we’re pushing +3C.
Since the meteorological winter starts at Dec 1st in the Northern Hemisphere it actually is winter now. Comparing the temperature on Dec 18th 2016 with last winter, which was the warmest winter (D,J,F) since 1900 for the lower 48, doesn’t really tell us much, other than weather fluctuates from year to year. Over the last few days i’ve seen a high of 26, followed by 33, then 57, now back to 32!
and this is why its cold:
https://www.theguardian.com/environment/2016/dec/19/arctic-ice-melt-already-affecting-weather-patterns-where-you-live-right-now
Is it colder across the Northern hemisphere, or are some areas milder while other are colder? What is the overall temperature?
I note the temperature in the Arctic remains stubbornly high.
No, this is why it is cold…https://earth.nullschool.net/#current/wind/surface/level/overlay=temp/orthographic=138.30,86.49,302/loc=-43.277,72.451
Sure thing, Skankhunt42, next up is The Day After Tomorrow ….
I love the fact that the heat is responsible for the cold. The reason why there has been a loss of ice in the Arctic is due, entirely, to ocean currents bringing warm water north. Hmmmm, 4,000 years ago there was no ice in the Arctic and the polar bears survived quite nicely. Just remember, now that the oceans are cooling, dramatically, we will see the Arctic ice mass increase to the usual maximum in March next year. Time to wait and see.
And also please remember that 90% of the glacial ice mass on the planet, Antarctica, did grow from 1990-2003 by 82 billion tonnes per year. Does anyone have an update to that data, I do not like to quote information that is bordering on being 14 years old and would like to get an update – thanks!
Al gore needs to stop traveling across this country. Global warming is making my dog freeze his balls off.
Try to stay warm. Here in Calgary, we finally broke out of a 2 week long deep freeze (highs below -20°C (-4°f)). Today we are sitting at just above 0°C (32°f). It is forecasted to cool off a little again before Christmas.
it [the global cooling] is worse than I thought
lakes possibly to freeze over again
[do you keep good records of that?]
“I can’t wait for Monday, March 20th, 2017, when spring starts’
I have some bad news there.
Natural climate change might cause some shift in the seasons
looking at the sun, we are now in 1930… only 2 years away from the dust bowl drought
but it was hot in the summers during those years until 1939
and dry
very dry
Don’t rely on that sort of logic very much! The US already had a repeat of February 1934 in February 2015, thank you warm blob. Those two month were amazingly similar.
https://wattsupwiththat.com/2015/03/08/1934-2015-a-tale-of-two-februaries/
climate change? it called season, some years are warmer, some are colder. It is a normal cycle
There were some black ice related commuting challenges this AM here in California. It’s a bit early for that sort of thing.
Well, anecdotal evidence from temperate Portland OR, has been going on three weeks of winter storms, earlier than I’ve ever seen before.
And you would not believe how blindsided the local authorities are – we literally had seven-hour commutes to travel ten miles or less. No salt on the road, ‘cuz it’s not ‘eco-friendly’.
And get this, as snow and freezing rain shut down the city, before they scurried on home at ten in the morning, the Portland city council passed a fossil fuel ban.
‘Portlandia’ isn’t even farce anymore.
16? It was 90 here in Ft. Myers, FL
Heat wave – global warming. Record cold – global warming. Record torrential rain – global warming. Droughts – global warming. Trump beats Hillary -global warming. Wait a minute; satellite and balloon records show that there has been no appreciable GLOBAL warming for 19 years and counting. The IPCC and other AGW “Sky Is Falling” loons were ready for that. Notice how the “warming” has been quietly dropped? Now it’s “climate change,” suggesting the absurdity that the climate has never changed in the past when anyone with an IQ bigger than their waist size knows that it has changed regularly since the planet was formed.
Based on this cold spell, is anyone here predicting that December 2016 will be record cold; or that winter 2016/17 (defined meteorologically as DJF) will be record cold in the US48; or colder than the 20th century average; or just colder than the 1981-2010 average, even?
November 2016 was the second warmest November on record for the US48 according to NCEI: https://www.ncdc.noaa.gov/cag/ I don’t recall that being mentioned here. Certainly it wasn’t the subject of a lead article. Yet a relatively brief cold spell in mid December gets its own post and around 300 comments.
Notice how the “warming” has been quietly dropped? Now it’s “climate change
Intergovernmental Panel on Climate Change was convened in 1988.
Both terms have been in use for decades. Global warming refers to global change of temperature (including oceans) in the positive direction. Climate change refers to that and other stuff that isn’t temperature (sea level, ice, changing weather patterns etc).
Darn that global warming !!!!
I’m not surprised. We’re in a La Nina now, and weren’t we in an El Nino then?
I read that last Winter was the warmest US Winter in the instrumental record.
If so, then a colder December this year isn’t really news of anything, is it? This is a weather report, not a perspective on climate or climate change.
Seems Weatherbell use NOAA data for their chart (I had a god look over their website – they use NOAA/NCEP data for US exclusively it seems).
Their chart based on the same data that people regularly call fraudulent here. I see that some have done that upthread, and wonder if they realize it undermines the point of the OP?
It’s likely not that simple, I use NCDC data for my charts, I just don’t add all the made up junk, like all natural orange juice, if it’s not measured it’s not made up and included.
So, do you think weather bell does the same stupid stuff BEST does? I don’t.
What did the raw NCDC data show for November?
The algorithms I use need a full year of data, so I have not loaded 2016 yet.
So, do you think weather bell does the same stupid stuff BEST does? I don’t.
For the chart in the OP, Weatherbell have used NOAA data as is, not their own slice and dice. (BEST has nothing to do with it. Let’s stick to the matters at hand)
Maybe I miss typed, but I thought I said they do not do the stupid stuff BEST does.
Perhaps I misunderstood. If you’re saying NOAA data is valid, then last US Winter (Dec, Jan, Feb) was the warmest on record according to that data set – not surprising, perhaps, considering that was the peak of a strong el Nino in the Pacific – which makes a colder day this December a bit less astonishing.
We’re talking about weather, not climate. But I think that we’re supposed to think that a cold spot in December is climatically meaningful?
Noaa data is what we have. It is OK for the US and most of Eurasia, but lacking the rest of the planet. I’m on my phone so I’m not sure what your comment about my comment is about. But it is important to note how fast the planetary temp drops at the end of an El Nino. If all that heat was trapped by co2, how exactly does it cool a full degree over a handful of months?
Oh, and climate is just a statistical average of weather for 30 years, right?
So, do you think weather bell does the same stupid stuff BEST does? I don’t.
What about producing some scientific report on “BEST’s stupid stuff”, micro6500?
So we could understand what you mean.
Eh, I’ve posted links and graphics from my stuff for a couple years now. Basically they should stop making up data for places that have never been measured, that’d be a good start.
Oh, and climate is just a statistical average of weather for 30 years, right?
That’s the classic definition for global/large regional climate.
Yes, we have large fluctuations. El Nino/la Nina is one of the primary interannual fluctuations. So you need longer periods to discern any trend underlying the ‘noise’ of large natural fluctuation.
Where on Earth did anyone get the idea that weather and interannual fluctuations would cease to occur if more CO2 got added to the atmosphere? We could still have a 1C drop in temps over a few months when the Earth was 10 degrees hotter than today. And someone may cry out that this means the planet was not 9C warmer?
It’s disappointing to be digging the same old ditch 15 years into the climate debate. Weather is not climate!
Barry: It’s disappointing to be digging the same old ditch 15 years into the climate debate. Weather is not climate!
@barry
First of all, I note that you ignored my challenge to bring me a re-calibration certificate of a thermometer before 1948…
Just like me, you could not find it. That means all data on global T before that time is questionable, to say the least, is it not?
I also challenged you to show me results of the climate around you for the past 40 years or so, and you could not do so either. Like I must have told you before, I checked that there has been no warming here in Pretoria, for the past 40 years, especially in the winter months, when people are burning a lot of fossil fuel and population has been increasing…. In fact I could not find any man made global warming here anywhere, as evident from my results,
my final findings are that earth’s T is determined by solar cycles outside and inside [earth]
the latter being made clear to me when going down 1km into a goldmine here…
Hence, there is no man made global warming. There never was and there never will be. It seems the president elect and the RP have realized this.
Barry, if I were in your shoes, I would pack my bags and get out of this ‘industry’ whilst you still can.
Great, tell that to the IPCC, 30 years isn’t long enough. I agree, but the data is pretty bad before 1978, before the 50’s is even worse.
The point is the entire air mass of the planet dropped an extra degree in temperature, all the while co2 was doing it’s best to prevent it. It shows the temperatures are being controlled by the ocean surface temperature distribution, and the water vapor the winds then blow over the continents to cool. Co2 can not accumulate warming in the atm, unless it can reduce the cooling rate so an excess of heat gets retained overnight. And it doesn’t. And this is an example why, co2 is not holding up air temps.
Basically they should stop making up data for places that have never been measured, that’d be a good start.
A far better start would be for you to learn how they really do it, instead of writing here such pretentious blah blah.
Ten thousands of engineers all around the world use kriging, infilling etc in lots of different disciplines (mining, geology, etc) and there is no problem anywhere.
With ONE exception: climate skeptics lacking any experience concerning that matter, and whose claims about it being worse stuff are inversely proportional to their experience…
The problem is weather is not a linear field across a continent. So why do you think a linear infilling process actually improves the data? And from what 1,000km away in some cases?
And there are other engineering fields where you just don’t make up data.
Henry, your challenges are beside the point. My lack of response is from disinterest in them. There are imperfections in the global temp monitoring systems even to this day, and numerous methods have been employed to make the estimates better – including the satellite records, which are continually ‘adjusted’ as new information comes in. Asking for thermometer calibration certificates is silly.
If you wish to posit 1948 as some sort of cut-off date for solid gold data, go right ahead. This simplifies the issue to banality.
The weather in my local area is tied to global climate like shampoo shares are tied to the stock market. You will find plenty of data for Sydney, Australia if you’re truly interested. If you think my city is a great proxy for global temps, that’s your problem, not mine. (Warming is shown, with a long records from a number of stations, but so what?)
You’ve made it clear that a lack of response indicates inability. Therefore you must be incapable of understanding the methods applied by the skeptic team (Roman M, Jeff Condon) that came up with their own global temperature record.
But unlike you I don’t make such smug assumptions. So I will ask – did you even click the link and take a moment to read their work?
@barry
Since you were too lazy to even look at the figures closely where you live, I did it for you.
[remember, AGW is supposed to affect minimum T, pushing up the means]
As you can see, there has been 0.000K man made global warming in Sydney, Australia.
http://i64.tinypic.com/1zml5eb_th.jpg
I knew this, of course: there has been little or no increase in minima over the whole of the SH.
So, there is no AGW.
And since min temps are actively regulated down to dew point on clear nights, T min is not affected at all by co2, and warming has just followed dew points.
Sorry, Henry, but discussions with you move strangely. You prefer data from 1948, but now display half that period. Your station is unnamed. And you only show minimum temps. One usually looks at mean temps.
Not that data from one city has any meaning WRT global climate, here is the record from observatory Hill, the best-kept, longest running weather station in the city.
http://www.bom.gov.au/tmp/cdio/066062_38_13_2833272021339866521.png
Warming since 1900, or 1948, or the 1970s, if you must. And it’s the min temps that you prefer.
But it doesn’t ell us what is happening globally.
You can’t use a single city as a proxy for global. You can’t use 12. You need more, and fairly evenly distributed around the globe to begin to get a handle on the worldwide average.
These strange challenges you throw out are beside the point. And if I present some data you’ll just say it’s ‘bad’ and the whole exercise is not so much discussion as a lecture.
That’s not interesting.
There, a world of min temp, almost 76 million NCDC surface records.
@micro6500
going by Tmax -Tmin
we see an upward trend of 0.0016K per annum
but, individually, both Tmax and Tmin seems to be declining [negative]?
How can that be? Puzzles me.
That’s the difference between the two trends. Min is going up more that max.
Could work for me
..
I did find the greening of earth does trap some heat,
as would be expected
But it is not so much…
And that’s one of the things I found, min changes both up and down, and it changes different than max, both ways there to (ie both up and down)
there where they chop the trees, minima are dropping
e.g. Tandil (Argentina)
there where they changed a desert into an oasis, minima are increasing, e.g. Las Vegas (USA)
overall though, on average, this type of contribution to global cooling/warming still seems very small and some human activities cancel each other out.
barry
now you say
You prefer data from 1948, but now display half that period. Your station is unnamed. And you only show minimum temps. One usually looks at mean temps.
henry says
are you deliberately trying to confuse issues and be mischievous?\
is this how desperate you AGW guys have become?
here is my original comment
https://wattsupwiththat.com/2016/12/18/u-s-average-temperature-16f-colder-than-any-time-last-winter-and-winter-hasnt-started-yet/#comment-2378210
and see how that compares with your comment?
station=airport
means T is always very contaminated due to e.g. inner core – and lunar movement, volcanic activity, etc…better is T min or T max depending on what you want to study e.g. AGW or irradiation respectively.
gosh
I remember when I started working in the seventies that we had to monitor T and RH with a wind up recorder and for the week you had to put a paper in so that it could go round….but now what to do when the wind up ended [usually during a weekend] or when the ink went dry? I am sure this is how it pretty much went everywhere in the world before computers????
So you cannot go reliably go back more than 30 or 40 years on the data or else you are just comparing apples with pears.
barry says
You can’t use a single city as a proxy for global. You can’t use 12. You need more, and fairly evenly distributed around the globe to begin to get a handle on the worldwide average.
henry says
must say
the data set that you offer to me are exactly not evenly distributed….
here is the result of 54 stations
sample = 27 Nh and 27 Sh
1) balanced on latitude, to ca. zero
2) checked on K/annum instead of just anomaly [which eliminates the need for a balance on longitude: do you know why?]
3) balanced on 70/30 @sea/inland
Micro:
Do keep up please….
“And since min temps are actively regulated down to dew point on clear nights, T min is not affected at all by co2, and warming has just followed dew points.”
And just why have “dew points” risen?
Considering that WV precipitates out at 100% Abs Hum, and that Abs Hum is regulated by Temp, and that temp is regulated by….?
Clue: its NOT water.
Dew points are rising because rising temp allows them to.
You are taking the symptom to be the cause!
Because of the decadal oscillations redistributing warm surface waters, then the wind blows the water vapor inland. The exact same process El Nino’s use to affect the weather. And in fact, the “Step” was at the end of the El Nino, and altered the effective sensitivity of solar in the 20-~35North lat band.
henryp:
“As you can see, there has been 0.000K man made global warming in Sydney, Australia.”
Oh really?
Not what this says my friend….
http://www.svsunnyspells.com/wp-content/uploads/2010/05/MeanMin.jpg
And we had agreed that you cannot compare apples with pears?
Ok, Henry, here’s Sydney Airport.
http://www.bom.gov.au/jsp/ncc/cdio/weatherData/av?p_display_type=dataGraph&p_stn_num=066037&p_nccObsCode=38&p_month=13
That is clearly rising in temps since the 1970s, and since before (though I understand now that you actually don’t like to use data prior to the 1970s).
Still it indicates precisely nothing about Global temps. Sydney could be warming and the globe cooling, theoretically. This challenge of yours to show data for individual stations is a waste of time.
Now, I’ve jumped through a few hoops for you. How about returning the courtesy and reading up on the global temperature record estimated by two skeptics.
https://noconsensus.wordpress.com/2010/03/24/thermal-hammer/
What do you think of their methods/results?
Clearly your data does agree with my data for Sydney a/p
Sorry
Should be
Your data does NOT agree with my data for Sydney a/p
Cool! Err, cold! Here near Concord NH it’s -7.7°F (-22.0°C). This is the fourth day this month I’ve recorded a subzero temperature, though two came last night (-2.2°F at midnight), and one was a paltry -0.6°F.
Still, it’s impressive, the most I’ve recorded before was three in December 2004, and usually none.
My data goes back to 2003, oh, this is the coldest December temperature we’ve had:
Last December the coldest we got all month was 18.0°F (-7.8°C).
Keep a record of when last in the calendar year having to remove snow from your front door
See how the date will shift in the next two decades coming up.
yepp
global cooling is real
v’
Global Warming must have come to an end since we have rid the nation of liberals.
The person on this tape is describing a massive Proton Event hitting the Earth. In my opinion it could have caused or precipitated the massive cold air moving rapidly south last few days. He says he thinks the heavy proton bombardment was not originated on the Sun – where they usually come from, as there was no strong CME (Coronal Mass Ejection) during that period. Here is the LINK: http://www.BPEarthWatch.Com
From that link (why didn’t you post the URL with the information you wanted people to see?) I went to http://spaceweather.com/ to see if the sun had any spots, it did. It also said
It also linked to this image:
http://spaceweather.com/images2016/18dec16/ch_strip.jpg
The REAL reason for climate change: http://www.crawfordperspectives.com/ClimateKeplerianPlanetDyna.htm
Yea… And at the North pole it may get above freezing. In winter. In the dark.
http://green.trendolizer.com/2016/12/north-pole-hits-melting-point-with-temperatures-40-degrees-above-normal.html
So other than offering more evidence that you are literally dumber than most life forms on the planet in that you keep insisting that GW really does not exist, what is the point of your post?
http://www.dnusbaum.com/AGWdeniers.html
It has absolutely nothing to do with co2.
How’s that?