
The sun has been completely spotless on 21 days in 2016 and it is currently featuring just one lonely sunspot region.
In fact, on June 4th of this year, the sun went completely spotless for the first time since 2011 and that quiet spell lasted for about four days. Sunspot regions then reappeared for the next few weeks on a sporadic basis, but that was followed by several more completely spotless days on the surface of the sun.
The increasingly frequent blank sun is a sign that the next solar minimum is approaching and there will be an even greater number of spotless days over the next few years. At first, the blankness will stretch for just a few days at a time, then it’ll continue for weeks at a time, and finally it should last for months at a time when the sunspot cycle reaches its nadir. The next solar minimum phase is expected to take place around 2019 or 2020. The current solar cycle is the 24th since 1755 when extensive recording of solar sunspot activity began and is the weakest in more than a century with the fewest sunspots since cycle 14 peaked in February 1906.
One other note, the weak solar cycle and the expectation for continued low solar activity this upcoming winter is an important factor in this year’s colder-than-normal Winter Outlook for the Mid-Atlantic region.
more at Vencore Weather
Hugh Hudson had a nice ‘nugget’ on this:
http://sprg.ssl.berkeley.edu/~tohban/wiki/index.php/Spotlessness_returns
with an interesting comment: ” It is remarkable that solar magnetic activity actually does not seem to care whether or not sunspots form, suggesting strongly that these beautiful things are just blemishes on the surface of the Sun, fascinating for many reasons but not at all representing the action of the solar dynamo that we imagine to pulse powerfully away in the deep solar interior”.
Svensmark says this in similar fashion. He notes the odd difference in long run revised trend in sun spots (flat), versus elevated trend in magnetic field over the same 100 year trend.
Svensmark is not correct about this. He does not understand the processes involved. Perhaps you could provide a link to his exact statement on this.
See Svensmark lecture on YouTube December 2015.
If you want people to look at it, give a link.
The discussion of revised sun spot data and magnetic fields is near the end of the talk.
He was certainly right about this:
http://www.leif.org/research/Solar-Theory-Dead.png
Yes, I thought that would result in cherry picking that plumb slide….while not addressing the question.
There is really nothing to address. One could spend all one’s time to address misconceptions and errors to no avail. The revised sunspot series is the best data we have. If you disregard that because it conflicts with your pet idea, it is your loss.
What pet issue? I’m just trying to understand Svensmark’s point or issue.
Well maybe not, but something causes them to come and go on a regular basis. And in the context of the Earth’s temperature it seems we have had some pretty cold spells when they are not there.
So is there a causal effect on temperature? One thing we do have coming into the next period of solar minimums are satellites that can measure all sorts of things so in the next 30 years or so if the data doesn’t get corrupted by zealots, maybe we can see just what effect it has.
The Russians are betting on colder temps and if anyone knows cold, they do.
Yes, and the Russians tried to tell us how to build the Alaskan pipeline——–nyet, no bury.
low sunspots also seem to be when we get more and stronger quakes as well.
The Next ‘Little Ice Age’ Is Already Here, Russian Scientist Claims
A new study by a prominent Russian astrophysicist claims the “new Little Ice Age” started at the end of 2015 due to low solar activity, kicking off decades of “deep cooling” in the latter half of the 21st Century.
http://dailycaller.com/2016/10/31/the-next-little-ice-age-is-already-here-russian-scientist-claims/#ixzz4OgrbzyjZ
He has already been falsified by the data:
http://www.leif.org/research/Abdussa3.png
Thanks!…I thought you would know
The Daily Caller link references a Dr Easterbrook book and a December, 2013 Climate Depot article where Dr Norman Page seems to align himself with the Russian scientist’s work. Both have made comments at this site in the past.
I grow wary of predictions that we are sliding into the next LIA type of cooling,there have been too much certainty in it.
It is far more likely that it will cool slowly over the next few decades,then shift back to a warming trend again,just as it has been the past 300 + years,since the bottom of the LIA in the 1600’s.
I’m watching with interest because of some of the things that Isvalgaard has stated. We can always learn something from any event. I have too many loose ends right now to say whether globally temperatures will fall. I feel fairly certain that we won’t see temps like we did with the past el nino for awhile. I don’t have enough of the when, where, and how. Solar cycles still seem to follow their own path.
From an arguments sake a low solar cycle and colder climate would confirm that connection. As a practical matter, I never want to see the 1970s again. Not a fan of a colder world.
Good points.
But we’re stuck in an Ice Age with alternating glaciations and short warm periods. Even if the Sun is assumed to be a constant and only has an effect on local climates, the next glaciation is certainly going to occur. I think even the most rabid warmist would hope that the Earth does enter the next glaciation during their lifetimes even it they truly believe, without a shred of proof, that the Earth will boil over during their lifetimes..
When will glacial begin … is the big question. That’s my big gripe about AGW. They are spending time and money on a non problem instead of trying to find out the real reason for when the climate changes.
“When will glacial begin … is the big question.”
Next glacial may not start as long as the N.E. Canada rebound is going, it keeps Mid Atlantic Ridge active. Once those two stop it might take a while but it will not be long off.
Magma under the ridge will start to solidify further and further down, joining the two plates. All volcanic activity will cease, with a new Ice age taking hold. It will take N.Canada wide external pressure around or above 2000kg/cm2 to crack open the plates boundary again, but when it does happen the MAR will go off with a truly big bang resulting in an imminent de-glaciation.
Then whole thing will start all over again.
(the above is a summary of the currently in ‘writing’ but as yet unknown vukcevic et al glaciation hypothesis)
See Svensmark lecture on YouTube December 2015.
I assume you mean this one, apparently delivered 12/12/2015 in Essen, Germany, and uploaded 04/22/2016:
The poster behind Dr. Svensmark suggests the Heartland Institute was one of the sponsors.
When the question is
Do sunflares impact aerosols which are steering elements of earth’s climate.
Johann, do you mean cloud condensation nuclei?
Crispin, yes –
that’s we’re talking about here .
And that’s just one thing the computer models never be able to solve.
Perhaps the lack of flaring encourages CCN through the mechanism of increased cosmic rays reaching our atmosphere. Tony Phillips is quietly gathering evidence that might later influence NASA’s position on anthro-climate forcing, once the progressive scientologists are purged from its ranks.
What does this mean for California?
Carbon taxes and large government expenditure on solar and wind. Repeat as needed.
Don’t forget the Toy Trains from Nowhere to Nowhere else.
g
California will still enjoy all four of it’s seasons: drought, fire, mudslides and earthquake.
And a bonus season called elections
We Have the KFC Bird Fry Season too; or izzat the Fly to Fry Season ??
g
This is a direct cause of CO2 emission and pipeline expansion across the continent. When will man be stopped!
You are wrong about this. CO2 does not influence the sunspots.
Your sarcasm detector needs to be recalibrated.
Yes, I agree with Leif. If intended as sarcasm, add a /sarc at the end of such comments.
Well, stars like the sun do make carbon and oxygen.
/sarc
I can’t believe you guys didn’t catch that……….
So, it’s just because of the pipeline expansion?
May the Sioux save us all!
/s <– seriously? I have to put that now? It wasn't even subtle sarcasm, it was blatantly sarcastic.
This is a blog about the science, not to be polluted by sarcasm.
Oh come on guys, even I got that one. Everyone needs ti chill.
I’m amazed Leif!
I thought CO2 could do anything!
/SARC/
This is a blog about the science, not to be polluted by sarcasm….
You mean your past posts were not sarcasm!!!!!
😉 <<< WINK
polluted by sarcasm?
Sheesh.
Large number of sarcastic comments self deleted.
lsvalgaard You are wrong about this. CO2 does not influence the sunspots
Now stop this Leif. You are just throwing bait to the Carp for a ‘rise’…
Oops! Did I forget a /sarc ?
Grandparent actually said the quiet sun was a “direct _cause_ of CO2 emission”, not a result of CO2 emission.
I think cold weather does cause anthropogenic CO2 emission (running the heater). But then, so does hot weather (running the AC).
KB, across the world’s population, the airconditioner owners are a small minority compared to those with access to heating in cold weather.
Man releases Copious CO2. –>Earth’s atmosphere warms.–> The atmosphere expands. –>Earth spins slower. –> Magnetic reconnection to the solar plasma is more efficient –> Angular momentum is transferred from the sun to the Earth. –> The Sun slows its spin. –> Magnetic flux tubes rise more slowly as the twisting of ploidial magnetic fields slows –> fewer sunspots.
IOW, the microbial flagella on the flea on the dog’s tail wags the dog.
If you look at the forces and energies involved, you will find that your chain does not hold up.
What does hold up Leif?
The world is full of stuff. If you have something particular in mind, bring it up and we can discuss it.
/phantasmorphic amounts of sarcasm requires phantasmorphic amounts of BS.
Bring on your BS.
RE: BS.
See Vuke (below).
Is the BS his or yours?
Leif wrote:
Frequently here on WUWT and other blogs, that same harsh analysis of the CO2-CAGW hypothesis is shown. But that doesn’t stop NOAA, NASA and other climatists though with their climate alarmist BS.
I’m Tired of the climate BS and lies.
But I’m afraid we’ll be subjected to 4 more years of even more intense BS and lies with POTUS HRC.
People have the politicians they deserve [having voted them in]…
How about a complex climate system interaction over a long term scale? We seem to look for instant answers and they all fail. What does the next 50 years hold based upon our current situation? The world does hold much stuff, no? How about, could the impact of phytoplankton in the Southern Hemisphere have more impact than anything we’ve seen yet? How does deep water brine currents impact the SAL via the Monsoon cycle and the S American rain forrest fertilization? Just sayin 😉
People [and politicians] are enamored by simple [and simplistic] explanations. Now many aspects of climate are actually simple, while others are very complicated. Critical to all explanations is that they are quantitative, i.e. that they deliver numerical predictions that can be tested [and falsified]. We might on day be bale to explain the climate, but we are not there yet.
Leif wrote, “People have the politicians they deserve [having voted them in]…”
Does that include dead voters? illegal alien voters?
If a people allow such things, they doubly deserve what they get…
“IOW, the microbial flagella on the flea on the dog’s tail wags the dog.”
Leif, you missed this line.
The line does not apply as the sun lags the nervous system that the dog has.
its actually two other gasses Hydrogen and Helium /sarc
The Sun !
What he make Hydrogen out of ??
g
Hi Big G.
In my parts of the universe The Sun is to say least an interesting tabloid, but of course we have The daily Star too. /sarc
Read carefully what he said, i.e., that the decreased sunspot activity is the cause of CO2 emission and pipeline expansion. If the weather were to get colder and people burned more fuel, it would be true, although the effect might be negligible.
Thumbs up for you! My bad word play has caused a sarcasm to be a truth.
Well you know this just proves that Global Warming is Real.
Because Science!!!, says Neil Tyson.
Somebody has their color spectrum out of whack there.
So white lies between purple and red ??
g
La Niña can be quite strong.
http://www.tropicaltidbits.com/analysis/ocean/nino34.png
Very high pressure in the Arctic.
http://pamola.um.maine.edu/fcst_frames/GFS-025deg/DailySummary/GFS-025deg_WORLD-CED_PMSL.png
Polar vortex.
http://www.cpc.ncep.noaa.gov/products/stratosphere/strat_a_f/gif_files/gfs_z10_nh_f00.png
Sun’s magnetic field.
http://wso.stanford.edu/gifs/DipallR.gif
We’ll have October number tomorrow, watch this space.
For the moment suffice to say the magnetic dipole (polar field) strength has stalled, while it was suppose to power ahead towards maximum as the sunspot number is heading towards minimum.
Not correct. The south polar fields have stabilized, the north is still increasing:
http://jsoc.stanford.edu/data/hmi/polarfield/
http://www.leif.org/research/HMI-Polar-Fields-Growth.png
The arrow shows positive polarity on its way to the north pole.
It helps if one knows a bit about what is going one.
It helps if one knows a bit about what is going one….<- sarcasm pollution alert
/SNARK
lsvalgaard October 31, 2016 at 12:09 pm
Not correct. The south polar fields have stabilized, the north is still increasing:
http://jsoc.stanford.edu/data/hmi/polarfield/
__________________________________
Did you look at the amount negative flux ah just ahead of your arrows tail? That positive flux has made some feeble attempts to strengthen and push northward, but but looks like there is still troubles ahead. Still has a lot of pink mixed with light blue at the northern lats Dr. S.
Hasn’t the mixed polarity been the issue this cycle for the movement of positive flux northward? A cancelling out of the positive flux?
Ya know it appears as though the high speed solar wind streams from coronal holes don’t have much of an effect on pushing out the galactic cosmic rays (GCR). Solar cycle 24 has shown us a new continuous higher level of them.
From Anthony’s link above:
http://www.vencoreweather.com/blog/2016/10/24/2016-2017-winter-outlook-by-vencore-weather
…Low solar activity
Research and empirical observations have shown that low solar activity tends to be correlated with frequent high-latitude atmospheric blocking patterns …
…The “analog years” plot (below) shows upper-level height anomalies in previous low solar activity years (i.e., during solar minimum phases) and high pressure tended to dominate near Greenland and Iceland (orange, red regions) which typically leads to sustained cold air outbreaks into the eastern US. Based on the actual results of these previous low solar activity years, odds would favor high-latitude blocking scenarios this upcoming winter season given the strong likelihood for low solar activity to continue….
It would appear as though the northern polar vortex has already set the stage of some of what the Vencore prediction discusses at the link above.
Link below to Earth Wind map, depicting current northern polar vortex.
https://earth.nullschool.net/#current/wind/isobaric/10hPa/overlay=temp/orthographic=-94.17,89.76,455/loc=-16.131,84.586
And quite visible at 70 hPa also.
https://earth.nullschool.net/#current/wind/isobaric/70hPa/overlay=temp/orthographic=-94.17,89.76,455/loc=-16.131,84.586
Hasn’t the mixed polarity been the issue this cycle for the movement of positive flux northward? A cancelling out of the positive flux?
Such mixings are a feature of every solar cycle. See, e.g. Slides 22-24 of
http://www.leif.org/research/Asymmetric-Solar-Polar-Field-Reversals-talk.pdf
The polar vortex is predicted to split unusually early in only two weeks bringing very cold weather to Eastern NA. Expect a cold, snowy December.
Has nothing to do with the Sun, so is not very relevant.
Ozone is the largest absorber of galactic radiation.
http://sol.spacenvironment.net/nairas/Dose_Rates.html
The magnetic field and the solar wind have much in common with the distribution of ozone over the polar circle.
http://www.cpc.ncep.noaa.gov/products/stratosphere/strat_a_f/gif_files/gfs_o3mr_01_nh_f00.png
Ozone is diamagnetic and is repelled by the magnetic field.
ren, i really wish you would write a guest article here detailing your research . you post some great information, but it is fragmented throughout several comment streams.
Yet another chance to see if sunspot numbers relate to weather, despite apparently not greatly affecting total solar output.
Isvalgaard thinks this solar cycle will not be as deep as many think. So I am keeping track of that. I’m also keeping track to see if that might be true because some have suggested that the position of the larger planets affect the solar cycles and climate. From planetary positions, it doesn’t look like it will be that deep or long. So I’m watching that. I’m also watching the cosmic ray activity in relation to co2. I saw that there is a difference in lag/lead time on cosmic rays between odd and even solar cycles. This should be a very interesting solar cycle. And of course we will all be watching TSI.
Geomagnetic field has been rather active during last week or so (see here) charging upper atmosphere, concentrating atmospheric pressure excursions on the earth’s magnetic two N.H. maxima.
http://www.vukcevic.talktalk.net/GMFz.jpg
http://www.cpc.ncep.noaa.gov/products/stratosphere/strat_a_f/gif_files/gfs_z10_nh_f00.png
In the winter months this leads to polar vortex splitting up, bringing cold winters to the N. Hemisphere.
Above is very similar what happened in Jan 2013 and Jan 2009, both cold winters more here, but this one is too early in the year
The geomagnetic field on those time scales have nothing to do with the climate. Perhaps you forgot a /sarc ?
Looks like leif’s pride has been stung.
Even though the sun has been quiet spot wise in the past week we got hit by a solar wind stream from a hole and a filament as well. As these events disturb our magnetic field, I suspect you should see resulting geomagnetic field responses. If these can translate in to high and low pressure systems … I just don’t know. I think we put blinders on when we only deal with sunspot numbers for our solar activity indicator.
The sunspot number is a good proxy for just about everything solar. What other indicator would you suggest?
F10.7 is better. But you know that.
F10.7 and EUV and Cosmic Rays all follow the sunspot number:
http://www.leif.org/research/EUV-Magnetic-Field.pdf
So the sunspot number [going back 400+ years] is still the indicator with the farthest reach.
I seem to recall your F10.7 estimation based on a measured East component of Earth’s magnetic field.
F10.7 is not subject counting/area effects of spots. Also as the umbral field may decline, surface spots may disappear from the photosphere surface. But the magnetic cycles underneath still continue but without flux tubes breaking the surface to darken the optical band.
F10.7 tells us what is happening inside the magnetic inductive cookstove whether there are spots or not.
F10.7 is indeed as very good measure of solar activity. see e.g. http://www.leif.org/research/EUV-Magnetic-Field.pdf , but correlates very well with the sunspot number. Going back before 1740, the sunspot number is what we have [back to 1610], so the sunspot number is important. Understanding how the sun makes sunspots has made great progress lately, and we are getting better at teasing out a measure of solar activity from the sunspot count [once we get the count right].
This graph shows how well the solar microwave flux [of which F10.7] is a part and the sunspot number [the black curve] match each other:
http://www.leif,org/research/Solar-Microwave-Flux-Nobeyama.png
http://www.leif.org/research/Solar-Microwave-Flux-Nobeyama.png
Polar vortex at a height of 45 km.
http://www.cpc.ncep.noaa.gov/products/stratosphere/strat_a_f/gif_files/gfs_z01_nh_f00.png
Polar vortex at 10 hPa
https://earth.nullschool.net/#current/wind/isobaric/10hPa/orthographic=-6.25,91.48,431
Splitting of polar vortex is an important winter event for the N. Hemisphere.
http://eoimages.gsfc.nasa.gov/images/imagerecords/36000/36972/npole_gmao_200901-02.mov
Vuc, you are right about it being early. It is unprecedented, actually, and bodes ill for Canada (again). Waterloo dropped to -34.5 C last time.
The prediction is (link I found on this list) that the vortex will split about 15 Nov and the cold will spill south starting in the East. It is already below normal in Siberia and the snow is spreading West.
I figure the UK is shafted this winter. The engineers predicted that the grid will start collapsing this winter and it was said before knowing it would be unseasonably cold.
You sure get around!
OMG! Globull Worming/Climate Change/Climate Disruption/Catchphrase du Jour is causing the sun – and the earth – to cool!
We’re all gonna freeze (and die)!
/Do I really have to?
/yes
The front page of http://www.spaceweather.com/ shows that there was 1 spotless day in 2014, so the July 4th spotless day was not the first since 2011. — John M Reynolds
Is galactic radiation will grow?
http://pics.tinypic.pl/i/00835/90i8ff596l1m.gif
No, and Oulu [that you show] is abnormal. Here is a better graph:
http://www.nwu.ac.za/sites/www.nwu.ac.za/files/files/p-nm/SRU%20Neutron%20Monitors%20Monthly%20Graphs.pdf
lsvalgaard October 31, 2016 at 5:24 pm
_________________________________
Dr. S., your link is all African Neutron Monitors. Myself, am in the Northern Hemisphere, and I use Moscows Neutron Monitor. I always figure that the Moscow monitor will be as accurate as it can get. Just cause it is… Moscow. lol
Here is a NH monitor [Climax]
from https://www.ngdc.noaa.gov/stp/solar/cosmicrays.html
South Pole Neutron Monitor
Real-Time Data
http://neutronm.bartol.udel.edu/realtime/southpole.html
the climate has been quite unpredictable this days….
I think overall, the climate has been very predictable.
In fact, the maps created by Koppen over a hundred years ago are still quite representative of the various climate regimes on the Earth.
Weather, on the other hand, can be rather difficult to predict more than a few days in advance.
Sure
Climate or weather?
Climate is very predictable to 30-50 years..
Weather is unpredictable beyond 7 days.
This map shows the difference (in cm) between the current daily snow depth and the average value over the 1998/99 through 2011/12 time period. Areas where the current snow depth is within ±5 cm of the historical average are shaded gray. The thick red contour line indicates the historical location of the snowline (50% probability of snow depth ≥ 2 cm).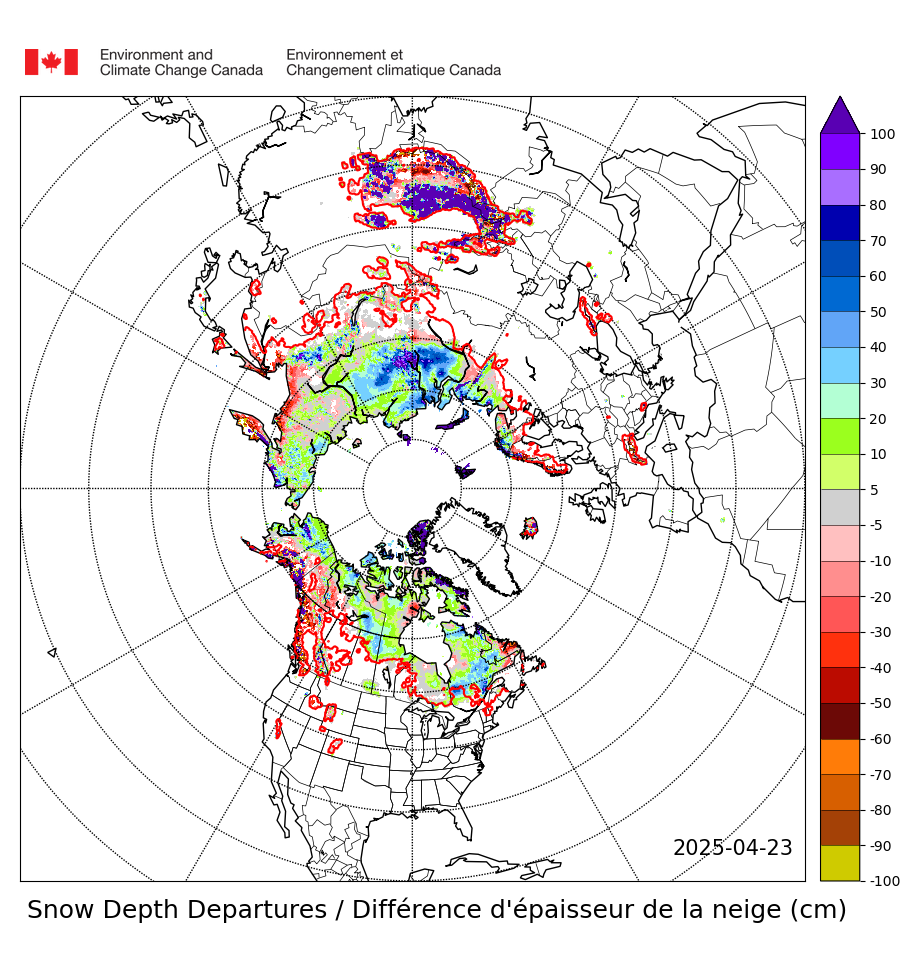
Reblogged this on Climatism and commented:
Ssshhh! Don’t mention the sun. It’s not a climate driver according to the UN IPCC who are tasked to link only your CO2 emissions with climate change and tax you accordingly, in order to stop bad weather.
I always enjoy these low/no sunspot picture posts. It reminds me that my monitor needs a good cleaning a little more often.
Good post. I tried to clean off that one little sunspot on this laptop..
Excellent discussion from Vencore weather on their Winter outlook.
Been watching for changes in the strong southern stream coming out of the Pacific which has been steering very mild, oceanic origin air masses bodily across the US from west to east thru October.
This despite a pretty stout -AO and -NAO. The northern stream and colder air associated with that has been mostly deflected by the above feature. There have been a few brief intrusions of chilly air in the Northeast quadrant of the US but are quickly blown out by the southern stream coming from the Pacific.
For sustained cold to finally arrive, we need the southern stream to either buckle strongly in the east Pacific, forcing an upper ridge to build downstream in western North America or for the pattern this week, with upper level ridging in the center of the country to retrograde and line up closer to the West Coast………especially if the upper ridge can extend into higher latitudes of western Canada.
There have been numerous “false alarms” from week 2 models over the last 5 days, suggesting this is starting. However, there has not been any follow thru as updated models with fresher guidance has often reverted back towards the recent pattern. “Some” of the latest guidance continues to suggest ridge building in western North American as we head towards the middle of November.
http://mp1.met.psu.edu/~fxg1/ENSHGT_12z/f384.gif
Those previous maps were the 500 mb forecast at 384 hours from the 12z GFS. Ensembles.
I would give more weight to things like neutron counts when it comes to solar magnetic activity and maybe proxies like 10Be and 14C going back over time than to observations of sunspots. While there certainly is some correlation between spot counts and solar magnetic activity, I am not convinced that they are as tightly coupled as would be measurements of GCRs reaching Earth orbit (assuming that GCR density is uniform over time though they appear to be over the duration of the Holocene). One reconstruction that fascinates me is this from Steinhilber et al. (2012)
http://solarphysics.livingreviews.org/Articles/lrsp-2013-1/fig_20.html
(as excepted from “A History of Solar Activity over Millennia”
Ilya G. Usoskin )
http://solarphysics.livingreviews.org/Articles/lrsp-2013-1/articlese3.html
Was this really posted by Antony or is it David Archibald?
/ sarc
I think we should look to the sun’s primary variability and the secondary climatic effects associated with that solar variability moderated by changes in the strength of the earth’s geo magnetic field, and lunar influences.
These factors bringing the terrestrial items that influence the climate either toward a warmer mode or cooler mode, and if these terrestrial factors are pushed far enough in one direction or another climatic thresholds could be reached which result in a complete reorganization of the climate.
THE TERRESTRIAL ITEMES
changes in atmospheric circulation patterns
changes in oceanic current patterns
changes in frequency of major volcanic activity
changes in sea surface temperatures
changes in global cloud coverage
changes in global snow coverage
changes in global sea ice coverage
Milankovitch Cycles yes, Continental Drift yes they do cause the climate to change but that is in the big very gradual climate change picture but these forces can not and do not explain all of the many abrupt climatic changes which have sometimes according to Ice Core evidence taken place in a decade or two. I mean swings of 4 or 5 or 6F, not necessarily for the entire globe but at least in the northern latitudes of the N.H. which is significant enough.
If the solar parameters reach the criteria I have called for which is more likely then not the global temperature trend will be down.
Already the just like in the period of 2008-2010 when solar activity was very low the AO is responding to negative values once again.
The historical climatic record supports all of my views until I am shown otherwise through data past or present my views remain unchanged and if anything even more certain.
By what measure or location are they expecting colder than average winter? So far, Denver has been enjoying summer part two, with a few records set for high temps. According to the Climate Prediction Center (nearly as accurate/useful as an unpopular politician (exercise left to the reader)), they are showing a much warmer than usual winter for most of the lower 48 states.
Yes I understand the lower 48 is roughly only 2% of the earths surface, it can’t be the only spot to use less energy in a warmer winter.
Northern solar polar field build up seems to be slowing some.
What desperation can make you say…
There is no evidence of that.
Somewhere around the year 1600 began the earth’s magnetic revelsal. Currently, the earth’s magnetic field is weaker by about 20% .This means that during the upcoming Grand solar minimum, more cosmic rays will enter our atmosphere.
Difficult to say, according to various estimates the last 3000 years earth magnetic dipole was loosing some of its strength, while in the previous 3000 years it was gaining. Field strength now may be about the same as it was around 2500 BC (CALS10K estimate – thick red line), the time the Egyptian Great Pyramid was built. It was at the time of one of two Holocene’s climate’s optimal periods.
http://www.vukcevic.talktalk.net/GMF-Ds.gif
Somewhere around the year 1600 began the earth’s magnetic reversal. Currently, the earth’s magnetic field is weaker by about 20% .This means that during the upcoming Grand solar minimum, more cosmic rays will enter our atmosphere.
That’s going to leave a mark or make for a very cloudy period (Svensmark).
It is not a given that another Grand Minimum is upcoming…
A spotless sun in 2017 will produce a cool NH summer like 2009 but with much less ocean heat content than that earlier case. See for multivariate comparison…
1) Global monthly heat content anomaly (GJ/m2) in the uppermost 700 m of the North Atlantic (60-0W, 30-65N)
2) Niño 3.4 region (5oN-5oS, 120o-170oW)
Therefore, look to the winter of 2017-18 for the real deal.
It will be a unique winter.
http://www.cpc.ncep.noaa.gov/products/precip/CWlink/daily_ao_index/hgt.ao.cdas.gif
http://www.cpc.ncep.noaa.gov/products/precip/CWlink/blocking/real_time_nh/500gz_anomalies_nh.gif
The speed of the solar wind varies strongly.
http://umtof.umd.edu/pm/latest2day.imagemap?233,140
Real ice cover:
http://arctic.atmos.uiuc.edu/cryosphere/NEWIMAGES/arctic.seaice.color.000.png
8 Wadhams already!
Pavel, sorry, I don’t think that image is correct. Cryosphere Today has been knackered, to use the technical term, since March 2016. The real evidence is Hudson Bay: it never freezes this early. Of course, if the image really is correct, then we’re all doomed!
Rich.
In your dreams, not even close!
http://arctic.atmos.uiuc.edu/cryosphere/
Even a citizen observer who loves science has noticed all Cryosphere data seems to be useless. Give it up. Currently we have the lowest sea ice growth for an October in the satellite record. That’s not saying much since the real comparison should be against the entire Holocene, for which data is sadly lacking.
I’m with the we are going into a really bad winter cooling period crowd, but I’m quite ready to accept data from the other sources on the WUWT Sea Ice Page that doesn’t appear to be doctored. The real surprise is the DMI Arctic temperature chart which is doing some rather amazing things against the complete record they have.
Pavel as it says on the page you link to:
Special Sensor Microwave Imager and Sounder (SSMIS) on the Defense Meteorological Satellite Program (DMSP) F-17 satellite that provides passive microwave brightness temperatures (and derived Arctic and Antarctic sea ice products) has been providing spurious data since beginning of April. Working on resolving problem or replacing this data source.
If it were only true, but it isn’t.
Why in Hell would anyone want the Earth to be colder?
Someone who lives in Yuma, AZ, although we have finally dropped into the low 80’s for highs and it looks like we will stay there awhile.
@Tom – seriously, no one wants the earth to grow cooler except to prove the Global Warming watermelons are totally wrong. Obviously, increasing cold and long winters will cause large failures of crops in the Northern Hemisphere resulting in starvation rising in the world again. The only way to stop that is technological. Growing produce in mass scale greenhouses with CO2 at 1200 ppm. So there are solutions to either problem, global warming or cooling. One is nature’s bounty and the other is the bounty technology can bring. Both answers are now in play in the world’s food markets.
Any correlation between sunspots and temps, becomes ‘uncorrelated’ on a large enough time scale. The only correlation I’ve seen between solar activity and temps seems to be with TSI and then only .1K between max/min TSI.
But then, I’m just some guy, so don’t quote me (but feel free to prove me wrong.)
“The Sun unleashed a powerful flare on 4 November 2003. The Extreme ultraviolet Imager in the 195A emission line aboard the SOHO spacecraft captured the event.
Credits: ESA&NASA/SOHO
A solar flare is an intense burst of radiation coming from the release of magnetic energy associated with sunspots. Flares are our solar system’s largest explosive events. They are seen as bright areas on the sun and they can last from minutes to hours. We typically see a solar flare by the photons (or light) it releases, at most every wavelength of the spectrum. The primary ways we monitor flares are in x-rays and optical light. Flares are also sites where particles (electrons, protons, and heavier particles) are accelerated.”
http://www.nasa.gov/mission_pages/sunearth/spaceweather/index.html
I though Willis has pretty thoroughly trashed the suggestion that the climate changes in line with the solar cycle. He has written post after post describing how he has not found any evidence of any 11 year cycle in any temperature records or observations of other physical phenomena using his frequency analysis / fourier transforms.
With that stated, why are we so confident that it’s going to get cooler this time around?
We are talking about prolonged minimum solar periods not the 11 year so called normal sunspot cycle and the effects this kind of solar activity has upon her climate which shows up in the historical climatic record.
The key there is your statement of “prolonged” – fair enough.
My question is how can “continuation of low solar activity” (Vencore’s own statement) be taken seriously as a “key factor” for one band of coastline being 1.5-2.5C cooler for one single winter, when that sort of signal just does not show up in historical data?
http://www.drroyspencer.com/wp-content/uploads/TSI-est-of-climate-sensitivity2.gif
Dermot, this is a graph that Dr Spencer made for one of his posts that shows a relationship between the solar cycle and temps. This is detrended temperature data smoothed three years so that el ninos and la ninas cancel each other out. (the effect of pinatubo volcano cooling in the early 90s was also taken out) For whatever it’s worth, if the el ninos are entirely removed instead of smoothed the numbers would be more like .2C-.3C from min to max (as 2 of the 4 solar mins of this particular record had large el ninos coinciding)…
afonzarelli October 31, 2016 at 6:59 pm
Could we have an actual link instead of handwaving about the provenance of the graph?
w.
The variation over the cycle [approx. 0.1 C] is what is to be expected from the variation of TSI. It would be strange if there was not this relationship.
I visited the Vencore Weather website. It shows ND, MN upper Midwest warmer than normal and Gulf Coast colder than normal this winter. Don’t see how those of us that live in TX can be colder than normal and when the region that cold weather (i.e. polar vortex) passes thru is warmer than normal. By the way, one of the reference years, 1982, had one of the coldest January’s on record in ND.
Anthony says solar minimum will be in 2019 or 2020. 5’ll get you 10 that it will be at least 2021, i.e. Cycle 24 will exceed 12 years in length. I’m using the gradient-of-the-edge-of-the-butterfly-diagram method, by eye. Of course, my eye isn’t the most accurate instrument known to science…
Rich.
Yeah, Rich, i caught that, too. SC23 was about 12 years, i believe. The weaker the cycle the longer it is, so SC24 should be 12 years as well…
There are other forces out there that influence the suns weather as the sun influences Earths.
Leif, your comment
” It is remarkable that solar magnetic activity actually does not seem to care whether or not sunspots form, …”
doesn’t answer to
‘One other note, the weak solar cycle and the expectation for continued low solar activity this upcoming winter is an important factor in this year’s colder-than-normal Winter Outlook for the Mid-Atlantic region.’
hipshot ?
Headshot!
Leif, you really consist on being headshot.
Your term.
Your comment is hard to parse [problematic grammar and poor word choices].
Did you mean “you really live on being headshot” or ” you insist on being headshot?” The phrase “consist on” is bad grammar.
Thanks for the link
Winter Outlook for the Mid-Atlantic region
at Vencore Weather !
Down here in South West Australia we have had the longest coldest winter ever. There’s been a persistent plume of exceptionally cold sea surface water stretching from the deep Souther Ocean up and around us for about 6 months, about -2 degrees of anomoly, and our air temperatures both minimum and maximum have been about 2 degrees less than average. For old timers, it has been exceptional. It could be ‘just weather’ and a friend suggested it could be a plume of cold water from excessive ice melt in Antarctica, however perhaps it could also be the leading edge of a new ‘climate state’ of colder weather?
It happened exactly the same in the subtropical region of South America (Argentina, Uruguay, south of Brazil) with a record-breaking -3.5ºC anomaly in temperature during the months of May and June. The month of June is the 5th colder ever recorded (regular records beginning in 1910). According to meteorologists the meteorological (not astronomical) winter season has begun in the last week of April and lasted to the first week of October (5 months and a half). But even at the end of October there were recorded temperatures down to 0ºC at 800-1000m height in many places in the south of Brazil with frosts. Brazilian subtropical region (maximum height of 1400m) experienced more than 65 days of subzero (Celsius) temperatures wih high occurrence of frosts and many episodes of snowfall. Absolute lower temperature has reached -12ºC. Except for the occurance of the El Niño phenomena in 2014-2015 this 2016 winter season follows the same trends of other very cool winters like 2007 and 2013 – only that it was longer and colder. Explanations on a possible ‘melting ice’ in Antarctica are not backed by NASA recent studies that showed its icecap has been consistently growing since 1992. Anothe observational fact is that the number of insolation hours has decreased considerably from the last two winter seasons due to a sensible grow in cloud cover.
And then we have this;
http://www.smh.com.au/environment/weather/sydney-weather-heats-on-the-way-in-time-for-schoolies-20161031-gsf2uj.html
All I know is B.O.B. is getting lazy again, sleeping in later and later in the morning and going to bed earlier and earlier. Seems to happen every time, right around this time of year. Will it be a colder than normal winter… maybe. The willy worms were supposedly all black this year. But regardless, somebody needs to give B.O.B. a stern talking to… maybe Dr. Svalgaard can get B.O.B. on the couch so he can talk about his childhood, or something… maybe some medication for his bipolar disorder… At least the acne seems to be clearing up.
Well if there’s going to be a colder than normal winter in the southern U.S. it needs to hurry up and get here. Having upper 80’s highs and mid 60’s (F) and higher for almost all of October could mean that we don’t experience an Autumn here in Dallas. More than +6 degrees F for the month.
Joe Bastardi of Weather Bell Analytics says wait about two weeks and get ready to be surprised at the suddenness of the change.
Leif,
would you please accept nobody’s interested in your sunspots representations.
Move along.
[Note: I AM, and you don’t run this blog nor have the right to tell people to “move along” here. – Anthony]
“nobody’s interested in your sunspots representations.”
Yep, Anthony – just another example of the contempt that real experts in any field impacting climate research are held by *some* denizens.
And why, I suggest – those said experts are notable by there absence here.
I scan for “Leif” in any solar related thread since I value his insight and expertise a lot.
Actual facts and the state of science is the reason why I frequent Anthony’s blog. Not bandwagon cheering for some specific direction or agenda.
All this science stuff is great, but will it snow in Watford?
/.
lsvalgaard
What causes the temperature jumps in the upper stratosphere?
http://www.cpc.ncep.noaa.gov/products/stratosphere/temperature/05mb9065.png
https://en.wikipedia.org/wiki/Sudden_stratospheric_warming
“At times of high solar activity magnetic structures are carried outward on the solar wind. These structures scatter cosmic rays and reduce their flux in the inner solar system.
The reduction in cosmic ray flux tends to lag behind solar activity by 6- to 12-months (Forbush, 1954) but with significant differences between the even numbered and odd numbered cycles. In the even numbered cycles (cycles 20 and 22) the cosmic ray variations seen by neutron monitors lag sunspot number variations by only about 2-months. In the odd numbered cycles (cycles 19, 21, and 23) the lag is from 10 to 14 months. Figure 20View Image also shows that the shapes of the cosmic ray maxima at sunspot cycle minima are different for the even and odd numbered cycles. The cosmic ray maxima (as measured by the neutron monitors) are sharply peaked at the sunspot cycle minima leading up to even numbered cycles and broadly peaked prior to odd numbered sunspot cycles. This behavior is accounted for in the transport models for galactic cosmic rays in the heliosphere (cf. Ferreira and Potgieter, 2004). The positively charged cosmic rays drift in from the heliospheric polar regions when the Sun’s north polar field is directed outward (positive). When the Sun’s north polar field is directed inward (negative) the positively charged cosmic rays drift inward along the heliospheric current sheet where they are scattered by corrugations in the current sheet and by magnetic clouds from CME’s. The negatively charged cosmic rays (electrons) drift inward from directions (polar or equatorial) opposite to the positively charged cosmic rays that are detected by neutron monitors.”
http://solarphysics.livingreviews.org/Articles/lrsp-2010-1/fulltext.html
Maybe the temperature jumps in the stratosphere in the winter resulting to the sudden increase in N2O, a potent greenhouse gas?
http://www.cpc.ncep.noaa.gov/products/stratosphere/temperature/archive/10mb9065_2009.gif
Hi Ren
In my view it is most likely a winter time Kamchatka volcanic eruption, initiating surge of millions of tons of hot air pushing into troposphere/stratosphere boundary, then hole thing spreading around Arctic.
http://www.vukcevic.talktalk.net/SSW2012-13.gif
Antarctica has only one active volcano (Mt. Erebus) erupting very rarely, hence the Antarctica’s SSW is also a rare event.
SSW graph for the above
http://www.cpc.ncep.noaa.gov/products/stratosphere/temperature/archive/10mb9065_2013.gif
Abstract
Lidar measurements of atmospheric temperature profiles and aerosol backscatter ratio and depolarization have been carried out at Thule (76.5°N, 68.8°E), Greenland, in the period January – early March 2009. The Lidar, installed at Thule in 1990, is part of the Network for the Detection of Atmospheric Composition Change (NDACC). During winter 2008-2009, Lidar profiles were acquired on a regular basis with a maximum of 5-6 hours of measurements per day, except for a few periods characterized by poor weather conditions or instrumental problems. A total of 44 Lidar temperature profiles between 25 and 70 km were obtained during the measurement campaign. Radiosonde data obtained at the stations of Eureka (79.9°N, 85.9°W) and Alert (82.5°N, 62.3°W) were used to derive temperatures below 25 km. Lidar temperature profiles have permitted to show the evolution of the stratospheric thermal conditions. During the first part of the campaign, in mid-January 2009, the polar vortex was still present above Thule. A polar stratospheric cloud (PSC) of NAT particles was detected on January 17 and 18 between 17 and 19 km. The major sudden stratospheric warming (SSW) was observed during the second half of January. The warming affected the upper stratosphere (~ 40-45 km) first, and then propagated rapidly from the upper to the lower stratosphere. The temporal evolution of the stratospheric temperature was derived at fixed potential temperature levels between 500 and 1500 K. Lidar data show the first signs of the warming at the 1500 K level (~ 42 km) on 22 January, after a week of instrumental problems that prevented from carrying out measurements. After 2-3 days, the warming reached 1000 K (~ 34 km), 900 K (~ 32 km) and 800 K (~ 29 km), and after 5-6 days it reached 600 K (~ 23 km) and 500 K (~ 20 km). Comparison of Lidar data with CIRA model profiles indicates that during the SSW the measured temperature between 25 and 45 km altitude exceeded by 40-50 K the expected CIRA values, reaching a maximum of ~290 K at 40 km. The intensity peak of the SSW was observed between 22 and 24 January. The warming produced an abrupt and irreversible break of the polar vortex. Comparison of 2009 data with Lidar atmospheric temperature measurements obtained during several years between 1994 and 2007 indicates that the 2009 SSW was the strongest event ever observed by the Lidar at Thule.
http://adsabs.harvard.edu/abs/2009AGUFM.A21C0202D
re: comment @ 12:35 pm
I consider that a strong volcanic eruption is an essential precondition but meridional direction of the jet stream may take plum to SE direction far away from the Arctic, others have to be cold troposphere (winter) so plum of warm air would rise to a rich tropopause (which in the Arctic could be less than 10 km in winter, Jan 2009 Shceveluch , ash plumes rose to an altitude of 8.8 km)
Here is Jan 2009 graph at lower latitude @7hPa
http://www.cpc.ncep.noaa.gov/products/stratosphere/temperature/archive/70mb9065_2009.gif
Shceveluch sent 8.8 km high plume 7th Jan at the start of SSW.
In the upper stratosphere lock formed over Siberia, not over the Kamchatka.
http://www.cpc.ncep.noaa.gov/products/stratosphere/strat_a_f/gif_files/gfs_t05_nh_f00.png
Hot air surge starts from Kamchatka, it is not rising vertically but it is moved by jet stream spiralling anticlockwise around the globe upwards
http://www.vukcevic.talktalk.net/KE.jpg
.
Ren, animation and the Sudden Stratospheric Warming graph I presented are for Dec 2012-Jan 2013.
This video shows Tolbachuk eruption in December 2012
Hi, Vukcevic
Lidar and GBMS measurements at Thule observed
the occurrence of the major SSW, sampling air inside
the polar vortex at first and following the propagation
of the SSW down to the lower stratosphere afterwards.
The contour plots in Figures 14, 15, and 16 show the
changes of the atmospheric chemical composition over
Thule and temperature associated with the SSW. Figure
14 shows a sudden increase in N2O mixing ratio
(mr) which occurred on January 24 at around 35 km altitude
and over the whole stratosphere between days
26 and 28. At higher levels, the vortex splitting and the
vortex edge transit over Thule was marked by a rapid
decrease in CO mr. CO data (not shown) indicate that
in the upper stratosphere (45-50 km) the vortex broke
up over Thule on January 19-20.
http://www.earth-prints.org/bitstream/2122/9123/1/2014ann_geoph_muscari.pdf
Abstract
[1] The 2009 Arctic sudden stratospheric warming (SSW) was the most intense event of this kind ever observed. Unique ground-based measurements of middle atmospheric profiles for temperature, O3, CO, and N2O obtained at Thule (76.5°N, 68.8°W), Greenland, in the period January to early March are used to show the evolution of the 2009 SSW in the region of its maximum intensity. The first sign of the SSW was detected at θ ∼ 2000 K on 19 January, when a rapid decrease in CO mixing ratio took place. The first evidence of a temperature increase was observed at the same level on 22 January, the earliest date on which lidar measurements reached above ∼50 km. The warming propagated from the upper to the lower stratosphere in 7 days and the record maximum temperature of 289 K was observed between 1300 and 1500 K potential temperature on 22 January. A strong vortex splitting was associated with the SSW. Stratospheric backward trajectories indicate that air masses arriving at Thule during the warming peak underwent a rapid compression and an intense adiabatic warming of up to 50 K. The rapid advection of air from the extratropics was also occasionally observed to produce elevated values of N2O mixing ratio. Starting in mid-February the temperature profile and the N2O mixing ratio returned to the prewarming values in the mid and upper stratosphere, indicating the reformation of the vortex at these levels. In late winter, vertical descent from starting altitudes of ∼60 km is estimated from CO profiles to be 0.25 ± 0.05 km/day.
http://onlinelibrary.wiley.com/doi/10.1029/2010JD014070/full
Vukcevic
Kamchatka volcanoes are still active, and the sudden warming of the stratosphere occurs suddenly.
It would have to be a a super explosion that would be very visible.
In addition, the vortex is tapered from two sides.
Ren
Thanks for the link, interesting article, will study it in a more detail. On page 10 states: “ In mid-January of 2009, however, the most intense sudden stratospheric warming (SSW) ever observed occurred ….”
Here are some relevant details for January 2009:
“January 2009 KVERT reported that seismic activity at Shceveluch (rem: Kamchatka volcano) was above background levels during 2-9 January. Based on interpretations of seismic data, ash plumes rose to an altitude of 8.8 km (28,900 ft) a.s.l. on 7 January and to an altitude of 5.7 km (18,700 ft) a.s.l. on the other days during the reporting period.”
Quote is from this link: https://hal.archives-ouvertes.fr/file/index/docid/563477/filename/SSW.pdf
take a look some time; number of SSW events are analysed.
sorry, I posted my in a wrong place, see further above @ 3:20 pm
ren
This may help create more understanding. https://hal.archives-ouvertes.fr/file/index/docid/316449/filename/angeo-16-1212-1998.pdf
Geophysical phenomena during an ionospheric modi®cation experiment
at Tromsù, Norway
N. F. Blagoveshchenskaya1, V. A. Kornienko1, A. V. Petlenko1, A. Brekke2, M. T. Rietveld3
1 Arctic and Antarctic Research Institute (AARI), 199397, St. Petersburg, Russia
2 Auroral Observatory, University of Tromsù, N-9037, Tromsù, and The University Courses of Svalbard, Svalbard, Norway
3 EISCAT, N-9027 Ramfjùrdbotn, Norway
Received: 13 October 1997 / Revised: 11 May 1998 / Accepted: 26 May 1998
“1 Introduction
Between 1980±1997 a large number of ionospheric
modi®cation experiments have been performed using
the HF heating facility located at Ramfjùrdmoen near
Tromsù, Norway (Rietveld et al., 1993; Stubbe, 1996).
Many eorts have been made to study experimentally
and theoretically the ionospheric modi®cation produced
by powerful HF radio waves.”
“Results of the Tromsù heating experiment in the
nightside auroral ES region clearly show the evidence on
the modi®cation of the ionosphere-magnetosphere cou-
pling during magnetospheric substorm, produced by
powerful HF radio waves. The distinctive behavior of
the auroral ionosphere as well as ®eld-aligned currents,
precipitating particles, ionospheric convection, and
substorm current wedge system signi®cantly control
the type and properties of observed phenomena. It must
be underscored that the heating of the auroral iono-
sphere, essentially during magnetospheric substorms,
leads to the generation of the new phenomena including
trigger eects not encountered in the dayside, undis-
turbed ionosphere.
Magnetic data from IMAGE network show that the
®rst substorm activation started at 20.00 UT and
coincided exactly with the Tromsù heater turning on. “
ren and vukcevic
Is this a visual of what those tests in 1994 would look like on November 9, 2009 https://www.youtube.com/watch?v=G77nRwfnyeY
Vukcevic what was the level of ionization by GCR stratosphere in winter 2008/2009?
http://images.tinypic.pl/i/00835/txpx5x4a6cnr.gif
I think that might have occurred much N2O.
“N2O is a greenhouse gas with a large global warming potential (GWP). When compared to carbon dioxide (CO2), N2O has 298 times the ability per molecule of gas to trap heat in the atmosphere”
Abstract. The Specified Dynamics version of the Whole Atmosphere Community Climate Model (SD-WACCM) and the Goddard Space Flight Center two-dimensional (GSFC 2-D) models are used to investigate the effect of galactic cosmic rays (GCRs) on the atmosphere over the 1960–2010 time period. The Nowcast of Atmospheric Ionizing Radiation for Aviation Safety (NAIRAS) computation of the GCR-caused ionization rates are used in these simulations. GCR-caused maximum NOx increases of 4–15 % are computed in the Southern polar troposphere with associated ozone increases of 1–2 %. NOx increases of ∼ 1–6 % are calculated for the lower stratosphere with associated ozone decreases of 0.2–1 %. The primary impact of GCRs on ozone was due to their production of NOx. The impact of GCRs varies with the atmospheric chlorine loading, sulfate aerosol loading, and solar cycle variation. Because of the interference between the NOx and ClOx ozone loss cycles (e.g., the ClO + NO2+ M → ClONO2+ M reaction) and the change in the importance of ClOx in the ozone budget, GCRs cause larger atmospheric impacts with less chlorine loading. GCRs also cause larger atmospheric impacts with less sulfate aerosol loading and for years closer to solar minimum. GCR-caused decreases of annual average global total ozone (AAGTO) were computed to be 0.2 % or less with GCR-caused column ozone increases between 1000 and 100 hPa of 0.08 % or less and GCR-caused column ozone decreases between 100 and 1 hPa of 0.23 % or less. Although these computed ozone impacts are small, GCRs provide a natural influence on ozone and need to be quantified over long time periods. This result serves as a lower limit because of the use of the ionization model NAIRAS/HZETRN which underestimates the ion production by neglecting electromagnetic and muon branches of the cosmic ray induced cascade. This will be corrected in future works.
http://www.atmos-chem-phys.net/16/5853/2016/
So solar activity has been declining since before 2000 and yet temp series are still going up.
This surely indicates that the main driver of climate currently is not solar activity. If you accept its warming, you can’t pin it on the sun.
(And if you don’t and don’t believe in surface temps, where’s the evidence of an influence of declining activity on temp series??)
That’s not right Griff. Up until last the last solar cycle ,solar activity was high. It was forecast to be the same. The solar activity during max was featured with double peaks. Then we had a very prolonged year of quite. All during this time the warmist were proclaiming hottest ever, yet the southern hemisphere was unusually cold ( let’s cook the books ) or at least spin in in favor of global warming. No where near the modeled rises.
I am with holding my enthusiasm for this solar cycle until I see how it progresses and the results. A deep and prolonged solar min with corresponding cold would be good for the skeptical argument, bad for the planet.
The problem I see is that during the last solar min, warmist airbrushed away any cooling. No matter what, it should be interesting.
I understood the long-term decline in solar activity set in after the last grand solar maximum peaked in 1956?
There was a decline beginning in the late 1960s thru the last half of the 1970s. Solar activity picked up again and was fairly strong until the great quite happened. That’s the way I read it.
This solar cycle may not be as strong or as deep as the last one. So I don’t know if we will have any definitive answers. Co2 ppm per year also seems to have a cycle based on solar cycle and cosmic rays. I would expect that co2 ppm/year will not exceed the current ppm/year this year until the next solar cycle.
I think there has been an underlying warming trend. Whether we are going to experience a new regime remains to be seen.
Temperature change probably lags by a considerable period of time (>10 years) and the oceans are large thermal flywheels. Temperatures are not really “still going up” so much as we had an El Nino event that spiked them for a bit but if you remove that event from the record, temperatures have been pretty flat to slightly declining. I would say to give it another 10 years or so before you decide. People don’t seem to understand that El Nino is basically a cooling event in that it is the dumping of a huge amount of ocean heat into the atmosphere. La Nina events are when the oceans are re-charging with energy. This La Nina is looking pretty weak so we might not get much of a “recharge”. Remember that the atmospheric temperature at various ground stations might not be a good indication of the amount of heat in the entire system. Most of the heat is in the oceans and the air temperature depends quite a but on how much heat transfer is taking place between the two.
As promised further above:
The latest sunspot number (as in the classic Wolf data files used in all existing solar studies up to July 2015)
for October is down from September by nearly 8 points to 23.5
the graph is here
(Svalgaard number is at 33.6)
The official international sunspot number for October is 33.6.
The old Wolf-scale number would then be 0.6*33.6 = 20.2, but one should not use the old [flawed] scale anymore.
Thanks doc
I’ll do an instant correction to the wording and the graph
Correction to my comment (November 1, 2016 at 4:27 am):
Sunspot Number (SSN) for October is down to 20.2
the graph is here
(Svalgaard number is at 33.6)
But it is wrong to use the old scale for anything. The SILSO official number corrects known flaws in the old version.
There are hundreds of papers written using the ‘classic’ Wolf numbers. Many scientists would like to investigate, move forward or challenge how solar, climate and many other events, considered in those papers would project to the present day and beyond.
Do you suggest that all past papers published in the numerous monthly, quarterly or annual magazines using the Wolf sunspot number should be ignored or even better burned on the fifth of November bonfires?
I would strongly disagree ! !
What should be done is to repeat the analysis with the revised sunspot [and group !] numbers, as many scientists are beginning to do already. Now, many of the old papers are junk and so would perhaps better be consigned to the fire. If researchers have faith in their old papers, they should not fear using the revised numbers. Since the old numbers are not updated, they cannot be carried forward. The 0.6 is only approximate so cannot be applied blindly.
An example of re-analysis: http://adsabs.harvard.edu/abs/2016SoPh..291.2457G
Antarctic sea ice levels are the second lowest on record for the date.
Likewise, NH sea ice is currently setting new lows for the day as well.
See: https://sunshinehours.net/ for Oct 31.
Global sea ice levels had been pretty stable for the past several decades, rising in the SH when decreasing in the NH. They are now by a distance the lowest ever for the day. That is a new development which should be noted.
More SH ice is an indication of CAGW, Less SH ice is an indication of CAGW. What, exactly, is not an indication of CAGW?
yes, more sea ice in Antarctica due to changed wind patterns etc could be a sign of warming. Climate change associated with warming is not just an even increase in temps across the globe
and your explanation for record lows for this time of year in the arctic is ???
Answer: When the gov’t finds itself out of excuses on how to explain there is no CAGW. So it must be CAGC (cooling), and we must spend some money to study that further, fund some grants…and suddenly many scientific papers appear proving global cooling is real and it is caused by humans.
Griff, the low arctic sea ice for the time of year can be explained by weather systems. Just like the arctic was unusually warm, Russia and large parts of Europe were unusually cold. The ice will sky rocket after a week or so. The burden on proof is on you to show that those weather patterns were caused by Co2 emissions, not for others to prove it wasn’t Co2.
That headline should read: “Sun quiet again as colder than normal winter approaches some parts of the USA.”
Treat Sunspots as fun observations. Treat TSI as interesting, but not completely measuring energy reaching the surface of the Earth. Isvalgaard ->”Now, many of the old papers are junk and so would perhaps better be consigned to the fire.”
Use modern data gathering techniques that actually give a great PROXY for energy reaching the Earth’s Surface: the 10.7 cm Flux. Note: as shown by Isvalgaard research, a strong correlation to the Sun’s [Internal] magnetic field and therefore, energy.
“Treat TSI as interesting, but not completely measuring energy reaching the surface of the Earth.”
“Use modern data gathering techniques that actually give a great PROXY for energy reaching the Earth’s Surface: the 10.7 cm Flux. ”
You may want to rephrase those.
Which one is incorrect the observed global temperature or the Flux? They have to match mathematically for AGW to be right.
Both. Neither TSI or 10.7 cm flux measure energy reaching the surface of the Earth.
Hi Tom
Energy reaching the Earth’s orbit most likely is constant with a small margin of modulation in the TSI.
the fact that the Earths temperature time function only periodically ‘resembles’ to that of solar variability. does not necessarily mean that it directly caused by the sun. It may be that there are external factors that are forcing otherwise a random occurrence of sunspots into more regular quasi-periodic oscillations. The Earth’s involuntary entanglement in the someone else’s relationships may explain not only its climate variability on scale measured from decadal to multi-millennial time scale, but such things as its magnetic reversals, extinctions etc.
As the old grasshopper said:
‘there are a whole lot of things in this world of ours we haven’t started wondering about yet.”
but in this world of ours the grasshopper will always loose an argument with a chicken.
Vuk,
Very nice comment but it does not address the fact that jlurtz (November 1, 2016 at 6:49 am ) stated that 10.7 flux and TSI measure energy reaching the earth’s surface. I simply pointed out that is not correct.
Tom
Yes I do agree with you on that one. Occasionally when talking about overall energy I like to refer to the earth’s orbit rather than surface. On the downward trajectory there is magnetosphere (events there shake the geomagnetic field), ionosphere (UV), Stratosphere (Sudden Str. Warming Ozone layer, and various components of the atmosphere (cloudiness, vapour, volcanic dust and sulphur, etc). I suspect there is no way of accurately quantifying energy impacting the surface, although I often see various pretty diagrams of such .
Some of the various bits composing total although are very small in absolute terms, they are also highly variable (e.g. magnetic and UV ) and may under certain circumstances tip delicate temperature balance (measured in units of 0.1C or less) in either direction; “whole lot of things to wonder about”.
The polar vortex will continue to remain unusually weak in the coming weeks; there are even signs that it could split into two parts. Should this happen, this would be a novelty: never before was a so-called polar vortex plot observed at the beginning of November. Such developments have often resulted in spectacular cold cuts in Europe in recent winters with heavy snowstorms and tingling frost. Recently this happened in record-December 2010 , in the freezing February 2012 and in a snowstorm March, 2013.
http://www.wetteronline.de/wetternews/2016-10-27-pw
– climate steering is aerosols.
– magnetic flux is just a red herring.
– introducing ‘headshot’ by Leif S. is as sociopathic as Leif can be.
________________________________
C’m on. Move along, you can top that.
[calling leif “sociopathic” just moved you from the moderation list to the banned list – you were warned – Anthony]
None of it will matter when the Grand Aerosol Event happens – e.g. unprecedented mega-tonnage being brought to bear.
The actual sea ice shows that the polar vortex is broken.
http://pics.tinypic.pl/i/00835/6twet6us5k7y.png
The old scale is much more accurate. Even better is the Layman sunspot count.
No, Salvatore. Om both counts you are totally wrong. You have no evidence for anything like that, except your wishful thinking. Your statements display a profound ignorance.
Leif knows his stuff I never question that. I just see it differently and time will tell.
Another thing is when there are no sunspots it does not matter what count is used.
Sunspot number is zero today
I suspect a linkage between earth’s albedo via cloud formation and the solar magnetic field. There may be several mechanisms, for example cloud seeding by charged particles or cosmic dust entering the atmosphere, modulated by the condition of the solar magnetic field. Cosmic dust can reflect sunlight, seed ice formation and clouds and, if rich in iron, catalyse phytoplankton which reduces carbon dioxide through photosynthesis.
I suspect a linkage between earth’s albedo via cloud formation and the solar magnetic field
There has been no long-term trend [since at least the 1840s] of the Sun’s magnetic field to match the increase of global temperature during the same time:
http://www.leif.org/research/Solar-Magnetic-Field.png
A study reported in the Journal of Geophysical Research claims an inverse relationship between meteor rates and solar activity as measured by sunspot numbers. This fascinating possibility suggests a connection between cooling caused by meteor dust and the solar cycle.
More likely it is solar activity expanding the upper atmosphere causing the dust to encounter the atmosphere earlier…
You could be right, which would support the effect. Sorry, I didn’t include the link.
http://onlinelibrary.wiley.com/doi/10.1029/JA082i010p01455/references
Meteor “smoke” nucleates ice crystal formation in the mesosphere, creating noctilucent clouds. Nasa claims that these clouds are known to peak at solar minima. This ties in with the modulation of dust flux by the solar cycle. Some climate scientists regard such clouds as indicators of climate change and suggest that the water is produced by photocatalytic oxidation of the greenhouse gas, methane. Perhaps a simpler explanation is that meteors entering the mesosphere frequently bring their own water.
http://www.nasa.gov/mission_pages/aim/news/early-nlcs-2013.html
There is much that has not been properly investigated and I stand by my belief in a linkage between solar effects and earth’s climate via albedo modulation.
http://www.noaanews.noaa.gov/stories2011/20110721_particles.html
Dr Svalgaard, we are all interested in understanding the drivers of climate change. Many place most of the blame on anthropogenic fossil fuel oxidation. Others seek alternative explanations such as solar influence. As a solar expert, I respect your rejection of the latter based on your experience. However, it is clear that our best experts do not fully understand climate change or its drivers. Certainly, the CO2 effect raises many doubts while the solar effect is supported by anecdotal evidence. It is probable that the influences are subtle, indirect and perhaps with delay mechanisms that obscure the more direct relationships such as correlation.
I feel that your rejections are more based on the lack of direct correlation and are closed to more obscure possibilities. I would very much like to see your vast knowledge being used to drive speculative theories as an exercise in generating speculative mechanisms for solar modulation of our climate. Any worthwhile ideas could then be subjected to scientific testing. In my view, climate science is bogged down with beliefs that do not match observations. More speculative thinking outside of the accepted norms is required to stimulate the innovation that will move this subject forwards.
drive speculative theories as an exercise in generating speculative mechanisms for solar modulation of our climate.
The ‘landscape’ of possible speculations is vast, so an immense number of them would be false or blind alleys. This makes for a very frustrating search, not likely to lead to elucidation. Which is why I generally refrain from speculating.
I can’t believe how so many see only what they want to see. For all those so sure that the quiet Sun is about to sink us into a mini ice age, then just take a look through all the relevant data on the reference pages of this very website. There you will see that Arctic temps are extraordinarily high for the time of year, sea ice is also off the scale low, and northern Hem snow cover is also lagging. Winter is in fact late and very benign in most of the N. Hem this year – but as ever there are a few tiny anomalies, which constitute a mere drop in the ocean, when viewing the whole. No doubt I am now about to learn about those anomalies by those blinded by their own unreasoned beliefs!
Unreasoned beliefs are not dissipated by reason. They die out. It is a function of the way our minds work. Endocannabinoid production declines after about age 25. That means for most people that what you believe at age 30 will most likely be held for life.
See
http://notrickszone.com/2016/11/04/cold-october-n-hemisphere-snow-cover-reaches-near-record-high-record-snow-in-siberia/
Do you mean that people over the age of 30 are not capable of changing their beliefs, even when sound reasoning undermines them? Seems odd to me! I know it can be a challenge to let go of something dearly held but surely if good reason and the facts stand in opposition, then let it go! If what you say is true though, it does help explain why so many world problems remain unresolved – prejudice in particular….
“There you will see that Arctic temps are extraordinarily high for the time of year, sea ice is also off the scale low, and northern Hem snow cover is also lagging. Winter is in fact late and very benign in most of the N. Hem this year”
YOU ARE KIDDING!
It’s currently freezing in Russia & the Baltic states.
Winter is much colder, much earlier than usual, in some cases we are getting temperatures at end of October/early november which we usually get in January!
Where are you getting your “benign” nonsense from?
Over here it’s far from benign (wife wearing a thick fur coat in 1st week of November, usually only end of december/January!)