Guest essay by David Archibald
In the time before the current period of faith-based science, much good work was done on the role of the Sun in controlling climate. One of the best monographs from that time of innocence is Hoyt and Schatten’s The Role of the Sun in Climate Change, published by Oxford University Press in 1997. That book starts with this paragraph:
About 400 years before the birth of Christ, near Mt. Lyscabettus in ancient Greece, the pale orb of the sun rose through the mists. According to habit, Meton recorded the sun’s location on the horizon. In this era when much remained to be discovered, Meton hoped to find predictable changes in the locations of sunrise and moonrise. Although rainy weather had limited his recent observations, this foggy morning he discerned specks on the face of the sun, the culmination of many such blemishes in recent years. On a hunch, Meton began examining his more than 20 years of solar records. These seemed to confirm his belief: when the sun has spots, the weather tends to be wetter and rainier.

So the idea that sunspots and the solar cycle control climate is at least 2,400 years old. In the modern era, the appreciation of sunspots started again in 1610 with telescopic observations by Galileo, Thomas Harriot and others. The solar cycle was discovered by Samual Schwabe in 1843 after 17 years of observations, though William Herschel’s correlation of sunspots and the wheat price in England dates from 1801. A 2003 paper by Pustilnik and Din entitled Influence of Solar Activity on State of Wheat Market in Medieval England confirmed Herschel’s observation.
The idea that the Sun controls climate is easy enough to understand. In fact the Earth’s climate is exquisitively sensitive to changes in solar output, as shown in Nir Shaviv’s 2009 paper Using the Oceans as a Calorimeter to Quantify the Solar Radiative Forcing. Professor Shaviv found that the total radiative forcing associated with solar cycles variations is about 5 to 7 times larger than just those associated with the TSI variations.
We know what causes individual sunspots – something to do with magnetic flux tubes rising to the solar surface due to bouyancy. But the cause of the solar cycle itself had remained a mystery until the recent publication of the second edition of Evidence-Based Climate Science, edited by the indefatigable Don Easterbrook. The first edition, published in 2011, contained a paper by Ed Fix, retired B-52 pilot from Ohio, entitled The Relationship of Sunspot Cycles to Gravitational Stresses on the Sun: Results of a Proof-of-Concept Simulation, which demonstrated the modulation of the solar cycle by the gas planets. The second edition expands on that with a co-authored paper (Ed and myself) entitled Aspects of Solar Variability and Climate Response which details the relative contribution of those planets.
It has long been suspected that the solar cycle is largely influenced by Jupiter due to the closeness of the average length of the solar cycle of 11 years and the orbital period of Jupiter of 11.86 years. In 1984, Schwentek and Elling noted that “the clearly dominant spectral band in sunspot number, the solar cycle of 10.8 years, is given by the configuration period of Jupiter and Saturn (19.859 yr) times the ratio of their distances from the Sun (0.545).” Just over a decade later, Attila Grandpierre confirmed that whatever was causing the solar cycle must be extrinsic to the Sun – which leaves the planets as the causative agent.
Ed Fix’s 2011 paper was important because it provided a physical explanation for solar cycle behaviour. Many of the then observation-derived rules for explaining the fundamental properties of the sunspot cycle had not been quantified until that paper. To a large extent, existing solar science is based on non-mathematical observation, evidenced by Dikpati’s and Hathaway’s various predictions of solar cycle amplitude. The 2011 paper’s treatment of the sunspot cycle as an ideal spring driven by changes in radial acceleration provided a new paradigm. At the same time, this new model is consistent with the solar dynamo theory.
Ed Fix’s model explains why, for extended periods, successive increases in solar cycle amplitude are seen before the system gets out of phase and phase destruction occurs. Individual Hale cycles are not discrete magnetic events. The quantum of flux preserved in the system is the basis for the amplitude of the following cycle. Thus the sunspot cycle memory effect is explained.
The model also explains the Waldemeir effect – that strong cycles reach a maximum of amplitude in the shortest period of time. It also explains the amplitude-period effect (the anti-correlation between the peak amplitude of a cycle and the length of the preceding cycle) and the amplitude-minimum effect (the correlation between cycle amplitude and the activity level at the previous minimum). Ed Fix’s model hindcasts almost perfectly and that very close match, despite the model’s simplicity, suggests that a lot of confidence could be placed in what it is predicting.
Some have doubted the planetary basis of the solar cycle due to the weak effects of the individual planets on the Sun. That is certainly borne out by the work done for the 2016 paper. Figure 1, from that paper, shows that by itself Jupiter has little effect on solar variability:

Figure 1: Simulation model with Jupiter only compared to the full model
Similarly, Figure 2 running the model with only Saturn shows a similarly low amplitude response though with Saturn’s 29 year orbital period instead of Jupiter’s 12 years:

Figure 2: Simulation model with Saturn only compared to the full model
So, if Jupiter and Saturn have little effect on the Sun by themselves, as predicted by many, what does cause the solar cycle? This is the mystery that has not been explained until now.
It turns out that the interaction of Jupiter and Saturn causes most of the solar cycle. The effect on the Sun of these two planets is synergistic rather than additive as shown by Figure 3. It has been said that mathematics is the language of physics. What has been elucidated by this paper is the mathematical basis of the solar cycle.

Figure 3: Simulation model with Jupiter and Saturn compared to the full model
The red line shows the full model which includes Uranus and Neptune as well as Jupiter and Saturn. The difference between the red and blue lines is the effect of Uranus and Neptune. This can be additive or subtractive. In Solar Cycles 18 and 22, Uranus and Neptune increased the amplitude of the solar cycles relative to the model output of Jupiter and Saturn alone. In Solar Cycles 20 and 24, Uranus and Neptune had the effect of reducing the size of those solar cycles. Thus the cold period of the 1970s cooling period associated with Solar Cycle 20 may have been due to the influence of Uranus and Neptune.
Where to from here? Well, there is another big mystery remaining about the Sun. The hemispheres have different activities that are preserved on a multi-cycle basis. That is shown in the following figure:

Figure 4: Sunspot area by solar hemisphere
For the last three cycle, the southern hemisphere has had more sunspot area than the northern hemisphere. Its peak has also been later than that of the northern hemisphere. What could be causing that? It is likely to be the inclination of the orbits of the gas giant planets to the Sun’s equator. Those inclination are:
Jupiter 6.09%
Saturn 5.51%
Uranus 6.48%
Neptune 6.43%
It seems that the next step will be to make a 3D version of Ed Fix’s model.
David Archibald is the author of Twilight of Abundance (Regnery).
Well, of course the sun has an impact on climate…
It is just that the main driver of current climate changes – i.e. warming – is human CO2.
(heavy sigh) The AGW religion of the IPCC is well known, Griff. It’s just that most of us stick to real science.
One thing is for certain though, If you remove either one from the equation, the Earth gets Cold and Dead.
Even if you lower either one the earth gets colder and death begins to take hold. Just look at the LIA and the famine in Europe
Griff did a nice job of hijacking this thread. I’d like to see this article reposted and let people comment on the actual content.
..And some day you may actually be able to prove it !!
Griff be able to prove it? C’mon, he probably has Velcro fasteners on his shoes as laces are still a challenge!
…ROTFLMAO…
Hey, go easy on the Velcro fasteners, I’m 57 and love them! Why should I spend my time lacing and tying when Velcro will do a faster job?
Harry I really want some of those sneakers with the flashing LED lights, but my wife refuses to be seen with me if I buy any… 🙁
That doesn’t sound like cancer to me Swanson
If you truly believe that, kindly explain the lack of any significant warming for the last 19 years!
If you use only RSS type data, from a certain start date, that’s what you would get, if you left out 2016…
and if you remove all the adjustments that have been made to the raw data for the purpose of Karl et. al. the climate stability would still be indicated
Welcome to the Adjustocene
The RSS and UAH data sets also have had multiple adjustments, so they fit right in that epoch
The adjustments to satellite data are warranted scientifically. The manipulation of so-called “surface data” sets are not. They’re tendentious and anti-scientific to promote advocacy.
Speaking of faith based science, up jumps the chief acolyte.
To bad the science has shown that CO2 is only a bit player in this drama.
Well Griff, you were the first to comment and the first to disappear without defending your claim. Will you also claim that the CO2 humanity produces is responsible for the next planetary cooling cycle? Reality has debunked the models already, so all you possess is blind faith in the agenda behind those models and their claimed forecasts. The reradiation of infrared by CO2 is dwarfed by that of H2O, and my nursery rhyme still stands:
Mother Goose on Climate Prediction
As record winds blow
Unprecedented snow,
Oh, where is our globe a’ warming?
That depends on the sun
And the ways oceans run,
Plus clouds (with complexity) forming!
Now, and for quite long,
Climate models are wrong.
So, what caused the pause in the warming?
Yes, look to the sun,
The ways oceans run,
And the clouds, in complexity forming.
CO2 is “too small”
To stop temperature’s fall
When the sun, clouds and oceans together,
Begin to cause cold
in a cycle so old…
That no one alive can remember!
So if I do some harm
By just keeping warm,
You’ll have to kindly forgive me!
I find my solution
Is carbon pollution…
Ere this planet will quickly outlive me!
I don’t have infinite time to post comments, like some lucky folk… you’ll have to wait till I can get back.
For certain CO2 has increased, isotopically that CO2 came from human activity, global temperatures continue to climb, arctic sea ice and glaciers continue to decline. The sun is in a cooler phase recently. The only realistic cause of the warming is that CO2, a known greenhouse gas.
Unless you exclude, ignore or claim as fake the surface temp record, there’s evidence of rising temps.
I note also the results of the skeptic funded Berkley Earth programme.
Really, I’d have to go far off the beaten track of science to find evidence otherwise.
You seem to have more time to waste than anyone else posting here, considering all of your comments are meaningless trolling. It must be all the time you save from not reading the articles.
Pop Piasa —
Nice little poem. You are more deserving of the Noble Prize in Literature than Bod Dylan.
Eugene WR Gallun
Sorry Griff,
Not meaning to burst your Climate Alarm Bubble
but your statement is a bit oxy moronic
Sorry Griff,
Not meaning to burst your Climate Alarm Bubble
but your statement is a bit oxy moronic
The bolded portion of your statement is exactly the issue. The surface temperature records have been adjusted to read warmer in the present and cooler in the past. In essence they have been adjusted so much that they do no longer represent the actual data and thus can be viewed as faked
The surface temperature record in the modern error has error bars of somewhere around 5C. These get greater as you go back in time.
The idea that you can tease a signal of a few hundredths of a degree from that record is so ridiculous that only the terminally clueless could accept it.
Griff, and how do you figure in the activity of the most prevalent greenhouse gas: water vapor? Or is that portion of infrared map immaterial?
Also, how are you able to distinguish the difference between human-induced CO2 and natural CO2, the latter of which is 40X larger by volume, and considering that they are intermixed?
Well Bryan if the data is faked, by agencies such as NASA, on such a wide scale, with such a scale of acceptance (‘cover up’) by world scientists, then we’re not talking science but conspiracy theory.
A conspiracy of a level the world has never seen the like… and in 25 years and more, no one has broken the silence, the evidence of faking has not been presented.
Berkley Earth took skeptic money to look at it and found nothing.
If there was that level of conspiracy, this website wouldn’t exist…
MRW – it only matters that we can tell the origin of the increase in CO2 and pin it to human activity…
It is faked Griff, just in the last year NOAA has changed the yearly co2 emmisions ppm/v and the temperature per year. There is absolutely no reason, none whatsoever. I submit a paper with the wrong info on it, I’m ignored as an idiot. I become the one changing the data…
he griff-
“NASA’s Goddard Space Flight Center uses satellite data to provide precise weather updates to NORAD as it begins tracking Santa’s progress after sundown every Christmas Eve. One NASA satellite traces the infrared signal from the red nose of lead reindeer Rudolph.
From its base at the Peterson Air Force base in Colorado, NORAD posts real-time updates of Santa’s progress on its website, NoradSanta.org. Updates are provided in eight languages. NORAD also updates Santa’s journey on social media such as Facebook, Twitter and YouTube.”
there’s a google app for that, too.
this is not a conspiracy. everybody truly believes.
and i’m sure you’d be the last one to deny the science.
omniscient distributors of unearned wealth are the backbone of a progressive social order.
Griff,
It’s not a conspiracy theory but a fact, which can be easily demonstrated by comparing previous data sets to those post-adjustment. Also, once formerly secret algorithms were forced into the daylight, the extent of the manipulation became clear.
Griff: “It is just that the main driver of current climate changes – i.e. warming – is human CO2.”
Spoken with such conviction, Griff. Almost as much conviction as you showed last week in your “belief” that hurricanes in Oct are “unusual” and definitely caused by human CO2. Until you were shown the facts. Apparently facts, for you, have a half life of somewhere under a week.
Griff, that is sarcasm, right?
I think Griff is a visiting alien from another planet. No warming for 19 years other than in puter models!
Can we just compromise and agree that the main driver of current climate data changes – i.e. warming – is human?
If by climate data “changes” you mean climate data manipulation or “adjustments”, then sure, we all agree those are human induced. 😉
Yes, let’s call it “Mann Made Global Warming”!
It is just that the main driver of current climate changes – i.e. warming – is human CO2.
Griff, this statement is a conjecture (polite word for wild-assed guess). It is not even a hypothesis, because it is untestable. There is no way of differentiating the signal (presumed AGW) from the noise (what is happening to the climate without the presence of human CO2).
The mathematical models based on this conjecture have no skill in forecasting or hindcasting. They have been “parameterized” (polite word for fudge-factored) to fit the data over a short time period. Any mathematician worth his salt can conjure up an equation that purports to show that an independent variable can predict a dependent variable.
It is warming… things like the sun and milankovitch cycles are not producing additional warming effects.
Griff,the weak warming trend is well within historical trends. There is nothing unusual going on.
Plus there have been many failures of the CAGW conjecture already known,that indicate that CO2 doesn’t drive temperature changes anyway.
Stop hanging onto a trace gas,with a minuscule IR absorption capability.
But, like Goebbels, he’ll keep saying it. Similar psychologies. Similar methods.
Griff,
Whatever warming has actually occurred since the end of the LIA is natural. Earth’s climate warms and cools without any help from humanity, and has always done so.
What has happened since c. AD 1850 is entirely within normal bounds. Much bigger warming cycles have occurred during the Holocene and all prior interglacials. Even bigger swings happened during the glacial intervals.
There is no “human fingerprint” on any warming since the end of the LIA or during the post-war period.
Oh, wow. Sun doesn’t warm the tropical Pacific? I’d like to hear your rationale for ENSO, or is that a toss-away too?
I did it myself once for fun. A simple polynomial with 120 degrees of freedom gave a perfect hindcast fit to the past 120 years of climate. I “proved” that the Earth’s climate follows a polynomial law! 🙂
Fantastic Griff! All these people working night and day and spending billions on this problem and you figured it all out at a glance using only the power of preconceived notions!
Hey, I go to my MD and I don’t figure I have to work out the basics of human physiology before I let her treat me… I take the biological science as fact.
Griff,
Biological science and physiology aren’t settled, either. No science is.
Nutritionists can’t decide on fats, refined sugars, carbs or whatever as the control knob on cholesterol and health.
Where is real world evidence,Griff?
If you don’t like what he’s shown so far, give him a minute and he’ll manufacture some more.
To be fair, I don’t think he’s manufactured anything – he said himself, he doesn’t have time – so he’s just simply repeating every last BS piece of hackwork propaganda/spin that’s fed to him by his puppet-masters. That’s why he always cites some third party.
Manufacturing is an act of creation. Modern Progressivism – particularly where it is most corrupted by eco-fascism – is a philosophy of destruction – incompatible with actual progress and outside the realm of understanding of greenie-types.
That man-made CO2 is the main driver of current climate changes is an evidence-free assertion, not a scientific fact, ie observation. It doesn’t even qualify as an hypothesis, since it’s easily shown false. There is not even a correlation, let alone causation. The null hypothesis, ie that nothing out of the ordinary has happened with climate during the monotonous rise in CO2 since the end of WWII.
For the first 30 to 35 years after the war, earth’s climate cooled dramatically despite steadily increasing CO2, so all that extra beneficial plant food in the air could not possibly have been the main driver of global temperature. Then, for about 20 years, rising CO2 happened accidentally to coincide with apparently rising GASTA. Then, for the 18 years after the 1998 super El Nino, global temperature was flat to falling. Since this year’s El Nino was slightly warmer than the 1998 event, we’re, probably temporarily, back to a slight increase since then, but far below the GIGO climate models’ predictions. And the downtrend is liable to return with a likely La Nina event.
So, while CO2 is a GHG weaker than H2O, increasing its concentration from three to four molecules per 10,000 dry air molecules over a century has had a negligible effect on global temperature and other climatic phenomena. Net feedback effects are probably negative, as indicated by the pronounced cooling for nearly half of the post-war interval.
Null hypothesis has not been rejected. Left off the last phrase.
Griff —
You go ahead and continue to believe your silly little myth about human CO2. The White Queen claimed to be able to believe six impossible things before breakfast. Maybe if you breakfasted on the science you would give up such a silly claim.
Eugene WR Gallun
Ronald Reagan quipped that it was not what his opponents did not know that bothered him: it was all the things they Know that is NOT TRUE that did.
The “Climate Change” theologists knows so much that is not true they have no attention left for evidence and logic.
True or false the collected observations by the Weather Service are the largest and best documented data we have for historic US temps. We literally cannot “adjust” it since we DO NOT have the evidence to improve the raw numbers. Any changes are exactly as likely to be wrong as right.
Its not a myth is it?
There’s a known effect of greenhouse gasses in an atmosphere: we have more CO2: surface temp records and secondary indicators like glaciers show warming. Other climate drivers like Milankovitch cycles can be shown to not be having a warming effect.
I can read any amount of peer reviewed science backing up the theory behind the real world observations.
As Bryan has set out above it would likely involve massive fakery for the science to be wrong.
Or relying on partial data from only RSS type temp data.
Or ignoring the plain evidence of melting arctic sea ice.
what is the contrary evidence?
Its not warming?
Only warming naturally/a bit?
Only the temp evidence from satellites is OK?
The evidence is faked?
Its a UN plot under Agenda 21?
They are only doing it for the grant money?
there is no solid body of evidence against warming: only partial use of evidence and political opinion and, sadly, conspiracy theory.
Poor ole Griff. Still banging in a drum that’s been discarded by real science years ago.
A minutes silence for Griff, and CO2 induced climate change.
I wonder what this real science is? Where can we read it?
WUWT is a good place to start.
Once again a troll jumps in and derails the conversation. Nothing useful to say about the article, just a diversion into nonsense. @Griff, are you paid to do this? Do you also go by the name emsnews? How many other user names do you have?
The best thing to do is ignore trolls, don’t react and they will go away. Trolls get a mental rush out of raising your reaction against them ( self flagellation).
i will second both these comments . one alarmist goon turns up and the discussion thread turns to crap. note how often the goon has one of the first comments on certain threads. either a trust fund overweight greenie permanantly glued to his computer screen or a troll bot. saddest thing is “it” gets the desired response every single time.
Griff,
That’s like saying that hanging your hand out the car window is the main driver in your fuel mileage.
I strongly disagree with that Griff. Man made warming could or has been linked to a number of things; urban heat islands, attic spaces were the volume of heat is actually retained and is dependent on the power formula for raising the temperature ( for example the amount of energy it takes for a car traveling 40 to go to 60 mph), road construction, and actual heat release. Co2 is not a contributor to warming. In fact co2 follows temperature. The IPCC s graphs are not congruent showing the relationship of co2 and temperature.
Grift really enjoys being a pain in the a$$ and getting a reaction. Probably got beat up a lot growing up.
The goon d@nies the scientific fact that CO2 is plant food, apparently just for the sake of having something about which to argue to fill up an empty, meaningless existence.
Never mind that the C in C12H22O11 (sugar made by photosynthesis in plants) comes from carbon dioxide in the air.
Hence, more such plant food has visibly greened the earth and twice or thrice as much as now would be even better for our planet.
The paper is about the effect of the planets on the sun.
Your first sentence is trivial, everyone accepts that as fact.
No Griff, the main driver of the obsession with CO2 as the main driver of current climate change is humans like you. The CO2 thesis has more basis in the notion of original sin than in science. You lot would have lynched Charles Darwin if you got the chance or at least vilified him and everyone who gave any credence to his creation denial. All funding would be diverted to the examination of ‘intelligent design’ and how clever God was.
In my study of cycles in precipitation data few decades back [published in an article], I noticed 60-year cycle. I also found this in astrological calendar used in India and as well in China. In Chinese astrological cycle relates to 12 animal signs and 5 panchabhootas. All these are related to 9 planets which form the basis for Indian astrology. Following this I tried to look at the cycle length of the plants to 60 year cycle in rainfall. All these I made qualitatively.
Dr. S. Jeevananda Reddy
No it isn’t.
Stop making stuff up.
Lacks the Turing test:
a Griff is
a) human
b) a directed fast responding answere machine
Nice theory.
So now consider Proxima Centauri, with an observable cycle and no known planets. Key to this theory is the presence of gas giants, so colour me skeptical that this is a done-and-dusted theory.
Proxima Centauri is, firstly, part of a trinary star system. Secondly, you’re a bit behind the times. In August this year we found a planet orbiting it.
Thanks for the update!
Nice, Phil. Still, it should be possible to study the system’s TSI variation relative to the positions of the two “hot planets,” assuming we can determine their orbits.
Civil Engineer planning for 500 year flood pattern for four dams in South America https://anhonestclimatedebate.files.wordpress.com/2009/02/2982-journal-of-civ-eng-vol-49-no-2.pdf
Beware the ongoing approx 1.4% per decade increase in total precipitable water (TPW) ftp://ftp.remss.com/vapor/monthly_1deg/tpw_v07r01_198801_201609.time_series.txt
Dan, is this a trend or a positive oscillation?
This is an awesome paper. Saw it yesterday and bookmarked it for more a more in depth reading when I have time over Christmas.
The one I’m really looking forward to is what is causing the Earth-facing Solar quiet. We can see from Stereo A and B that the far side of the sun is as active as ever. But for at least the last year there has been some forcing on the Earth-facing disk which causes sun spots to rapidly decay or fail to grow into complexity, reduce flaring and even keep filaments stable until they’re not in geoeffective longitudes.
What is causing that is something I’d love to find out.
I agree, great paper. I’m 57, an engineer and hope to live long enough to see this all play out. In my career I’ve been involved in debunking quite a few held “beliefs” on why things are happening using science. I can see the c02 “belief” concept going down the same path as some of the fervently held ideas my teams and I have unraveled.
Such as??
Just as a note, nobody knowledgeable says that anthropogenic CO2 has no effect, it’s just that the effect is negligible when compared to all of the natural forces involved.
if CO2 was a major forcing function, the Chixalub impact – which set most of the Earth’s forests on fire – should have put us into a Venus-like state long ago.
Chixalub also vaporized quite a bit of limestone.
And created huge ammounts of Water Vapor
It also vaporized a portion of Crust material as well as aquatic lifeforms in the region
‘What is causing the Earth-facing Solar quiet’, good question, Phil. Has any solar physicist bothered to do any research into it?
Neil, just a random thought. What if the plane of PC’s planetary orbit(s) is approximately perpendicular to our line of sight? Might we rather be able to go from solar cycle to planetary deduction?
Okay, so the gas giants affect the solar cycle. It was not mentioned here, but is there any correlation regarding the position or movement of the solar barycenter as it moves around inside and sometimes outside the Sun?
http://semi.gurroa.cz/Astro/Orbital_Resonance_and_Solar_Cycles.pdf
I suspect that the reality is some combination of all of the above.
Agree with this one. For fun, I did a “solar system model” (a few years back) that allowed free movement of everything. It indicated the sun oscillated due to planetary motion in a pattern that correlated with sunspots. I did not take it to the depth of the authors — I like the track they are on.
Does this predict a SC25 as big as SC23? It seems to, from what I see in the graphics. As nice as the theory could be, if it doesn’t succeed in making predictions about the future, it is useless.
I was going to ask the same thing. Predictions please. Maybe that will be next. I hope so because so far it is very fascinating.
What a coincidence. This recent article comes with similar conclusion, except it blames Jupiter, Earth and Venus for it.
https://www.sciencedaily.com/releases/2016/10/161004113753.htm
It has something to it. Venus applies second strongest tidal forces on Sun after Jupiter (about 13% of Jupiter), Saturn and Earth come only after that (both 9% of Jupiter force). Uranus and Neptune are negligible at 0.3% and 0.1%, even Mercury (3%) has more effect than them.
But with all that, even Jupiter’s tidal effect on Sun is very, very weak. Some time ago I read somewhere that on a completely quiet and perfectly spherical Sun, Jupiter would create a tidal wave 6 cm high. Compared that to Sun’s diameter and size of its surface features … no, I’m not really inclined to believing it has any effect.
If you read carefully, it’s not the absolute effect that counts. Rather, it’s a resonance effect where the planets “pump” a regular waveform and reinforce it or diminish it.
Planetary orbits in stable systems are determined in large part by resonance effects anyways.
http://www.lpl.arizona.edu/~renu/malhotra_preprints/unesco_malhotra_rev.pdf
http://semi.gurroa.cz/Astro/Orbital_Resonance_and_Solar_Cycles.pdf
And resonance depends on the frequency match between the resonator and forcing function.
Planets have tendency to fall into resonant orbits over millions of years because it’s a stable state of the system and impulses needed to achieve that are comparatively very small. But that has nothing to do with sun cycle. The sun resonating at 11 year period would require a “sound” wave propagating through the Sun at 2 m/s speed – I seriously doubt there’s physical principle that could possibly support that.
“It turns out that the interaction of Jupiter and Saturn causes most of the solar cycle.”
The solution does not involve Saturn:
https://wattsupwiththat.com/2016/10/04/new-study-suggests-a-link-between-the-11-year-solar-cycle-and-the-tidal-effects-of-venus-the-earth-and-jupiter/#comment-2313731
Not correct. See papers sited in response to Kasuha above.
Yes it is the correct solution, and it accounts for everything that the Ju-Ea-Ve triplet cannot possibly account for on their own.
When solar activity decreases in the stratosphere show up two centers of low pressure, one over Canada, the other on the eastern Siberia. This is due to the fact that the Earth’s magnetic field in the north has two centers.
http://www.cpc.ncep.noaa.gov/products/stratosphere/strat_a_f/gif_files/gfs_z100_nh_f00.png
http://www.geomag.bgs.ac.uk/data_service/models_compass/polarnorth.html
http://www.cpc.ncep.noaa.gov/products/stratosphere/strat_a_f/gif_files/gfs_o3mr_200_nh_f00.png
From a simple point of view this correlates with the basic physics of the moon and tides.
Fascinating, so the Old Gods still exert their influence, just not the thunderbolts of the passing planets of yore.
Well, if the roman Jupiter, greek Zeus, has an influence on the solar and that influences climate, there may be thunderbolts and lightening:
http://www.pantheon.org/articles/j/jupiter.html
Other titles of Jupiter include: Caelestis (heavenly), Lucetius (of the light), Totans (thunderer), Fulgurator (of the lightning).
http://www.pantheon.org/articles/z/zeus.html
Zeus was a celestial god, and originally worshipped as a weather god by the Greek tribes.
While I’m not saying I buy the “if” as being established, it does seems to be the historical belief that Jupiter / Zeus controlled the weather.
“Thus the cold period of the 1970s cooling period associated with Solar Cycle 20 may have been due to the influence of Uranus and Neptune.”
This is where most come unstuck. The global mean surface cooling in the mid 1970’s is literally because of stronger solar wind driving a positive NAO/AO regime, forcing a cold AMO and Arctic, and a multi-year La Nina.
I really don’t see the point in stating ( asserting ) such stuff as fact without any link to an explanation which can be looked into. Not saying you’re wrong, but it’s meaningless to pop up here and on C.E. and spout oddball hypotheses as fact without any proof.
Hypothesizing is hardly meaningless. Mechanism of causation, if it exists, is, so far, beyond our ken.
==========
“Not saying you’re wrong…. and spout oddball hypotheses”
You sound confused, and the hearsay is likely a self confession.
Ulric lyons:
You wrote: The global mean surface cooling in the mid 1970’s is literally because of stronger solar wind driving a positive NAO/AO regime, forcing a cold AMO and Arctic, and a Multi-year La Nina”
No, the cooling in the mid 1970’s was due to the large increase in strongly dimming anthropogenic sulfur dioxide aerosol emissions into the atmosphere, which peaked at 131 Megatonnes in 1972.
From large volcanic eruptions we know that emissions of sulfur dioxide into the atmosphere will cause global cooling, so cooling HAD to occur in the 1970’s because of the SO2 build-up.
Subsequent reductions in the amount of those emissions due to Clean Air efforts is solely responsible for the rising global temperatures since circa 1972
Stratospheric volcanic aerosol cooling of the surface promotes El Nino conditions.
ulric lyons:
You stated “stratospheric volcanic cooling promotes El Ninos”
??There were no El ninos associated with either the El Chichon or the Mount Pinatubo eruptions.
Wrong on 2 counts
1 There wasn’t any cooling in the 1970’s The cooling began in the 1940s and ended in the 1970s.
2. Aerosols are short-lived in the atmosphere. Most are washed out within a few days – or weeks at the most. They are (or were), therefore, most heavily concentrated in the industrialised regions of the NH. If there were a noticeable effect on climate it would have been in those regions. However from GISS data it’s clear it was the high latitude regions (above 64N) which experienced – by far – the largest cooling trend.
While some aerosols will find their way to the arctic, the effect of aerosols in the arctic is WARMING.
https://en.wikipedia.org/wiki/Arctic_haze
According to Tim Garrett, an assistant professor of meteorology at the University of Utah involved in the study of Arctic haze at the university, mid-latitude cities contribute pollution to the Arctic, and it mixes with thin clouds, allowing them to trap heat more easily. Garret’s study found that during the dark Arctic winter, when there is no precipitation to wash out pollution, the effects are strongest, because pollutants can warm the environment up to three degrees Fahrenheit.
John Finn:
To reply to your comments:
1. There was cooling in the mid-1960’s – early 1970’s. Recall that there was much talk about the possible return of an ice age because of the unusually cold temperatures.at that time.
2. Your comments about aerosols applies ONLY to intermittent or interrupted events.
Most all emissions are from relatively constant sources such as power plants, factories, foundries, vehicle exhausts, and the like, where they are constantly being renewed. As a result, their effective lifetime lasts until they are either modified to reduce emissions, or are shut down.
Average global temperatures ALWAYS rise during a business recession, due to reduced industrial activity, and the consequent fewer SO2 aerosol emissions into the atmosphere.
This could not happen unless there were a “reservoir”of SO2 aerosols in the atmosphere. When plants shut down, the aerosols can then be washed out, as you said, causing temporary warming due to the cleaner, more transparent air.
John GISS “data” is not data, stop calling it data, it is artifact.
Yes there were Burl
http://www.cpc.noaa.gov/products/analysis_monitoring/ensostuff/ensoyears.shtml
Burl Henry:
Check the GISS data. The 1950-75 trend is flat (slightly positive). Any post-1940 cooling happened in the first 5 -10 years. Unless you’re saying GISS have manipulated the data then I’m afraid you have to accept it. The 1970s were warmer than the 1960s. (and 1950s)
John Finn:
You wrote:
“There are sharper short-term functions which are caused by ENSO (El Nino & La Nina)”
This is somewhat true, but the MAJORITY of the increases are coincident with business recessions.
Log on to: WoodForTrees.org. Select “interactive”.
The graph that appears is for temperature anomalies.
Adjust it to span 1870-present.
You should print it out, and enlarge it.
Get list of recessions from nber.org/cycles.html
Between 1870 and the present there were 2 depressions and 28 recessions. You will find that all of them are coincident with a temporary increase in average global temperatures.(the one exception, Sept. 02 to Aug. 04 was because of an unusually strong La Nina offset the recession-induced warming)
(Note that the graph does show a steep drop in temperatures mid-1960’s-early 1970’s)
John Finn:
With respect to Sulfate Aerosol forcing, you say that its main effect is to cause cooling.
This is true, as long as it is present in the atmosphere. However, when it settles OUT of the atmosphere, it causes warming due to the cleaner, more transparent air, as is proven after every large volcanic eruption..
(This scientific fact is ignored by the IPCC in its diagram of radiative forcings, making it useless, since the warming due to aerosol removals is so large)
Clean Air efforts have reduced anthropogenic aerosol emissions by more than 30 Megatonnes since 1975, and the warming resulting from their reduction accounts for ALL of the surface warming that has occurred.
John Finn
October 14, 2016 at 12:08 pm
GISS has beyond any shadow of doubt manipulated the data. And that’s putting it mildly.
The ’60s and ’70s were colder than the ’40s and ’50s, plus of course the hot ’20s and ’30s. Compare GISS’ cooked books with the temperature data used by NCAR in the late ’70s to support the global cooling scare.
Jupiter takes 11.90 years to complete one revolution of its orbit Saturn and puts 29,50 years. These two planets is a cycle 19,86. Years of their conjunctions (Sun-Jupiter-Saturn) to the next through an opposition (Jupiter-Saturn-Sun) 9.93. Years after the first conjunction. This cycle is very close to double the Schwabe solar cycle with a duration of 8 to 13 years ie one Hales of the cycle of 22 years. The two other Jovian planets (Uranus and Neptune) pouraient be the cause of the variation in the length of these cycles.
http://system.solaire.free.fr/soleilactivite.htm
Currently, Jupiter and Saturn are close to each other. The activity of the Sun magnetic quite high.
http://images.tinypic.pl/i/00829/5vgqw5v7t5w4.gif
In 2020 they begin to recede. Magnetic activity will decline.
http://images.tinypic.pl/i/00829/s9c4o5uzfr3m.gif
In 2010, Jupiter and Saturn were in opposition.
http://images.tinypic.pl/i/00829/5lp6994kpytz.gif
Magnetic activity the sun was low.
Weather Action use planetary alignment and magnetics for forecasting and they have a damn good success rate, well ahead of the curve
Thanks for the comment, Mark. Unfortunately, Weather Action is Piers Corbyn. I’ll tell you why they have what you call a “damn good success rate”—Piers will claim anything as a damn good success, even if it is a flat-out failure.
For example, Piers predicted forest fires in Colorado and rated it a total success when there were forest fires in Arizona. He also famously also claimed success when he predicted a 50/50 chance of a cyclone and the cyclone didn’t form … hey, he did predict a 50% chance of it not forming, and in Corbynville that seems to be a big win …
Heck, he challenged people to bet with him regarding rain on the Olympics opening in London, but when I accepted the challenge he chickened out …
See here and here for further details, dates, times, and predictions. From everything I’ve seen (most of his forecasts are private pay-to-play and therefore unavailable) Piers is no better than throwing darts …
w.
Food for thought.
If your predictions are correct, then your science is correct, isn’t that how it works?
Interesting theory. The correlation is strong, but until they can come up with a mechanism, it will have to remain an interesting theory.
What correlation? I do not see anything here except a few pretty graphs about “the full model” without any comparison of what it is supposed to be modelling and how well it works.
There’s a teaser to follow the links but the total absence of anything concrete in this presentation does not lead me to expect much more when I dig. If there was I think it would be here as figure #1.
Indeed Greg, it looks very weak to me, and would fall flat on it’s face in address the Maunder or Dalton minimals
It is a HYPOTHESIS, not a theory.
There is a big difference between the two words.
“Interesting theory. The correlation is strong, but until they can come up with a mechanism, it will have to remain an interesting theory.”
Rather like the “it is natural” hypothesis. Until they can come up with a mechanism it will have to remain an interesting theory
Many causes of natural climate fluctuations are well understood. Others aren’t.
But the hypothesis of catastrophic man-made climate change has been repeatedly shown false, and the models upon which it is based demonstrated to lack skill, to put it mildly.
I would be interested to know how this theory handles things like the Dalton and Maunder minimums.
yep, strange we don’t see how it handles…. well anything.
MarkW,
it is NOT a theory, since it remains to be tested, achieve a level of validation, that allows it to be called a theory. That has not happened at this time, even Davids own post here shows that.
since it remains to be tested, achieve a level of validation, that allows it to be called a theory”
Just like that CO2 warming thought-bubble.
Ruzmaikin, Feynman and Yung. There is more than just one paper from this school of thought.
===========
Correlating Nile River levels and aurorae. There are long series of data.
================================
There is correlation without causation, but speculation about causation inevitably leads to other paths than merely Total Solar Insolation, which is remarkably stable.
=======================================
with one sun and millions of rivers are you amazed that you think you found something?
have a chat with bonferroni
Only one river with long and reliable records. Only one sun with long and reliable records.
=================
Your answer to Mosher below at 11:56 am is absolutely spot on. Classic Mosher misdirect. Only one long comparison made, so normal rules about spurious correlation apply.
PS have always loved you work, especially at BH (alas, now dormant)
kim October 13, 2016 at 7:00 am
As I’ve said more than once, if you’ll provide links to the study and the data I’ll be glad to look at it.
In any case, I looked at the nile data and the aurora data that I could find. Correlation of the two datasets during the period of the ovelap (625 to 1285) is 0.37 but is NOT statistically significant (p-value = 0.20). Bizarrely, the fit is better (0.47 vs 0.37) with the Nile LEADING the aurora by ten years … go figure.
In any case, I fear that a decadal count of observations of the aurora in the years e.g. 710 to 720 has an uncertainty running from the floor to the ceiling …
My rule of thumb is that if you have to go into paleo and proxy data to support your hypothesis, you are in deep trouble. After all, if the correlation between aurora records and nile river level records was so good back in the year 856, imagine how good it is now … so why are they not demonstrating the effect using recent records?
w.
What hypothesis, pray tell?
The Nile River series doesn’t run to today, as you would know if you have bothered to read the paper. Also, I suspect that if you read the paper you would be more capable than I am of finding the necessary data.
===============
But thanks for the cursory analysis you have done. It is helpful.
=================
Also, that the river levels precede the aurorae is only odd if you are considering that the something about aurorae causes the river levels. If you banish the bias caused by that presumption of causation, you might get curious about what is causative, if anything.
Nonetheless, you’ve been helpful. It may be that despite the length and the reliability of the data, it still may not suffice to be helpful to prove or disprove any hypothesis.
Hmmm, there is about a single half cycle difference in timing between the river levels and the aurorae. Curious, if that is a reliable measure.
====================
Also, during the Maunder Minimum, sunspots were ‘large, sparse, and primarily southern hemispheric’. I’ve long thought that the asymmetry was a huge clue, the size a smaller clue and the sparsity the smallest clue of the three. Yet most of the focus of the inquiry is upon sparsity.
====================
Fig.4 above shows the asymmetry of sunspots is increasing
May I remember to Dr. Theodor Landscheidt ?
I do wonder how this model relates to longer term climate effects like the LIA, not just shorter term solar cycles.
Ignore the millennial at your perennial.
================
Two thoughts:
1) You could use this model to predict possible locations for any “Planet X”. For instance the polar hemisphere differences could be explained by “Planet X” having a highly inclined orbit. Not that one has to exist, of course, but the possibility cannot be ignored.
2) Sunspots have been observed on other stars.
http://www.solarweek.org/CS/t/1452.aspx
It would be interesting to see if similar cycles can be verified for other stars that have both spots and known planets.
You’re right to assume a gravitational forcing related to a planet with a high orbital angle. The inclinations of the outer planets are rather tiny. Unfortunately, if Planet X were close enough to have much effect, it would PROBABLY have been observed by now.
I’m not sure we have sufficient resolution to do sunspot (starspot?) studies at that distance. Nice, if so.
The post is interesting, but all I see, other than Figure 4, is model outputs and model outputs compared with other model outputs. I was afraid the post would degenerate into wiggle-matching, which is, again, merely interesting. The talk of being “out of phase” disturbs me. Sounds like “epicycles,” again. But more will be revealed, no doubt.
Just to throw this out, a decade ago I did an in depth look at sunspots, magnetism, and planetary orbits, and came to a strong opinion that the 11 year orbital period of Jupiter was a complete coincidence to the 11 year solar cycle.
Noted that the author here presents some graphs, but no basis for what makes the graphs. That is very suspect in my opinion, along side my prior detailed look at the 11 year cycles. The chart of Jupiter or Saturn alone, with nearly no effect, and then amazingly together, a huge effect….just saying, I think it’s plain wrong.
““the clearly dominant spectral band in sunspot number, the solar cycle of 10.8 years, is given by the configuration period of Jupiter and Saturn (19.859 yr) times the ratio of their distances from the Sun (0.545).”
Please explain the significance of using these numbers. And what is the 10.8 year solar cycle? There are actually no cycles of 10.8 years length. Perhaps it is all just self justifying numerology.
So the position of the planets influence the sun, which then influences our climate, which can then influence our lives and perhaps even our happiness. Does this mean Astrology may be onto something?
Hmm. Reading more carefully a paper that I posted a link to above:
Orbital resonance and Solar cycles by P.A.Semi
Emphasis added.
Correlation does not imply causation. I can’t buy this without there being an explanation of the physics involved. The forces are just too small to have any effect, IMHO.
True, and that’s the next part of the effort – to find the causation. A good amount of correlation does imply a relationship of some kind, wither one of the observed is a cause or there is a third party. Given the situation, however, it’s hard to think of any kind of third party that could cause both orbital resonance and sunspot cycles.
Don’t be fooled by the size of the effect. It is quite common for very small forces to have very large effects, if they occur at just the right time. The whole thesis here is about resonance conditions, where cyclical behavior reinforces like a child pumping a swing.
would plankton levels alter the amount of energy being stored by the oceans ? if this mechanism was affecting the level of uv output from the sun (it does vary by a huge amount) it could be responsible for huge fluctuations in plankton levels. when plankton levels are high would the sunlight that would normally go to warming the oceans be absorbed by the plankton and used for growth/population increase when uv levels were low ?
uv light kills/damages plankton, so fluctuation of uv light output from the sun must have a huge effect on the plankton levels. in turn with plankton being the largest individual biomass on the planet could this have an effect on the climate. pure speculation on my part ,but something i have been pondering for a while.
@bit chilly.. that is an interesting idea since UV is filtered by the atmosphere. When they did the drilling a few years back, along with pollen, ( some plants like it warm and some don’t) they were able to tell whether the ocean water in various places had warmed or cooled by type.
Well then, what does prove causation?
Granted the effect is small but it is a regular, “pulsing” influence and it has had billions of cycles to reinforce itself. Not proof but worthy of some study.
Actually, strong correlation DOES IMPLY causation. It just does NOT PROVE it. And small forces can have large effects if they are cyclic. For example, I can get a large suspended weight to swing in big arcs by tapping it lightly – if I tap at the right frequency – the resonant frequency of the system.
There is a hypothesis here, and it makes predictions. Let us see if the predictions pan out. If not, there is something further to learn.
A picture may be worth a thousand words but it’s no substitute for a formula accompanied by tables of data.
Back in my youth I had an old German physics professor. Once he wandered about the room talking to the students, and while they were not looking would change the signal generator driving the experiment. It was a lesson hard learned by most, that when you are measuring an effect, you must also monitor the INPUT.
My father invented a little game where we would fall backwards and he’d catch us. Then once, he’d just let you fall and smack yourself on the floor and then say : “that’ll teach you not to trust ANYBODY!”
Same principal I guess.
The claim that a model completely explains something, backed only with model output figures that cover only a portion of the period for which there is data and no direct comparison between model output and real data should make everybody here at WUWT very suspicious.
Are we skeptics or believers?
The influence of solar variability on climate change is not what it is being discussed, but the claim that this particular model based on planetary movements can completely account for solar variability when no evidence is shown to support such claim.
Extraordinary claims require extraordinary evidence.
I’m treating this as an introduction to a possible new and interesting hypothesis. There’s really not enough information to evaluate it right now. I expect more details to follow. If that does not happen, then I’ll ignore it.
There is also the possibility that if the larger planets are effecting the sun, that this planet could be affected as well. I can understand that it is very complex. Quantifying it is a different matter.
I thought that maybe we might never solve this problem. … I’m always reminded of the first computer simulation of weather. Things were going along fairly well, then by chance the electricity went out. When they restarted it, the results were different because of the rounding and number of decimal places. … but then ” never say never”… I can see where we might… ripples in a pond sort of…
Predict solar cycles and you can predict earth’s climate.
Sunspot number anomaly time-integral plus net of the effect of all ocean cycles plus effect of water vapor increase provides a 98% match to measurements 1895-2015. Analysis and graphs are at http://globalclimatedrivers2.blogspot.com Water vapor increase is countering the temperature decline that would otherwise be occurring and might also be contributing to recent widespread flooding.
is the increase in water vapour responsible for the “missing heat ” ? a more humid atmosphere at the same temperature obviously contains more energy .
In the 28 yr 1988.5-1016.5 TPW increased about 1 kg/m^2
Heat of vaporization of WV = 2.465E6 J/kg
Earth area = 510.1E12 m^2
Energy to increase TPW = 1*510.1E12*2.465E6 = 1.257E21 J in 28 yr
1.257E21/28 = 0.49E20 J/yr
This isn’t much compared to Trenberth’s estimate of about 65E20 J/yr missing,
thanks for the informative reply.
On one of my first ever posts on WUWT – back in around 2008/2009? – I – a mere geologist and amateur astronomer – postulated that the interplay of Jupiter and Saturn must have an influence on the solar cycle. I was immediately shot down in flames by none less that Dr. Svaalgaard. To me it wasn’t rocket science: The 29.5 yr cycle of Saturn coupled with the 11.9 year cycle of Jupiter would cause a more ‘chaotic’ cycle of roughly 22 years. Or two ’11 year’ solar cycles. Throw into the mix Uranus and Neptune and we might get something predictable. As the chap on “The Layman’s Sunspot Count” website has been trying to get people interested in for a while…
Who knows, eh? The late Jack Eddy certainly didn’t. And I remember the humble quote which was posted here as a tribute on his untimely death.
My observation back then was that Jupiter and Saturn are either in opposition or conjunction every roughly 22 years.
Jimmy, could you explain how you get 22 from 11.86 and 29.5 ? Thx.
I suspect he meant that the period between conjunctions or between oppositions is 22 years. If you start with Jupiter, Saturn, and the Sun in a line (a conjunction), it takes ~22 years for them to line up again. Jupiter is back where it started in 11.86 years, but saturn has moved along ~144 degrees in its orbit. Jupiter needs to rotate through that and then more to catch up. In general, the time is Jp*(sum((Jp/Sp)^n,n,0,inf)) which is [1/(1-Jp/Sp)]*Jp whereJ p is the length of Jupiter’s orbit and Sp is te length of Saturn’s orbit.
That is the equation for an alignment of Sol J and S from a viewpoint on earth.
If you want to use that as a period of sun spot cycles it implies that the Earth is part of the cause too .
ShrNfr said: In general, the time is Jp*(sum((Jp/Sp)^n,n,0,inf)) which is [1/(1-Jp/Sp)]*Jp whereJ p is the length of Jupiter’s orbit and Sp is te length of Saturn’s orbit.
Show your work please. Both equations yield a distance (in terms of “the length of Jupiter’s orbit”), which is definitely NOT a time.
Jp is the length of the orbit in TIME. Sp is the length of the orbit in TIME. If Jupiter, Saturn, and the Sun are in a line, after a Jp of time, Jupiter will have gone through 360 degrees of rotation and Saturn will have gone through Jp/Sp * 360 degrees of rotation. Jupiter now needs to rotate through that to “catch up with” Saturn. It does that in Jp*(Jp/Sp) in time. Of course, Saturn has not stayed still. It has rotated an additional Jp*(Jp/Sp)^2 * 360 degrees. Recurse and you get the formula for time. The earth has nothing to do with it. If he meant conjunctions as viewed from the earth, there are additional meaningless terms. Meaningless because the postulated effect depends on the gravity of Jupiter & Saturn and not on the gravity of Earth.
Again, a hypothesis that makes predictions. Certainly, it would not be outrageous for something to “pump” an oscillator that amplifies the pumping. Still, I am concerned about why there were few sunspots during middle of the last millennium. If all it does is to modulate another deeper process, the deeper process should be of interest.
Color me agnostic and awaiting the results of comparing the predictions versus the observations.
Predictions and observations are compared at http://globalclimatedrivers2.blogspot.com 2015 trend predicted from 1990 differs less than 0.07 K from measured trend in 2015.
Is that the prediction you are talking about Dan?
You will pardon me, but predictions involve unknown but measurable values in the future. I can overfit a model ten ways to sunday to agree well with noise.
I have no problem involving the sun as the major driver of the earth’s climate. I consider it much more so than the cause espoused by the Escathological Cargo Cult of the CAGW.
Greg’s temperature graph bears ZERO correlation with reality…
GISS or HadCrud?
It shows steep nearly linear warming from 1980 – 2010…
no 1998 El Nino peak.
Its a load of fabricated garbage.
Greg – Yes, that was the prediction from 25+ years ago before the sudden sharp increase in water vapor as shown on Figure 3. The prediction from 2015, as shown on Figure 11 reflects the ongoing comparatively steep WV increase and predicts a 2020 trend about 0.06 K higher than the prediction from 1990.
Compare this to the 0.5 K or so error for the GCMs as shown at https://judithcurry.com/2015/12/17/climate-models-versus-climate-reality/
The stated skepticism HERE is good to read,but don’t slam the door shut yet, since it is not specifically shown by anyone that this is a poorly written working hypothesis.
I am glad Anthony Watts,chose to expose this line of thought,to allow debate on the merits of the Hypothesis.It needs more support before it can be considered worth following as time is limited in research.
Sure, but it would be great to present some data and formulas and tables, and not just some charts with no backup
I didn’t read all the prior posts, but I know the answer to your question here.
Dr Leif says the Sun’s dynamo at minimum is “primed” by the residual magnetic field when the Sun’s field drops to zero.
Well there are 5 other dynamo’s and one great big chunk of iron in orbit around the Sun.
Jupiter, Saturn and Neptune are all North, Earth and Uranus are South.
And of course the Sun flips. And there was a paper showing the Sun and Earth’s magnetic filed will connect, so we know that is possible.
So, magnetic field lines can bundle up, and connect to the opposite pole between all of these moving magnets, and while the distances are far, they are big magnets.
But if you can picture the field lines bundling up and interconnecting between all the planets, the resultant field during the all important zero solar crossing point, would be susceptible (I’m supposing) to the planetary fields, and whether the magnets strongly add, or weakly add, or are blocked or shielded by another planet.
You are going back to the nonsense of “The Jupiter Effect” that John Gribbin wrote about 40 years ago.
Hi, is that “the” Jean Meeus , the astronomer?
Yes, that’s me.
How fortunate. Welcome aboard.
I tried to find a means of contacting you last year and drew a blank. I need someone with a deep understanding of the subtleties of lunar motion to help me explain an odd relationship I have noticed.
I did quite a bit of research to get the best values for various lunar periods and your work seems to be central to a lot high precision values that are used.
I’ll try to dig out the details.
OK, these may not be the most accurate figures I found but they serve to demonstrate the question:
pApsides=8.85058058889194 # polynomial @ y2k
pSaros= 17 + (365 +(11+1/3.))/days_per_year = 18.0303665436874
mean frequency of these two periods :
pApSaros=2/(1/pApsides+1/pSaros)
11.8730348309697
http://nssdc.gsfc.nasa.gov/planetary/factsheet/jupiterfact.html
pJ= 4332.589 / days_per_year = 11.862236 year
These two periods will align something like every 25771y. Which I think is due to a mix of referential frames. In short it seems like there is a resonance between the saro period and lunar apsides which matches the mean orbit of Jupiter.
So my first question is : is this something which has already been noted or has an obvious explanation?
I would be most appreciative if you could comment. Thanks for any help you can give.
PS. can you suggest a means of determining a better figure for the mean saros period ? That one with 1/3 day in it seems to be based on the near repetition of alignment over three cycles. Is there a more accurate figure?
Yeah,I remember that silliness from John Gribbin, who should have known better as he has a Physics,Astronomy and Astrophysics degrees in his back pocket.
He sold a lot of books to push it:
Predictions
(1974) The Jupiter Effect: The Planets As Triggers of Devastating Earthquakes (coauthor Stephen H. Plageman), Random House ISBN 0-394-72221-3; revised edition published as The Jupiter Effect Reconsidered, Vintage Books (New York, NY), 1982 ISBN 0-394-70827-X
(February 1982) The Jupiter Effect Reconsidered
(1983) Beyond the Jupiter Effect, Macdonald ISBN 0-356-08686-0
He also published books on Global warming, like the good alarmist he is. He has no credibility for me at all.
https://en.wikipedia.org/wiki/John_Gribbin
could this be supported by the fact that a 7 year cycle has been found on proxima centauri, where none was expected … would it point to existence of large planets? https://www.sciencedaily.com/releases/2016/10/161012155933.htm
There would also be gravitational effects on Proxima Centauri from α Centauri (a system of two Sun-like stars) and β Centauri (two big stars and a dwarf).
Alpha Centauri A (α Cen A) has 110 percent of the mass and 151.9 percent of the luminosity of the Sun. Alpha Centauri B (α Cen B) is smaller and cooler, at 90.7 percent of the Sun’s mass and 44.5 percent of its visual luminosity.
Beta Centauri’s components are called β Centauri Aa, Ab and B (a B1 dwarf). Aa is 12.02 ± 0.13 times as massive as the Sun, while Ab is 10.58 ± 0.18 times as massive.
I am a bit confused about this article, or blog post,
and the relation of the following comments mostly.
The base of the article is about the assumed solving of the Sun spots “mystery” of its activity and its causation, very little actually how that offers a better support to the assumption that the Sun’s variation causes climate change.
Probably the author of this post can clarify it better.
In mean time my only criticism about the the sun variability and its its impact in climate can be related to this:
“The second edition expands on that with a co-authored paper (Ed and myself) entitled Aspects of Solar Variability and Climate Response which details the relative contribution of those planets.”
Where I think the appropriate tittle of the named co-author paper should have been :
” Aspects of Solar Variability and Weather Response” instead of what it actually is.
As far as I can tell there is no any data or evidence suggesting or supporting any kind of assumed climate response to any Solar variation, let alone the short term Solar variation.
All atmospheric response to Solar variation consist as only a short term one, a weather response, which actually can show how able the short term atmospheric processes can be and respond to Solar variation and nullify any possible long term effect from such variations of Sol. Aka no any climate response to Sun’s variation possible, as there no such effect existing in first place.
No matter how good the assumed understanding or the science of the solar spots and their causation could be, still this can’t change the fact that in climate terms such variation of Sun do not have even the slightest correlation with climate and climate change, for not saying that at times the data show actually that even in the case of a link found that is in the terms of negative relation instead of positive.
From my point of view the “old” fallacy still persist, the basic fallacy of “climate considered as long term weather”……
cheers .
Not exactly. The paper is concerned with a resonance relationship between the planetary motion and sun spot activity. The relationship between sunspots and climate is a separate issue which has been discussed elsewhere. However, if you accept that relationship than this does explain certain observed timings.
The tidal effects of orbiting planets affecting the fusion cores of stars should be intuitively obvious. Most of the stars we observe are variable with random, but mostly fixed, periods and amplitude. Only the effects of gravity are powerful and variable enough to result this much random, yet predictably periodic, behavior.
I am reminded of the works of Scafetta, not only with respect to orbital cycles, but also with respect to effects of angular momentum on solar dynamo activity. I note that this site has been critical of Scafetta’s work as mere ‘curve fitting’. This work would seem little different.
Rather dramatic Red Alert solar event in progress, Boyle Index just spiked to 255, and that ain’t nothing to sneeze at:
http://mms.rice.edu/realtime/forecast.html
ISSUED AT 0350 UT ON 13 Oct 2016 by Space Weather Services
FROM THE AUSTRALIAN SPACE FORECAST CENTRE
A coronal Hole is expected to become geoeffective tomorrow, 14 Oct. A minor geomagnetic storm (Kp=5) is possible during 14-15 Oct, possibly resulting in significant space weather activity and visible auroras during local nighttime hours.
“In fact the Earth’s climate is exquisitively sensitive to changes in solar output, as shown in Nir Shaviv’s 2009 paper Using the Oceans as a Calorimeter to Quantify the Solar Radiative Forcing. Professor Shaviv found that the total radiative forcing associated with solar cycles variations is about 5 to 7 times larger than just those associated with the TSI variations.”
Leif Svalgaard didn’t think much of the Shaviv’s 2009 paper ….
https://wattsupwiththat.com/2009/04/15/the-oceans-as-a-calorimeter/
“Leif Svalgaard didn’t think much of the Shaviv’s 2009 paper…”
And, I am sure, prof. Shaviv doesn’t think much about Leif.
As long as Sun’s effect on Earth’s climate is of any concern, Leif and Willis are done for.
I never read their rubbish any more.
David, I’ve posted this analysis of Herschel’s early and incorrect claims about sunspots several times. Perhaps you haven’t seen it. Here’s the abstract:
In other words, Herschel was way wrong, and you are foolishly following in Herschel’s footsteps.
w.
Did you actually read that paper?
It’s absurd to use, as the authors do, wheat prices not only from London in the 17th, 18th and early 19th century (when climatic effects were pronounced), but from the late 19th century, and from America in the late 19th, 20th and 21st centuries, plus yield here during that period. Modern agriculture in the UK and USA is largely freed from solar-influenced climatic variations. Wet and dry years do indeed still affect yield for dryland crops, but not irrigated, while price is set by worldwide markets.
You can download the whole study from this site, after proving you’re not a robot:
http://thirdworld.nl/order/7d8adf4b8b690e80261677fa12778b672a96c12f
I’m sorry, Chimp, but a claim that a paper is “absurd” is meaningless. This is particularly true when you say it is absurd to use all available data … really? Should we restrict ourselves to the paltry short dataset available to Herschel?
Also, I don’t understand how modern crops would be magically insulated from “solar-influenced climatic variations”. Yes, irrigated crops are somewhat insulated from vagaries of climate, but they are still subject to frosts and extreme temperatures. But irrigated crops are only a small part of world agriculture.
w.
Talk about foolish! I guess you still haven’t read the paper.
The price and yield data should be restricted only to times and places in which weather and climate fluctuations play a decisive role, which is not the case in the 21st century USA.
Irrigated cropland produces over 40% of the world’s food. You really ought not to comment on topics about which you know so little.
Moreover, the price and yield data since 1880 in the study are all from the USA, not from the UK or the world overall. In 2012, irrigated farms accounted for roughly half of the total value of crop sales in America. The relevant crop for this study is wheat. In the 17 “Western” states (11 Western contiguous states, plus six Great Plains states from TX to ND) which produce most US wheat, about nine percent of acreage but a much higher share of production is irrigated, thanks to much higher and more consistent yield.
Besides which, as I noted, the fact that wheat prices are now set globally means that the effect of weather in any one country or region has much less impact on price than it did in London in 1801.
So it is indeed absurd to use 20th and 21st century wheat price and yield data from the US to try to falsify Herschel’s hypothesis, since they are so much less affected by the natural variations he studied.
To quantify the effects of modern farming practices, from mechanization, fertilizer, pesticides, new seed strains, etc, consider that land which yielded at best 15 bushels of per acre in the soft white winter wheat region of the Pacific NW in the 1890s yielded 80 in the 2010s. This area practices summer fallow, so for an annual yield, you have to halve those numbers.
To quantify the effect of irrigation, compare the above 40 bu/A yield with that on much worse land in southern Idaho, where irrigation is universal. There, every year, regardless of rainfall, typical yields are over 120 bu/A.
The same tripling would show up in the irrigated regions of the Great Plains, which don’t summer fallow.
Can you now see why the authors needed to look only at dryland wheat from the era before the modern practices mentioned above, and preferably only on the same land? And why it was so absurd of them to compare, as it were, wild apples with an intensive commercial orchard of Fujis?
Further, when prices are high, more marginal land is planted to wheat, so yield falls, unless also more irrigated land is sowed to it rather than corn, potatoes, beans or some other crop.
Chimp, regarding wheat, there’s data here. It turns out that about 15% of the total US wheat crop is produced on irrigated lands. This includes the increased yield on irrigated vs rainfed lands (71 bushels/acre on irrigated vs 33 bushels/acre on rainfed).
This means that about 85% of the US wheat is rainfed and thus subject to all the vagaries of the weather.
Finally, that figure is for the US, which is likely the largest user of irrigation on the planet. Much less wheat in most other major wheat producing countries is irrigated. So irrigation of a tenth of the crop or so doesn’t mean that wheat is magically spared from the vagaries of the weather.
And despite the fact that as you point out the world wheat market is unified, that only affects the price. It does not affect the yields. And if the sun is affecting the wheat crop as you claim, surely it is doing so all over the planet. So if such an effect exists, we should be able to detect it in wheat yields.
But that detection of the purported solar signal,, of course, is something neither you nor anyone else has been able to do …
So if you’d like to make your case, you might consider giving up making excuses for the inability to find the elusive signal in the wheat yields, and instead provide some evidence that said signal actually exists.
w.
Using crops is useless and not reliable. More allthingsbeingequalism
Chimp October 13, 2016 at 12:04 pm
If you think that the weather doesn’t affect price and yield of cereal grain crops, you’ve never been a farmer …
According to the FAO, irrigated lands are only about 6.5% of the total agricultural area. More to the point, they are generally used for high-value crops, and NOT for wheat … which is what we are talking about.
So your claim is now not 40% but 9% … in other words, the overwhelming majority of wheat in the study is NOT from irrigated lands.
Here are the ugly facts. We can find NO EVIDENCE that the minor ~ 11-year solar variations in the sun has had any affect on wheat prices. This is true for BOTH old and new prices, as you yourself have pointed out when you said:
TLDR version? There is no evidence for Herschel’s claims, neither modern nor historical. If you have such evidence, now would be the time to bring it forward …
w.
I have been a farmer and I know that local WX affects yield, but much less so price for wheat, which is set globally, although local markets can be affected by WX to some extent. They don’t stray far from the world market, however.
You failed to grasp the essential point that nine percent of land produces a far higher share of the total crop than that, thanks to much higher yield, ie triple even the best dryland yield and up to six times lower quality land.
You seem to struggle with elementary arithmetic.
If, as I keep urging you, you had read the paper, you’d know of previous studies confirming Herschel’s results, such as Jevons’ 1875 paper. Of course it is now not possible to confirm his and Herschel’s findings because modern agriculture is so much freer of dependence on the weather, as I’ve showed. The study you cite relies far too heavily on 20th and 21st century data.
Since you refuse actually to read the paper you cited, this contains a link to Jevons:
https://www.bloomberg.com/view/articles/2014-11-13/that-sunspot-could-make-you-a-killing
“William Herschel’s hypothesis that solar- cycle variation of the Sun’s irradiance has a modulating effect on the Earth’s climate and that this is, specifically, manifested as an anticorrelation between sunspot number and the market price of wheat.”
…
“As a test of Herschel’s hypothesis, we seek to reject a null hypothesis of a statistically random correlation between historical sunspot numbers, wheat prices in London and the United States, and wheat farm yields in the United States.
The analysis above is so terribly flawed that it is almost laughable. A little knowledge applied in a way that is wrong is a terrible thing. “William Herschel’s correlation of sunspots and the wheat price in England dates from 1801”
In 1801, assuming that the demand for wheat was fairly stable, the price of wheat would be very dependent on the volume of wheat and other grains supplied to the market. Wheat prices would go up if there were a shortage of other grains then. But now, this would not be so apparent given the size of the markets and inventories.
I’ll skip the analysis of the substitution effect I mentioned above and skip to just talking about one crop – wheat. Let me put it in a way that is more mathematical. In 1802, wheat yield was dependent on several variables that were not very controllable. Later, those variables were controlled.
For example, there are a number of “variables” diseases and insects that impact wheat yield that are now controlled by chemicals, a better understanding of the disease process and better wheat varieties. Due to the changes, diseases and insects have a lower impact on wheat yield. Farmers have access to better weather forecasts than they did in 1801. This can have a very large impact on yield. Chemical fertilizers and better seed varieties also reduce variability in wheat yield due to changes in weather. Farming has become more predictable and less dependent on having perfect growing conditions.
In 1801, variables such as small changes in humidity or timing of rainfall, when the crop is planted, changes in ultraviolet radiation have an impact on crop diseases. Length and depth of winter weather have an impact on insect survival that has a large impact on wheat yield. These variables are now much better controlled and have a much smaller impact on wheat. This is apparent to gardeners and farmers who use totally organic methods.
Next, types of weather that might have a large impact on wheat yields in England might correspond to conditions or weather that causes better wheat yields in other parts of the world. In 1801, the wheat yield in Argentina would have a low impact on wheat price in London. Now, this is not true. A poor wheat yield in England combined with a good wheat yield in London may leave the wheat market unmoved. In 1801, that is not true.
Correct.
It is laughable, not just almost. And absurd.
But this is what passes for statistical analysis in the post-scientific world of “climate science”. So anathema are solar influences on climate that even Sir William, one of the greatest scientists of the 18th and 19th centuries must be attacked and falsely laid low. Instead, we have lowlifes like Mann.
It’s totally on the wrong track. The solar cycle of 11 years is the time it takes for the magnetic field to flip direction from North to South. But, a full cycle is North, to South, back to North again, and that’s 22 years. That’s where the resonance is, and where a coherent driver would have to be.
But, a resonance does not need a coherent external driver to produce quasi-periodic behavior. Random forcing will do it, as the resonance concentrates energy storage and release at its natural frequency. Hold a pot of water while driving down a bumpy road. You will see the water slosh at the same frequency regardless of the fact that the bumps are randomly distributed. But, occasionally, the slosh will dissipate (did someone mention the Maunder minimum above?) before ramping up again, and its phase will vary over time. That is the nature of randomly driven resonances. That is what we see with the Sun.
And, the random forcing from chaotic dynamics within the Sun’s core is well beyond the level that would totally dominate the teeny, tiny, infinitesimal effect of planetary tidal forcing. Trying to fit the plethora of astronomical cycles to solar observations, and pronouncing it the driving force, is numerology.
That’s where the resonance is, and where a coherent driver would have to be.
I agree, The visual variability witnessed by SSN is just the magnitude of a signed quantity. The noise pattern also suggests that the driver may be related to the sqrt of SSN.
David, I also did a complete analysis of Nir Shaviv’s paper about using the ocean as a calorimeter. I have shown that his claims are statistically not significant. No one found any flaws in my analysis. But that’s not uncommon in the “It’s the sun!” wing of climate science, false claims of significance abound.
You have cited Nir’s paper, saying:
… but you haven’t shown any problems with my math, my logic, my statistics, or any part of my work.
Nice try. Until you can show that my analysis of Shaviv’s statistically non-significant claims is flawed, Shaviv’s paper remains in the circular file along with the rest of the usual solar nonsense written about Hershel and the like.
w.
or you are putting too much faith in SST :p
mark – Helsinki October 13, 2016 at 1:48 pm
Professor Shaviv is the one with faith in SST, not I …
w.
Just a grenade W, I never expected a reply mate, carry on.
and thanks for the correction.
“using the oceans as a calorimeter ” does this take into account what the solar energy is turned into in the oceans willis ? stored heat or increased biomass beginning with plankton and ending with increased stocks of fish species ,similar to the gadoid outburst ?
i have no opinion on the claims made in this particular guest post. it does however prompt a bit of thought provoking , for me anyway.
At perihelion, closest, solar irradiance arriving at the earth is 1,415 W/m^2. At aphelion, farthest, solar irradiance arriving at earth is 1,323 W/m^2. The total variation is 92 W/m^2.
Because of the tilted axis and the oblique incidence of sunlight, TSI on a horizontal surface at ToA 40 N latitude is 630.5 W/m^2 at winter solstice and 1,268.5 W/m^2 at summer solstice, a total fluctuation of 638.0 W/m^2. These values also account for winter solstice currently occurring at perihelion.
The total impact of 261 years of additional atmospheric CO2 is a radiative forcing of 2 W/m^2 (Figure SPM.5). IPCC’s worst, worst, worst, worst case scenario is RCP 8.5 (W/m^2). How are we supposed to take these relatively trivial amounts seriously?
BTW an ISR of 342 W/m^2 +/- so often cited in assorted power flux balances, e.g. Trenberth et al 2011jcli24 Figure 10, is the consequence of a thought exercise supposing the solar irradiance is spread evenly over the entire ToA spherical surface. Interesting approach for conceptual conversation and theoretical purposes, but absolutely nothing to do with reality.
And then there is the upwelling/downwelling/”back” radiation fiasco.
The GHG/GHE theory displayed on the power flux balance referenced above shows 396 W/m^2 upwelling from the surface. This upwelling power flux is calculated by inserting an alleged average surface temperature of 59 F, 15 C, 288 K in the S-B BB equation with an ideal emissivity of 1.0. I consider this an invalid application of S-B. Can you explain why this S-B BB calculation is appropriate?
The 396 W/m^2 is 55 W/m^2 more than the 341 W/m^2 incoming solar energy at the ToA, 155 W/m^2 more than the 239 W/m^2 net of albedo passing through the atmosphere, and 235 W/m^2 more than the 161 W/m^2 power flux arriving at and absorbed by the surface. After accounting for all of the known upwelling power fluxes there is an unexplained and unsourced net 333 W/m^2 power flux loop with no apparent origin. Per the laws of conservation of energy, energy cannot be created nor destroyed, only transformed. Where do all of these spontaneous power fluxes originate?
The 333 W/m^2 upwelling/downwelling loop is 100% efficient, a perpetual energy loop and violation of thermodynamics.
The 333 W/m^2 upwelling is absorbed by GHGs distributed throughout the troposphere which has an average temperature of about -40 C, 233 K. The S-B BB power flux for this temperature is about 150 W/m^2 or about half of the downwelling power flux claimed by the theory.
Per thermodynamics energy cannot flow, i.e. downwell, from low energy, 233 K, to high energy, 288 K, without the addition of work, e.g. a refrigerator. There is no outside work indicated.
The GHGs in the troposphere reradiate in all directions, there is no preference for radiating back to the earth. Let’s say 30% radiates back to the earth. GHGs are mostly transparent and CO2 has an emissivity of about 0.1. (Dr Nasif Nahle) Including these coefficients reduces the “back” radiation to about 4.5 W/m^2. Nowhere close to the theory’s 333 W/m^2.
Not that it matters. There is no apparent connection between the figure’s GHG/GHE loop and the radiative balance at ToA which NASA defines as 100 km. If this GHG/GHE loop is simply erased from the graphic there is no change in the ToA radiative balance and no difference in the temperature of the atmosphere.
“These values also account for winter solstice currently occurring at perihelion.”
Oh, yeah? Check your dates.
“Per thermodynamics energy cannot flow, i.e. downwell, from low energy, 233 K, to high energy, 288 K, without the addition of work”
OMG , here we go. A photon does not know where it’s going to land when it gets emitted. The 2nd law only indicated net flow which is still out from the warmer earth even if there is some back radiation.
99% of the atmosphere’s mass is below 32 km. Above this level concepts like heat, temperature, conduction, convection get a lot fuzzy and S-B BB radiation rules. Below this level S-B loses out to conduction, convection, latent, etc. i.e. a large helping of emissivity.
“A photon does not know where it’s going to land when it gets emitted.”
So random re-radiation can’t deliver 333 W/m^2 both ways, as much down welled as up welled, and the “loop” dies out. Any of the multiple ways you cut it this GHG/GHE loop cannot work as advertised.
I don’t recall an “net” flow theories in my thermo classes. Granted that was long time ago. Or any real actual examples in over 30 years of power generation experience. If this “net” were a real thing somebody would be making using of it.
January 4, 2017. Next perihelion.
Agree on this point.
Anything above 0K will emit photons.
So a 250K object will emit photons to the 300K object, but the 300K object will emit more photon’s.
So the net flow is from the 300K object to the 250K object.
Nicholas,
True. The Second Law does not mention anything concerning “net flow”. That’s a modern pseudo-science invention. Heat transfer is a one-way proposition; hot to cold.
With this “net” flow invention, you get all kinds of silly notions, like the earth actually warming the sun a minute amount.
Thermodynamics is about statistical properties of matter, not ejection of photons. Use some statistical term if you don’t like ‘net flow’ , I was just trying make the point that thermodynamics does not treat individual emissions and there is no reason why atoms in the high atmosphere can not emit downwards. This is not contrary to the 2nd law.
Greg,
“….no reason why atoms in the high atmosphere cannot emit downwards…”
OK, but S-B including temperature, emissivity, and random percentage calculate an almost undetectable amount.
Nicholas Schroeder October 13, 2016 at 1:17 pm
“A photon does not know where it’s going to land when it gets emitted.”
So random re-radiation can’t deliver 333 W/m^2 both ways, as much down welled as up welled,
Really, why not?
I don’t recall an “net” flow theories in my thermo classes. Granted that was long time ago. Or any real actual examples in over 30 years of power generation experience. If this “net” were a real thing somebody would be making using of it.
Perhaps you should have taken a course on radiational heat transfer, it’s being made use of on a daily basis.
http://images.slideplayer.com/24/7362225/slides/slide_14.jpg
Phil,
Heat transfer “q” is only one way, from the high temperature to the cold per the heat transfer equation. There is no two way heat transfer, as per the Second Law as well.
http://www.thermopedia.com/content/4764/ParaPF1.gif
SkepticGoneWild October 15, 2016 at 10:38 am
Phil,
Heat transfer “q” is only one way, from the high temperature to the cold per the heat transfer equation. There is no two way heat transfer, as per the Second Law as well.
Photons are traveling in both directions, ‘q’ is the net heat transfer between the two plates.
Suggest you read Hottel and Sarofim
https://www.amazon.com/Radiative-Transfer-McGraw-Hill-Mechanical-Engineering/dp/B0006BOZ9K
Phil,
I already have physics and thermo texts from my university courses. “q”, or heat, transfers in one direction only. You are confusing “heat” with electromagnetic radiation. “Photons” are not heat. There is no “net” heat transfer. The heat transfer equation and the Second law specifically state which direction heat transfers; hot to cold.
skepticgonewild October 15, 2016 at 12:07 pm
Phil,
I already have physics and thermo texts from my university courses. “q”, or heat, transfers in one direction only. You are confusing “heat” with electromagnetic radiation. “Photons” are not heat. There is no “net” heat transfer.
But apparently not Radiative Heat Transfer!
The T2^4 term is the heat transfer from plate 2 (flux of photons*h𝞶) to plate 1, whereas the T1^4 term is the heat transfer from plate 1. ‘q’ is the net heat transfer from plate 2 to plate 1.
Only “q” is the heat transferred in that equation. Heat does not get transferred from cold bodies to hot bodies. That would be a violation of the Second Law as well. Plus if the low temperature plate in the diagram you posted would cause the warmer plate to warm up further still, then the new warmer plate would then warm up the colder plate more…..with the self heating cycle continuing on and on. You would also be violating the First Law, since your two parallel plates would be warmer than original. That’s creating energy out of nothing.
Maybe we are saying the same thing, but maybe not. You stated:
“The T2^4 term is the heat transfer from plate 2 (flux of photons*h𝞶) to plate 1, whereas the T1^4 term is the heat transfer from plate 1. ‘q’ is the net heat transfer from plate 2 to plate 1.”
I would state the above as follows:
“The T2^4 term is the energy transfer from plate 2 (flux of photons*h𝞶) to plate 1, whereas the T1^4 term is the energy transfer from plate 1. ‘q’ is the heat transfer from plate 2 to plate 1.”
I think you are conflating “energy” and “heat”. Stand next to a huge block of ice. The ice is emitting infrared energy towards you, but it will not cause you to heat up.
Nicholas Schroeder, why are humid nights *warmer* than nights with low humidity?
_Jim
Why are casual anecdotes as good as data?
Nicholas already answered that: “Below this level S-B loses out to conduction, convection, latent, etc. i.e. a large helping of emissivity”.
When air temps near dew points, the rate of cooling at night drops to a quarter or less the cooling rate earlier the same night when rel humidity was less than 80% or so. More water vapor, the higher the dew points.
As to ‘Griff’, we shd have an Appreciation Week for Griff” to recognize what he brings to the debate:
1. A Court Jester’s ability to reduce us to rib-aching laughter;
2. A constant reminder that there really are people out there who still think like him;
3. Living evidence of the power of propagandists and mannipulators to convert the gullible to zombie-like adherence to the Cause, regardless of any contradictory evidence.
I always watch out for his postings as I know I’m going to be entertained. I often wonder if he is an invention of Anthony’s to crank things up a notch on a ‘slow-day’?
Let’s hear if for Griff!
I’d like to thank the many dedicated scientists of the world, without whom all this would not have been possible…
Edward Rowland Sill. 1841–1887
The Fool’s Prayer
THE ROYAL feast was done; the King
Sought some new sport to banish care,
And to his jester cried: “Sir Fool,
Kneel now, and make for us a prayer!”
The jester doffed his cap and bells, 5
And stood the mocking court before;
They could not see the bitter smile
Behind the painted grin he wore.
He bowed his head, and bent his knee
Upon the monarch’s silken stool; 10
His pleading voice arose: “O Lord,
Be merciful to me, a fool!
“No pity, Lord, could change the heart
From red with wrong to white as wool;
The rod must heal the sin: but, Lord, 15
Be merciful to me, a fool!
“‘T is not by guilt the onward sweep
Of truth and right, O Lord, we stay;
‘T is by our follies that so long
We hold the earth from heaven away. 20
“These clumsy feet, still in the mire,
Go crushing blossoms without end;
These hard, well-meaning hands we thrust
Among the heart-strings of a friend.
“The ill-timed truth we might have kept— 25
Who knows how sharp it pierced and stung?
The word we had not sense to say—
Who knows how grandly it had rung?
“Our faults no tenderness should ask,
The chastening stripes must cleanse them all; 30
But for our blunders—oh, in shame
Before the eyes of heaven we fall.
“Earth bears no balsam for mistakes;
Men crown the knave, and scourge the tool
That did his will; but Thou, O Lord, 35
Be merciful to me, a fool!”
The room was hushed; in silence rose
The King, and sought his gardens cool,
And walked apart, and murmured low,
“Be merciful to me, a fool!” 40
Off topic
There was hoopla that September was the strongest Arctic sea ice growth in recorded history for September ( I wont mention that the start dates for each year vary, call it a handicap race) however October looks like it may well be the slowest growth. 5.04 msqkm on the 1st and only 5.37 by the 12th. Thats almost a flat liner.
Now back to solar / sunspots and the great post above.
There’s a lot of variability on the fortnighly scale, so looking at any such periods and trying claim a record this or that is meaningless. Suzanne Goldberg who sometime manages to sell here dross to the Guardian tried this on during the spring this year, claiming that some cherry picked period was the steepest whatever in “recorded history”.
The next two weeks went the other way and the spring melting was generally slower than average.
http://realclimatescience.com/2016/10/starting-their-graph-at-the-right-year-to-produce-maximum-fraud/
Yes, with very low concentrations across the remaining ice and much dispersed ice there was a quick freeze up after minimum, but now it has slowed right down… We are pretty near a lowest ever for this date.
https://seaice.uni-bremen.de/amsr2/index.html
also the volume figures are low…
take a look at this:
I don’t base my scientific knowledge on youtube vids. Apparently, you do. That may explain a lot.
The only DATA we have on ice volume is from Cryosat2. Go look at that.
“We are pretty near a lowest ever for this date.” So what does one day tell us? That’s even less informative than a two week “trend”.
Yes ice area/extent is about a slow as it was in 2007 : a decade ago. It now higher than is was in 2012 five years ago. Hardly OMG run away melting.
Griff bases his “science” on Garniad articles, and then goes from there, he has stated that, but he has never posted where that article leads. So, one can safely extrapolate that he knows nothing other than what is in the media, ie, nothing in scientific reality!
Hey, I don’t base my science on any type of article – I base it on the science.
but if I want to refer to that science on the internet, I need somewhere to refer to – a newspaper article linking to the research paper is a good way to communicate a summary of the science before people get into the detail.
and strangely, UK papers like the Daily Mail (for example) don’t refer to science much and the likes of the Times is paywallled.
Greg – you want to dispute the data represented in that video? any evidence the volume figures are not as shown?
And here’s another Guardian article for you all – links to research which examines the satellite temp data.
https://www.theguardian.com/environment/climate-consensus-97-per-cent/2016/oct/14/climate-scientists-published-a-paper-debunking-ted-cruz
Ignore the Ted Cruz clumsy link, look at what it says about the ‘pause’, satellite temp data
(worth a post of its on here admins????)
The lowest Ever in 37 years?… Get a grip Griff.
Griffter,
Apparently you haven’t noticed that Arctic sea ice has stabilized since stormy 2007, with the low of stormier 2012 holding in the even stormier 2016.
Antarctic sea ice of course has grown all during the interval since 1979. How is that possible, if a global air temperature rise due to man-made CO2 increase be the alleged cause of Arctic decline?
“Griff October 14, 2016 at 3:53 am
The recent paper just published looked at these two claims. The authors found errors in the analysis that, when corrected, debunked the contrarian claims. Let me explain some of the science.
First, these atmospheric temperatures are measured by satellites which can “see” the temperature of gases in the atmosphere.”
From the linked article, it is flawed right off the bat with that statement. If you knew what you were talking about you’d know why the last sentence is totally wrong and misleading.
If the giant planets are affecting the solar cycles how about the alleged Planet Nine. Would that produce an additional long period cycle?
Only when the moon is in the seventh house and Jupiter aligns with Mars.
How is the orbit of Jupiter supposed to cause sunspot cycles. Remember that the Sun is rotating on its axis with a period of 24.47 days at the equator and Jupiter’s orbit is almost circular and aligned with the equator of the sun. That means the only thing that changes over a Jovian year from the Sun’s point of view is that Jupiter is “overhead” at a slight different point in the rotation cycle, which unless there is something else up there to compare to is going to be completely unnoticeable. Given the symmetry of the situation there is absolutely nothing on the sun in relation to Jupiter which varies over an 11.6 year cycle apart from perhaps the relationship of Jupiter to the background stars; and good luck trying to even detect that from the surface of the sun.
Without a mechanism this is just astrology.
Uh huh.
If there was a convincing correlation, preferably one that made testable predictions, one could search for a mechanism later. This article does not even attempt to show a correlation.
I’m not even sure why Anthony posted it.
David, I don’t get it, perhaps because there is no link I can find to the “2016 paper” mentioned in the head post. You say:
Which paper is this referring to?
Next, I don’t understand the red line of the “full model” in your graph.
It does NOT line up with the sunspots. It does NOT have either an 11-year or a 22-year period. I don’t get it. What is it supposed to have to do with the sun?
w.
Who the is Moderating this conversation, Willis?
Sparks, moderation is done by a revolving crew of volunteers around the planet, a crew which most emphatically does NOT include me. I am a guest author, and I have neither the time nor the personality to be a good moderator.
And since we are discussing moderation, let me take this time to thank all of the moderators present and past who have helped make WUWT the success that it is. My hat is off to you. You provide order 24/7 in what can be a most fractious place.
Well done all!
w.
It is explained in this paragraph:
“It has long been suspected that the solar cycle is largely influenced by Jupiter due to the closeness of the average length of the solar cycle of 11 years and the orbital period of Jupiter of 11.86 years. In 1984, Schwentek and Elling noted that “the clearly dominant spectral band in sunspot number, the solar cycle of 10.8 years, is given by the configuration period of Jupiter and Saturn (19.859 yr) times the ratio of their distances from the Sun (0.545).” Just over a decade later, Attila Grandpierre confirmed that whatever was causing the solar cycle must be extrinsic to the Sun – which leaves the planets as the causative agent.”
The fudge factor of ‘times the ratio of their distances from the Sun (0.545)’ sounds like an invocation.
“…. configuration period of Jupiter and Saturn (19.859 yr) times the ratio of their distances from the Sun (0.545)”
And why on earth would you multiply a period by a distance ratio ?
Numerology.
Greg, I asked a similar question up thread and got no answer. Good luck.
———————————————————————————————————————————
Tom in Florida October 13, 2016 at 7:24 am
““the clearly dominant spectral band in sunspot number, the solar cycle of 10.8 years, is given by the configuration period of Jupiter and Saturn (19.859 yr) times the ratio of their distances from the Sun (0.545).”
Please explain the significance of using these numbers. And what is the 10.8 year solar cycle? There are actually no cycles of 10.8 years length. Perhaps it is all just self justifying numerology.
———————————————————————————————————————————
The paper would be more convincing if they used the ACTUAL sunspot solar cycle but it does not appear to do so. Just some smoothed “somethings”.
From W’s analysis earlier on WUWT “when a signal is so “completely diluted and hidden by noise” that it is lost in the weeds ” Could have also been describing WMAP CBR signal there 🙂
CBR is the physicists equivalent of seeing faces in clouds.
Exactly Greg, it’s a result of algorithms with ever changing coefficients. No map can ever be recreated, and they call it “science”.
More sensitive Planck telescope confirmed observations by WMAP:
https://www.newscientist.com/article/dn23301-planck-shows-almost-perfect-cosmos–plus-axis-of-evil
I know everything, there is no escaping my stupidity.
Scratched my bum
Take me of Moderation Willis, stop being a dick!
You’re not getting anything from me as long as I’m Moderated…
Free Speech, MY BALLS…
Moderate this Willis,
I (HEART) being Moderated!
Day 69, been Moderated for so long, sometimes this empty abyss has no meaning, the only item I have left is a small locket, but the locket isn’t important, it’s the beautiful picture of my Captain Caveman. I find funny.
Moderate me I’ll Moderate you!
Moderate all the bad guy’s like me, and be a hero…
CO2 dunn it
Crap, still Moderatedtiano
While I’m Moderated, I may as well discuss anything…
Take me off Moderation
I’m putting you into “moderation” 🙂
..No wonder you are on moderation…! ( P.S. 69 days ain’t nothing compared to me !! )
Sparks, given that we have volunteer moderators, combined with the need to provide moderation 24/7, this means that sometimes there is a delay of an hour or two between someone posting a comment and it being published. Not much Anthony can do about it, it’s the nature of the beast.
However, I see that in this case you are assuming that the planet rotates around your fundamental orifice and that the delay is personally aimed at your corpus delecti … sorry, amigo, but sometimes it actually isn’t all about you …
w.
“Every Picture Tells A Story” don’t it?
http://www.co-intelligence.org/newsletter/images/sun-etc.jpg
http://www.mrscott.org/uploads/8/4/4/3/8443919/278584.png
http://www.co-intelligence.org/newsletter/images/antares-etc.jpg
Nice. That really puts it in perspective, Carla.
When (and only when) I can walk out of my house (in the UK) on a July day with clear blue sky and the sun at its highest and not feel any heat on my body, only then will I question whether the sun has any effect on Earth’s climate (mainly the temperature part).
And if you were on the moon without that blue sky (all around you), what would you question?
Nothing!
Luc Ozade (@Luc_Ozade) October 13, 2016 at 8:39 pm
Luc, the question is not now and has never been “whether the sun has any effect on Earth’s climate”. Everyone agrees that it does have such an effect.
The question is whether the small ~11-year variations in the sun produce any detectable effect on the surface climate. To date, no one has shown any conclusive evidence of such an effect, which is why the debate continues to rage.
w.
Hi Willis 🙂 Yes, all the arguments/discussions regarding various ‘effects’ on the climate by many and varied factors will, I feel certain, ensure that they go on into the future. “Settled science” it certainly ain’t!
Nonetheless, I always find it deeply compelling and try to follow all the various arguments for and against (which is why I spend many hours here every day) trying to soak up information in my diminishing grey cells.
But I have observed that there seem to be two schools of thought on the subject of the sun’s effect on Earth’s climate. Probably, as you said, it is down, mostly, to how much of an effect (which is comparable to the effect of CO2 on climate, in some camps). I was simply voicing my own, observed, effect – thereby giving away my personal notion that it has far more effect than some (many?) people give credence to, irrespective of what the mathematical equations, physics laws and ‘energy balances’ may say.
Hope all is well with you and your beautiful ex-fiancee and look forward to reports of your next adventure.
More settled science. A group of astronomers have decided that there are 20 time more galaxies in the universe than we previously thought. This is very convenient because the current theory of the expansion of the universe show that there would need to be about 20 time more energy and mass in the universe than can be derived from observations.
This was regarded as huge problem by cosmologists and physicists …. until today.
https://www.theguardian.com/science/2016/oct/13/hubble-telescope-universe-galaxies-astronomy
Now they have a model to “correct” observations to fit their theory. Sound familiar?
“The question is whether the small ~11-year variations in the sun produce any detectable effect on the surface climate. To date, no one has shown any conclusive evidence of such an effect, which is why the debate continues to rage.”
Small variations my foot, the solar wind varies hugely. You’ve been shown stuff in your own work that you still apparently cannot see, like solar minima and the coldest periods on CET. Whatever solar linkage that you are given, you won’t see it Willis, it’s as simple as that.
Willis, I asked a further question, but it’s down below instead of being in reply to yours!
It’s not just the ~11 or 22-year cycle, but the longer solar variations which affect the climate of Earth and other planets in the system.
It’s the water in the air and in our skin that makes us feel that,
Willis, just a point to clear up, if you would please
So, do I take it from that that the sun does have a recognised, huge, effect on Earth’s climate, but the argument is over the ‘anomaly’ in fluctuations from a norm, produced during its 11-year cycle? I hope I made what I meant, clear.
Exactly, Luc. Everyone knows that the sun affects the climate. The question is, are the tiny 11-year sunspot-related variations big enough to cause a detectable signal in some surface climate dataset?
To date the answer seems to be no, and it’s not for lack of looking …
w.
But, whether the 11 year variation has a discernible impact or not does not settle the question of the long term impact.
It is rather obvious that the Earth has some very long term response mechanisms. These would attenuate forcings with short periods, yet respond to forcings with longer periods.
It is definitely from lack of looking. You simply ignore the hundreds if not thousands of papers showing this connection at high statistical confidence levels.
Or forget about those you have seen but haven’t been able to attack effectively. For instance, you merely dismissed out of hand Reddy’s (1984) discovery of a 52-year cycle in rainfall data for Brazil, without doing any statistical analysis:
https://wattsupwiththat.com/2015/12/10/noise-assisted-data-analysis/#comment-2093625
Bartemis October 14, 2016 at 12:11 pm
It is rather obvious that the earth responds to both daily and monthly variations in the solar input … so why would an 11-year variation be attenuated?
w.
Chimp October 14, 2016 at 12:38 pm
Oh, please, stop the handwaving and the over-the-top claims. If there were even one study showing an 11-year cycle in some surface dataset at “high statistical confidence levels”, the debate would be over … but the debate rages on.
Me, I’ve analyzed dozens of datasets that people thought were statistically significant, and I’ve found the usual kinds of errors—no Bonferroni correction, no correction for autocorrelation, no allowance for the fact that the sunspot signal is highly cyclical, inappropriate use of boxcar filters, the standard stuff. What I haven’t found is one solid connection between the 11-year variations and the surface weather. Not saying there isn’t such a connection, mind you … just saying that so far, I haven’t seen it.
In response I get my name trashed by people who can’t spell Bonferroni but who love to believe anything that supports their solar preconceptions.
A “52-year cycle”??? What on earth would that have to do with the sun? I’ve never even heard of a 52-year solar cycle.
And no, I did not “dismiss out of hand” the claim. In fact, whoever made the claim didn’t even provide a link to the data. I did find some data which may or may not have been the correct data. Here is my response:
Note that far from dismissing the study as you claim, I went the extra mile. I researched and found the dang data and I analyzed it. I found nothing like a 52-year cycle in my analysis. If you think such a cycle is actually there, then stop waving your hands and making empty claims, and ANALYZE THE DATA I JUST LINKED TO AND SHOW US THE !@#$%^&* 52-YEAR CYCLE YOU THINK IS SO STATISTICALLY SIGNIFICANT.
Alternatively, you are welcome to provide me with two links—one link to the best solar study you know of, the study that you think has “high statistical confidence levels”, and the other link to the data used in the study. If you provide the two links, I’ll take a look at the study and give you an analysis of whether their analysis is solid, or whether, like so many others, they can’t spell “Bonferroni” either …
w.
PS—Before you repeat your ludicrous claim that I’m not looking, consider my previous work:
Not looking? Osculate my fundament.
Willis Eschenbach October 14, 2016 at 9:19 pm
“It is rather obvious that the earth responds to both daily and monthly variations in the solar input … so why would an 11-year variation be attenuated?”
How is that obvious? We’re talking global here, not just your local patch of ground.
Can’t say I see much of a daily or monthly signal here. There is a fairly strong 4-5 year signal. I suspect that is a modulation of the 11 year solar cycle.
And, FWIW, this is what I think is providing the modulation. I originally posted this on these pages, and HS graciously recorded it for posterity.
Willis,
The few studies you have deigned to look at are a tiny fraction of all. When presented with many papers, you always say, “Just give me one”.
You may have conducted your own “analysis” of the Fortaleza data, but you didn’t show it. You just asserted that there was no such signal. What, as usual, you failed to do was read the original paper. Whether it was linked or not, Dr. Reddy’s 1984 paper should have been easy to find. Why should anyone take your word that there isn’t such a cycle?
Instead of asserting your view ex cathedra, like the Pope, how about looking at Reddy’s actual analysis of the Fortaleza rainfall data? If you can’t find the paper, it’s in his book, “Climate Change: Myths and Realities”, available from Google Books:
https://books.google.com/books?hl=en&lr=&id=y_GMTXRtxJ8C&oi=fnd&pg=PR7&dq=Dr.+S.+Jeevananda+Reddy+Fortaleza&ots=M3rwhhAqkL&sig=Vo3BRbuaIprozBFiylTZ6b6oVfM#v=onepage&q=Fortaleza&f=false
Chimp October 15, 2016 at 12:18 pm Edit
Chimp, I don’t say “Just give me one”. I say “Give me a link to the one that YOU think is best, along with a link to its data”. I note that rather than actually responding with two links, instead you want to abuse me and my work. Sorry, that dog won’t hunt—put up or shut up. If you have such a pair of links, then post them. If you don’t, don’t whine about my request. It is the only way I know of to winnow through the tons of solar bumph that I could not read in two lifetimes, as well as the only way I know of to convince honest doubters.
See, if I falsify some random solar paper, you’ll just go on believing, because I haven’t falsified the paper you depend on, the strong paper, the paper that made up your mind. Since that one remains unfalsified, you don’t care if I falsify some paper you’ve may never have heard of.
But if you are willing to actually take the time to determine which study you think is the best, and I am able to falsify it, you might have to re-examine your own beliefs.
Which is why most folks, including you (to date), are unwilling to put their money where their mouth is and identify what they think is the most solid study … they know they might not like the results of the analysis …
Hey, it was a comment in a thread, not a formal post, so sue me. I provided the Fortaleza data so that YOU or anyone else who did not believe me could show us that there was such a signal. I welcome your analysis.
Nobody should take my word on anything … or anyone’s word. Nullius in verba.
Regarding whether the paper is “easy to find”, not my problem. I used to go hunting for such things. I no longer do. It is a fruitless exercise. If you wish me to analyze it, provide the two links and I’m happy to do so.
Thanks for finally providing a link, much appreciated.
Reddy says he uses an “auto-regressive analysis” to determine the existence of the 52, 26, 13, and 6.5 year cycles. My first problem with that result is that despite being published in 2008, the Fortaleza data used in the study ends in 1981. This means that Dr. Reddy is diagnosing a purported wave with a 52 year period, in only 133 years of data, less than three full cycles … and in natural datasets, that’s a guarantee you’ll get fooled fooled.
The problem is that these kinds of transient waves appear, last for a few cycles, and disappear again. My rule of thumb? I like to see four full cycles of some wave before I believe it … and even then I’ve been fooled. For example, sunspots lined up with sea levels for about five full sunspot cycles, sixty years or so … but both before and after that interval the cycles fall totally out of sync.
So I’d throw out the 52-year claim from the start. However, it is useful in seeing what they think is happening. What Dr. Reddy has done is to do a Fourier analysis and report the findings as if they were the actual frequencies. That is why each of them is half the period of the previous one (52, 26, 13, and 6.5 years).
The reality is more complex. Periodograms show that a 26-year cycle exists in the first half of the full dataset, but not in the last half of the full dataset. This is exactly the problem I referred to above, that of the disappearing cycles.
And using their shorter dataset, a 12-year cycle exists in the first half, and a 14-year cycle in the second half. Finally a 6.5-year cycle doesn’t show up in either half of the dataset.
So … is there a 52-year cycle? We can’t tell, not enough data. Is there a 26-year cycle? Yes, but only in half of the data. Is there a 13-year cycle? No, there’s 12 in one half and 14 in the other half. And there’s absolutely no sign of a 6.5-year cycle.
My original question still prevails over all of these detailed issues—what do periods of 52, 26, 13, and 6.5 years have to do with the sun even if they did exist and persist in the rainfall data? I know of no solar dataset that shows those periodicities.
w.
Willis, based on your “extensive” (LMAO) publication of papers in reputable scientific journals., I’ll say you have never falsified anything. Remember, what you put in a blog doesn’t count.
Willis Eschenbach October 15, 2016 at 6:26 pm
“My original question still prevails over all of these detailed issues—what do periods of 52, 26, 13, and 6.5 years have to do with the sun even if they did exist and persist in the rainfall data? I know of no solar dataset that shows those periodicities.”
Modulation. Modulation occurs when you have a periodic input and a system that responds with its own natural periodic mechanisms.
Put a pot of water on the stove and alternatingly turn the heat up and down while sloshing the water at its natural frequency, continuing until a steady state is realized. The temperature will vary not at the slosh frequency, not at the burner frequency, but at the modulated frequency of the two.
Please do not pick nits per the above. Of course, you will get different results depending on how vigorously you slosh the water, how hot the burner is, and how close the frequencies are. But, there is a range of the input variables in which you will get just what I said.
The solar wind is another variable to consider. In 2008 it was reported to be 25% lower in strength than the previous solar minimum.
http://sci.esa.int/ulysses/43461-polar-plots-of-the-solar-wind-speed/
Forget mankind’s teeny tiny contribution of CO2…them damnable termites eating our fragile rainforests dwarf the amount of anthropegenic CO2 each day!
Furthemore, almost all the pest control companies are aware that termites, of and by themselves, produce more CO2 than mankind does.
So please sign my petition Grif. I am sending it to all caring and all knowing State Attorney Generals who truly care about climate change.
#TerminexKnew!
Save the planet! Make a difference Griff! Save the rainforests!
Send me $20 bucks and I will give you a nice climate!
Tom Rowan October 14, 2016 at 3:49 am
Close, but not quite right. There’s a good analysis of termite outgassing here. Inter alia it says:
So that’s about 3.5 Gtonnes of CO2 per year, which can be compared to human CO2 emissions of about 33 Gtonnes of CO2/year … which means that humans put out about an order of magnitude more CO2 annually than do termites.
w.
The next sentence of the abstract says 4% and 2% respectively.
The key to this is where the termites’ outgassing comes from. It comes from vegetation, which got the carbon from the atmosphere. It is a cycle. CO2 from termites does not add to the CO2 in the atmosphere averaged over a few years because all the added CO2 came from the atmosphere. The CO2 from fossil fuels does not come form the atmosphere so it does add to the amount in the atmosphere averaged over a few million years . It is really very simple.
Tallbloke has been discussing this for a number of years, if I recall. I’m glad that this concept is being discussed more widely.
+1
ulric lyons October 14, 2016 at 4:06 am
So show us the EVIDENCE regarding the relationship between variations in the solar wind and some surface climate variable, Ulric. You can wave your hands all you want and make all the fantastic claims your heart desires … but when I ask for two links, one to the study and one to the data, you go strangely silent …
w.
The literature on this topic is vast. Suggest you read Easterbrook’s “Evidence-based Climate Science” (2011).
Here’s Boberg and Lundstedt’s 2002 paper on “Solar Wind Variations Related to Fluctuations of the North Atlantic Oscillation”, one of many cited in the book:
http://onlinelibrary.wiley.com/doi/10.1029/2002GL014903/full
“A study on a possible solar wind interaction with the North Atlantic Oscillation (NAO) is performed. Results are presented suggesting a relationship between the NAO index and the electric field strength E of the solar wind. A possible scenario for the suggested interaction is that an electromagnetic disturbance is generated by the solar wind in the global electric circuit of the ionosphere. This disturbance is then dynamically propagating downward through the atmosphere and subsequently influencing the large-scale pressure system in the North Atlantic region. A relationship is also evident on longer time-scales when using the group sunspot number as a proxy for the solar wind.”
Group SSN counting has of course been conveniently adjusted recently, so dunno if the relationship still holds.
Suggest you take anything Easterbrook writes with a pinch of salt. Don Easterbrook did a WUWT blog post some time ago which included a global temperature graph + projection. Easterbrook appeared to have grafted the lower anomalies of the satellite record (relative to 1981-2010) on to the surface temperature record (relative to 1951-80) in order to make his future projection look realistic.
He was widely criticised by all – even avowed sceptics such as Bob Tisdale.
His book is filled with references to papers finding solar effects on climatic phenomena.
I cited it because it is one source of such studies, of which Willis has never done a systematic survey, as would be required in a traditional scientific paper.
ulric lyons October 14, 2016 at 4:06 am
Thanks, Ulric. I just took another look at that question, to see if I’d missed something the last time you made that claim. I found that just as I had remembered, the correlation between monthly sunspots and the monthly CET is horrendously bad. A cross-correlation analysis shows that the max correlation is a pathetic 0.03, with a laughable p-value of 0.33, and no increase in correlation at any lag … so instead of reporting that news, you squint at the two graphs from from across the room and point out that the two of them kind of line up here and there …
So no, Ulric, I haven’t been “shown stuff”. Instead, you have “claimed stuff”, a very different thing.
If you wish to actually SHOW something about “solar minima and the coldest periods on CET”, there’s this marvelous invention called “mathematics” that you can use to demonstrate the truth or falsity of your claims. Pay particular attention to the part of the so-called “mathematics” that’s named “statistics”, especially the subsection about “statistics of non-normal datasets” …
I do encourage you in all seriousness to come back with your statistical analysis of the solar data, I’d love to see it. Don’t forget to provide two links, one to your analysis and one to the data as used in the analysis, because no investigation of a given analysis can be done without both the analysis itself AND the data as used.
w.
“If you wish to actually SHOW something about “solar minima and the coldest periods on CET””
For the umpteenth time it’s on your own post, the three coldest periods through CET are all during solar minima. Over and out.
ulric lyons October 14, 2016 at 2:58 pm
Sorry, Ulric, but that is totally unclear. You can repeat mud umpteen times and it is still mud.
To start with, I don’t know which three solar minima you’re talking about—Maunder, Dalton, and ??.
Next, I don’t know what you consider the start and end dates for the three solar minima … and without knowing that, how can I compare them to the CET?
In short, your umpteen-times repeated claim is far too poorly posed to be even testable.
Post those dates up of your claimed “solar minima”, and I’m happy to take a look and see if your “three minima” hypothesis is correct.
w.
“Sorry, Ulric, but that is totally unclear.”
No it is extremely simple and very transparent, the three coldest periods on CET, according to the graph on your own post, which I have quoted back to you too many times on too many posts, are all during solar minima.
“To start with, I don’t know which three solar minima you’re talking about—Maunder, Dalton, and ??.”
We have been through that. Refer back to your own post where attempted to make me look a fool for using a name for it that you were unfamiliar with. And of course never apologised.
“Next, I don’t know what you consider the start and end dates for the three solar minima … and without knowing that, how can I compare them to the CET?”
Not that escape routine again Willis, it’s getting very very boring. Just look at the damn graph and admit that the three coldest periods are all patently during solar minima. It’s that simple.
ulric lyons October 15, 2016 at 1:03 am
My goodness, I ask for six simple numbers, the start and end years of your three claimed solar minima, and I get this attack and evasion in return? Really?
Are you truly that incapable of answering a grade-school level question? Give me the six simple numbers detailing your claims and I’m happy to look at the question … but if you can’t be bothered to provide details on your own claims, then I fear that’s on you.
However, it does make me wonder why you don’t want your claim looked into, so much so that you are unwilling to put actual numbers on it …
w.
“Are you truly that incapable of answering a grade-school level question?”
You don’t seem to be, you don’t need the start and end dates. The three coldest periods on CET are all during solar minima, and you cannot disprove that.
ulric lyons October 15, 2016 at 1:57 am
You are right, I cannot disprove your claim, for a simple reason—unless you specify the start and end dates of the minima, there is NOTHING TO DISPROVE. Your claim as it stands is so poorly formed that (as you point out) it is not falsifiable, because nobody knows the time periods you are talking about.
Ulric, it’s as though I were to say “Last summer was warm”. Is that statement falsifiable? No, because “warm” is undefined. No matter what the temperature was, I could claim it was “warm”. In order for a claim to be falsifiable, it generally needs NUMBERS of some kind. If I say “Last summer the July average mean temperature was above 67°F” that is falsifiable, because it contains numbers that allow us to determine if it is true.
It astounds me that you are still unwilling to put numbers on your claim … what are you hiding? Why is it so important to you not to reveal the dates of the three “solar minima” you are discussing? Why are you so unwilling to provide links to your claimed previous expositions? This consistent pattern of evasion is not helping your reputation …
w.
“This consistent pattern of evasion is not helping your reputation …” ?w=840
That is exactly what you are doing by not simply admitting that the three coldest periods through CET, according to the graph on your own post, “are all during solar minima”. Period. Are I don’t believe for a moment that you had forgotten that I had referred to the late 1800’s solar minimum as the Gleissberg Solar Minimum.
ulric lyons October 15, 2016 at 2:43 am
Ulric I’m not sure what you’re seeing in the CET graph. Between ~1750 and ~1920 CET temperatures are pretty much flat – with cyclic fluctuations which are probably related to the AMO. It could be argued that CO2 increases were a contributory factor to the post-1920 trend.
Whatever it’s not obvious to me that the Dalton minimum or the “1800’s solar minimum” had any appreciable effect on Central England temperatures.
In the forty years (1751-1790) before the Dalton Minimum there were a number of very active solar cycles yet the mean CET temperature for that period (9.04 deg C) was virtually the same as for the 1791-1830 Dalton period (9.08 deg C). Where’s the cooling?
The mean temperature for the 40 years following the Dalton minimum (1831-1870) was 9.19 deg C and for the 1871-1910 period it was 9.06 deg C. I think we can safely assume there is not a statistically significant difference between the mean temperatures of any of the 4 x 40 year periods.
There does appear to an anomalous dip in temperature in the Dalton period around 1815 (Tambora??) and another one in around 1880-ish (Krakatoa??). I’m not going to speculate on whether these massive 19th century eruptions would have had a measurable impact on CE temperatures but I’m pretty sure solar activity didn’t.
One of the more interesting things about temperature and time periods, which is on going even in today’s temperature and co2 record, is smoothed, averaged and the actual. On the one hand if you look at the yearly temperature for those minimums the temperature did drop. If you average them over the time period in question, and depending on where you start and end, you can’t show much of a decline or as temperature recovered. It’s deceptive.
It’s a trick.
Similarly, the current co2 record that shows the total co2 per year and equating it with rises in temperature is also a trick. If they showed a graph with the yearly co2 increases ppm with the yearly fluctions of temperature, then it is obvious that co2 follows temperature.
They’ve used this with the solar and temperature record as well. The debate takes on a different spin when looking at it like this. The discussion is endless unless we agree on what we are talking about. Without out a doubt, there were some very cold years, and equally there were some years when the sun was quite during this time period.
Which also leads to some disparity between the co2 record and temperature. If I believe the current relationship between co2 ppm/yr and temperature ( co2 follows temperature which the record shows for the last 60 years) , then I have to believe that co2 levels declined as well, which the record doesn’t show either in total or ppm/yr. I don’t believe I have a full and accurate recoding of co2 levels
It depends on how you play with numbers.
John Finn, the AMO was warm during the late 1880’s solar minimum, simply because negative NAO increases through the colder parts of solar minima. If you cannot see that the three coldest periods are all during solar minima, then you must be blind as a bat too.
rishrac October 15, 2016 at 5:50 am
I’ve looked at ALL the yearly temperatures for “those minumums” and it didn’t drop
What are you on about? What’s a trick? Do you mean the “trick” of using all the temperatures for the period in question rather than simply cherry picking a few cold years.
There in no evidence that the Dalton solar minimum had any effect on Central England temperatures.
ulric lyons October 15, 2016 at 7:46 am
blockquote> John Finn, the AMO was warm during the late 1880’s solar minimum, simply because negative NAO increases through the colder parts of solar minima. If you cannot see that the three coldest periods are all during solar minima, then you must be blind as a bat too. /blockquote>
Ulric – I’ve used the actual numbers in the CET. I’ve calculated the mean temperature for each of 4 successive 40 year periods including the Dalton minimum (1790-1830). There is NO significant – or any – difference between the mean temperatures of any of the 4 periods.
Were there some years with low temperatures during the Dalton (or other “grand” minima) ? Possibly — but the fact the temperatures must have recovered DURING the minimum suggests it wasn’t the low solar activity that caused the dip.
You can argue that the Maunder minimum might have been cooler but the earlier CET readings are definitely suspect.
John,
I don’t think anyone would d@ny that the Maunder was remarkably cold. The thermometer readings from the 17th century in the CET aren’t really any worse than from the 18th century. The less reliable part of the CET is its reconstruction back in time from its mid-17th century instrumental origin.
I suppose that Ulric’s third period of correlation between solar activity and low temperature would be during the Spörer Minimum from about 1460 to 1550. He can correct me if wrong. That interval however would require using reconstructed temperature estimates. Within those ninety years, both temperature and solar activity fluctuated quite a bit.
I’m also not sure that your 40 year averages are ideal for comparative purposes. The basic climatic cycle is alternating cool and warm phases, each of 20-30 years or so. The Maunder cold however lasted around 70 years (often shown 1645-1715), although its trough was c. 1680 to 1710. The Dalton lasted from c. 1790 to 1820.
Other factors contribute to the multidecadal fluctuations besides solar activity, of course.
I haven’t seen the reconstructed and observed (heavily adjusted) CET overlain with this graph:
https://en.wikipedia.org/wiki/File:Carbon14_with_activity_labels.svg
John Finn, even if it takes you ten years, keep looking at that graph and get back to me when you have found the three coldest periods.
“So show us the EVIDENCE regarding the relationship between variations in the solar wind and some surface climate variable,”
To have you ignore the same thing yet again after failing to bash any holes in it, why should I bother.
ulric lyons October 14, 2016 at 3:01 pm
Why should you bother to write up and cite your ideas? Because as far as I know, you’ve never presented your solar wind analysis OR your data as used, yet you expect us to believe it based on your word alone …
Or if you have presented it, then what is so hard about giving us a link to your analysis and another link to the data as used, instead of just giving us more excuses for not presenting your claimed evidence?
w.
“Because as far as I know, you’ve never presented your solar wind analysis OR your data as used, yet you expect us to believe it based on your word alone … ”
I have recently presented you evidence of the relationship between variations in the solar wind and a major surface climate variable. So I know for sure that I cannot trust your word.
ulric lyons October 15, 2016 at 1:08 am
Dear heavens, how charming a fellow you are … you’ve quoted only the first part of what I said, and you’ve ignored the immediately following part where I said:
So, since apparently you have presented it, how about you give us the link to your undoubtedly trenchant analysis, and another link to the data, as I requested? Because I’m not going to try to guess where you posted something that I may indeed have read but I certainly don’t remember.
And why is it so hard to get you to post a dang link? It’s as though you want to claim that you have a winning poker hand, but you’re totally unwilling to show it … why might that be?
w.
PS—You can stuff your allegations about trusting my word up your fundamental orifice. My word is good.
On the other hand, my memory of what went on in a particular online interaction at some unknown time in some unknown post among the hundreds of interactions that I have each week and the thousands I have each year is far from 100%.
This is exactly why I said I did not remember you presenting evidence, and I invited you to link to it if you had actually done so—I sometimes don’t remember the details of claims, particularly those from folks like you that give me doubletalk instead of links, and I didn’t want some scumball claiming that I was lying simply because I didn’t remember something. So I didn’t say you hadn’t posted it. Instead I told the truth, that I didn’t remember you posting it, and I asked for links to the analysis and the data if you had posted it.
Despite my unsuccessful attempt to head off your unwarranted nastiness at the pass, however, instead of you simply providing a couple of links, I got ugly untrue accusations from you about my honesty … and no links … does make me wonder what you are hiding.
MODERATOR
Is this not a breach of blog rules from Willis?
“PS—You can stuff your allegations about trusting my word up your fundamental orifice.”
Well, it’s on the line, there’s no curse words in it, and in my opinion Willis is right, you haven’t really presented anything of substance.
Try posting a link to your analysis as he suggests.
“Despite my unsuccessful attempt to head off your unwarranted nastiness at the pass”
You are lost in your own emotional projections, the unwarranted nastiness is clearly coming from you.
Anthony Watts said:
“and in my opinion Willis is right, you haven’t really presented anything of substance.”
I said above why I wouldn’t post it here for him again, he will just ignore it again as he has done previously, just like with the cold periods on CET issue where he refuses to admit that the three coldest periods are all during minima. And this from him: “To start with, I don’t know which three solar minima you’re talking about—Maunder, Dalton, and ??.”, is just a petty duplicity power game, he knows exactly which is the third minimum. I gather you are then fine about him implying that I am a scumball ?
ulric lyons October 15, 2016 at 2:28 am
Ulric, you called me a liar, saying that you cannot “trust my word” … and you expect me to blow in your ear and tickle your tummy in response? Here’s a protip about the real world:
WHEN YOU CALL AN HONEST MAN A LIAR, EXPECT SOME BLOWBACK!!
I did my best to keep my response civil, to the point, and literarily humorous … I think I succeeded, although obviously YMMV …
w.
“I did my best to keep my response civil”
You do flatter yourself don’t you, it was patently uncivil.
ulric lyons October 15, 2016 at 7:40 am
I do not know the start and end dates of what you are calling the “third minimum”. It is not a recognized or named minimum, it’s something you made up. So no, Ulric, NOBODY knows exactly what you are calling the “third minimum” but YOU … and for unknown reasons, you refuse to reveal the secret.
Regarding me implying that you are a scumball, you called me a liar after I very clearly said I didn’t remember something … so no, I absolutely do not “imply that you are a scumball”.
I state it outright, along with the reason. Only a scumball would accuse a man of lying simply because that man doesn’t remember some trivial incident. Perhaps your friends put up with that kind of underhanded claim without comment.
I do not.
w.
“It is not a recognized or named minimum”
Nonsense, I gave you the link confirming its name on your Maunder-Dalton post where that graph came from.
“Only a scumball would accuse a man of lying”
I didn’t call you a liar, I said that I cannot trust your word. I know the difference, you don’t seem to. You’ve actually lied that I had called you a liar, that makes you the scumball.
“it’s something you made up”
In fact you are making it up that I had made it up. Spreading bullshit,
Chimp October 14, 2016 at 11:49 am
Thanks for that, Chimp, but I’m not going on a data search for any man … or any simian, for that matter. I’ll repeat what I said in capital letters since it appears you are hard of reading:
Until then, you’re just repeating the mistakes of others. Why are so many people on this site highly (and properly) skeptical of alarmist science, but swallow even the most bogus solar claims uncritically and without the slightest attempt to verify them?
And let me add that Don Easterbrook is among the people who is far too credulous of such solar claims.
You (and Don, sadly) both seem to be unclear on a simple concept—the fact that a study has been peer reviewed and published DOES NOT MEAN THAT IT IS OTHER THAN GARBAGE. To determine its true value, you need to analyze it yourself. And if you are not competent to do so … then you are not competent to cite the study without adding a host of disclaimers saying that you don’t know if the study is valid or not, but you believe it anyhow because it fits your preconceptions …
So please, Chimp, turn up the sensitivity on your skeptic-ometer … you need to start doubting solar studies and not just uncritically swallowing them whole.
w.
David Archibaldl,
Thanks for posting a link to Ed Fix’s 2011 paper.
A couple years ago, I did some similar work in this same area.
There are times when the sun accelerates in one direction and one
or both of the large planets are pulling away in the opposite direction.
There appears to be some correlation between these events and solar
max. But it’s not solid and there is a reason why this is so.
The real influence on solar cycle length comes from acceleration itself
and not the effect of orbiting planets. When the gas giants lose their
eccentricity, they and the sun will lose their acceleration.
Ed points out, there is a relationship between the sun’s acceleration
and the 11.86 year orbital period of jupiter. But . . . jupiter and the sun
have a binary relationship. The sun also orbits the center of mass in
11.86 years (360 degrees). It is the acceleration of our massive sun
that generates force in our solar system, not jupiter.
During the next ice age solar cycle length will increase to 11.86 years,
that is one solar cycle per rotation of the sun. When this happens, it will
be much easier to predict.
The sun orbit the “center of mass” of WHAT in 11.86 years? Please clarify what you mean.
Stock,
The sun orbits the solar system’s center of mass in a looping pattern
with a period of ~19.859 years. This looping pattern is approximately
1.67 rotations around the center or ~602 degrees. The sun rotates
360 degrees around the solar system’s center of mass in approximately
11.86 years.
Please visit Weathercycles.wordpress
” Fibonacci and climate ”
where I explain this subject in more detail
I hoped Leif would contribute, but maybe it is beneath him.
He gets tired of continually responding to this theory.
So it’s basically all about Neptune and Uranus.
Wasn’t there a paper on this exact concept in 2010?
Are Uranus & Neptune Responsible for Solar Grand Minima and Solar Cycle Modualtion?
Ulric lyons:
Take another look at the ENSO tables that you posted. There were no La Ninas during the 1982 El Chichon eruption, or the 1991 Mount Pinatubo eruption (El Ninas are listed in blue)
I meant La Ninas
Take another look at my comment, I said that stratospheric volcanic aerosol cooling of the surface promotes El Nino conditions. Which is why such aerosols won’t have anything to do with the mid 1970’s surface cooling.
Ulrich Lyons:
Yes, you did say “stratospheric volcanic aerosol cooling of the surface promotes El Nino conditions”
What nonsense! El Ninos are caused by warming of the Pacific Ocean waters, not their cooling.
There have been at least 23 El Ninos since 1950, and perhaps only a half dozen eruptions strong enough to inject significant amounts of aerosols into the stratosphere.
That isn’t nonsense, stratospheric volcanic aerosol cooling of the surface does promote El Nino conditions.
Please give me a link supporting your assertion.
I just can’t imagine how that could be true.
Sure:
http://bfy.tw/8CqC
You’re all missing the big point! This line of reasoning is going to give ammunition to those wacky astrologer types. This research must be suppressed!
David, I have not yet gotten an answer to my central question asked above … what do your graphs show about the sun? They don’t have a significant 11-year or 22-year cycle, so why are you claiming they are solar related?
Also, as I asked above (loc. cit.), where is “the 2016 paper” you refer to in the head post?
w.
The latest paper by Archibald and Fix along with this post is a wholesale rip off of my ground breaking work.
The theory has been online since 2008, first published at Arxiv in 2010 and then published in a peer reviewed journal in 2013.
http://www.scirp.org/journal/PaperInformation.aspx?paperID=36513&#reference
Nothing new going on here…
Griff is wrong about there having to be a conspiracy for data to be fudged. It’s all about consensus and following the herd while thinking yourself to be a good person.
In my country you have to take this and that stance on issue X and Y in order to be accepted. People who have a lot to loose like their jobs for example will shut up and toe the party line.
It doesn’t even have to be as dramatical as loosing your job. It can be that your chances of promotion are damaged or even such mundane fears that your neighbours will distance themselves from you.
If you have to choose X and have your career damaged, possibly your social life as well or do Y and get approval and maybe even rewards, which will you choose?
There is no cabal sitting around in the shadows, it is not needed, All it takes is hundreds of thousands worker bees not questioneing and among those there might be thousands who step over the line in order to secure their positions and as a bonus maybe get rewarded.
They don’t co-operate as in a conspiracy but from the outside it can look like a conspiracy. Just good old lemming behaviour.
There is both going on. Cabals and Lemmings, they feed off each other.
This whole post is a trolling exercise. Trolling for trolls who troll trolls.
What are you referring to? Archibald’s blog post or the comments?
David Archibald, not for the first time, has written some nonsensical mumbo-jumbo which has triggered a number of perfectly reasonable questions from readers.
Perhaps you’d like to explain what the point of David’s post is. A couple of paragraphs should do it. Thanks.
It is so bad that certain people are using addition aliases and having conversations with themselves using alternative names. There is a name for people who talk to themselves.
blockquote> There is a name for people who talk to themselves.
Paul Westhaver appears to be one ].
Willis
You’ve clearly forgotten to multiply the Jupiter-Saturn conjunction period by your shoe size before subtracting the number you first thought of.
Oh, very good. Glad I could finally get some joy out of this post.
Thanks,
w.
Burl Henry October 14, 2016 at 5:27 pm
I’ve responded to your earlier post HERE
Where to start.
Firstly, why would GLOBAL temperatures be influenced by the US business cycle to any significant degree. Industrialisation did take place in other parts of the world. Secondly, Recessions do not mean all industrial activity ceases. Typically, recessions involve a drop in output of less than 1%. You seem to be implying that this relatively small contraction can increase global temperatures by up to half a degree. What do you imagine would happen if all industrial activity stopped?
Please tell us how much warmer was the earth in pre-industrial times if such small reductions in aerosol production can have such a significant global-wide effect?
John Finn:
Firstly, it speaks (or spoke) to the size of the U.S. economy with respect to the rest of the world–and when ours faltered, others followed, magnifying the effect.
Secondly, I agree that not all industrial activity ceases–not a necessity, Some will shut down, temporarily,:most will simply reduce production, heavy industry and power generation (the strongest polluters) would be the most affected.
The warming from all recessions is close to 0.2 deg. C. each time, not half a degree as you suggested (probably so similar because the same industries are affected each time) A one-half degree rise, however, occurred during both depressions–much less industrial activity then.
(The 0.2 and 0.5 deg. C. temp. rises correspond to SO2 aerosol reductions of 10 and 25 Megatonnes)
If all industry were to shut down, giving anthropogenic SO2 emissions time to settle out, we could expect temperatures to rise another 2.0 deg. C from the present.
(Rather than being a problem, fossil fuel emissions actually help to maintain a livable temperature).
I am not implying that small reductions in SO2 aerosol production has a significant global-wide effect. It is a FACT–unless you can supply a viable alternate explanation for the .observations–and it’s certainly not greenhouse gasses!.
blockquote> If all industry were to shut down, giving anthropogenic SO2 emissions time to settle out, we could expect temperatures to rise another 2.0 deg. C from the present.
So in 1700 (pre-indiustrial age) temperatures were 2 degrees higher than they are now?
What do you mean by this? A recession is defined by 2 successive quarters of negative growth, There are very deep recessions (depressions) and very shallow recessions.
A US recession DOES NOT necessarily mean a global recession. A deep US recession might contribute to a slowdown in global growth as would a Chineses recession but there is normally still growth across the world. Global output has risen year on year since the 1960s.
http://data.worldbank.org/indicator/NY.GDP.MKTP.KD.ZG
Note there has been only one global recession since 1961 and that was in 2009. 2009 was warmer than 2008 but that was because of a La Nina in 2007/08. 2009 wasn’t warmer than 2006 or 2007 … or 2010 when global growth had returned.
John Finn:
You wrote “so in 1770 (pre-industrial age) temperatures were 2 degrees higher than now”
I have no idea what average global temperatures were in 1770. (for one thing, SO2 emissions were not zero at that time. due to the widespread use of coal for heating)
I merely stated that (based upon the present amount of anthropogenic SO2 emissions in the atmosphere (approx. 90 Megatonnes), temperatures would be expected to rise about 2.0 deg. C. above present temperatures if all emissions were removed. This was in answer to your question.
“The warming from all recessions is close to .02 deg. C”
This is the observed peak heights shown on the graph. I already offered an explanation for this uniformity. The width of the peaks also tracks the length of the recessions..
I am awaiting YOUR explanation of the perfect correlation between slowdowns in business activity and temporary increases in average land-ocean surface temperatures, rather than trying to find fault with mine. It is a real phenomenon .
(I would also point out that, as would be expected, the graph of ERSST sea-surface temperatures shows the same correlation)
So in 1700 (pre-indiustrial age) temperatures were 2 degrees higher than they are now?
Correction: “pre-indiustrial age” should be “pre-industrial age”
Burl Henry October 16, 2016 at 9:34 am
I didn’t. I wrote “1700” – not “1770”.
To repeat I referred to 1700 – not 1770. Widespread use of coal for heating began in England later in the 1700s. In 1700 the estimated world population was between 600-680 million (see: https://en.wikipedia.org/wiki/World_population_estimates). In other words, it was around 10% of the current population. Even in 1900, the world population was only around 25% of to-day’s figure.
Your hypothesis makes no sense. if SO2 was the main driver of climate, temperatures in 1900 would have been much higher than they are now and much, much higher than they were in the 1970s. I have access to numerous independent records (independent of GISS or Hadley) and I can’t find a single one that supports the argument that the 1900s were warmer than the 1970s One record is particularly relevant.
You confidently dismiss CO2 as having ANY effect which suggests you don’t really understand how increasing CO2 has the potential to make the world warmer.
John Finn:
Yes, SO2 is the MAIN driver of climate change…
When it is REMOVED from the atmosphere, warming occurs because of the cleaner, more transparent air. (And when it is added, temperatures decrease–as observed after all large volcanic eruption).
A very simple concept, easily proven and scientifically accurate.
The Climate sensitivity to their removal is .02 deg. C. of warming for each net Megatonne of reduction in the amount of global SO2 emissions.
Anthropogenic SO2 aerosol emissions peaked in 1972 at 131 Megatonnes. By 2011, due to Clean Air efforts, they had fallen to 101 Megatonnes, a decrease of 30 Megatonnes.
Using the .02 deg. C. climate sensitivity factor and the 30 Megatonne reduction in aerosol emissions, an anomalous temperature rise of 0.60 deg. C. would be expected.for 2011. This is exactly the J-D land-ocean average global temperature reported by NASA.
Other years are accurate to within .02 deg. C.
With this accuracy, there can NEVER have been any additional warming due to greenhouse gasses!
Now, tell me where I am wrong.
Publishing such poor models of the sunspot cycle as this one, would likely just put people off the notion that the planets control sunspot cycles. I’m wondering whether this is a deliberate WUWT policy, or merely a lack of discernment. Either way, it is very low quality.
Anthony Watts, surely this must breach your blog policy?
“Regarding me implying that you are a scumball, you called me a liar after I very clearly said I didn’t remember something … so no, I absolutely do not “imply that you are a scumball”.
I state it outright, along with the reason. Only a scumball would accuse a man of lying simply because that man doesn’t remember some trivial incident.”
Especially as I definitely did not call Willis a liar.
Maybe Willis is a bit sore with me over this…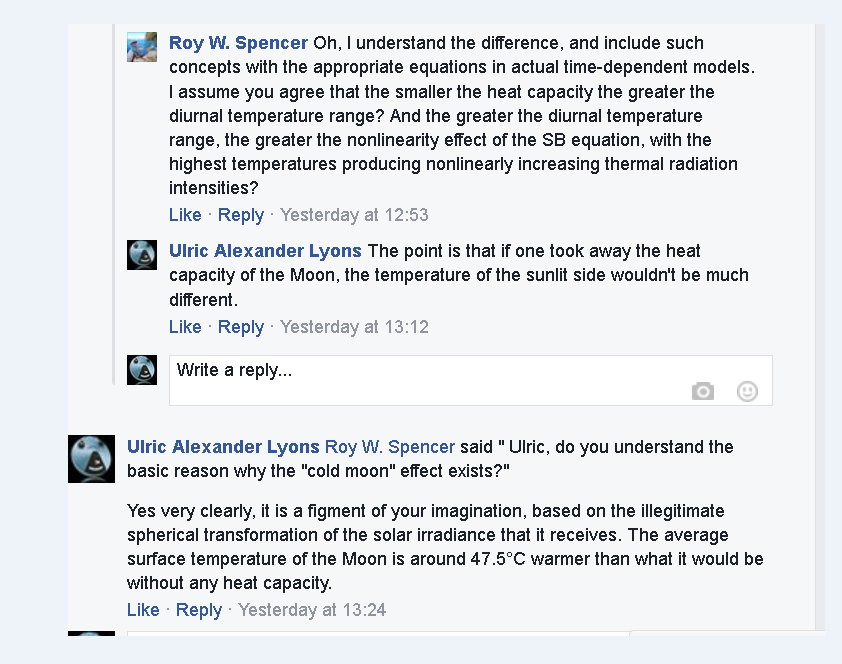
http://www.drroyspencer.com/2016/09/the-faster-a-planet-rotates-the-warmer-its-average-temperature/#comment-226684
And and top of that, Eschenbach claims that I made up the name and the existence of the late 1800’s Gleissberg Solar Minimum, i.e. that I was lying about it. This is frankly, very narcissistic behaviour.
Ulric – your ‘discussion’ with Willis was initiated by your insistence that there was a clear correlation between the sunspot number and global (or CE) temperatures. He has analysed this claimed correlation and concludes that it doesn’t exist – and I agree with him. Willis has not closed his mind on this topic and has invited anyone to provide a link to any data which supports a sun/climate link.
No-one has produced anything except waffle and a few studies which are liberally laced with “may be” and “could be” speculation. Whether or not the late 1800s solar minimum has a designated label is irrelevant. The data is what it is and it shows that any correlation between solar activity and surface temperature is pathetically weak at best.
“Ulric – your ‘discussion’ with Willis was initiated by your insistence that there was a clear correlation between the sunspot number and global (or CE) temperatures.”
It was not. And mind your own business.
ulric lyons October 16, 2016 at 4:36 am
This comment is the first I can find in which you respond to Willis.
ulric lyons October 14, 2016 at 4:06 am
Willis states correctly that no one has shown any conclusive evidence that the small ~11-year variations in the sun produce any detectable effect on the surface climate. In your response, you disagree which suggests you do believe that there is a link between solar activity and surface temperature. In what way was my comment incorrect?
As far as I’m aware Anthony Watts allows people to comment freely (within reason) on this blog so I’d suggest any of the blog’s content is as much my business as it is yours. I can understand why you might not be happy about your opinions being held up to public scrutiny but the best solution might be to discuss your views in private – possibly with like minded individuals who won’t disagree with you.
You specifically said sunspot number. And do cease trolling my comment addressed to Anthony with irrelevant diversionary waffle.
Bartemis October 16, 2016 at 10:31 am
Bartemis, thanks for your reply. I so enjoy the magic power of words. It seems that no matter what cycle you find in nature, say fifty-two years, it can be related directly to the sun.
Why is a fifty-two year cycle related to the sun? Because “modulation”.
Or alternatively …
Why? Because “resonance”.
Or alternatively …
Why? Because “natural periodic mechanisms”.
Or alternatively …
Why? Because “coupling”.
Now, modulation and all of those others are real phenomena. They can all be demonstrated using electronic circuits, and indeed much of our terminology describing such systems relates to electronic signal analysis. And in the lab, it’s easy to figure out some combination of resistors and capacitors and electronic components which will take the eleven-year sunspot signal as input and will then output say a twenty-six year cycle.
Here’s the problem. As explained by the Constructal Law, natural flow systems like the oceans and the atmosphere run at the edge of turbulence. Because of this pervasive turbulence, the systems are heavily damped—when the driving impulse stops, the flow quickly stops as well. Thermal winds die quickly after dark. Wind driven ocean currents stop rapidly once the wind dies out.
As a result, there is little “resonance”. Things in nature generally don’t ring like a bell, with the signal persisting over time. Walk around the forest, pick up anything you see, rocks, trees, plants, whatever, and hit it with a little brass hammer … does it ring like a bell? Nature doesn’t do “resonance” all that well. It does happen, to be sure, but it is by far the exception rather than the rule … and even then it dies out quickly.
You could simulate this electronically by putting various circuits to ground through various resistors all around the circuit. This would simulate the losses to friction and turbulence. Do that to a lovely resonant electronic circuit and it will die right out.
This is why I’m generally suspicious when folks start saying that a twenty-six year cycle is the result of the “frequency modulation” of the eleven-year solar signal. Yes, it is possible in the lab … but I have not seen any good, well-analyzed actual observations of examples of such frequency modulation occurring elsewhere in the climate system.
FOR EXAMPLE: You are claiming frequency modulation resulting from the eleven-year solar cycles. That is not the only solar cycle. There is also a strong annual cycle in solar strength, due to the earth’s varying distance from the sun. Can you point me to some examples of some kind of frequency modulation of this annual variation into some much longer cycle, say a five or eight year cycle or something?
Look, I’m not saying it’s impossible. I’m just saying that without examples of that kind of frequency modulation occurring in other parts of the climate, merely claiming that a twenty-six year cycle is the result of “modulation” and “natural periodic mechanisms” is just using magic words …
My best to you,
w.
”Things in nature generally don’t ring like a bell, with the signal persisting over time.”
They do. All the time. Resonances are, in fact, ubiquitous in nature. From the natural frequencies of trees swaying in the wind to the inertial waves of the oceans. Their persistence depends on the rate of energy dissipation.
I have much more to say, but I don’t want to make this TLDR. The ~11 year solar cycle undoubtedly exists. We don’t have to agree on why, though I think neither of us believe it is because of tiny planetary tidal forcing. The question is, how does it manifest itself in Earthly climate?
”There is also a strong annual cycle in solar strength, due to the earth’s varying distance from the sun.”
But, when the Earth is closer to the Sun, it is moving faster. It is a remarkable property of elliptical orbits that the integral of power received from a central body at one focus grows at constant rate. That is because power is inversely proportional to distance squared, but so is angular rate.
” Can you point me to some examples of some kind of frequency modulation of this annual variation into some much longer cycle, say a five or eight year cycle or something?”
The rate at which the Earth’s axial tilt precesses is mostly a response to tidal forcing from the Sun and Moon. If we assume this modulates the ~11 year solar cycle for storage of heat in the oceans, then we expect to see roughly 5 year and 60 year components in the temperature data. And, that is, in fact, what we see.
It’s not a slam dunk by any means. But, as I have said, it is portentous. Something is creating these cycles, and it isn’t CO2.
It is reasonable, then, to consider it highly likely that the ultimate source is the overwhelmingly most significant driver of Earthly climate in general. And that, as some people like to say in a folksy manner, is that big yellow ball of fire up in the sky.
The timing of each sunspot maximum can be plotted very closely by when the inferior conjunctions of Earth and Venus are in closer syzygy with Uranus, and in even numbered cycles with Jupiter roughly in syzygy with Uranus, and in odd numbered cycles with Jupiter roughly in quadrature with Uranus. When the Ju-Ea-Ve triplet slips enough out of sync with Uranus is when a solar minimum occurs, the triplet then do a similar progression with Neptune instead of Uranus for remainder of the solar minimum until they can physically gain the original sync with Uranus again. Which is why there are a couple of very short solar cycles in Maunder, because the Ju-Ea-Ve triplet return faster to Neptune than to Uranus. Thereby one can plot every solar minimum start date and duration, and the timing of most sunspot maxima to within a year. Anyone with TheSky or Alcyone astronomy software can easily confirm this, ideally at 291.961 day steps fixed to the Earth-Venus syzygies.
Ulric,
read the style of a couple of the comment bombers… They are identical. You may think that you are debating multiple people, rather, you are likely debating multiple personalities.
They fall into behavioral archetypes.
Paul Westhaver October 16, 2016 at 4:31 pm
I despise this kind of “accusing without accusing”. Paul, when you don’t have the albondigas to name names of those you are accusing of being sock puppets, it’s nothing more than you and Ulric indulging in nasty, underhanded gossip.
w.
Eschenbach, you are losing the plot you bitter fool. Paul didn’t mention sock puppets once. You are the one turning it nasty with your bitter accusations.I haven’t got a clue who he is talking about so don’t accuse me of nasty, underhanded gossip.
ulric lyons October 17, 2016 at 3:17 am
Paul said:
If one person is using two aliases on a thread (what Paul calls “multiple personalities”), that’s called using a “sock puppet”.
Ulric, you responded to Paul by saying:
Now you are claiming that you don’t even know who “they” are, that you have no clue who Paul is talking about … but if you don’t know who he’s talking about, then how could you possibly know that they fall into “behavioral archetypes”?
That’s why I said it was just gossip … unpleasant accusations against un-named people.
w.
“If one person is using two aliases on a thread (what Paul calls “multiple personalities”), that’s called using a “sock puppet””
Do stop twisting things to suit your unfounded bitter accusations Eschenbach.
“but if you don’t know who he’s talking about, then how could you possibly know that they fall into “behavioral archetypes”
Because I’m better at psychology that you?
So multiple people using one alias is what?
I’m not sure if I’m one of the “comment bombers” Paul Westhaver refers to, but let me assure him that Willis E and me are not the same person. I’ve never had the pleasure of meeting Willis – a good reason being because he lives in the US (I think) while I live in the UK. My interest in WUWT discussions is often triggered by mention of the CET since I live slap bang in the middle of the Central England region – and I have access to local temperature records which, while not part of the CET composite, do support the general CET trends.
I would, though, like to thank Willis for the time and trouble he takes to deconstruct some of the more nonsensical climate science research (on both sides of the AGW debate). A good example being his latest post:
https://wattsupwiththat.com/2016/10/17/the-cosmic-problem-with-rays/
OK I’ve read Paul’s earlier comments, and it does appear that he is insinuating sock puppets, I actually misunderstood his comment here as I was tired, and did not realise that was what he was implying. Hence my comment about archetypes.
Eschenbach, why don’t you come clean on this and admit where you went wrong….
Eschenbach, the point is that I did not agree with Paul, whatever he meant, so you should have not made your accusation towards me.
Ulric, the question is not whether you agreed with Paul. The problem was that you did what he did—made unpleasant accusations against unknown people. That is why I said it was just gossip.
If you want to identify the people you are attacking, then they could defend themselves … but no, you seem to prefer anonymous attacks on people you identify solely as “they” …
w.
“The problem was that you did what he did—made unpleasant accusations against unknown people”
That’s another lie.
“The problem was that you did what he did—made unpleasant accusations against unknown people.”
The problem is you making unpleasant and false accusations against me.
“If you want to identify the people you are attacking, then they could defend themselves … but no, you seem to prefer anonymous attacks on people you identify solely as “they” …”
Cut it out Eschenbach, I already told you that I had no idea who Paul was talking about. Is a passing comment about comment bombers in general fitting certain archetypes really worth bringing your Spanish Inquisition out for? You’re making a fool of yourself again.
You remind me of the character that Yul Brynner played in Westworld 😉
Look at how this comment string started, can we keep it on topic please?
The timing of each sunspot maximum can be plotted very closely by when the inferior conjunctions of Earth and Venus are in closer syzygy with Uranus, and in even numbered cycles with Jupiter roughly in syzygy with Uranus, and in odd numbered cycles with Jupiter roughly in quadrature with Uranus. When the Ju-Ea-Ve triplet slips enough out of sync with Uranus is when a solar minimum occurs, the triplet then do a similar progression with Neptune instead of Uranus for remainder of the solar minimum until they can physically gain the original sync with Uranus again. Which is why there are a couple of very short solar cycles in Maunder, because the Ju-Ea-Ve triplet return faster to Neptune than to Uranus. Thereby one can plot every solar minimum start date and duration, and the timing of most sunspot maxima to within a year. Anyone with TheSky or Alcyone astronomy software can easily confirm this, ideally at 291.961 day steps fixed to the Earth-Venus syzygies.
Ulric, if that is the case you should be able to precisely identify the timing of every sunspot maximum for the last 50,000 years, and for 50,000 years into the future.
You’ll forgive me if I don’t believe a word of that …
w.
“You’ll forgive me if I don’t believe a word of that …”
Hardly, as I doubt that you have even begun to examine the correlations.
And without apology, I don’t believe a word of this…
https://wattsupwiththat.com/2012/01/08/the-moon-is-a-cold-mistress/
“You’ll forgive me if I don’t believe a word of that …”
Say isn’t it astonishing how you can be so sure, without even looking !! Can you teach me how to do that?
MODERATION
please get Anthony to respond to this…
https://wattsupwiththat.com/2016/10/13/solar-cycle-mystery-solved/#comment-2320300
Anthony Watts, if you do not deal fairly with my complaints about Eschenbach, you will become a conspirator with his behaviour. Already since yesterday he has launched another unfounded accusation against me, of ‘nasty, underhanded gossip’.
You see, given that Eschenbach has lied about:
* me calling him a liar
* the Gleissberg Minimum being “not a recognized or named minimum”
* saying that it’s something I made up
I have have every right to suspect that what Eschenbach claims that he cannot remember, and he affectionately referred to as ‘trivial’, is also a pack of lies.
OK, Ulric, I give up. I withdraw everything I ever said about you. You win. Your constant nonsense has driven me away, I can’t deal with the astrological drool any further. The thread is yours. Put up your flag, announce your victory, the field is yours.
Enjoy the echo, I’m outta here …
w.
“Your constant nonsense has driven me away, I can’t deal with the astrological drool any further.”
Well be a good chap and withdraw that drivel too.
I didn’t expect you to have the guts to admit were you are wrong, or the decency to apologise for your behaviour. You just made another little spiteful slur while retreating. I see no integrity or honesty in you whatsoever.
And you owe to science and readers alike to admit to your errors in your cold Moon postulate. The refutation is on Roy Spencer’s blog comments, linked above, and continued on his facebook page as my commenting became blocked on his blog, ending as you see here with Roy having to concede.
Which obviously also points to fatal errors in the calculation of Earth’s average surface temperature as a black-body equivalent:
https://www.linkedin.com/pulse/earths-surface-temperatures-using-hemispherical-rather-ulric-lyons?trk=pulse_spock-articles
Ulric, You said this:
“If one person is using two aliases on a thread (what Paul calls “multiple personalities”), that’s called using a “sock puppet””
Do stop twisting things to suit your unfounded bitter accusations Eschenbach.
“but if you don’t know who he’s talking about, then how could you possibly know that they fall into “behavioral archetypes”
Because I’m better at psychology that you?
Eschenbach was correct. How about saying sorry?
I’d actually now expect an apology from you for being extremely impertinent.
Ulric, Hating people because they do not like your ideas is not going to create happiness for you. You attacked the other guy in an unreasonable manner when he was totally correct in every aspect of what he was saying.
Ulric, Perhaps you can direct me to where this comment about “the Gleissberg Minimum being “not a recognized or named minimum” , so I read that for myself and try and see what is going on between you two?
“You attacked the other guy in an unreasonable manner when he was totally correct in every aspect of what he was saying.”
You are a total lying troll. Get a life.
Ulric, I see you are now calling me “a total lying troll”. 1. I am not a troll 2. I have told no lies here whatsoever.
“You attacked the other guy in an unreasonable manner when he was totally correct in every aspect of what he was saying.”
Eschenbach unreasonably and falsely accused me of indulging in nasty, underhanded gossip. Which is why you are a pathetic lying troll, Now get a life.
Ulric, ““Only a scumball would accuse a man of lying”
I didn’t call you a liar, I said that I cannot trust your word. I know the difference, you don’t seem to. You’ve actually lied that I had called you a liar, that makes you the scumball.”
If you tell me you cannot trust my word you are telling me my word is without substance, unreliable, false, worthless. Most people are not interested in playing psychologist sufficently to make allowances for people who have trust issues. A punch on the nose is often as good as you can expect if you do what you did.
Anthony Watts, please would you delete this troll’s highly offensive comment.
Calling me a troll when I am offering you the benefit of my advise is a bit silly. You are behaving like a victim and yet what you do is inviting what you receive.
Your sick comment about a punch on the nose is highly offensive, and I hope Anthony puts you in the sin bin for it.
Patently, saying that I cannot trust someones word, includes the possibility that they cannot remember a matter, it is definitely not a direct accusation that they are lying, as Eschenbach assumed, and that you are now assuming.
Ulric, OK so you are in a real world situation amongst ordinary people who are not constrained by professional ettiquite and you say “I dont trust you, I think you have a memory problem”, and when they reply to you that you can take that comment and shove it up your preverbial, and you turn around to other people and declare the comment was totally unjustified??
>>Your sick comment about a punch on the nose is highly offensive, and I hope Anthony puts you in the sin bin for it.
My sick comment?? Mate I was describing reality as I see it
You are not my mate, and you are a sad thuggish demented Eschenbach sycophant.
Ulric, So now i am a totally lying sick sad pathetic thuggish demented eschenback sycophantic extremely impertinant highly offensive troll, who is not your mate and needs to get a life, who you think should be apologising to you, and I am supposing that is far as we can progress this conversation at the moment.
Ulric,
>>saying that I cannot trust someones word, includes the possibility that they cannot remember a matter, it is definitely not a direct accusation that they are lying, as Eschenbach assumed, and that you are now assuming.
I was a bit slow here but I need a bit of help with this one. Eschenbach said he clearly said he did not remember something, you said you could not trust his word (that he could remember something), and you are now saying not trusting his word (he could not remember something) includes the possibility they could not remember something??
Seems to me you just flat out accused him of lying and now you are somehow imagining you did not?
He said he could not remember something……you said you did not trust his word he could not remember something.
“Seems to me you just flat out accused him of lying and now you are somehow imagining you did not?”
Seems to me that you are flat out accusing me of lying, and gaslighting too. You are very sick in the head indeed.
You’re overlooking the fact that I showed that Eschenbach had lied a number of times, and that I fairly returned his libelous ‘scumball’ back to the fundamental orifice that it was uttered from.
Ulric
>>“Because as far as I know, you’ve never presented your solar wind analysis OR your data as used, yet you expect us to believe it based on your word alone … ”
>>I have recently presented you evidence of the relationship between variations in the solar wind and a major surface climate variable. So I know for sure that I cannot trust your word.
How you can type away all day like this while claiming you did not accuse him of being a liar is beyond me to understand. As it reads you said you are sure he is a liar.
You are unbelievable. I did not call him a liar by saying that I could not trust his word, but I found him to be lying to me on a number of occasions. Now get lost troll.
Ulric, I have no idea if Eschenbach has lied. All I know is what he said that I first commented upon was true. I also know by all of the things you have said to me that you certainly like to embroider your text with accusations which as far as what you have told me just amounts to nasty gossip which I dont think anybody can admire. Am I to believe that you are tired today also and I have just got you on a bad day or am I to believe you have a habit of this kind of reaction? I really have no idea but you are not looking so good from my point of view
Ulric, I said:
>>you are not looking so good from my point of view
My suggestion to you is you also look at your own behaviour before you be so ready to look at the behaviour of others.
“I have no idea if Eschenbach has lied.”
So you also have no idea that I didn’t know what Paul was going on about at the time, and I didn’t give a hoot because it was irrelevant comment bombing. So don’t judge me from a position of pure ignorance.
“My suggestion to you is you also look at your own behaviour before you be so ready to look at the behaviour of others.”
After you have only made false accusations against me, and said ” A punch on the nose is often as good as you can expect if you do what you did”? I think you need to be sectioned.
Ulric The ignorance in question was your inability to be able to understand that paul was quite clearly talking about sock puppets where in your state of confusion you began one of your apparently typical childish attacks upon the commenters character even though Willis made a big effort to lay out what was being said line by line in totally clear detail for you. And you justified your behaviour by saying you were tired. I have said all i want to say about this.
Excuse me but you are the one doing the childish attack. Eschenbach falsely assumed that I was party to Paul’s snide, when my response to Paul’s comment bombing is proof that I was not party to it. As explained in my original up-thread.
In fact I have far better things to do than to keep responding to your insidious and psychotic attempts to tar me with matters that already been dealt with up-thread, so goodbye please.
Ulric, >>Eschenbach falsely assumed that I was party to Paul’s snide, when my response to Paul’s comment bombing is proof that I was not party to it. As explained in my original up-thread.
It is beyond me to understand how your comment to Paul was not some kind of gossip about other people who are doing something that you apparently understand “because you are a better psychologist than willis”, which I totally cannot understand at all because you are using language that is unfamiliar to me. It does though seem like you are pointing at those people with your use of language.
And how do you know that my reply to Paul wasn’t aimed directly back at Paul? After all he was comment bombing.
Probably because I am 61, was not born yesterday and all you can do is imagine you can fob me off with what amount to lies about your behaviour where supposedly in response to a comment you did not understand you have decided you knew he was comment bombing and you are the better psychologist for the remark you made. How is that supposed to make sense even to an 8 year old??
“all you can do is imagine you can fob me off with what amount to lies about your behaviour”
I have not told a single lie, and you know where you can stuff your accusations.
“in response to a comment you did not understand you have decided you knew he was comment bombing”
Actually that was what struck me at the time, he was whinging about comment bombers while comment bombing my comment, it was the other garbage that I didn’t quite get at the time. You do like spinning yarns don’t you.
False accusers, the harder they come, the harder they fall.
I think you are a liar. Willis said as far as he recalled blah blah, and you said you could not trust his word. Then when we talked about that you strangely said not trusting his word included the idea he could have a faulty memory???. Quite clearly you accused him of lying he could not recall those details and then you get all weasel worded about it and want to run crying to the moderator because he told you to get stuffed. Time and time again you make silly comments about me like you have never had adult interaction in your life and yet if anybody should mention your behaviour you run crying to mummy and daddy to help you. Whatever is going on with you is a bid odd.
And with that, I’m closing the thread, because quite frankly I’m tired of this food fight that Ulric has started with Willis and silverfoxfinland.