People send me stuff. Today, alert reader Clay Ablitt sends this:
I have been keeping a record of a lot of the different data sets that are put out by RSS and UAH because i believe they are a more reliable data set than NASA or NOAA data.
I noticed in the latest monthly update that added the September data, the historic temperatures were adjusted without any notes or version change.
I have attached the data from August and the newly adjusted data from September for your consideration. This will have an impact on all RSS data sets that include the ocean temperatures such as the global RSS TLT data which has continued to show a pause since February 1997.
He also attached an Excel spreadsheet with two pages, one for each month, a link to which is available here: rss-temperature-trend-sep-oct-2016 (.xlxs)
I checked out the worksheet, and he appears to be correct. There is an unannounced change to the Remote Sensing Systems data. The last change note I am aware of is this one: http://www.remss.com/node/5166
There seem to be no other mentions on the remss.com website that explain this change as observed in the flip chart below:

(click image if it doesn’t animate for you while reading this)
I asked UAH scientist Dr. Roy Spencer about it today, showing him the data and he replied:
We suspected they have a revised LT in the works, after they came up with a new MT.
“MT” refers to Middle Troposphere data, and “LT” refers to Lower Troposphere data. Last March, WUWT covered their adjustment to the MT data, making the trend warmer.
Of course, the unannounced LT adjustment discovered by Ablitt also makes the trend warmer, some thing that isn’t entirely unexpected given the remarks last year by RSS chief scientist Carl Mears:
I wrote last March in The ‘Karlization’ of global temperature continues – this time RSS makes a massive upwards adjustment:
All that is about to change. Readers may recall a video produced by the execrable “Climate Crock of the Week” activist Peter Sinclair that we covered here where the basic premise was that the “satellites are lying“. It seems to me based on his recent comments that Dr. Mears has gotten fed up with people using his RSS data set to suggest that the world isn’t warming as he expects it should. From the video Mears states:
They just wanted to know, you know, they wanted to fine-tune their statement about, you know, whether , you know, the surface temperatures are more accurate or the satellite temperatures are more accurate, and initially they wanted to say something like “But you really shouldn’t trust the satellite temperatures, you should go with these surface temperatures”, and I said, “Well, what I would like to emphasize, you’d really want to look at all the different datasets, so you don’t want to trust only the satellite temperatures, you want to look at the surface temperatures, and – and that sort of thing.
On his website, Mears makes this statement:
Recently, a number of articles in the mainstream press have pointed out that there appears to have been little or no change in globally averaged temperature over the last two decades. Because of this, we are getting a lot of questions along the lines of “I saw this plot on a denialist web site. Is this really your data?” While some of these reports have “cherry-picked” their end points to make their evidence seem even stronger, there is not much doubt that the rate of warming since the late 1990’s is less than that predicted by most of the IPCC AR5 simulations of historical climate. This can be seen in the RSS data, as well as most other temperature datasets. For example, the figure below is a plot of the temperature anomaly (departure from normal) of the lower troposphere over the past 35 years from the RSS “Temperature Lower Troposphere” (TLT) dataset. For this plot we have averaged over almost the entire globe, from 80S to 80N, and used the entire TLT dataset, starting from 1979. (The denialists really like to fit trends starting in 1997, so that the huge 1997-98 ENSO event is at the start of their time series, resulting in a linear fit with the smallest possible slope.)

Source: http://www.remss.com/blog/recent-slowing-rise-global-temperatures Archived here: http://www.webcitation.org/6fiS2rI7k
Mears uses the term “denialist” so there goes his objectivity when he feels the need to label people like that.
Unfortunately the pejorative label use by Dr. Mears undermines his credibility. Sad, very sad.
In the meantime we’ll wait for Dr. Spencer’s more detailed explanation for the change; hopefully with his usual high level of erudition!
In which case anyone here using terms like ‘warmist’ also completely devalues their arguments?
Nice try. Warmist doesn’t imply right or wrong. Denialist, however…..
Griff
What is a holocaust warmist?
Griff, are you trying to hard to equate the word “warmist” with Denier or denialist?
Ha ha…..
Poor old Griff, here’s a plaster for your foot.
Are you not claiming that the world is going to get warmer? Than how is warmist an inaccurate label?
Beyond that, where’s the emotional content of warmist?
Are you really as pathetic as your posts make you seem?
We need some balance: how about “warmist” vs. “coolest?” Something like that, anyhow…
I think “Hotheads” is a good term for you people.
Eugene WR Gallun
“you people”?
I’m pretty sure that’s a micro-aggression.
It would be alarmist.
Maybe we should start calling these deluded fools and statistical artistes Griffists?
‘In which case anyone here using terms like ‘warmist’ also completely devalues their arguments?’
No. And your line of argument is just an attempt at a ‘gotcha’ logic trick.
Where is the emotional content in denialist? (Or denier)?
And no, his post is not “pathetic”? A perfectly reasonable point that seems to heave evoked an emotional response in you.
To begin with, it’s a complete lie.
For starters, let’s just consider “holocaust denier”. Emotional enough for you? And yes, that’s the whole reason to use the “denier” label, in order to equate someone to a genocidal maniac.
The emotional content in “denialist” (originally “denier”) is its well known link to “Holocaust denier”. If you’ve ever been called a denialist to your face you will be in no doubt about the emotion that was being expressed.
@MarkW What’s a lie? A dangling disconnected comment signifying nothing.
@Paul Penrose That is just an emotional reaction from you.
@richard If you have ever been called a warmist …
@John Hardy I think denialist was started to avoid the emotional impact of denier. Some people are never happy.
@John No, carry on using “adherents to the Church of Manmade Global Warming”. It is meaningless but probably satisfies some emotional need in you.
Ens Josh,
Just an emotional response from me? OK, that was so absurd that it made me laugh. Go ask 10 people how they would react if you called them a ” denier” and see what their response would be. 9 of them would immediately understand the connection to “Holocaust Denier” and would be offended. In fact, this phrasing is now a common meme/code-word to refer to someone’s motives as evil. Look it up, but don’t be a troll.
@Paul Penrose
Well, I think it is just an emotional reaction. I usually see it used as a device to shut down discussion. “Oh, I am so outraged I am going to divert the discussion onto something completely irrelevant and in my head only.” The reason most people do not like the word is because they know it is too accurate.
If Mr Mears wishes to insult us, I do wish he would use correct English. We are “deniers” not (horrid mangled word) “denialists”. Just like Galileo when 97% of something or another believed in a geocentric universe.
Judging from the above argument about the terms used to describe people on each side of the argument I should stop using the phrase “adherents to the Church of Manmade Global Warming”.
Agreed tomwys1!
Dr. Mears appears to have rejected his claim to being a scientist. Perhaps he will turn in his doctorate and make it official. I’m sure Manniacal would print out his very own alarmist diploma.
It looks like Mears et al, decided the June 2009 was the pivotal point for the LT temperature warming.
Why not before June 2009? Surely the same adjustment should apply?
Nope, not when the keeper of the data wants to silence sceptics who question the ‘science’ used to make temperatures look warmer.
Until Mears responds to Spencer’s critique of his TMT adjustments and describes the latest, unannounced, changes to TLT, we cannot make any assumptions as to his intentions.
I don’t like his apparent assumption of CAGW, though.
Charlie Skeptic
No disagreement Charlie Skeptic.
I am rather swayed by actions speaking louder than words. Mears has acted, twice now; with the latest only affecting years from summer 2009 to the present.
We saw this one coming, didn’t we? Our predictions are much better than IPCC’s.
what? what prediction?
The prediction that Carl Mears was going to adjust RSS data up before long. It was made several times in the past 6 months.
We might not know what the climate is going to do, but we do know what the alarmists are going to do.
@Javier
And where exactly did the IPCC make a prediction about Carl Mears adjusting the RSS data?
IPCC and oher alarmists like Hansen, and Wadhams, make lots of predictions about the climate that don’t come to pass, don’t they?
@Javier
But you are claiming you make better predictions. But you offer no evidence. Your claim is just hot air.
Speaking of temperature series adulteration…a while back I read here about missing USCRN sites. The missing ones showed a cooling trend.
So is there any analysis on modification of the pristine USCRN data?
Is is amazing, how all adjustments make trends always hotter !
News to me. Got a source for your claim beyond a recollection?
I suspect J is mixing up USCRN with USHCN.
Or perhaps is thinking about all the USHCN sites that have shut down but people are supposedly backfilling, but that problem isn’t as great as some think, see https://wattsupwiththat.com/2014/06/25/on-denying-hockey-sticks-ushcn-data-and-all-that-part-1/
Anthony, No, I read it on the tips page here. If this is true, this is BIG.
Here are the two google reference I found-
http://realclimatescience.com/2016/08/climate-fraud-from-heidi-is-as-clear-as-day/
And on the WUWT tips page…quoting probably for the former.
“AndyG55
August 29, 2016 at 6:09 pm
Saw this on another site.
Is there any way of determining if it is true??
“This quite important, I believe. I’ve been following the hyper-accurate USCRN network for a while. These stations, while they have not been around for more than a decade, are located in remote areas across the U.S., and because they are free of possible contamination from human activity, are free of “corrections”.
I see where the confusion is, particularly in that thread at Heller’s where it talked about the loss of stations in Colorado.
There are two networks. The US Climate Reference Network (USCRN) and the US Regional Climate Reference Network. (USRCRN) which consisted of a few dozen stations setup in Colorado, Utah, New Mexico, and Arizona. This was a less expensive, more densely distributed network that the USCRN. It was a test program that was compoleted in 2011, we talk about it at WUWT all the way back to 2008 when I visited NCDC.
It was shut down due to lack of funding in 2014:
In accordance with Service Change Notice 14-25 from the National Weather Service, NCEI has stopped providing data from the 72 Southwest Regional Climate Reference Network stations since June 1, 2014. The historical data for these stations will remain available. This change does not affect any station in the Climate Reference Network.
Details here: http://www.ncdc.noaa.gov/crn/usrcrn/
The USCRN contines and is not affected. I see no nefarious intent here.
Anthony, NO, I read it here on WUWT. Google provides me with the probable initial source, and the WUWT that tips mention. If true, this is BIG !
http://realclimatescience.com/2016/08/climate-fraud-from-heidi-is-as-clear-as-day/
And from the WUWT tips page…
AndyG55
August 29, 2016 at 6:09 pm
Saw this on another site.
Is there any way of determining if it is true??
“This quite important, I believe. I’ve been following the hyper-accurate USCRN network for a while. These stations, while they have not been around for more than a decade, are located in remote areas across the U.S., and because they are free of possible contamination from human activity, are free of “corrections”.
I’d been wondering why USCRN was reporting hot weather, while everyone I know was stating how cool it was, so I started looking at the data for individual stations. What I found was, for many stations, no data has been used since May 2014.
I’ve looked at 82 stations so far, and 37 have not been used since May 2014.
When I plot the data from these stations, it’s apparent that these stations show falling temperatures. The fall experienced by some stations is huge.
I had faith in USCRN because nobody was interfering with the data. Now it seems that data which clashes with a warming hypothesis is not modified, it is excluded.
The data is available here: ftp://ftp.ncdc.noaa.gov/pub/data/uscrn/products/monthly01/“
I see where the confusion is, particularly in that thread at Heller’s where it talked about the loss of stations in Colorado.
There are two networks. The US Climate Reference Network (USCRN) and the US Regional Climate Reference Network. (USRCRN) which consisted of a few dozen stations setup in Colorado, Utah, New Mexico, and Arizona. This was a less expensive, more densely distributed network that the USCRN. It was a test program that was compoleted in 2011, we talk about it at WUWT all the way back to 2008 when I visited NCDC.
It was shut down due to lack of funding in 2014:
Details here: http://www.ncdc.noaa.gov/crn/usrcrn/
The USCRN contines and is not affected. I see no nefarious intent here.
I see where the confusion is, particularly in that thread at Heller’s where it talked about the loss of stations in Colorado.
There are two networks. The US Climate Reference Network (USCRN) and the US Regional Climate Reference Network. (USRCRN) which consisted of a few dozen stations setup in Colorado, Utah, New Mexico, and Arizona. This was a less expensive, more densely distributed network that the USCRN. It was a test program that was compoleted in 2011, we talk about it at WUWT all the way back to 2008 when I visited NCDC.
It was shut down due to lack of funding in 2014:
In accordance with Service Change Notice 14-25 from the National Weather Service, NCEI has stopped providing data from the 72 Southwest Regional Climate Reference Network stations since June 1, 2014. The historical data for these stations will remain available. This change does not affect any station in the Climate Reference Network.
Details here: http://www.ncdc.noaa.gov/crn/usrcrn/
The USCRN contines and is not affected. I see no nefarious intent here.
As Tony Heller points out, all temperature adjustments increase the trend.
Same goes for sea level.
Wrong
Actually Karls adjustment decreased the long term trend
and Hansen 2010 decreased the trend
The UAH adjustment from v5.6 to v6.0 reduced the trend considerably.
Anthony,
Thanks for the investigation.
Yea, the names sound too similar.
(USCRN) and the US Regional Climate Reference Network. (USRCRN)
I am glad you see no nefarious intent here. If it does not corrupt the USCRN, then our best temp monitoring in the whole world is intact. (And btw, still shows a flat trend, right?)
But it is interesting that they show cooling !
‘and Hansen 2010 decreased the trend’
Dec trend, inc acceleration? There is a strong conf bias.
Steven Mosher
October 10, 2016 at 7:49 pm
Wrong
Actually Karls adjustment decreased the long term trend
and Hansen 2010 decreased the trend
====
Mosh, got any idea when we will know what the temp is right now?
I can go with the sea level rise thing. Yeah, they may downwardly adjust the yearly rates, but the apocalyptic predictions for 100 years out, keep increasing.
Soon we will have the planet at absolute zero in 1950 and warming at a catastrophic rate squared!
> Steven Mosher
> Actually Karls adjustment decreased the long term trend
True enough, well, for half the time period, but a detail that got essentially no press. I tried to rally some interest in giving it more attention but it didn’t catch on.
Karl decreased the 20th century trend and increased the 21st century trend. The result was a remarkably steady increase and allowed him to say the hiatus doesn’t exist.
Hey Ric! “Karl decreased the 20th century trend and increased the 21st century trend. ”
Exactly. The result was a great public relations win for the CAGW crowd. The long term trend was slightly — very slightly! — decreased, but the bump upward in the trend of the last couple decades allowed the warmists to claim that “there is no pause! The pause never happened!”
Mears is shameless.
his code is posted. go find the error.
you wont.
I tell you it is easy to post code where you can’t find its error.
So c an you point to the error in the old code?
I call BS on the attempt to smear skeptics by using 1997 as the argument for negative slopes. If you look at the trends I plotted here you can see there were years where the trends can be started after 1997 that also show negative trends. Oh, and they include the 2010 El Niño which should have had a positive affect on the slope. Also their argument can be applied to alarmist who used the 1997 El Niño to amplify the slope.
Mears seems to come across as a real jerk. Aside from using the “d” word, he deliberately misconstrues how skeptics have portrayed the “pause”. The pause was the length of time that a zero trend extended from the present into the past and it was a fact (before the latest El Nino) that the flat trend extended back to around 1997. To willfully mangle the truth to say that 1997 was cherry picked as a starting date shows that for Mears, advocacy trumps unbiased science.
Robert, Given the way he writes about the cherry picked 1997 start date I suspect that Mears does not even understand the statistical technique that has been used.
You may be correct. So he is talking out of his arse, while using his uninformed interpretation to denigrate people as “deniers”.
If , as a scientist, you want to criticise someone’s claims you need to first examine what their claim is.
If you fail to do that you are not speaking as a scientist. It’s a politically motivated rant.
Sadly it seems that Carl Mears is just bowing to pressure and has abandoned the objective science he has been doing for years in maintaining RSS.
Agreed. Mears had to know better. Consider Monckton’s numerous posts on the pause, which typically included an explanation like the following (from his post of Jan. 10, 2016, https://wattsupwiththat.com/2016/01/10/el-nio-shortens-the-pause-by-just-one-month/):
“The hiatus period of 18 years 8 months is the farthest back one can go in the RSS satellite temperature record and still show a sub-zero trend. The start date is not cherry-picked: it is calculated. And the graph does not mean there is no such thing as global warming. Going back further shows a small warming rate. The rate on the RSS dataset since it began in 1979 is equivalent to 1.2 degrees/century.”
The 1997-1998 El Nino was a century-class one, and by most measures remains the strongest one since the one of 1877-1878. The La Nina after it was not a century-class La Nina. So, I think it is an overstatement to say that The Pause started at a time that makes an outlier event being shortly after it started. I think a better start date for The Pause is for a flat linear trend beginning after the 1997-1998 El Nino and ending sometime in 2015. I think that such a start date is around 2001.
As for other measures of when The Pause started: One is finding what end date of the pre-pause rapid warming maximizes the linear trend warming rate since 1979. I have found that this is around 2001-2002. That would mean global warming was accelerating until around 4 years after Christopher Monckton said it stopped. Another measure is finding a breakpoint where two linear trends meet – that is late 2003 as analyzed in the RSS TLT data (pre-September version of V.3.3) as of shortly before the latest El Nino spike.
Still another measure by breakpoint analysis of when The Pause began: Looking for how to split the 1979-2015 period into two subsets so as to minimize RMS deviation from the linear trends of the subsets: 1st place is such a breakpoint being on the upslope of the 1997-1998 El Nino spike, but the linear trends are far from having ends meeting. 2nd place is on the downslope of the 1997-1998 El Nino, and the linear trends have ends close to meeting but not quite (the later liner trend starts slightly warmer than the earlier linear trend ends), and with both linear trends having positive slope.
Donald, the world did not warm noticeably (surface or atmosphere) for almost 20 years. Dick around with minutia all you want, but the truth is IPCC climate models do not track reality.
Models are bunk! CAGW is propaganda. Liars try to convince us otherwise.
I agree. The 1997-1998 El Niño and the the subsequent 1999-2000 La Niña were paired. If you start your graph either shortly before them or shortly after them you’ll see The Pause (until the 2015-2016 El Niño). But if you start your graph between the 1997-98 El Nino and the 1999-2000 La Nina, like the climate alarmists prefer, then you’ll low-bias the left endpoint, and create the illusion of a subsequently rising temperature trend.
A 2014 analysis by MIT’s Ben Santer et al found that, when the effects of ENSO cycles and volcanic aerosols are accounted for, there’d been no significant global warming since about 1993. Here’s a graph from their paper, which shows that:
http://sealevel.info/Santer_2014-02_fig2_graphC_1_100pct.png
Here’s the paper:
http://dspace.mit.edu/handle/1721.1/89054
They sought to subtract out the effects of ENSO (El Niño / La Niña) and the big Pinatubo (1991) & El Chichón (1982) volcanic eruptions, from measured (satellite) temperature data, to find the underlying temperature trends. In the graph, the black line is averaged CMIP5 models, the blue & red are measured temperatures.
Two things stand out:
1. The models run hot. The CMIP5 models (the black line) show a lot more warming than the satellites. The models show about 0.65°C warming over the 35-year period, and the satellites show only about half that. And,
2. The “pause” in global warming began around 1993. The measured warming is all in the first 14 years (1979-1993). Their graph (with corrections to compensate for both ENSO and volcanic forcings) shows no noticeable warming since then.
Note, too, that although the Santer graph still shows an average of almost 0.1°C/decade of warming, that’s partially because it starts in 1979. The late 1970s were the frigid end of an extended cooling period in the northern hemisphere. Here’s a graph of U.S. temperatures, from a 1999 Hansen/NASA paper:
http://www.sealevel.info/fig1x_1999_highres_fig6_from_paper4_27pct_1979circled.png
The fact that when volcanic aerosols & ENSO are accounted for the models run hot by about a factor of two is evidence that the IPCC’s estimates of climate sensitivity are high by about a factor of two, and it suggests that a substantial part, perhaps half, of the global warming since the mid-1800s was natural, rather than anthropogenic.
Ben Santer is with LLNL, not MIT
Thank you, Hank! I saw the MIT URL for the paper, and thought that was his affiliation. Thank you for the correction.
Regarding the daveburton graph that claims removal of ENSO and two major volcano explosions: I think that an overestimated version of the volcano events and many ENSO events were removed. I suspect this graph is a result of removing volcano effects with assumption of the “IPCC center-track” climate sensitivity, and that ENSO effect is nonlinear, and that this removal was done from real-world global temperature where the climate sensitivity is less than that of “IPCC center track”. This means daveburton overstating The Pause, even though I am saying that IPCC overstates holocene climate sensitivity.
Geese, people. Read Bob Tisdale on: https://bobtisdale.wordpress.com/category/enso-update/
Read some of his books and blog posts. Learn something!
What about the alarmists who use the current El Nino and pretend there isn’t one and all warming is due to humans? If you can’t start a series with an El Nino, you can’t end one there either. No predictions should be made for at least 5 years past the El Nino if these cause such problems.
Is not it the responsibility of outfits like RSS and GISS, who provide the base data for many, to concurrently provide explanations of the their work product when changes are made? I see this as analogous to the imperative to provide data, equations, work methods, etc for any published scientific paper in a journal.
Only if they are ethical…
And if they really believed their own rantings about the end of the world, they would be falling over themselves getting out the data and algorithms to the world in the hope that some other scientist could use them to save us from the Inferno.
If they don’t reveal them then they don’t think there’s something to get worried about.
I’d put it slightly differently: They regard themselves and the secrecy of “their” data and techniques as more important than the end of the world they claim to prophesize.
Try running a business where you make changes to product without at least some public disclosure.
Someone worried about their funding?
Standing back and having an objective look at the data set, it seems pretty clear to me that the linear ‘uptrend’ is pverwhelmingly a confection of the data set starting with a ‘trough’ and ending with a ‘peak’. You would get the same ‘uptrend’ if the data set conformed to a pure sine wave.
This observation gives the real insight into the true level of mathematical expertise, scientific understanding and, it seems crystal clear to me, complete and utter devotion to the AGW cause.
You would give a freshman a FAIL if they handed in an assignment like that if not kick them in the backside if they did not ‘get’ just what a basic stuff up they had just made. I don’t think they would be on track for honours let alone a master’s or PhD.
I once read a (peer reviewed,published) paper about sea level rise and it made the same childish mistake from a similarly intrinsically biased set of data.
What a complete and utter bloody joke these people are. A kick up the arse would be appropriate but probably make no difference.
“overwhelmingly”
Also referring to the animated “pause busting” graphic dating from ~1998 or so, not the second graph.
Wow, even more warming than was thought and still no sign of climate Armageddon. This means that catastrophic climate change per degree increase in global average temperature is less than expected.
We “denialists” deny their crap science which the alarmists know is crap because they keep having to “adjust” it to fit their propaganda.
‘alarmist’ is the mirror image of ‘denialist’ as regards terminology.
You can’t get upset over one while using the other…
It is one thing individual commenters such as us using such terms.
And quite another thing for a supposedly objective scientist to do so
What else would you call someone who over and over again tells us that catastrophic things are going to happen?
The pathos is strong with this one.
No Griff, they are not. The term “alarmist” is actually descriptive of what the CAGW camp is doing: they are raising the alarm of what they claim is a pending catastrophe. And since there is no other related term or phrase in current use that imputes evil to the term “alarmist”, it is not an insult per say.
However, “denialist” is not descriptive of what most CAGW skeptics espouse. They do not “deny” science, anymore than Einstein was “denying” the Newtonian laws of motion. They are in fact playing an important role in science by pointing out the limitations and failings of the CACW theory. For example, as a Software Engineer, I can tell you without reservation that the models, while interesting research tools, can’t be relied on to inform public policy. They are basically unproven, uncalibrated instruments, at best.
Also, since the term “denialist” is related to “holocaust denialist”, its use always imputes evil onto those such labeled. No intelligent person on this planet can be unaware of this connection. So to use that term is an intentional insult, and a most despicable one at that.
So shame on you for trying to draw that equivalence, Griff. Shame on you.
err no its not .. sounding ‘ alarms’ when there is no fire is much worse than using scince and onjective reason to dispute sais alarms .
The use of words and the way words change over time is quite instructive. “Alarmist” and “warmist” are the most common terms used at WUWT and similar sites to refer to those who promote “alarm” about “global warming”. As such, the terms are reasonably precise. The appendage “ist” tends to imply the the objects of the terminology are part of a movement or some other group that they belong to, or identify with because of shared opinions. Like “socialist” or “separatist”. In so far as there is a monolithic mass of opinion, technical and popular literature, environmental organizations, government ministries, university departments, media outlets and websites (and of course the UN) that promote AGW, alarm about AGW , and the need for eliminating fossil fuel use to counter AGW, it’s not at all unreasonable to say that there is a movement.
Those that adhere to the tenets of the “movement” deserve to have “ist” as a suffix to their descriptive names, whether they want it or not, and whether there is an actual formal organization or not. This can be illustrated by a couple of unrelated examples: (1) Noam Chomsky describes himself as an “anarcho-syndicalist” even though the only actual anarcho-syndicalist group existed in Barcelona for a few months in 1936-37 (and would probably have fallen apart even without the help from the Soviets on the left and the liberals on the right.); (2) by the results of a recent referendum, there are over 2 million “separatists” in Scotland, even though only a tiny fraction belong to the SNP.
The use of the word “d3nier” to refer to sceptics, is of course borrowed from “holocaust d3nier”. Holocaust d3niers are a very small group of fringe nut-bars who want to deny the existence of historical realities that have been documented in so many different ways by so may different people, that anyone can see their position is motivated by racist views or anti-semitic politics. There is little doubt that those who use the term for “us” do so in full awareness of its pejorative overtones.
Used in that way “denier” is not only a pejorative term, implying a parallel with those right-wing, racist nut-bars, it is actually quite inappropriate. Most of the “d3niers” are well educated, technically literate individuals (including BTW a significant proportion of trained climatologists and meteorologists) who have found something wrong with mainstream “climate science”. In my own case, the central theorem of AGW appeared to be at odds with what I knew about earth history and that got me started on the long walk down d3nier lane. Most of the so-called “d3niers” will self-identify as sceptics/skeptics.
Use of the term “d3nier” for “us” indicates an inability or refusal to accept that anyone could have questions about the science behind AGW. I have noticed in the warmist/alarmist literature (not just Lewandowsky et al.) that “d3niers” are said to be motivated solely by their political leanings and hence have an inability to grasp the “obvious realities” of AGW.. In a few cases, perhaps, but most of “us” are just people with questions or doubts about the science behind those “obvious realities”.
And some of “us” hang around websites like this where we encounter people trained in other disciplines than our own, who point out flaws, fallacies, bad data, bad logic etc. etc. in other aspects of “climate science”, and this all helps us to become more familiar with the problems inherent in the AGW monolith.
Simply put, most of us do not “d3ny”, we “question”, and we “doubt”.
In recent months “d3nier” has mutated into “d3nialist”. I suspect that this is intended to paint us as being parts of an organized group (presumably with iinvisible funding from Exxon-Mobil and Koch Industries). Of course, there is no organized group, just as there is no funding. Sceptics/skeptics do not cohere into groups. It would be like herding cats to try and bring us into a group.
As noted above wrt Chomsky and the Scots, the “ist” is not a problem, It’s what the “ist” is appended to. “We” do not d3ny anything. If there’s any d3nying going on, it’s those other guys d3nying that anyone could possibly have legitimate doubts and questions about AGW.
No. You really can’t make a single honest point, can you?
‘Denier’ was a deliberate word choice to specifically compare skeptics to Holocaust deniers. If you didn’t know this, you’re an idiot, if you did you’re a liar. And I’m pretty sure which one it is.
So, yes we G*** D*** CAN get upset over it.
” (The denialists really like to fit trends starting in 1997, so that the huge 1997-98 ENSO event is at the start of their time series, resulting in a linear fit with the smallest possible slope.)”
“…whoops there goes another rubber tree plant….” and all credibility.
I am still concerned about just what people I am denying – Funny about that I thought it was questioning?
questioning, denying ..’same thing in the alarmist world. The fact that the words are spelled differently doesn’t make any difference to the meaning in their eyes. Absent real reasons it must be that way for the funding from the ‘authorities’ to continue.
Hooray for the alarmists! Finally they are getting on par with the Soviets in terms of propaganda. Why don’t they just get it over with and just make up whatever numbers they want. They clearly aren’t real scientists as they do not seek truth so at this point it doesn’t really matter.
RSS has joined the Borg of the Ministry of Truth because resistance is useless, and also not very profitable.
futile?
Yes, resistance is futile and profitless. Joining the Borg Collective is career-enhancing and profitable.
Resistance is futile if less than 1 ohm.
I am reminded of the great Latin American expression, “Plomo o plata?” Lead or silver?
SMC
October 10, 2016 at 5:20 pm
Science jokes. Funny!
“SMC Resistance is futile if less than 1 ohm”
HAHAHAHAHA
If you offer no resistance does that make you ohm-less?
The future is fixed, only the past changes.
whoops – just what I am denying.
Two can play at this game. The rend for UAH invariably drops between each successive beta version. .
.
Here are the trend values from December 1979 to March 2015 . .
Likewise there are tiny unannounced changes (last significant figure) even within a beta version from month to month for the UAH data.
So if they’re all tosh, why don’t we just ignore the whole business, and get on with improving standards of living around the world.
Think what all those $Trillions being spent on ‘global warming’ studies could do for funding advances in medicine.
You must not be reading carefully. Actually Dr. Spencer announces each change, unlike what Mears appears to not have done..
Source: http://www.drroyspencer.com/2016/10/uah-global-temperature-update-for-september-2016-0-44-deg-c/
Thanks for the link documenting that Mike’s claim is false.
To quote Roy Spencer, just below the graph for September 2016 “Note that the August value of +0.43 is changed slightly from its previously reported value of +0.44. This is because inter-satellite calibrations are improved with each additional month of global data, which can change previous months’ results by several thousandths of a degree.”
Yes he has mentioned it this month, but unless I have missed it, he has not reported these changes previously. Personally I am not fussed as these corrections are minor, but as they say “what is good for the goose is good for the gander” .
So if UAH mentioned it once it is declared and registered. That is the binary opposite to the undocumented changes applied by RSS.
If UAH is at revision beta15, they are not trying to sneak changes in undocumented they are keeping a careful, version controlled record of each minute step. They have also had their paper documenting the changes on the point of being accepted for publication. Kinda gooses your gander.
MikeR, these kinds of changes (which are at the levels of thousandths of a degree) are not the result of a change in data analysis methodology, but of adding each additional month to the data, which improves the intercalibration between satellites. I’m told the same thing happens with NOAA’s surface thermometer data analysis as each month of new data arrives.
MikeR: Dr Spencer publishes his methods and all of his data.
How exactly does this compare with RSS adjusting their data without telling anyone?
Thanks Roy for your above comment.
Yes I understand the points you make, and I think, like the similar approach of NOAA, it is excellent science that you do these updates. Accordingly because they are so minor, it is sensible that they are sometimes unannounced.
It means the current UAH data is the most accurate representation of the historical record. I gather the RSS methodology is the same.
The RSS changes that is the cause of uproar here, cause an increase in the trend from 0.132 to 0.135 degrees per decade fron 1979 until the present. To put this into perspective the statistical uncertainty in trend for this period is plus or minus 0.068 degrees per decade at a 95% confidence interval see – http://www.ysbl.york.ac.uk/~cowtan/applets/trend/trend . html. The 0.003 increase is 40 times smaller than this range.
In reality the RSS crew mishandled the politics and should have issued an urgent press release on the matter so that next Trump Clinton debate (if they get around to discussing climate change rather than sordid exchanges) is not dominated by RSS versus UAH.
To continue the fowl analogy, Anthony Watts overwrought post is like turning a 3 day old chick into a turducken.
MikeR says:
>> Two can play at this game.
> Personally I am not fussed as these corrections are minor,
You sound fussed to me.
Greg,
By UAH v6 beta 15 , using the downward trends from beta 1 to beta 5 the value will be just above 0.10 degrees per decade.
Employing the approach that Roy Spencer used for changes between beta 4 and beta 5, and accordingly adjusting the reference Earth incidence angle, this angle will have reached 90 degrees by beta version 140. The UAH analysis would then be predominantly measuring the 3 K signal from the big bang background radiation and the trend will definitely be zero.
Clearly I am being facetious here. On a more serious note, I don’t believe for one minute,Roy Spencer has consciously or unconsciously fudged his data downwards from beta to beta versions. I wish those who make comment here would use the same assumptions with respect to Carl Mears, but the degree of hatred and contempt for him is amazing, it is clearly shoot the messenger time.
If you read the UAH and the RSS documents outlining their procedures (from much of the commentary , not many have) their job is complex and the calculations depends on drifts , inter satellite calibrations, angle adjustments etc. . No wonder there are continual changes and it is also unsurprising there are small differences between the two data sets.
This post also seems to demonstrate why temperature is not a good proxy for energy in the climate. The 1997-1998 El Nino is only a fraction of a degree lower than 2015-2016, but it has a much larger area under the curve. That in itself represents a much larger internal energy. But in order to estimate the actual enthalpy that drives the climate you also need the volume and the pressure, integrated over the whole troposphere(since pretty much all the troposphere responded to the El Nino but not uniformly). Temperature is a pretty crude estimate of the enthalpy, and an averaged temperature is an even cruder estimate of the amount of infrared radiation occurring.
logicalchemist
Enthalpy, good word.
Enthalpy comes from the temperature controls industry. Along with the sling to measure wet and dry air for determine the relative humidity. I believe that the todays climate scientist would call that a “closed system”.
I have wondered about the differences in the two systems. I would say that the same physics would not apply..
I have been monitoring the enthalpy in my yard for the last 3 years. I am watching the h shifts when there is a weather change. Recently it has shifted to a much drier condition. (At least it has in my yard)
Thanks for the reminder to pull out my psychrometric charts. But this simply cannot be climate. It changes every day.
No, the same physics applies in all cases. It may be that the simplifications we use in Engineering to actually make useful things are different though.
Absolute humidity is also a huge component of enthalpy and as it is added to the atmosphere in areas under the immediate influence of el Nino warming or any other regional effect, it is moved away by winds and dropped elsewhere as rain or snow.
It has been apparent for years that Mears doesn’t like his RSS result, once it started showing no warming. He first argued that surface measurements were better, even though the original documented premise of RSS was the opposite (remove UHI, remove microsite bias, all of that). So he has now Karlized RSS. But learning from the Karlization brouhaha, has decided not to publish where skeptics could point out the flaws?
I do not doubt you are right ristvan, after all what is there to sell if its “yawn, nothing really happening on the climate front folks, just go about your lives’. Follow the money and when the money geyser dries up move along.
I remember that either Christy or Spenser wrote a critique of RSS methods to change its current TMT product. Anybody have that study?
The critique centered around RSS modeled vs UAH observed diurnal adjustments and RSS’s use of a faulty MSU or AMSU channel.
It’s my recollection that the last time around Mears banned Spencer and/or Christy from reviewing his RSS TMT revision paper. Pal review only for that boy.
Charlie Skeptic
Pal or PayPal?
Perhaps it’s all about the money?
The thing is Mears is a poseur, those aren’t “his results”. Mears came on about 1998, those instruments were developed in the 70’s, I was there and I worked on them. Mears is a Johnny come lately with a typical millennial attitude; nothing that came before him is worth diddly. He’s never made a significant contribution to anything and makes a career out of badmouthing his betters.
It would be interesting to compare this change to the change in UAH going from v5 to v6. At least it would put the magnitude of the change into context.
Also, on this animated plot, the slopes are listed as 1E-5 and 2E-5. Listing a slope to 1 significant figure is not really helpful. If you let a computer spit out too many digits, people will pick on you for false precision. But at least people can round the numbers off themselves.
TonyL, the UAH change from v5 to v6 was well explained by Spencer at the time on his blog: removing a simplifying aperture assumption, and actually calculating the aperture corrections from first geometric principles. Moreover, UAH has documented versions of 6 as the algorithm was improved. Paper in progress ever since announcement of the change.
Perhaps you can point to same appropriate scientific conduct by Mears, who on his blog and at the RSS site has repeatedly publically disavowed his own creation in favor of Karlization of surface temps because RSS did not give the warmunist answer he wants.
Check both my easily verifiable assertions out for yourself, then get back if you dare.
Dr. Spencer has explained the changes, very true. (That is one reason I like to use UAH as my baseline.) I was merely suggesting a comparison between the two to get a visual feel for the magnitude of the two changes side-by-side.
I have been getting pretty handy with R lately, so I may end up doing the comparison myself.
Yes, I have noticed Mears walking back his own product. I am not sure what to say about it, so I thought it best not to say anything.
“It would be interesting to compare this change to the change in UAH going from v5 to v6. At least it would put the magnitude of the change into context.”
Here it is, plotted on the anomaly base 1981-2010 (used by UAH), with 12-month running mean. The reddish colors are RSS (global, not ocean as here), barely distinguishable until about 2009, and then only slightly. The RSS change is vastly less than UAH.
Thanks, Nick. Nice graph.
“You must not be reading carefully. Actually Dr. Spencer announces each change, unlike what Mears appears to not have done..”
What don’t you comprehend, Nick !
Thanks for the graph Nick, helps put it all in perspective. A good suggestion by TonyL.
Perhaps Nick could clarify which levels this graph is using for each. I thought that UAH had dropped TLT and MLT in favour of an intermediate height.
I always found it quite reassuring that the UAH ( sceptics’ ) extraction showed more warming that the ( warmists’ ) RSS extraction. Subject to explanation of what is being plotted here, it looks like they have new converged to being within a hairs breadth of each other.
since there seems to be a fair degree of competition between the two groups, I think we can assume that this is not the result of collusion and ‘homogenisation’ that is so rife in most areas of the climate record.
Satellite temps are still one of the most objective indicators we have.
Greg,
I just plotted UAH TLT versions 5.6 and 6.0 (beta 5), and RSS TLT ver 3.3, both global land/ocean. I don’t have particular knowledge of the levels; it’s a matter of different weighting functions. I gather TLT is rather difficult to get, and is in effect found by subtracting two other weighted averages. RSS has so far only released Ver 4 in TMT, and I notice that John Christy has almost always quoted UAH TMT rather than TLT. NOAA also publishes a TMT but no TLT. I have the feeling TLT is on the way out.
You’re right that the effect of going from V 5.6 to V6 caused UAH to more closely resemble RSS 3.3, in TLT. There are a lot of choices being made in assembling these averages, and I’m sure UAH was well aware of RSS (published) choices; I don’t know to ehat extent that accounts for the convergence, but it seems a likely and perfectly proper explanation. The UAH folk list some of the issues here.
I have to presume that he is perfectly aware that the opposite is what’s happening: we’re starting from the present (or now, after this big El Nino, the recent past) and moving backwards in time until the trend is no longer statistically zero (the smallest possible slope). It’s not cherry-picking when you start at the NOW and move backwards, using all of the data in between until the trend changes.
He’s a wrong ‘un.
Say it ain’t so ! Adjusting numbers without any reason. How can that possibly be a problem ? Thank you climate change people !! Yea, I’ll never be wrong again, I can change the numbers! One small change for climate science, one huge step back to the dark ages.
Why bother to do anything ? We can all fit in some dark deep room with smoke and mirrors and conger up any kind of world we want. Hocus pocus Abra ka dabra.. poof. They learned their science at Hogswart school of Wizarding..
Hogwart’s has more honesty and better ethics.
That’s a Pig with Skin Growths?
I would like to see what changed and why in the various channel weighting functions. Since those are computable a priori given the altitude and frequency of the sensor, something has evolved in that beginning about 2008 from the looks of stuff. They physics of the oxygen molecule are still the same. Frequency drift would move it up or down one of the lines. Altitude changes would be a lesser factor, but would also effect them. Presumable surface emissivity would be relatively constant across things. Stuff happens in the real world, but when it is systemic stuff, you better have a good explanation of why.
Yes for the change from v5 to v6 the trend went down from 0.140 degrees per decade to 0.114 degrees per decade! As I said above there very small unannounced changes in UAH occasionally from month to month for the same Beta 5. I have been caught out on more than one occasion by this when I appended the new value for the latest month and did notice the previous months had changed. Trap for the unwary.
Do I put the DD before or after my name? DD for Deplorable Denialist
Maybe they are gearing up to deal with a lengthening non-warming-to-cooling period when the “pause” continues. Anything to put that moment off.
I hope these clingers to the meme realize that when the governments of the world finally pull out, they’ll be the ones left holding the can and held accountable.
They’ll be collecting their ill-gotten gain pensions by then.
Not that they’re unaware of the risk. Some have worried about being strung up when the enraged citizenry and taxpayers realize that they’ve been bilked out of billions, nay trillions.
My thoughts too. They know what they are doing.
Accountable?
Yes, the academic community shall punish them soundly. Or not.
I think actually the academic community will suffer for it, along with all science. They may well be held accountable too. “Minor” scares in the past (minor because they didn’t gain this sort of traction) could be forgiven for being misunderstood, but this is all too big and too deliberate to be just shrugged off and forgotten. People have suffered and people have died because they can’t afford their heating bills. Someone’s going to have to pay the piper.
If the TLT graph shown above were the starting point of a discussion on global temps, one would be hard pressed IMHO to claim any connection with CO2.
It appears that temps were relatively stable until the ’98 El Nino which created a step increase, then runs at a slightly higher constant temp.
As CO2 does not increase in one large step in one year (1998), it would be difficult to hypothesise that this is the control knob of global temps.
The satellite record runs for 37 years and meets the 30 year WMO requirement to consider this as climate rather than weather, thus this should be sufficient to kill the ‘CO2 is the cause’ argument.
Too simplistic??
There is a very weak correlation with the measured atmospheric C02 …
http://www.climate4you.com/images/HadCRUT4%20GlobalMonthlyTempSince1958%20AndCO2.gif
… although a stronger correlation with the amount of solar radiation reaching the tropics (mostly oceans) …
http://www.team5ge.yolasite.com/resources/%E3%85%87%E3%84%B9%E3%85%87%E3%84%B9%E3%85%87%E3%84%B9.jpg
… the climate is obviously a very complex system.
Want to see something ? On the first graph plot the amount of co2 ppm per year. Leave all the other info there. The numbers of co2 per year are small enough to fit. Publish that. With increasing production levels of co2, co2 follows the trend in temperature.
“Too simplistic??”
yes we KNOW c02 causes warming without looking at a single temperature.
basic physics
We know CO2 causes warming under certain laboratory conditions.
We DON’T KNOW if CO2 causes warming as a trace gas on a water planet.
Isn’t it your job to find out?
No. He’s an English graduate, also bilking the system.
No, Moshpit’s job is as a frontman/salesman for WORST.
Yes, Mr. Mosher. Basic physics from the laboratory.
What does that tell us about real world? Applying “it’s just the physics” in the models seems to contradict actual measurements of temperature, rainfall, drought, ice, etc.
Back to Wandering in the Weeds, Mr. Mosher.
Charlie Skeptic
RSS has been running a new version 4.0 lately (versus the version 3.3 still on the books). They have NOT released the numbers in version 4.0 for the lower troposphere (TLT), however, and they are still using version 3.3. (The same for the important lower stratosphere (TLS).
But for the middle troposphere, TMT, (and the upper troposphere TTT), the version 4.0 numbers show about 0.2C more warming than version 3.3. Really? 0.2C more?
http://data.remss.com/msu/monthly_time_series/RSS_Monthly_MSU_AMSU_Channel_TMT_Anomalies_Land_and_Ocean_v04_0.txt
http://data.remss.com/msu/monthly_time_series/RSS_Monthly_MSU_AMSU_Channel_TMT_Anomalies_Land_and_Ocean_v03_3.txt
Basically, what is going on is that they are completely getting away with rewriting more warming to date into the record. Yes, we call them out on it but they still get away with it. Meanwhile, their pro-global warming scientists are cheering them on and they get new gold medals every time they make the past colder and the current warmer.
It won’t be long before we find out the ice age only ended in 1750, at the dawn of the industrial revolution when CO2 levels rose to 275 ppm. All those cities in northern Europe and North America were just 1 mile of ice 250 years ago. Nobody was growing crops in northern Europe or North America in 1880 because the growing season ended in August.
Some day soon, we will have to cut off their funding so that there is NO incentive to promote global warming hype any longer because it leads to more money. Unfortunately, the opposite seems to be happening. They are just getting more and more money every day that the hype continues.
Karl wrote LESS warming into the record with his last update
well yeah…since it’s not
To inflate temperatures during the hiatus, Mr. Moser. As you might say, too funny.
The last change note, as linked above, does say:
“The lower tropospheric (TLT) temperatures have not yet been updated at this time and remain V3.3. The V3.3 TLT data suffer from the same problems with the adjustment for drifting measurement times that led us to update the TMT dataset. V3.3 TLT data should be used with caution.”
Yes Nick.. it certainly seems that RSS should now be used with caution.
As we can all see….. IT CANNOT BE TRUSTED.
Who knows when the past data will get changed again.!
” IT CANNOT BE TRUSTED”
RSS aren’t asking you to trust V3.3. It’s deprecated.
Yep, the alarmist glitterati HATE it.
Why do you thing Carl is trying to “adjust” it.
They are saying it can’t be trusted because they are about to introduce a warming trend far greater than the little undocumented tweak seen here.
This is the gift that just keeps giving!
The logic:
All datasets are false until they are updated and then they are false until they are updated…
The absurdist formula:
Version + update = True version
True version + update = Truer version
Therefore:
Truest Version = version + update (To the n-th)
V-uck me!!! 😉
To clarify, datasets are false until they are have been updated for the n-th time!
“All datasets are false until they are updated”
RSS identified a specific issue with their index, and warned that it should be used with caution, pending a new version.
UAH also identified an issue with V5.6 and brought out a new version (which has had five adjustments already). But the new version had lower trend, so everyone thinks it is great.
From the thread on Whacky Whadams yesterday, I mused on the neglected state of a number of climate data sets and alarmist remarks that always precede a Karlization Event (sea ice, BOM stuff, sea level, argot buoy results dissing, questioning the definition of hurricane landfall) and said to watch for more human caused climate change by manipulation.
https://wattsupwiththat.com/2016/10/09/whacky-peter-wadhams-doubles-down-on-the-sea-ice-crisis/#comment-2316324
PS: I’m pleased two terms I coined seem to have served well: Karlization and The GangGreen.
It appears to be a step-change around the beginning of 2009, with all subsequent readings adjusted upwards the same amount. More on this tomorrow.
Yup, that is also what I see. I suspect this may be when a different satellite is used and they adjusted the data for that satellite. Of course, as with all climate manipulations the change always leads to an increasing trend.
do a difference plot. the changes go back to 1997.. in the 1/100ths and 1/1000ths.
not material
Yes Pat,
 .
.
The differences start being most pronounced in 2009 but the differences first appear in 1998. In the following is a plot showing the differences between October and September RSS data sets and a similar plot showing the differences between UAH v6 beta 5 and beta 1 see –
To put all of this in perspective, here are the same plots, but this time including a plot showing the changes between UAH v6 and UAH v5.6 . see-
The trend values for the relevant periods are 0.14 degrees per decade for UAH v5.6, 0.114 for v 6 beta1, 0.1105 for UAH v6 beta5, 0.132 for RSS (September data) and 0.135 for RSS for the October data.
As you can see much ado about nothing.
If the annual bonuses for Meares and his fellow RSS workers are based on increasing the trend in the RSS data then they have not done much to deserve it.
I note the very low R^2 values: basically just noise….
I’m not, you know, so sure that, you know, we’re, you know, ever going to, to see the original, you know, data, you know, sets. You know?
Brian, when I had a problem with, you know, he said I should try marijuana, because, you know?
So, if you’re also having problems with, you know, ask your doctor about marijuana.
As the great philosopher said; there’s what you know and what you think you know but isn’t so.
You know?
The RSS TLT change from August to September appears to bring it into better alignment with the UAH TLT since 2001. Perhaps they adopted some of the UAH approach, but RSS should report this change and provide an explanation.
the changes is in 1/100ths and 1/1000ths of a degree. according to the posters own spreadsheet
Interesting that he did not do a difference plot…
The change isnt relevant
..then put the little red line back where it was
but when the “changes” always cause the trend to change in the same direction… that is relevant.
Its like GISS, BEST, Had….. multiple progressive changes that have created a totally false trend.
RSS will lose credibility for fraud.
However they will gain money from the NSF USA Government for verifiable fraud.
For RSS the truth is simple, get the money.
I highly doubt that RSS is trying to pass things buy unnoticed. They may have dumped the new dataset in or portions of it accidentally before they were planning on releasing it. The problem with all of this global warming stuff is that the differences are so tiny compared to the overall trend (coming out of little ice age) , it is all essentially noise. The only significant data are the El Ninos.
It is very important that someone keeps track of their past data, so thanks for that, since every version from the warmistas keeps changing history to fit the narrative.
“pass things buy” – a Freudian slip?
Mears’ gubment funding was probably put on ransom by the WH Science Advisor. “Resistance to the Climate Borg is futile. You will assimilate or perish. Choose one,” is the message.
All data of interest to the Climate Alarmists is subject to, and paid for, having periodic adjustments that gradually move the data in the direction of the Alarmist predictions. It is only the efforts of those who have preserved the original raw data that will ensure that ,after the madness passes, real data can again be accessed for scientific purposes. The adjustments cover temperature, rain, sea level, ice area and volume, and even CO2 estimates. Very little is untouched..
polar bear counts
Individual tide-station measurements of sea-level still seem to be trustworthy. That’s why we can use NOAA & PSMSL data and graphs for things like this:
http://www.sealevel.info/680-140_Sydney_2016-04_anthro_vs_natural.png
That’s an illustration which for some reason was not included in the Slangen, Church, et al, (2016) paper in Nature Climate Change, which reported the discover that most sea-level rise since 1970 is caused by man, but most sea-level rise before 1950 was not.
🙂
The linear trend line in that graph shows the pre-1950 rise rate is less than the overall rise rate. The middle third has the linear trend line majority above the blue curve, and the ends have the trend line majority below the blue curve. I would like to see a 2nd-order best-fit curve – it would be concave-upwards – accelerating.
Not much, Donald. The linear trend for the full 1886-2010 period is a near-perfect fit to the post-1970 “Anthropogenic” period.
The “Mixed” and “Anthropogenic” periods appear to be almost perfectly linear, at 0.65 mm/yr. The pre-1950 “Natural” period is a little more irregular, but not much. That might be due to slightly different data collection methodology for 1886-1914; see the note on NOAA’s page:
http://tidesandcurrents.noaa.gov/sltrends/sltrends_global_station.shtml?stnid=680-140
“[Metadata: Data for 1886- May 1914 are based on high and low waters and on monthly mean tide levels plus a 1.7 mm correction]”
Interesting that an Australian would send you that stuff. In looking over it and checking web references given I found some problems that both I and others have overlooked. Let’s take the most recent slowdown/cooling of the twenty-first century. The info I had in 2008 for the twenty-first century then suggested an essentially flat temperature path. for the beginning of the century. Looking at the same region now, with a data-set going as far as 2015, it is clear that what looked flat then is actually part of a downward slope associated with cooling. The first figure in your paper shows it and I attempted to determine the degree of cooling by measuring the slope in this figure. It turned out to be minus 0.23 degrees Celsius per decade. There could be some degree of uncertainty in this because in order to get both ends of the line tied down I had to jump over the 2008 La Nina and the 2010 El Nino. Beyond 2012 global temperature starts to increase again in preparation for the 2015/2016 El Nino. The interesting question is, what will temperature do when that El Nino is finished? Some thought it might continue at the level of the beginning hiatus of the century but this is out because of the existence of the cooling. If you extend the straight line defining the cooling period it will point to the bottom level of the temperature scale on the opposite side of the 2016 El Nino. That bottom line is pretty much the same bottom line as that of the super El Nino of 1998. And that bottom line in turn was taken over from the eighties and nineties. There was a hiatus there also until at least 1997 when NASA refers to it. Unfortunately you cannot see it now because NOAA and friends decided to invent a non-existent warming they call “late twentieth century warming” for that spot. The hiatus was wiped out and official temperature curves were changed to show warming, not a hiatus. It is important to understand how the warming/cooling aspect of the twenty-first century developed. As soon as the super El Nino of 1998 had left a step warming started in1999. In three years it raised global temperature by a third of a degree Celsius and then stopped. It had nothing to do with the greenhouse effect. It was made possible by the warm water supply the super El Nino had brought across the ocean and then left behind. As a result, all temperatures of the twenty-first century were initially elevated by a third of a degree Celsius. This led to numerous claims of “warmest ever” temperature peaks. Hansen quickly noticed that nine out of ten warmest temperatures were all located in the first decade of the twenty-first century. He quickly claimed that greenhouse warming had done that which is nonsense. In the beginning warming dominated and it was not obvious that a cooling was on the way. The observed cooling is caused by the fact that the initial warm temperature supply was slowly cooling and could not be replaced because the super El Nino had already left. It is likely that the cooling itself will have run its course by the time the El Nino of 2016 is finished. It is likely that the new base temperature that will then follow will be similar to the original temperature of the eighties and nineties.
I am still hopeful that science can survive the idea that if the data doesn’t support your hypothesis then your data needs to be adjusted.
“you know”, I mean “you know”, a man with one clock always knows what time it is. “you know”?
But a man with two clocks is never sure…
Meanwhile …. wildfires TWIIIIIIIIIIIICE AS BIIIIIIIIIIIIIIIIgggggggggg! Due to AGW … but of course!
too funny.
The changes look like they track with theintroduction of AMSU ( a big problem)
The monthly differences are mouse nuts
0.001
0.001
0.001
0.002
0.001
0.001
0.001
0.001
0.001
0.001
0.002
0.001
0.001
0.001
0.001
0.001
0.001
0.001
0.001
0.001
0.001
0.001
0.001
-0.002
-0.002
-0.002
-0.001
-0.002
-0.003
-0.003
-0.002
-0.001
-0.002
-0.003
-0.004
-0.002
0.001
0.001
-0.003
-0.004
-0.005
-0.001
-0.003
-0.004
-0.005
-0.002
0.001
-0.001
-0.004
-0.004
-0.002
0.001
-0.001
-0.001
0.001
0.001
-0.002
-0.002
-0.001
0.001
-0.002
0.001
0.001
0.002
0.002
-0.001
-0.003
-0.001
0.001
0.001
0.002
0.002
0.001
0.001
-0.001
-0.001
0.001
0.001
0.001
0.001
0.001
0.002
0.001
0.001
-0.001
0.016
0.008
0.011
0.012
0.003
0.006
0.019
0.014
0.014
0.007
0.009
0.009
0.008
0.001
0.008
0.006
0.003
0.012
0.014
0.022
0.007
0.004
0.016
0.002
-0.003
-0.012
0.003
0.01
0.002
0.003
0.005
0.008
0.006
-0.002
-0.001
-0.005
-0.008
0.007
0.015
0.016
0.018
0.019
0.009
0.016
0.025
0.015
0.018
0.012
0.02
0.013
0.011
0.023
0.015
0.011
0.011
0.022
0.021
0.015
0.014
0.017
0.018
0.015
0.02
0.021
0.022
0.016
0.02
0.02
0.022
0.028
0.019
0.017
0.016
0.015
0.029
0.034
0.023
0.021
0.021
0.012
0.006
0.027
0.028
0.02
0.017
0.026
0.029
mouse nuts…..the little red line changed
Latitude, ever notice how much Mr. Mosher posts when he is on the clock, being paid? Could that affect his “latitude?”
[snip]
At some point in the future, they will have to reverse the current delta-T they’ve added in, and subtract it from the actual data in order to keep a perpetual upward trend going on at the end of a current set of data. Otherwise, if they keep increasing the delta-T to be added to the actual data, the discrepancy between what temperatures are graphed and what temperatures we actually feel will be too disparate to be believable – but then faith in their religion may be quite blinding.
nonsense
If you read Bob Tisdale’s critique of Karl, you will see that is exactly what Karl did: Lower some intervening temperatures and raise the end.
https://bobtisdale.wordpress.com/2016/01/27/on-the-monumental-differences-in-warming-rates-between-global-sea-surface-temperature-datasets-during-the-noaa-picked-global-warming-hiatus-period-of-2000-to-2014/
This little nugget from the blog post suggests a real bias when picking statistical approaches:
Charlie Skeptic aka Dave Fair
Overall. .Over the whole series…He lowered the long term trend and it implies therefore a lower ecs.
Aaaah, Mr. Mosher. Karl did not care about some unmeasurable change in ECS. He had a higher duty: Get rid of the hiatus!
what temperatures we actually feel…ridiculous, obviously, in another 5-10 years, we will know what the temp is right now 😉
Mears suffers an incoherence that is persuasive when it comes to adjudging his scientific exactitude & precision.
You got me with that one Ross. What is a persuasive incoherence?
Perhaps President Trump will instruct his investigators to look into Climate Fraud too?
Changing scientific data to falsify it is wire fraud because it is intended to paint a picture (a lie ) in order to relive tax payers of their money .
Scientists and the other promoters of the global warming fraud haven’t clued into what they will be held accountable for . Wire fraud is good for 20 years no matter how much money you have .
Except they are not changing data. The input data they use is unchanged. They like uah have algorithms to estimate the average temperature of a thick layer of the atmosphere. Improving changing modifying the algorithm is not changing data. They changed their method.
..it just changes the result….and that’s the whole idea
Isn’t the Federal Government paying for this data?
Wouldn’t this be a legitimate investigation for Lamar Smith’s committee?
Even with his 2nd graph,
the trendline from 2000 looks flat to me.
So even if he is in denial about 21st century trend he still shows the pause.
And of course all adjusted measurements show this century as warmer so even if it’s flat for 80 years it’s still warmer than last Century.
So what? It should reduce the winter electricity bills! (sure…)
Well to his credit, he did NOT put any “trend lines” on that graph at all. He lets the data speak for itself. Anyone can see just how much the model runs are overheating.
He also did not try Santer’s trick of trying to disguise the discrepancy by aligning in the middle. He starts both at the same point so that the divergence is clear.
Fair play to him.
Unfortunately is stops at the end of 2014 so misses the recent El Nino.
Authors:
Carl Mears
Date Added:
Monday, September 22, 2014
That graph is taken from his site a few years back before he allowed himself to be blugeoned by the alarmists.
Why care about RSS TLT 3.3? It is no longer endorsed by its producers due to drifts:
http://www.remss.com/node/5166
“The lower tropospheric (TLT) temperatures have not yet been updated at this time and remain V3.3. The V3.3 TLT data suffer from the same problems with the adjustment for drifting measurement times that led us to update the TMT dataset. V3.3 TLT data should be used with caution.”
Use RSS v4 TTT instead. TTT trends are very similar to TLT trends…
If there is a change to TLT 3.3, I suspect that they have discarded NOAA-15 after 2011 and Aqua after 2009. During the work with the new v4 dataset they found that those two satellites are not reliable after those dates.
Since NOAA-15 (AMSU-5) is the prime “pause-maker” every little limitation of its use in a dataset, will increase the trend. Actually, the least “pausiest” troposphere satellite dataset is UAH 5.6, since it mainly relies on nondrifting AMSU satellites, and only use NOAA-15 for a short while in the beginning.
Almost all of difference between satellite and ground is due to amsu.
Yes, between satellites and radiosondes as well. Year 2000 is in the middle of the MSU/AMSU transition:
https://drive.google.com/open?id=0B_dL1shkWewaNDVmS0t1bjZjQXM
O R
That’s a fascinating graph you have posted.
Looking at Christy et al.’s 2003 paper where they validated their UAH satellite data using radiosonde data, the last data they compared the two for TLT was up to April 2002. See – http://journals.ametsoc.org/doi/abs/10.1175/1520-0426%282003%29202.0.CO%3B2.
According to your graph the difference between the two was not that pronounced at that time in 2002 as it is later.
It would be interesting to know whether a paper that validates the UAH TLT data by comparison to radiosonde data has been published more recently than 2003.
I am only aware that Spencer did some comparisons with the radiosonde data earlier this year for TMT when RSS TMT v4 came out.
A similar discrepancy between RSS TLT v3. 3 and Ratpac radiosonde data has been noted by Tamino ( https://tamino.wordpress.com/2015/09/24/exogenous-redux/) and maybe this why they will be revising the RSS TLT product to version 4.
Is anyone wondering what the trend of a new RSS v4 TLT might be? Let’s make some qualified guesses:
1. The trend of RSS TLT 3.3 is 1.48 times higher than that of TMT 3.3. Apply the factor 1.48 on the trend of TMT 4 (0.138 C/dec) and you get 0.204 C/decade
2 Use the UAH v6 TLT formula “LT = 1.538*MT -0.548*TP +0.01*LS” with channel data fom RSS. However, RSS doesn’t think that tropopause channel data (MSU 3) is reliable before 1987, so you have to splice on early data from UAH to make the tropopause channel of RSS complete..
Doing this results in a RSS v4 TLT trend of 0.207 C/decade
From these two methods we can assume that the trend of RSS v4 TLT will be about 0.205 C/decade
Starts off with the “little” adjustments.. you get away with that
It builds and builds until your scientific integrity, and your adjustments, are on par with those of Gavin Schmidt.
And you have ZERO credibility, and ZERO integrity, and ZERO self -respect.
Is that really where Carl Mears wants to go ??
is the money worth it, Carl ??
You do have to live with yourself. !!!
NOAA STAR has a new v4 dataset (still beta, hidden in ftp), using Po Chedley (2015) diurnal drift corrections, which corroborates RSS TMT v4. The trend of STAR TMT v4 is slightly larger than that of RSS TMT v4, 0.143 vs 0.138 C/dec
With the UAH v6 TLT formula “LT = 1.538*MT -0.548*TP +0.01*LS” it is also possible to assess the uncertainty of such multichannel datasets.
If we use all available channel data from the different providers and combine freely with the formula above we get the following spread:
TLT-trend (C/decade) = 1.538*(0.071-0.143) – 0.548*(0.001-0.012) +0.01*(-0.330 – -0.259)
Hence, the formula can produce TLT trends between 0.098 and 0.216 C/decade for 1979-now.
Global surface dataset trends are between 0.172 and 0.185 C/decade for the satellite era. (The lower limit is 0.161 if also the not fully global NOAA land/ocean dataset is included)
Thus, the uncertainty in the multilayer TLT-concept is about NINE times larger than that of global surface datasets..
I believe this is incorrect. If each of the channels is independent and has normally distributed uncertainty, I suspect that the combination of the three channels reduces the error, not increases it. It’s basically the same as averaging a bunch of noisy estimates together…the average is closer to the truth than most of the individual estimates.
” It’s basically the same as averaging a bunch of noisy estimates together…the average is closer to the truth than most of the individual estimates.”
No, that’s wrong. When you average like that, the multipliers are positive and less than one. But here they are not. If the std error of each is the same, then the std error of the combination is multiplied by the quadrature (sqrt(sum squares)) value of the coefficients. In this case, that is sqrt1.538²(1.538²+0.548²+0.01²)=1.633
When adding data values from samples with errors, If the errors are fully independent, you can add the error margins in quadrature, which reduces the combined error margin. But if the errors are systematic you must add them arithmetically, yielding a larger combined error margin. (If the errors are some mixture of independent and systematic, then the true error margin is somewhere in between.)
So, for example, if you have two measurements (n=2), each with an error margin of ±1, and the errors are systematic (i.e., it is expected that if one of them errs on the positive side them both do), then the error margin of the sum of the two measurements will be 2 × ±1 = ±2, and the error margin of the average of the two will be ±2/n = ±1. So averaging multiple measurements gets you no improvement in error margin, if the errors are systematic.
OTOH, if you have two measurements (n=2), each with an error margin of ±1, and the errors are independent, then the error margins add in quadrature, so the error margin of the sum of the two measurements will be ±sqrt( 1² + 1² ) = ±1.414, and the error margin of the average of the two measurements will be that divided by n=2, i.e., ±0.707. Thus, averaging multiple data values reduces the error margin, if the errors are independent.
On the gripping hand, if it is known that the errors are of opposite sign, that’s even better, and the true error margin will be even smaller than if the errors are independent.
I do not understand the satellite temperature data, and I have no idea what that weighted sum is, so I cannot even begin to judge how to calculate the error margins.
Dr Spencer,
There are likely some errors with my simplified assessment, but still, the variation due to possible choices is a magnitude higher with the satellite datasets.
We can do it simpler but possibly more correct. Most of the variation is in the TMT layer, and TMT is the main “engine” of troposphere products.
Global TMT trends differ from 0.071 to 0.143 C/dec for the satellite era, a difference of more than 100%.
The trends, for the satellite era, of globally infilled surface datasets differ by less than 8% (0.172-0.185 C/dec; Gistemp loti, BEST l/o, C&W)
It’s as simple as it is depressing.
The data are politically incorrect.
So let’s change them.
Then wrap ourselves in a blanket of self righteousness and call anyone who questions us a den1er.
Pretty average day at the office for an establishment climate scientist.
One thing Dr. Mears says that rouses me to actual anger. That bit about the 1997 start point.
If he had said, say, March 1998, he would have a point. But 1997 is a perfectly fine start point, coming as it does just before the 1998 El Nino and the 1999 – 2000 La Nina, which cancels it out.
If you start in 2001, you get every bit as low a trend as when starting from 1997.
It is impossible that Dr. Mears does not know this. Impossible.
What Dr. Mears obviously wants is to start the series during 1999 or 2000, which is a whopping big La Nina cherrypick.
Okay, I see that this was pointed out, above. (And rightly so.)
P.S., I looked back at the early 2016 link and sure enough, they are trying to start in 1999. What a crock!
Evan Jones,
I know that is the era when total bull s… Trumps data but the rubbish above is particularly egregious nonsense. You complain about a Mear’s cherry-pick , now where I come from that is called chutzpah.
The following should indicate why. This a graph showing the RSS v3 TLT trend as a function of the starting data until September 2016 see-
Notice you can get virtually any number you like (within reason) by a suitable choice of a starting date. Starting with 1997 giving a value of 0.06 degrees per annum while Mear’s data starts from 1999 giving a value of just under 0.011 degrees per annum. Is 1997 a better choice than 1999? Clearly there is no way to decide.
The actual issue is that cherry picked dates after about mid 1992 (see the red line) provide trends with little or no statistical significance see- http://www.ysbl.york.ac.uk/~cowtan/applets/trend/trend.html or alternatively https://moyhu.blogspot.com.au/p/temperature-trend-viewer.html.
In contrast, for starting dates before mid 1992 the trend becomes significant and increasingly so for dates close to the start of the data set.
This is why a cherry pick using the minimum trend ,back in the good old days of 2015 when it was negative, was the backbone of the pausenik movement. The RSS data was then the gold standard and Lord Monckton made his monthly pronouncements about the pause . He seems to have gone very silent since then.
Here’s a WoodForTrees graph with three linear trendlines plotted. All three end 1/2016, so they include about half of the just-ended 2015-2016 El Niño. The green one starts 1/1997 (before the 1997-98 El Niño & 1999-2000 La Niña), the blue one starts 1/1999 (the Mears cherrypick), and the purple one starts 1/2001 (after the 1997-98 El Niño & 1999-2000 La Niña).
http://woodfortrees.org/plot/rss/from:1997/to:2016/plot/rss/from:1997/to:2016/trend/plot/rss/from:1999/to:2016/trend/plot/rss/from:2001/to:2016/trend
As you can see, the blue trendline (starting 1/1999) is much steeper than the other two. That’s because it is chosen to include the 1999-2000 La Nina but omit the preceding 1997-1998 El Nino.
El Ninos and La Ninas usually come in pairs: first an El Nino, then a La Nina. If you choose to start your linear trend calculation between them, it is a cherry-pick which low-biases the starting point.
To get the maximum apparent trend, you can start and end at such points: right at the end of an El Nino. That means the left end begins with a La Nina (cool period), and the right end ends with an El Nino (warm period). That makes 1/1999 thru mid-2016 a near perfect pair of cherry-picks for exaggerating the warming trend.
The only thing better for exaggerating the warming trend would be to start with 1979:
http://www.sealevel.info/fig1x_1999_highres_fig6_from_paper4_27pct_1979circled.png
Oh, who cares, daveburton? The IPCC climate models are obviously wrong. That means all the “physics” and “math” they jam into them is wrong. The world does not agree with the IPCC on any time frame. I don’t like people who deny facts. And, yes, facts are not speculation.
Here’s the graph:
http://www.sealevel.info/RSS_trends_to_2016_from_1997_1999_2001.png
Who cares? By any measure, global temperatures have not materially changed in over 20 years.
My God, no change in almost a quarter century! People need to get a grip.
Even if the world continues to warm slowly, why would not our progeny be able to handle any side effects? Will they be stupid? Will technology advancement stop?
Do you know what the hell you are talking about? Speculation is just that. Modelturbation incenses me.
Daveburton,
This is starting to get silly.
I could have chosen any starting month of the 164 months prior to mid 1992 to get close to the maximum trend. These are statistically significant trends . Did you look at the sites that calculate statistical significance for a trend. I assume not.
If I was indeed silly enough to use non statistically significant trends then I could choose from 2003 onward to try and find a maximum trend. For instance the trend from exactly ten years ago until the present is 0.028 degrees per annum and for 5 years again it is 0.093 degrees per annum. This is all nonsense because these trends over short terms and are subject, as you quite rightly point out, to the vagaries of EL-Nino/La Nina
For the lowest trends in the period 1997-2001 you have to be ultra-selective for you cherry picks , if you are out by a month or two the numbers will vary greatly . If you look at 1999 (0.011 degree per annum) compared to 1998 (0.044 degrees per annum) the difference in trends is over a factor of 2 greater.
This is not true for the longer periods prior to mid 1992. The slopes are quite stable ( fluctuating by 10 to20% at most over the 13 years) and it matters little if you change the starting month by a month or even a year. This why the length of the period is crucial. It has to be long enough (about 23 years) to take cherry picking out of the equation. For further elaboration read Werner Broszek’s contribution at this site and his comment at https://wattsupwiththat.com/2016/08/08/will-2016-set-satellite-records-now-includes-june-and-july-data/#comment-2273615 .
I could add there has been no statistically significant increases, decrease or pause in the past 23 years. All you can say with any confidence is that there has been statistically warming trends for periods longer than 23 years ago. The best estimate is that there has been a warming trend of 0.0135 plus or minus 0.0063 (the value could be between 0.0072 to 0.0198 degrees per annum) from 1979 until the present.
No, MikeR, you are the silly one.
No matter surface, especially SST by basin, or atmospheric, the world has not warmed in the manner projected by IPCC climate models in almost 20 years. Dick around all you want with the data, that is the fact.
On all other climate metrics, precipitation, drought, ice, monsoons, what have you, IPCC climate models are also bunk. That is the only fact that matters in the CAGW argument.
Excuse me, MikeR. I agree with your overall assessment. But with the satellite and radiosonde data, nothing happened for almost 20 years. Who knows what will happen post 2015-16 El Nino?
By the way the figure of 23 years I quote above is for the RSS (and UAH) data. For the surface data the period is around 17 to 18 years. This is due to the smaller effects of El-Nino/La Nina on the surface temperatures as compared to the satellite derived temperatures
MikeR wrote, “I could have chosen any starting month of the 164 months prior to mid 1992 to get close to the maximum trend.”
Yes, there was a statistically significant warming trend through the 1980s and into the early 1990s. Has anyone here disputed that?
What is in dispute is whether there’s been a significant warming trend more recently.
The only way to find a statistically significant warming trend since then is by picking one or both endpoints right after an El Nino, so that the graph starts with a La Nina (temporary cool period), and/or finishes with an El Nino (temporary warm period).
Using such an finishing point is defensible, at the moment, because that’s where we happen to be, right now, since the big 2015-2016 El Nino just ended, though using it without mentioning the distorting effect of that El Nino is deceptive.
Picking such an starting point, however, is nothing but a blatant cherry-pick, used to exaggerate the warming trend.
When the unvarnished truth is insufficiently supportive of a person’s position, so that he resorts to such artifice, it indicates that his position is based more on politics than science.
Dave,
Sorry I am not sure what you are trying to say exactly. Did you mean selecting the start and end points that are at exactly the same time of the ENSO cycle? That might make sense, but as the shapes of the present El Nino is quite different from 1997/98 El-Nino, this is fraught with difficulties and also ignores the other smaller ENSO signals, between these dates.
If you want to know the trend until the present by definition, the end point is fixed (i.e. now) and obviously the only variable is the starting date issue. Starting at any point close to an El-Nino is problematic as this is when the temperature is changing most rapidly (and this leads to the largest changes in trend for a small change in starting date.
I agree it is the same issue for the same with the end date, but you are kind of stuck with this if you are interested in the trend up till today.
his all just illustrates that calculating trends from data for periods shorter than 23 years for the satellite data is unwise. To confirm this, the RSS value for the current trend from 1997 is 0.049 C per decade (plus or minus 0.170C !!!).
In contrast the surface data, because it less sensitive to El-Nino/La Nina, the relevant period required for statistical significance is very much shorter and the confidence interval are much narrower..
So if you want to know whether the surface of the earth has warmed since 1997, the current values are for GISS ,0.171 C per decade (plus or minus 0.106C) , for HadCrut 4 0.135 C decade (plus or minus 0.104 C) and for NOAA (0.159 C plus or minus 0.097 C) . These are the values from Kevin Cowtan at. http://www.ysbl.york.ac.uk/~cowtan/applets/trend/trend.html .
If you have issues with the size of uncertainties in trends then dig out Excel and do the linear regression yourself (I suggest either the LINEST function or the Regression from the Data Analysis Add-in) to extract the uncertainties. Unfortunately you would then need to add additional corrections for serial correlation in the data. If you manage to calculate uncertainties that disagree markedly with those given by Cowtan let us all know.
To reinforce the message I am afraid, if you use the satellite data only as the basis for your conclusion, you will have to wait another 5 years for a conclusive statement about pauses etc.
However the good news is, if you have the patience to wait this long, it will also give you 5 years to learn how to play the fiddle.
I LOVE MikeR! One of the few people who can have sense, and a sense of humor.
I do have a quibble, though, with “surface temperature.” It amalgamates near-surface land air temperatures (LAT) with sea surface temperatures (SST). I am aware of how the providers of the estimated data do this, but I am uncomfortable with combining measurements for two such dissimilar physical properties, then attempting to present a coherent reflection of a changing global climate. It would seem to “smear over” some important climate metrics.
LATs and precipitation by climate region would indicate what is going on “where we live.” SSTs by ocean sub-basin would show some of the drivers of LAT and precipitation.
Global combined land and ocean temperature estimates simply show a varying, slowly rising trend from the Little Ice Age. Not much help.
I’ve been expecting to see the satellite data going the way of every surface data.
When the US can’t even prosecute the Clintons for their crimes – but instead lets them run for president – it seems the only way you guys will stop this is to have Trump.
Almost all of difference between satellite and ground is due to amsu. Aligning amsu to Msu is non trivial. You’d know that if you read code more and commented less.
I wonder if some expert is aligning his MSU onto your AMSU at this moment, Mr. Mosher? You really should read Spencer in addition to Mears.
Code be damned! Grab em by the molecules and their shivering frequencies! Make em sweat and give up their increasing energy trend. AGW demands it!
Funny how their “adjustments” are always in favor of Warmism. Quite remarkable really. Must be coincidence. Right Nick?
Karl lowers the long term trend.
Hansen 2010 lowered the trend.
Again, they sacrificed a small part of the long term trend to “eradicate” the hiatus. Ugly people.
[snip]
Hee, Hee, Hee:

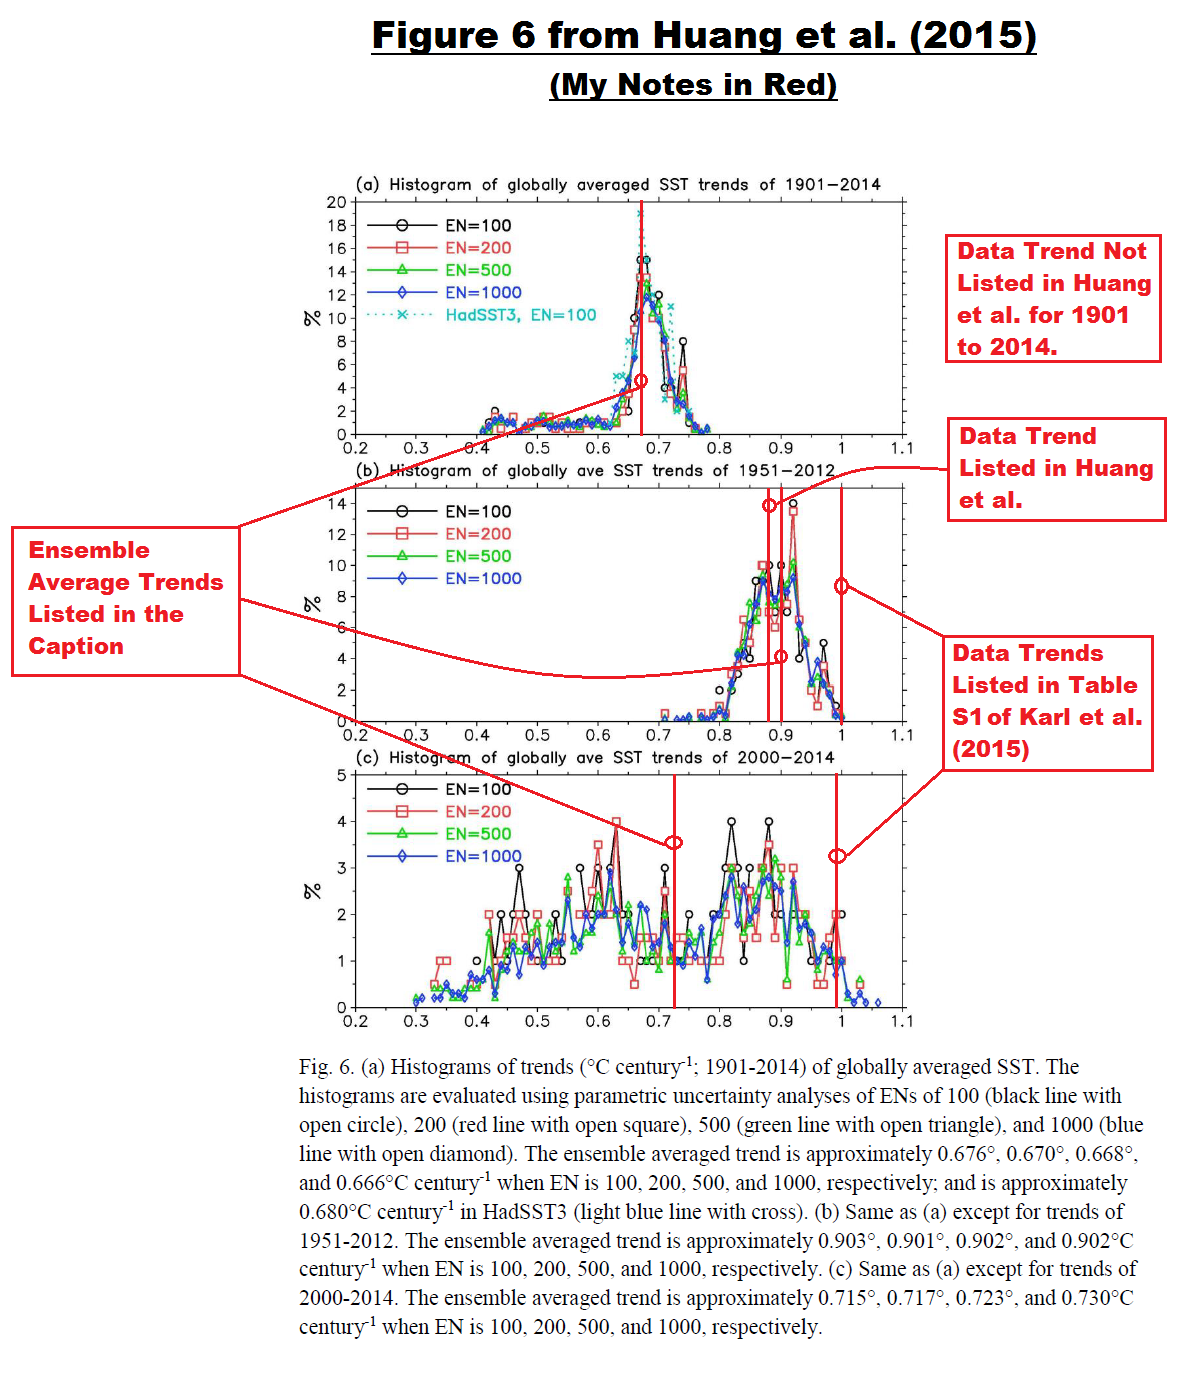
And Hee:
Hee, again:
Oh, why not just read the whole thing:
https://bobtisdale.wordpress.com/2016/01/27/on-the-monumental-differences-in-warming-rates-between-global-sea-surface-temperature-datasets-during-the-noaa-picked-global-warming-hiatus-period-of-2000-to-2014/
I have noticed this minor data changes issue before and asked about it here. On a number of occasions when I have gone back to the monthly TLT data to get the next month’s update the previous months have changed a little. I’m not sure about older ones. It was confusing me and I thought it was something to do with the process and asked here but it wasn’t picked up by anyone. However, reading Roy Spencer’s explanation above would seem to answer it for me. The extra data point is being used to re-calibrate the existing models – presumably some sort of Bayesian methodology is being used for this.
Has this data and the changes been validated by the Radiosonde measurements, if no one has replicated the measurements it’s not science, just statistical fudging.
Radiosonds? There are too few. They are heavily adjusted.
Radiosondes? Oh, heavens! The data could be wrong? Or even adjusted?
Find me another Weed Patch, says Mr. Mosher! I’m a paid alarmist!
Charlie Skeptic
here is a good point to check charlie.
What does charlie know.
Radiosond… adjustments?
https://climateaudit.org/2008/05/27/leopold-in-the-sky-with-diamonds/
“Radiosonde adjusters take adjustment to extremes not contemplated in the surface record – ultimately even changing the sign of the trend. Sort of like Hansen on steroids.”
And that boys and girls is charlies lesson for the day
1. he doesnt know the science
2. he doesnt even know THE BEST of skeptical challenges.
he just blathers.. kinda troll like
“1. he doesnt [sic] know the science,” Mr. Mosher? But, could he know humor? Could he know the difference between the significant and the merely trivial? Could he know when people try to distract one from fundamental truths? Could he possibly even know things Mr. Mosher doesn’t?
Since college, the last Weed Wandering I did was when participating in the successful effort to screw the U.S. taxpayer out of $1.5 billion. I know that is chump change to a CAGWer like yourself, but I still think it was significant weed patch.
I do not do “science” anymore. I do not grub through data weed patches to tease out the latest minutia. I aggregate readily available information and draw reasonable conclusions. To whit:
1. Torture the data all you want, but all it ever shows is a slowly varying climate, with a slight warming trend since the end of the little ice age.
2. IPCC climate models are bunk. We are wasting trillions of dollars on “watermelon” wet dreams.
3. Mr. Mosher is a paid alarmist.
So sayeth Charlie Skeptic
The science is settled — only the data is uncertain.
Eugene WR Gallun
Here is one comment I made in January 2016:
Carl Mears is Vice President / Senior Research Scientist at RSS
Here is a quote by Carl Mears»:
“(The denialists really like to fit trends starting in 1997, so that the huge 1997-98 ENSO event is at the start of their time series, resulting in a linear fit with the smallest possible slope.)»
It is remarkable that he uses the term «denialists». A term which can be regarded as nothing else than name calling. ref: The Recent Slowing in the Rise of Global Temperatures
Wikipedia: “Name calling is abusive or insulting language referring to a person or group, a verbal abuse. This phenomenon is studied by a variety of academic disciplines from anthropology, to child psychology, to politics. It is also studied by rhetoricians, and a variety of other disciplines that study propagandatechniques and their causes and effects. The technique is most frequently employed within political discourse and school systems, in an attempt to negatively impact their opponent.”
“Whoever is careless with the truth in small matters cannot be trusted with important matters.”
– Albert Einstein
Carl Mears is involved in this current project:
“Improved and Extended Atmospheric Temperature Measurements from Microwave Sounders. The purpose of this project is to completely redo the current MSU and AMSU atmospheric data records using more advanced and consistent methods. This project is funded by the NASA Earth Sciences Directorate.”
As a Vice Precident I imagine that Carl Mears is quite influential in that project.
My guess is that we will soon see dramatic changes in the RSS temperature data series.
I will be greatly surprised if these changes will show a tendency of more cooling.
In my profession I would be put behind bars if I corrected measurements without well documented proof for the correction.
‘NASA Earth Sciences…..Directorate”. Has a nice ring to it, no?
The “warmists” call people who don’t believe their twisty numbers “denialists”; they can’t stand that the English language requires that the name opposite to theirs is: “coolist”.
[snip]
Could it be that the assumed math is not the reality? Math works only when it describes reality. Mathurbation is just that.
Marcus, I encourage you! As long as the Moderators are not snipping off your important stuff/junk, go for it!
No don’t encourage him, he already wastes a good portion of my day deciding whether his one liners meet site policy or not.
I’m sorry, Anthony. I didn’t think about the amount of time you must spend on this unpaid endeavour. Thanks for all you do.
Dave Fair
Well, Marcus. I have to reverse myself and encourage Anthony to snip your junk.
My take-home message from all of the above? Nobody, especially Mr. Mosher, knows what the hell they are talking about. Models, adjusted data, whatnot are not REAL.
UAH models temperature. Thank you. they are not real.
Your realize of course that the best science and technology requires adjusted data?
Question.. do you wear glasses?