History Keeps Proving Prophets Of Eco-Apocalypse Wrong

Source data: ftp://sidads.colorado.edu/DATASETS/NOAA/G02135/north/daily/data/
Since hitting its earliest minimum extent since 1997, Arctic sea ice has been expanding at a phenomenal rate. Already it is greater than at the same date in 2007, 2008, 2010, 2011, 2012 and 2015. Put another way, it is the fourth highest extent in the last ten years. Even more remarkably, ice growth since the start of the month is actually the greatest on record, since daily figures started to be kept in 1987. –Paul Homewood, Not A Lot Of People Know That, 25 September 2016

One of the world’s leading ice experts has predicted the final collapse of Arctic sea ice in summer months within four years. In what he calls a “global disaster” now unfolding in northern latitudes as the sea area that freezes and melts each year shrinks to its lowest extent ever recorded, Prof Peter Wadhams of Cambridge University calls for “urgent” consideration of new ideas to reduce global temperatures. –John Vidal, The Guardian, 17 September 2012
A TEN-YEAR HIATUS IN ARCTIC ICE DECLINE?
It’s that time of year when the minimum ice extent in the Arctic. One common way to look at it is to pick a particular month and wield a straight line. Fig 1 is from 1979 showing the ice extent going down and down, prompting claims of an ice-free Arctic sometime in the near future. It shows the declining Arctic ice cover which seems precipitous until one considers that it is a decline of about 10% by its measure of ice extent in 35 years! Important certainly but not as dramatic as the graph shows. But with graphs like those one needs to step back and consider the context, for it does not show what it appears to.

Between 1979 and 2015 – the years covered by the graph – atmospheric CO2 levels increased a lot, from 340 ppm to 400 ppm. To put it into context the increase from 1960 to 1979 was just 25 ppm. Fig 1 shows that during this unprecedented increase the gradient – the rate of decline – of the sea ice loss remained constant. In other words the addition of almost 20% of CO2 into the atmosphere did not change the behaviour of the sea ice at all. If one was being strict, based only on the arctic ice data and CO2 information, one would have to conclude that there is no correlation between Arctic sea ice extent and atmospheric CO2 levels! Surely one might have expected the more CO2 in the atmosphere the greater would be the so-called polar amplification effect, and the greater the decline in the rate of loss of sea ice.
As I wrote when looking at last year’s data the declining Arctic ice cover has been one of the most powerful images of climate change and that many who follow the debate don’t look too hard at the data. This results in superficial reporting that does not convey any of the complexities of the situation and as such is poor science communication.
Last year a suggestion (which had been made before) that Arctic ice was more resilient that was thought prompted much discussion but little media coverage despite the research being published in Nature Geoscience by Tilling at el (2015)called “Increased Arctic sea ice volume after anomalously low melting in 2013.” The headline was that the volume of Arctic sea ice increased by about a third after an unusually cool summer in 2013. Reports went on to say that the unusual growth continued in 2014 and more than compensated for the loss in the three previous tears. Overall it was concluded that changes in summer temperatures in the Arctic have a greater impact on the ice than was thought.
With the data for 2016 now in it is time to look again at the claims of an “ice pause.” Fig 2 shows the latest situation using one measure of sea ice extent.

This years minimum was reached on day 254 (September 10th) of the year (nothing unusual). The minimum ice extent was also nothing unusual at 4.1 million km2, not the lowest and about the same as 2007. Some media reports portrayed this as the second lowest (behind the anomalous year of 2012) and mentioned its comparison with 2007 without making the obvious comment that it was curious in these days of much talk of rapid ice decline in the Arctic that the minimum extent was the same as it was 9 years ago!

Here is the minimum extent since 2007 (millions of sq km) and it is obvious there is no general decrease in minimal ice area, by this measure, between 2007 – 2016 – ten years! Did anyone run the headline that Arctic minimum ice extent has showed no significant change in the past decade? The case can be made that the behaviour of the Arctic ice cover has changed from the declining years of 1998 – 2007.
Personally, I love the juxtaposition of the ad…very “smarmy salesman” like.
I also liked it, especially the flashing tooth. The problem is that the alarmists never show the whole picture, since doing so would undermine their own arguments. The greater problem is the complicity (or gullibility) of the news agencies, whether newspaper, TV, or any other; if it’s a “story,” then it’s legitimate to run it, and run with it, without checking on its truth, or whether opposing views are available.
My tooth doesn’t flash.
Do I have a lousy connection to WUWT or something ??
Please make my tooth flash.
g
You forgot to buy the upgrade teeth. They flash on command.
You can get anything on the internet. flashing teeth
I was going to suggest that you, of all people, could conjure up the technology but that appears to be unnecessary. 🙂
Gypsy gal, you got me swallowed
I have fallen far beneath
Your pearly eyes, so fast an’ slashing
An’ your flashing diamond teeth
Bob Dylan (of course!)
He is not wearing any pants, either…
Is that called flashing too?
You have to plug the teeth into a USB port to charge them….
Ads are geotargeted. I think.
Specially selected to annoy Guardian readers I think (showing in UK complete with sparkling but not flashy (unlike this site according to Michael E. Mann) teeth).
The flash ads are especially annoying, endlessly consume resources and occasionally start screaming at me for no apparent reason.
I love this article!. I saw the NSIDC graph and said to myself “Oh, there will be an article here soon about record September sea ice extent growth.” And lo and behold, there it was in the recent posts column.
You guys really don’t get it do you? But the question is will there be more humor in the comments or should I actually read them? Decisions, decisions.
How about both koop?
There will be more humor in the comments and you should actually read the comments.
I really like how the ice extent axis truncates at 10 million km2, exaggerating the variability in the extent and making it look like it is almost ready to hit zero (if you don’t look too carefully).
The “pause” in Arctic sea ice decline will be reconfirmed if in the next two years (2017 and 2018) ice extent looks like the years 2008 and 2009, ie waxing up off a low. The crunch would then come in 2019-21. If ice again dips as in 2010-12, then the “pause” would continue, but IMO its extent is likely to keep gaining, thanks to the AMO shift. That turn around would be hard for alarmists to explain.
Thus, the next five years could see the end of this poster child of man-made climate change alarmism.
[NOTE: you are using two handles to comment here, one is “Gabro” and the other is “chimp_of_war”. See WUWT policy, please pick one and stay with it -Mod]
The front line against CAGW is arctic see ice.
Don’t hold your breath for the headline for fastest September growth though.
If it’s explained by AMO shift, similar trends in Greenland, too?
I’m becoming a 60-70 year cycle fan. The next five years should confirm, or not.
It is, however, becoming a lot like this year’s U.S. Presidential election; I don’t really care anymore. Tennis, anyone?
As someone tweeted last night, the only winner is the Voyager spacecraft that is heading away from Earth at a great speed…
Last night I watched a bunch of new lady up and comers playing in the early rounds of the Wuhan Open.
Caroline Wozniaki seems to be back on the comeback trail, and cleaned out her opponent in straight sets, just a couple of days after winning the Tokyo Open Championship.
She still is plagued by that leg injury problem.
G
Caligula Jones,
I believe that New Horizons has the current speed record in that race.
Meanwhile, on board the Enterprise…
Captain Kirk: Full Stop, Mr. Sulu
Lieutenant Sulu: Relative to what, Captain?
If you don’t care, please vote for Trump and let him appoint some SCOTUS judges at least or you will be global warmed into poverty.
Pronghorn antelope hunting, anyone?
We can all go Weed Wandering with Mr. Mosher. Getting lost in data minutia and missing the big picture is his specialty. As I said, we should know something in a few years. Until then, I have no opinion.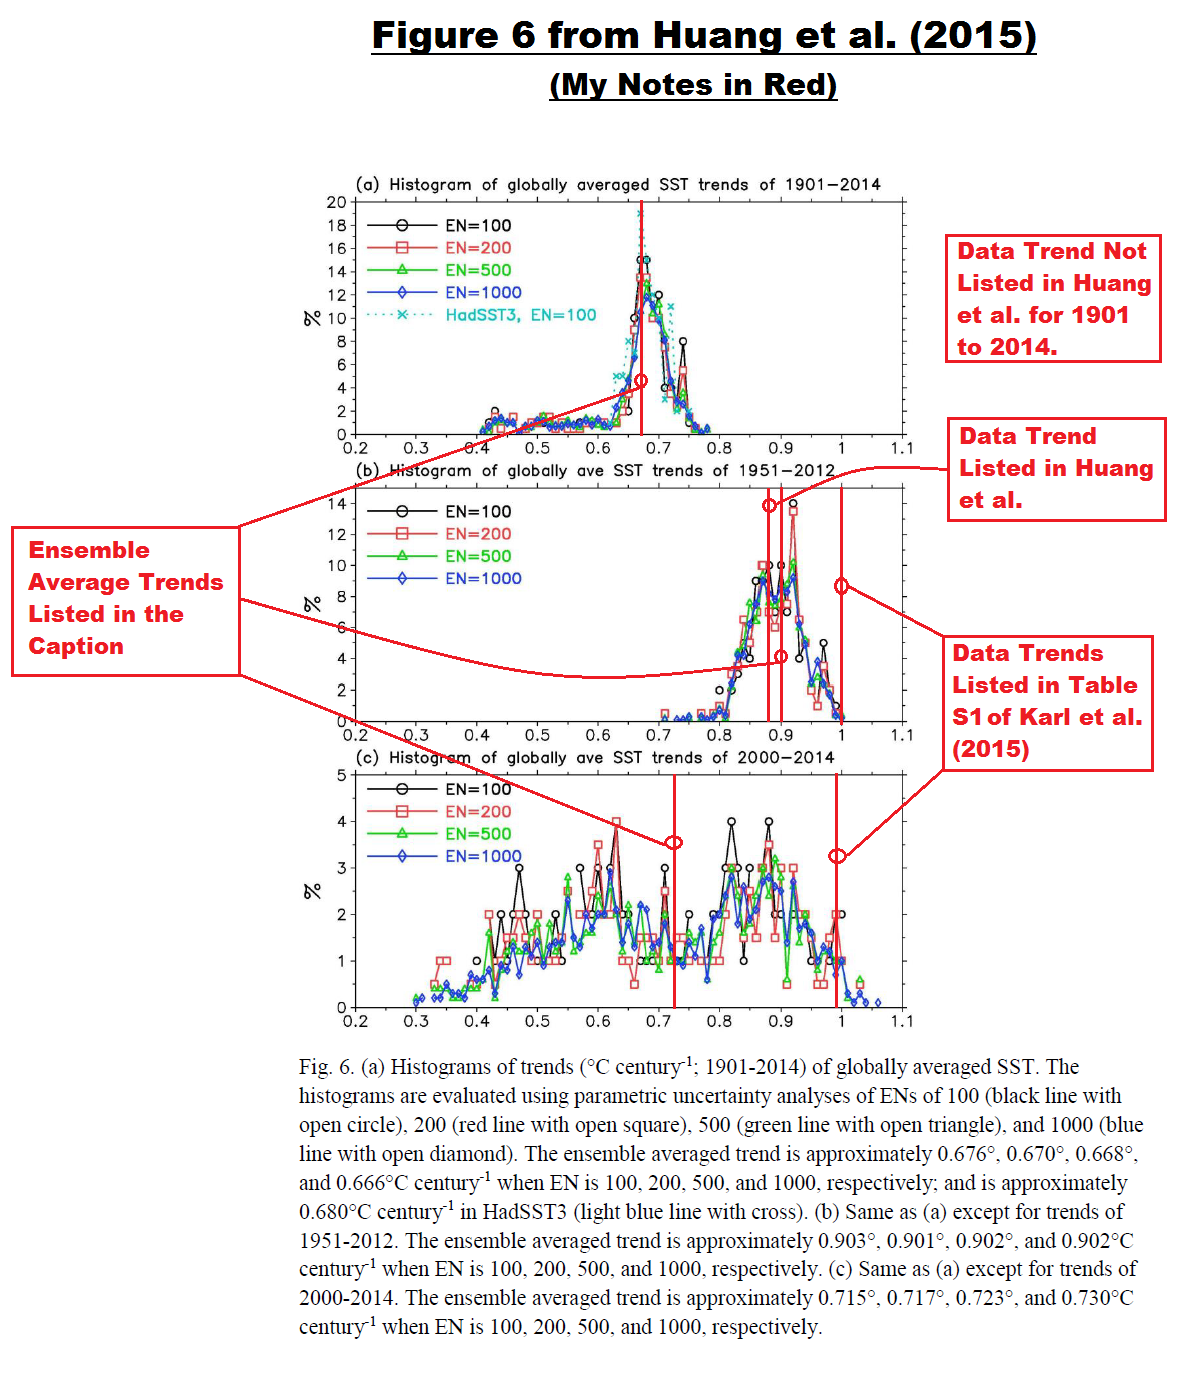 ?w=1280&h=1490
Despite Karl’s misuse of numbers to inflate SSTs, all data sets are cooler than IPCC climate models. To get a hint of number misuse, see:
If you graph Pronghorn movements, you will see big jumps. Does that mean they are unstable, like the Arctic ice?
“… be hard for alarmists to explain.”
There will be no attempt to explain. You need to understand the rules.
Yes indeed – It is quite likely that they will find new reasons for “adjustments” of the arctic ice record, so that there will be no “official” recovery of the arctic sea after 2019 at all…
This trick worked very well with the “official” global temperature records during the climate hiatus or with the sea level rise records by satellite measurements, therefore the alarmists will apply this method to the sea ice statistics as well as soon there will be a need for it…
“The “pause” in Arctic sea ice decline will be reconfirmed if in the next two years (2017 and 2018) ice extent looks like the years 2008 and 2009, ie waxing up off a low. The crunch would then come in 2019-21. If ice again dips as in 2010-12, then the “pause” would continue, but IMO its extent is likely to keep gaining, thanks to the AMO shift. That turn around would be hard for alarmists to explain.”
There is no paws.
At somepoint you clowns will understand that fitting a straight line to short periods, is not a very skeptical approach.
you’d think the busted “pause” in surface temp would have taught you something.
The past ten years is a flat rate,Mosh who has been shown this numerous times now.
It is YOU have a big problem with evidence posted right in front of you.All but one year has been higher than 2007,which make clear it is no longer going down anymore.
When will you realise that fitting linear trends to the downward leg of a natural CYCLE is a job fit only for used car salesmen.?
If you want to put linear trends on a CYCLE it should only ever be over a shortish number of year.
But your job as a hired front man doesn’t give you that kind of understanding, does it, Mosh.
Average Arctic sea ice since 2007 when the AMO topped out.
http://s19.postimg.org/425r9zipf/Arctic_ice_area_trend.png
Our resident English major has spoken.
Study more, comment less, Steve.
From the “Tide always rises” brand of logic?
As with so many other natural cycles:
The tide rises.
The tide reaches its high tide and lingers.
The tide then decreases.
The tide reaches low tide and again lingers.
So far Steve, you are simply protesting what appears to be a cyclic bottom. A part of a graph that over centuries has a very sinusoidal shape.
A cyclic bottom while various temperature entities shriek, scream and all but tear their clothes while pronouncing each month and year the “Hottest evah”!
Somehow, that ‘hottest evah’ happening during a temperature pause is not very convincing.
Especially when the Arctic also begins it’s pause in decreasing ice…
It is time to dump alarmism, praise Gaia and accept natural cycles far overwhelm man’s miniscule impacts to Earth.
I’m in love with Gaia’s cyclic bottom. Mr. Mosher’s ragged doodles look like cellulite.
Do I notice the scent of juvenile response? “…you clowns…” Classic indicator of poor untutored debate tactics.
Pamela Gray September 27, 2016 at 6:46 pm
My thoughts exactly Pamela!
Pamela Gray, add me to the list. Labeling those who may have a (slightly) different scientific point of view as “you clowns” doesn’t win any arguments.
A recent talking point has appeared: “There is no pause, and there never was.”
That narrative seems to have crept in here. At last count, though, there were some sixty ‘explanations’ for the ‘Pause’. Everyone accepted the Pause, because it was supported by irrefutable evidence. Millions of people observed what was happening (or not happening). And both sides of the ‘climate’ debate were looking for an explanation of why global warming had stopped for so many years, while the rise in CO2 continued unabated.
But now the narrative has become: ‘There was no pause.’ (Here, it’s: “the busted ‘pause’.”)
But what would anyone expect, following the Little Ice Age? That was the second or third coldest period of the entire Holocene. Isn’t this what we would expect? :
http://www.climate4you.com/images/NSIDC%20GlobalArcticAntarctic%20SeaIceArea.gif
If the predictions are concerning an ice free Arctic, let’s start using graphs with the left scale starting with zero.
Charlies keptic:
While I can appreciate the lure of Gaia’s cyclic bottom, as it does imply a certain rhythmic existance mankind has felt and lived by, physically and in their souls for eons.
I am quite puzzled, though, where you perceive cellulite?
Mr. Mosher prefers using mathematically exact graphics. Steve may scribble, but I haven’t witnessed it.
Poetic license, A The oK, .
Charlie Skeptic
Poetic license allows one to see Steve’s cellulite scribblings?
Heaven forfend!
No offense intended Charlie, my mischievous nature got involved when I read that Pamela smelled childish scents of the “…you clowns…”, whomever they are.
I can sympathise, ATheoK. Even straight humor fails on blogs. Sarc tags are a sign of the limitations of the media.
Mischievousness, a trait of our new colt, often irritates the serious (seniors?). It is often impossible to show light-hearted intent. Mischievousness is interpreted as malice in many cases. Burnt fingers tempers mischievousness with tact, if we manage to pull back a whole hand, that is. Be aware.
That said, however, without mischievousness we are a bunch of old fogies. Get used to people misunderstanding you. But children will like you.
Charlie Skeptic
Clearly paws are an Abomination unto Nuggan. Therefore Nuggan is an abomination.
You are correct Charlie, and it is not a problem. I got used to it decades ago. Most people I hang around with get used to my idiosyncrasies. I can be hell on presenters, though.
Old enough to locate an old Wormy D&D graphic to use as an avatar, though sometimes it is a Vaughn Bode graphic.
Johnanother:
Good return on the paws! Only, now we need nuggan explained.
Them short straight trend lines the alarmists love so much must be the paws Steve is referring to; like short claws on the end of rat legs.
Cycles work both ways don’t ya know, in this case El Nino demise. It’s time to teach the lesson yet again, and throw in AMO for good measure this time.
We, hopefully, will see.
This is another urgent call for more grant money.
The idea seems to keep predicting collapse every year without regard to what is actually happening.
For those of us old enough to remember Charlie Brown and Lucy, what we are watching is the “Charlie Brown” school of climate study.
“Just kick the football Charlie Brown! You can trust me! I am holding it still for you. This time I am telling you the truth. It’s a sure thing!”
If you are an alarmist, every year is the end of the world, and the slide into chaos is inevitable — but “we need more grants to study it!”
A nice 30 year cycle…and we are back to the same place we were in the first graph.
+0.6 million km square added in September.
1/2 cycle?
Arctic ice cycles demonstrate natural climate variability. The Arctic is well within historical parameters:
http://joannenova.com.au/wp-content/arctic-sea-ice-dec-2015.gif
There’s nothing unusual or unprecedented happening. This has happened before in the Arctic, repeatedly. Relax. It’s just another false alarm.
db, the important news is the plateau in Arctic ice analogous to the temperature one. The resurgence in ice this year is remarkable and confirms the lack of decline since 2007.
https://rclutz.wordpress.com/2016/09/27/arctic-ice-resurgent-sept-27/
Ron
So suddenly the temperature drops and the sea ice area increases, just like that. If one looks back over previous years sudden increases can can again turn to sudden decreases overnight. Why ?
The key question remains, what is the signal / reason that turns decline to increase and where does it come from, what controls the date and the amount of sea ice decline, and what causes these sudden reversals.
These are the topics worthy of analysis.
ozone, it is complicated with cycles of varying periods, but analyses have been done and much is known. Synopsis here:
https://rclutz.wordpress.com/2015/05/26/climate-on-ice-ocean-ice-dynamics/
Agreed, long term trends and local factors as described in your great article and references. This is the long cycle. But when you look at the day to day variations on any idividual year these are controlled by other significant factors. The 2003 year is a great example, end of decline start in rise, back to sharp decline (NSIDC data).
This is the area that I find interesting, there is a definite identified controlling mechanism that directly controls the rate of decline, minimum date and rate of recovery with recovery ups and downs. It is this signal that can make a really low ice year within the larger cycle.
My impression is that daily fluctuations occur partly because the ice is constantly moving around. Unlike Greenland or Antarctica, this is drifting sea ice lacking a land anchor. The other thing is errors deriving from the difficulty measuring anything in the Arctic, especially with the growing darkness. IMO the short term variability arises from water (varying temp and salinity), wind (varying circulation regimes) and weather (storms which break up, compress and move the ice). All this makes predicting ice extents highly uncertain. I am afraid it is not one mechanism, but several. I did a post on some of the complexities:
https://rclutz.wordpress.com/2015/07/20/follow-the-water-arctic-ocean-flywheels/
Ron,
Yes, although most of the polar orbiting weather satellites launched in the last decade or so have an NIR sensor that can discern between ice and clouds, even at night. Older data is definitely more suspect, especially during the polar winter, although it should be assumed that when the poles are in darkness, they are also covered by ice and snow, moreover; relative to the albedo, it’s irrelevant.
In a chaotic non linear climate, the exact details of why arctic ice does what it does are NOT the most important question. The most important question is whether strong enough evidence exists to reject the hypothesis that natural variability is responsible.
Don’t fall into the trap that unless we can explain every detail of the chaotic non linear behavior of the climate that human behavior must be responsible for the wiggles up or down.
KTM
Firstly there are no traps. It is also debatable that it is that chaotic. Everything is chaotic until a a reason / sequence or logic is found. That is my interest.
I am not suggesting at all that human behaviour is responsible, far from it.By looking at the detail within the annual variability I described above, it actually proves that it is a natural variability.
its outside historical parameters going back at least 150 years.
Since 2007, the null is also busted.
like Willis said
You mean going back to the COLDEST period in the current Interglacial, the LIA.
Is that what you mean, Mosh. ?
PLENTY of evidence that during the first 3/4 of the Holocene, Arctic sea ice was often pretty much “ice free” in summer.
I suggest you look at the Icelandic Sea ice index, and get some REALITY into your sales pitch.
http://s19.postimg.org/bkgbf2prn/Icelandic_sea_ice_index_2.png
Look closely, you can even see the AMO pattern over the LIA EXTREMES.
Also note that late 1970’s were up there with those LIA EXTREMES.
Interesting–arctic ice is up to 4.2 Wadhams
Well it is just Wad-ling along !
g
At this point in time, wad difference does it make?
TEN-YEAR HIATUS
well………
http://www.climate4you.com/images/OceanTemp0-800mDepthAt59Nand30-0W.gif
Your blue graph is not a band limited signal, so you do not have anywhere near enough samples for it to represent anything real.
And who scribbled that dotted blue line across your graph ?? Where and when and who measured that dotted blue scribble ?
g
How hard is it to get the address where it came from?
http://www.climate4you. com/images/OceanTemp0-800mDepthAt59Nand30-0W. gif
Looks like a Cooling North Atlantic to me
If that is degrees C at 59 North (800 metre depth), it shows how much energy is being transported away from the equatorial/tropical ocean to the poles (well northwards).
There is a steep fall in 2015/16. i wonder whether that is anything to do with what else may have been happening in the equatorial/tropical ocean at this time.
Where has the energy gone instead of going North?
So the discussion is about Arctic sea ice extent and you put up a graph that is labeled as “North Atlantic Current temperature”…what exactly is your point?
I believe he is pointing out that the sea temperatures from Argo show that the sea has been cooling off over the last ten years and that this may be why the ice is not melting as fast over the last 10 years?
We have a winner….
OK, but that also means that warmer water may have been causing the higher melt rates as well. But since the graph only starts at 2004, it’s not easy to see if there is a correlation there. Then again, we really don’t have enough good data on Arctic sea ice extent and water temperature to do more than speculate. But have fun anyway.
…we have another winner
The ordinate goes from 7.6 to 9.2 what, that graph should show units.
The text says: North Atlantic Current temperature transect.
Hardly likely to be °F or Kelvins is it?
My guess is it’s °C.
I’m willing to bet … any takers?
Classic how-to-lie-with-statistics (Huff) data presentation. A graph that has the ordinate zero about a yard below the abscissa, and an expanded ordinate scale to make the changes look bigger. Nice try; no cigar for you.
Oh come on, we’ve been through this how many times before? Edward Tufte would disagree with you. He’d probably recommend a break in the Y-axis and would certainly recommend units in the label in addition to the explanation in the lower left corner.
There have been WARM water pulses of subsurface water into the Arctic in the nineties and 2000’s. This warmer water cooled down during the ten years after entrance in the Arctic seas. An entrance of colder water into the Arctic (is this already observed???) would mean colder future water below the ice. Which could induce less summer melting – as recent warmer subsurface water coincided with a period of higher melting. See: http://journals.ametsoc.org/doi/pdf/10.1175/2010BAMS2921.1
Wow. These comments, in response to what seems to me to be a fairly straight forward and self explanatory graph are simply stunning.
Thanks for posting it Latitude.
…welcome
So the graph shows that the North Atlantic Current temperatures are on the decline, does that mean that Summer Arctic Sea Ice will soon recover from previous losses?
“LT September 27, 2016 at 12:19 pm
So the graph shows that the North Atlantic Current temperatures are on the decline, does that mean that Summer Arctic Sea Ice will soon recover from previous losses?”
“loses”? Relative to what? 1979? How scientific of you.
The real question here is where is the canary in the coal mine going to fly to because there is no “death spiral” and the likely hood of the prognostications of the alarmists coming to pass are ever more unlikely. So any ideas out there as to where the new critical node for climate change will be once it becomes apparent to even the dimmest bulb that Arctic sea ice is not going to support the alarmist meme any longer?
Latitude, your point is not clear to me. The thread is about ice extent and your graph shows 0-800 m depth temperatures.
.Arctic sea ice aside, how can CO2 blamers explain the decline in N. Atlantic Current temperatures, while CO2 concentrations continued to soar like a homesick angel? Latitude: hoist with his own petard!
Randy, subsurface Atlantic Ocean water enters by Fram Strait and East of Svalbard the Arctic Ocean (and on the other side some Pacific subsurface water enters through the Bering street). That Atlantic water can be a bit warmer or a bit colder. When colder water is available in the Northern Atlantic and this flows into the Arctic Ocean, the sursurface waters of the Arctic Ocean will be colder. When that water is colder, less energy is going upwards so less ice will melt from the bottom side of the ice. And more ice will remain in summertime.
So it is important whether the subsurface Northern Atlantic is colder than the average or is warmer than the average.
The surface layer of the Arctic Ocean is less salty than the subsurface water. Therefore it is lighter and because of that, cold less salty water is floating on warmer and saltier Atlantic Ocean Water. Some of the heat of the Atlantic Ocean Water is going upwards and enhances the summer melting. Colder subsurface water will result in less melting – all other things remaining the same.
Latitude, your point is not clear to me….
hint….over 90% is under water
The recent rapid ice growth was while air temperatures were above normal. The reason for the rapid growth could be atmospheric circumstances that are different from normal or it could be colder surface water. (Nullschool SST anomaly showed this summer a long time colder Arctic surface water than normal)
http://ocean.dmi.dk/arctic/meant80n.uk.php
thanks Wim….didn’t realize it would not be obvious to everyone
Another possibility is that because there is more exposed water (less insulating ice) the surface can radiate more heat away early if there is a cool spell. That may explain the rate and early freeze start. This new ice is thin and may melt just as quickly next summer. Lets hope not.
Interesting….
sorta….didn’t they start measuring Arctic sea ice around 1979
http://www.climate4you.com/images/AMO%20GlobalAnnualIndexSince1856%20With11yearRunningAverage.gif
“and it is obvious there is no general decrease in minimal ice area, by this measure, between 2007 – 2016 – ten years”
But if one were to add the data point for 2006 there would be a general decrease. That sensitivity to the very particular years chosen illustrates the level of significance that should be placed on this type of statement.
This is why the “obvious comment” that the minimum extent was the same as it was 9 years ago is not being made. Because then one would have to explain why they didn’t also chose to make the “obvious comment” that it is lower than it was 10 years ago. These obvious comments start to look rather foolish at that point. Better to look at each year in context of the entire data set, as the NSIDC does on their web site:
“This year’s minimum extent is 750,000 square kilometers (290,000 square miles) above the record low set in 2012 and is well below the two standard deviation range for the 37-year satellite record.”
Yes, but a 37 year record is pretty short for climatic purposes. I don’t think you can make any meaningful conclusions based on such a small data set. It may be all we have, but that does not change that fact that it’s insufficient. And the next time someone says “the lowest ever” when talking about sea ice extent, I’m going to scream.
It’s only weather, unless CAGWers say it’s climate. Holy El Nino! We’re all gonna fry!
i think a 10 year zero trend stretch in a record that is 37 years long is significant. it’s 27% of your graph length.
actually without making conclusions and for this one i am going to use the weasel words “might” “would”and “should”
it looks like 2012 “might” be the bottom and the 2007-2016 “should” show a bottoming and recover phase, only if the rise in extend “would” increase the coming 5 years pointing to an unknown cycle that “might” be on it’s reversal.
i think this can be a possibility but it’s too early to say “it is” that’s why i used the weasel words for one time.
the next 5 years of data will show the opposite or a confirmation of this idea i have.
all i know for sure is that I did find it strange to see on the cryosphere graph that after a sharp drop in the late 90’s early 2000’s it stayed around a new “mean” of -1million square km starting in with the dip in 2007.
it’s even stranger to see a fast recovery like this month. i didn’t actually expect this.so the arctic is fiull of surprises.
If you believe that 37 years of climatic data is enough to draw any meaningful conclusions, I suppose 10 is “significant”.
5 to 10 more years would help to begin guessing about a possible 60 to 70 year cycle. Weasel wordy enough for all you Blog Gunslingers?
If 37 years is not significant how can the period from the lowest extent until now mean anything?
Paul, i think the fact you had to take my comment with a pinch of salt wasn’t maybe clear. but i never use weasel words that way 🙂
i thought the pinch of salt was clear enough by the fact it was obvious that 37 years of data was not enough to draw conclusions
Alarmists use a for climate too short 37 year data stretch which shows a decline without exactly knowing what happened before (exept the truckloads of articles from the early 1900’s that say the arctic is warming fast), sceptics say the ice is on recover based on the last 10 year flat line and those articles. alarmists say it won’t happen.
i thought by putting the conclusion “the arctic is full of surprises” that it was clear enough that it is ways to early to draw any conclusion of decline/recovery and that we have not enough data to hindcast it decently.
however and that was the “real undertone” and what i think:
all the reports from the arctic, even the very sparse ones from early 1900’s do suggest that there is a cyclic behavior of the arctic ice extend, but where are we on this cyclic behavior? We simply don’t know: the reliable record is too short to tell
” …why they didn’t also chose to make the “obvious comment” that it is lower than it was 10 years ago.”
Why so modest? The sea ice extent is even “more lower” [sic] than is was 35 years ago. The instrumental period trend is lower – the author took pains to highlight that. You should be thrilled.
But the *rate* of decline has been unaffected, while CO2 concentrations continued to soar. Therefore there is no apparent link between Arctic Sea Ice Extent and CO2. I believe any 8th grade science student could conclude that in a thrice.
And the first IPCC report included data showing a substantial increase in Arctic sea ice throughout the early 1970s to 1979.
Whilst this plot contains greater measurement error/uncertainty than we have today, it suggests that present day Arctic Sea Ice may be broadly similar to the extent that was present at the beginning of the 1970s.
No surprise that that plot has not been included in later IPCC reports because it is somewhat inconvenient (but perhaps can be explained away by measurement uncertainties).
I would give the link but since my upgrade to Windows 10, I have lost a lot of book marked data, and I have had to change browsers and I do not use MS Edge.
Leo Geiger:
The Arctic ice low for 2006 is somewhere around 4.88 sq.km. A number that will change the trend in minimums from 2007-2016 a minuscule amount.
That’s an eleven year trend.
Are you placing a bet for the low ice extent in 2017, and going for twelve years?
i dare to make a bet even with the uncertaintity of yearly variables.
all pre satellite reportsand paleoclimatology point to a possible cyclic behavior of the arctic ice extend.
the only part that holds me back from doing an “all in bet” is the fact that the reliable record is too short to tell where we exactly are on this cyclic behavior.,nor do we know if there are larger cycles.
but i would dare to bet half of my poker chips on a 12 year stretch. i think it’s fairly safe to make the assumption we have a top to bottom record of this cyclic behavior.
if it exists of course
” . . the increase [in CO2] from 1960 to 1979 was just 25 ppm. ”
Sea ice extent in the Arctic was rather dramatically expanding during most to all of this period, if not all, was it not? The infamous 1974 Time Mag article, “Another Ice Age?” contained a graphic illustrating the change in extent, comparing May 1968 to May 1974.
These folks color enhanced the graphic – it’s a keeper
Thank you for that, wow.
Check out my satire on that Time magazine article at:
http://www.uncommondescent.com/intelligent-design/winston-smith-loves-big-brother-even-more-now-that-he-has-returned-to-the-fold-and-discovered-global-warming/
@garyh845
Check out my parody of that Time magazine article at:
http://www.uncommondescent.com/intelligent-design/winston-smith-loves-big-brother-even-more-now-that-he-has-returned-to-the-fold-and-discovered-global-warming/
Super! Puts a different spin on Human Caused Climate.
Can anyone elucidate the problem with the Navy Research Lab website? It has mysteriously stopped working, and their data has always conflicted with NOAAs and NSIDC.
I found a current google preview image of the Navy lab’s sea surface temperature two days ago but the image didn’t appear on the actual page and now the image won’t turn up with a search at all. Interestingly, the Navy Lab’s data showed the Beaufort Sea’s temperature right at the sea ice freezing point, almost like it had actually never decreased below the 15% sea ice coverage cutoff.
I think that’s a possible explanation for the early sea ice minimum and the current record growth in September sea ice, because that ice never actually melted! Now the NOAA and NSIDC data is playing catch-up with reality.
Well it appears to be accessible now, though something is wrong with their certificate?
This is what I’m talking about, this is the SST from Sept 10th. Notice how much area of the Beaufort Sea is right at -2 degrees, yet much of the area was shown to have no sea ice at all at the minimum.
The personnel associated with NRL are in a camp, being “reeducated” as we speak. “Resistance is futile. Assume the position, 61029!”
I have found if you go to
http://www7320.nrlssc.navy.mil/hycomARC/
wait a bit, scroll down and click Arctic, then you see the thickness, concentration, drift charts.
Griff, I get an “insecure connection” warning on Firefox from that site.
The sea surface temp for much of the Arctic is the coldest I’ve seen it. Often it goes from warmer than average to frozen. So the quick freeze may continue.
http://www.ospo.noaa.gov/data/sst/anomaly/2016/anomnight.9.26.2016.gif
What I don’t understand is this graph. I got to it via the WUWT Sea Ice Page. The graph there doesn’t update so you have to click on the first link above.
The graph shows the temperature being a fair bit warmer than normal. WUWT?
Every gram of water turning to ice releases 80 calories of heat. I always look at above average temperatures on that DMI graph as indicating lots of freezing going on. A generalisation, I know, but often it is correct.
I know what you mean but it might just be a matter of where and how they measure it. The freezing water emits heat so the temp spikes are part of that. The DMI chart is a lot older than the one above and goes back pre satellite. The base line could be different.
Another try to paste the satellite photograph, or at least the location: ?dl=0
?dl=0
Location:
http://www.nrlmry.navy.mil/nexsat-bin/nexsat.cgi?BASIN=CONUS&SUB_BASIN=focus_regions&AGE=Latest&CCA=Arctic-x-x&SSC=x-x-x&PRODUCT=true_color&SUB_PRODUCT=viirs&PAGETYPE=static&DISPLAY=single&SIZE=Full&PATH=Arctic-x-x/x-x-x/true_color/viirs&CURRENT=20160928.004301.npp.viirs.True-Color.Arctic.covg85p7.x.res4km.jpg&
TinyCO2
“The sea surface temp for much of the Arctic is the coldest I’ve seen it.”
__________________
Arctic sea surface temperatures are mostly well above average for the time of year according to NOAA OISST v2:
http://pamola.um.maine.edu/fcst_frames/GFS-025deg/DailySummary/GFS-025deg_NH-SAT1_SST_anom.png
I wonder what it would like if the anomaly base period was 1981-2010 instead of 1971-2000.
The comment was specifically to do with the chart I posted. For longer periods, much of that area was already ice. In recent years, where there was open water in the Arctic it was mostly warmer than it is currently.
And, the anomaly baselines are built with very sketchy measurements.
DWR:
According to your chart url, that picture is from the GFS ensembles.
GFS is a forecast model, not the actual temperatures.
This is from the same web site and, unfortunately, still has GFS as part of the title and therefore may still be forecast rather than actual:
http://pamola.um.maine.edu/fcst_frames/GFS-025deg/DailySummary/NH-SAT1/SST/2016/GFS-025deg_NH-SAT1_SST_2016-09-27.png
Here is the JRL satellite truecolor image:
Arctic-x-x/true_color/viirs20160928.004301.npp.viirs.True-Color.Arctic.covg85p7.x.res4km.jpg
Right now, in a number of Arctic satellite photographs, there is brilliance overloading sensors in a large area over the pole.
How the temperature sensor satellites handle excessive refracted/reflected light, I do not know.
There is a great deal of qualitative evidence that Arctic sea ice is quasicyclical with a full period of 60-70 years. DMI August ice maps show decline from 1921-1939. Larsen made the first single season NWP transit in 1944. That puts a peak around the time satellite coverage started in 1979. And a nadir 2008-2012. That summer 2016 survived several severe gales unlike 2012 suggests cyclic recovery has started. This will be a powerful Warmunist refutation in a few years.
like I always said
…..winter is coming…..
from the top latitudes downward
as evident from my first investigation into this problem\
http://oi60.tinypic.com/2d7ja79.jpg
No it doesn’t.
I could fit it equally well with a hyperbola over the interval shown by the blue graph.
And that region around zero horizontical clearly has the wrong slope showing no hint of the previous valley.
Just numero-mumbo-jumbo-
g
just numero-mumbo-jumbo-
What, darling, in the propaganda of climate change, isn’t?
Actually, there are many periodic inputs to the system, all of which can be decomposed into the sum of sine wave components. Diurnal effects are one, seasonal effects are another, the effects of aphelion/perihelion are another and these are just the ones whose periods are 1 year or less. There are other longer term periodicities like ENSO and PDO cycles, Maunder cycles, axial tilt, the precession of perihelion, variable orbital ellipticity and likely many more that we just don’t have knowledge of and the data to discern. For example, most of the stars we observe in the cosmos are variable output with arbitrary periods and magnitude and given what we observe, we can’t rule out undiscovered long term periodicities in our star’s output.
A causal LTI system (and yes, in the context of LTE behavior, the climate system is quite time invariant and quite causal) stimulated with sinusoidal stimulus will produce a sinusoidal response. If this wasn’t true and the response to sinusoidal stimulus was not predictable, it would be impossible to quantify seasonal and diurnal variability in order to subtract it out from the data so that anomaly analysis can be used. Keep in mind that the yearly variability in the global average temperature that gets cancelled out of the data to produce anomaly reports (about 3.5C) not only exceeds the change presumed to have occurred since the end of the LIA but exceeds the nominal change said to be the result of doubling CO2.
Steven Mosher September 27, 2016 at 10:56 am
“In other words the addition of almost 20% of CO2 into the atmosphere did not change the behaviour of the sea ice at all. ” Wrong.”
“The change in behavior of the sea ice is most evident after 2007 BUT NOT in the rate of decline, but rather in the VARIABILITY.”
What a weird statement.
The ice in all years after 2007 except for 2008 and 2016 showed a rate of increase not decline.
And the sea behaved as it always does.
Think of weather this way
At a certain thickness the ice doesn’t react to the sun in winter. In summer the ice thins ( from the thermal changes in the arctic ) it is then more susceptible to strong winds. More prone to break up ( increase surface area = more melting ) more prone to compaction ( shrinking ) and more prone to spreading out and actually creating more ice ( you see the same thing in Antarctica in Summer there as well}.
There was no “slow secular decline”
There is no “much more variability in the data.”
People who believe the ice must be melting because of CO2, Wadhams and SM, look for changing patterns until they find one which proves their point. There is no decline in sea ice volume since 2007 but CO2 insists there must be one.
Instead of objectively looking at the facts, Trend for that short period is up, they look for a proxy.
In this case an imaginary variability. Since the sea ice varies every year if you look for variability you will always find it.What significance is has depends purely on your motivation to find it.
“In other words the addition of almost 20% of CO2 into the atmosphere did not change the behaviour of the sea ice at all. ”
Wrong.
The change is most evident after 2007 BUT NOT in the rate of decline, but rather in the VARIABILITY. As the Ice shrinks and thins it becomes more susceptible to MECHANICAL forces —
that is weather. Think of it this way
At a certain thickness the ice doesnt react to an arctic cyclone, but once the ice thins ( from the thermal changes in the arctic ) it is then more susceptible to strong winds. More prone to break up ( increase surface area = more melting ) more prone to compaction ( shrinking ) and more prone to spreading out and actually creating more ice ( you see the same thing in antartica.
So what changed with the slow secular deline is the increased susceptibility to natural forces like winds and current. And so, post 2007 you seee much more varibility in the data..
Rapid lossess and rapid gain…. BUT the slow secular decline continues.
EVEN WILLIS saw this change
Willis on the Null
https://wattsupwiththat.com/2010/06/01/the-ice-who-came-in-from-the-cold/
“The oddity about the data is what happens after 2007. Suddenly, there is a strong annual signal. I have put in vertical black lines to highlight this signal. The vertical lines show the end of September of each year. Before 2007, there is only a small variation in the data, and it does not have an annual signal. After 2007, the variation gets large, and there is a clear annual aspect to the signal. The area in September (the time of minimum ice) is smaller than we would expect. And the area in March (the time of maximum ice) is larger than we would expect.”
As I point out this challenges the null
https://wattsupwiththat.com/2010/06/01/the-ice-who-came-in-from-the-cold/#comment-401837
Willis agrees
https://wattsupwiththat.com/2010/06/01/the-ice-who-came-in-from-the-cold/#comment-401862
And then he tries to blame it on a software change.. But gets the wrong satellite
I point out that the data is the data and the null is busted.. but people are free to
speculate that it could be something else.
https://wattsupwiththat.com/2010/06/01/the-ice-who-came-in-from-the-cold/#comment-402036
Then.. willis points to a software change on the wrong satellite
https://wattsupwiththat.com/2010/06/01/the-ice-who-came-in-from-the-cold/#comment-402047
And finally there is a promise to write and see if there is any evidence of a software change
https://wattsupwiththat.com/2010/06/01/the-ice-who-came-in-from-the-cold/#comment-402155
######################
Let’s wrap this up in a nutshell. Willis observed a phenomena in the ice area that challenges the Null. I pointed that out. He accepted that it would challenge the null. that is what the data shows.
he then suspected the sensor software. With no evidence of a software change ( These are put in notes for researchers) he tries to reject the data. It’s now been two years. And still no reply. The record stands. The data show a rejection of the null. Speculations about changes to software have not been confirmed. There is no record of a software change in advisories that PIs routinely post about their data products. There is no follow up on the letter to the PI.
The data stands. The null is busted. The null is busted until you or somebody else proves that the data is an artifact. Arm waving doesnt make data disappear.
Yawn… Zzzzzz……..
too funny Willis says the NULL is busted..
there you have it
Willis, is obviously wrong since the last 10 years is very different,from the previous ten before that.The decline rate is about zero now.
Willis observed a phenomenon……
Yeah with a tiny data base as compared to the rest of the interglacial period.
Willis doesn’t have a credible case anyway, since there have been a number of science papers posted,generally stating that for around FOUR THOUSAND years there was little to no summer ice in the Arctic region.
Stop abusing the Null Hypothesis.
Starting about 3000BC there was a general COOLING called the NEOGLACIATION, which took us down, with bumps at the RWP and MWP, to the COLDEST period in the whole Holocene, the LIA.
A point we have only just, and barely, managed to climb out of.
Average sea ice since 2007.
You need a new sales pitch if you want to sell your lemons, Mosh.
http://s19.postimg.org/425r9zipf/Arctic_ice_area_trend.png
AndyG55, why was 2006 chosen as your starting point, when we have data that goes farther back?
Steve:
You use Willis’s analysis from 2010, three years after 2007, to disprove a ten year trend, starting in 2007?
The thin ice vs thick ice problems so obvious in 2007-2010 are not relevant to the current state and areas of thick ice of 2016.
The null is busted until you or somebody else proves that the data is an artifact.
No, that’s an assumption. First, you have to show cause and effect, which is not clear at all here. What is the mechanism that causes CO2 to be able to reduce Arctic ice? Why doesn’t it work on Antarctic ice? Could this be a coincidence? Is your conjecture testable? And so on.
Looking at the big picture makes the current wiggles in the ice seem laughably inconsequential.
db, old Wandering in the Weeds, Mr. Mosher, always fails on the big picture. He has his data squiggles, but is at a loss as to the drivers. He even believes in IPCC climate models!
We know that heating/cooling is more pronounced in colder climates (at least when quantified as degrees of temperature) since 1 W/m^2 of forcing will increase the temperature by a larger amount when the starting temperature is cold. The unambiguous validation of this is that the first W/m^2 of forcing increases the temperature from 0K to about 65K for a sensitivity of 65K per W/m^2 assuming an ideal black body (no GHG effects, atmosphere or clouds at 0K since even gases are frozen solid). Obviously, the sensitivity decrease with increasing temperature, otherwise, the 239 W/m^2 of accumulated forcing the Earth receives would result in a surface temperature of 65K*239 = 15,535K which is absurd and of course, each of the 239 W/m^2 of average power arriving from the Sun must have the same average effect.
I’ve also noticed significant cooling at upper altitudes (>3km) this summer as compared to the last 2 decades and this seems consistent with the rapid ice formation in the Arctic. I have a suspicion that this winter will be unusually cold.
It is going to get cooler and cooler…
Henryp,
“It is going to get cooler and cooler…”
There’s not enough data to know for sure in the short term, but there’s more than enough data to tells us that in the long term, the climate gets warmer and warmer and them gets cooler and cooler and that this periodic behavior has been and will be repeating forever and no amount of atmospheric CO2 will change this fact.
If the next solar Sun spot cycle disappears, we will know with high confidence that we are heading to another Maunder minimum and that cooling will be the trend for the coming decades which will be followed by warming in the decades following the cooling and so on and so forth.
I don’t know yet if there will be extra-ordinarily cooling
it depends on the next solar cycle
but by my counting things will be business as usual
by average accounts, the weather will be as it was, 86.5 years ago…
It seems a little premature to predict the ultimate “demise” of cap ice based on a linear trend. Sea Ice is a warm cozy blanket over hot sea water (hot compared to winter air temperature). More ice – less heat loss, and vice versa. Albedo can’t be nearly as much of a factor; just as the ice begins to grow the sun sets.
Isn’t the point that when the sun is up, there is less ice and thereby less albedo. The argument being that each year summer ice is less and less.
The position in winter does not matter (save for your lid on the saucepan point).
I used to be big fan of Cryosphere Today, but it has been rendered useless for the last four or five months.
Can anyone recommend an alternative for tracking sea ice on a daily basis?
https://www7320.nrlssc.navy.mil/hycomARC/arctic.html
I got a not secure message and Firefox would not connect.
That link doesn’t seem to work… workround: drop the arctic.html, wait a bit when site comes up, scroll down and click Arctic link (next to Beaufort)
I like this one.. not US based so maybe out of politics? https://seaice.uni-bremen.de/amsr2/index.html
https://ads.nipr.ac.jp/vishop/#/extent
This is a great sea ice site for both poles and also coverage animations since 1980.
I recommend this:
https://seaice.uni-bremen.de/amsr2/index.html
and this is indispensable…
http://neven1.typepad.com/
Hasn’t Wadhams been predicting the demise of Arctic ice in short term timescales over many (long term) years? He is also famous for other rather dramatic claims.
Is Wadhams the only scientist forecasting the rate of decline in Arctic sea ice extent? What did the IPCC forecast, for example?
Serreze says the ‘Arctic is screaming’.
Mark Serreze,Paul Beckwith,Al Gore,Jason Box,the Navy, are a few who made various predictions of a vanished summer ice.
Sunsettommy
“Mark Serreze,Paul Beckwith,Al Gore,Jason Box,the Navy, are a few who made various predictions of a vanished summer ice.”
_______________
The models supported by the UN IPCC don’t project that Arctic sea ice extent in summer will reliably fall below 1 million k^2 before some time in the mid 2040s.
the IPCC reguards wadhams as an extreme outlier.
Ice free by 2050? maybe 50% chance.
So you clowns keep attacking a guy (wadhams) that has lost his mojo.
DWR54,
Modeling runs to 2040 are worthless as they are not testable or falsifiable.
You like many others left The Scientific Method for computer generated far into the future fantasies..
“the IPCC reguards wadhams as an extreme outlier”
No , its a unit of sea ice measurement.
1 Wadham = 1 million km² of sea ice.
“Did anyone run the headline that Arctic minimum ice extent has showed no significant change in the past decade? The case can be made that the behaviour of the Arctic ice cover has changed from the declining years of 1998 – 2007.”
Ah No, there is no headline there, because the claim is silly.
Having lost your paws in temperature, now you try to fabricate one in the arctic.
Jeez.
here is a clue
Follow Nic Lewis. Follow Steve McIntyre.
They at least do science.
you’ll look less foolish years from now
Mosh, you left this part out that shows your attempt to be dishonest:
“This years minimum was reached on day 254 (September 10th) of the year (nothing unusual). The minimum ice extent was also nothing unusual at 4.1 million km2, not the lowest and about the same as 2007. Some media reports portrayed this as the second lowest (behind the anomalous year of 2012) and mentioned its comparison with 2007 without making the obvious comment that it was curious in these days of much talk of rapid ice decline in the Arctic that the minimum extent was the same as it was 9 years ago!”
Then the chart was produced showing that it is a flat trend of 10 nominal years.
Jiminy crickets Mosh every “reputable” climate scientist claimed, predicted, projected, promised etc……the Arctic sea ice would be gone/almost by now. Yet despite “massive” warming which caused the Arctic to “scream”. Multiple yuuuuuuuge Arctic cyclones of “never seen before” low pressures right and the end of the melt season when the should most vulnerable there’s still millions and millions of sq kilometers of “disappearing” Arctic sea ice! For the last NINE years everything according to the “experts” this couldn’t/shouldn’t be happening! What don’t you understand about that?
“Jiminy crickets Mosh every “reputable” climate scientist claimed, predicted, projected, promised etc……the Arctic sea ice would be gone/almost by now. ”
WRONG… If you want to know what the science SAYS.. you have to READ the SCIENCE
— not the newspaper, like some goddarian.
IF you are too slow to read the science, read the AGREED UPON SUMMARY
of the science.
Ar5
11.3.4.1 Sea Ice
Though most of the CMIP5 models project a nearly ice-free Arctic (sea
ice extent less than 1 × 10⁶
km2
for at least 5 consecutive years) at the
end of summer by 2100 in the RCP8.5 scenario (see Section 12.4.6.1),
some show large changes in the near term as well. Some previous
models project an ice-free summer period in the Arctic Ocean by 2040
(Holland et al., 2006), and even as early as the late 2030s using a
criterion of 80% sea ice area loss (e.g., Zhang, 2010). By scaling six
CMIP3 models to recent observed September sea ice changes, a nearly
ice-free Arctic in September is projected to occur by 2037, reaching the
first quartile of the distribution for timing of September sea ice loss by
2028 (Wang and Overland, 2009). However, a number of models that
have fairly thick Arctic sea ice produce a slower near-term decrease in
sea ice extent compared to observations (Stroeve et al., 2007). Based
on a linear extrapolation into the future of the recent sea ice volume
trend from a hindcast simulation conducted with a regional model of
the Arctic sea ice–ocean system (Maslowski et al., 2012) projected that
it would take only until about 2016 to reach a nearly ice-free Arctic
Ocean in summer. However, such an approach not only neglects the
effect of year-to-year or longer-term variability (Overland and Wang,
2013) but also ignores the negative feedbacks that can occur when
the sea ice cover becomes thin (Notz, 2009). Mahlstein and Knutti
(2012) estimated the annual mean global surface warming threshold
for nearly ice-free Arctic conditions in September to be ~2°C above the
present derived from both CMIP3 models and observations.
An analysis of CMIP3 model simulations indicates that for near-term
predictions the dominant factor for decreasing sea ice is increased ice
melt, and reductions in ice growth play a secondary role (Holland et
al., 2010). Arctic sea ice has larger volume loss when there is thicker
ice initially across the CMIP3 models, with a projected accumulated
mass loss of about 0.5 m by 2020, and roughly 1.0 m by 2050, with
considerable model spread (Holland et al., 2010). The CMIP3 models
tended to under-estimate the observed rapid decline of summer Arctic
sea ice during the satellite era, but these recent trends are more accurately
simulated in the CMIP5 models (see Section 12.4.6.1). For CMIP3
models, results indicate that the changes in Arctic sea ice mass budget
over the 21st century are related to the late 20th century mean sea
ice thickness distribution (Holland et al., 2010), average sea ice thickness
(Bitz, 2008; Hodson et al., 2012), fraction of thin ice cover (Boe
et al., 2009) and oceanic heat transport to the Arctic (Mahlstein et al.,
2011). Acceleration of sea ice drift observed over the last three decades,
underestimated in CMIP3 projections (Rampal et al., 2011), and
the presence of fossil-fuel and biofuel soot in the Arctic environment
(Jacobson, 2010), could also contribute to ice-free late summer conditions
over the Arctic in the near term. Details on the transition to an
ice-free summer over the Arctic are presented in Chapter 12 (Sections
12.4.6.1 and 12.5.5.7).
The discussion in Section 12.4.6.1 makes the case for assessing nearterm
projections of Arctic sea ice by weighting/recalibrating the models
based on their present-day Arctic sea ice simulations, with a credible
underlying physical basis in order to increase confidence in the results,
and accounting for the potentially large imprint of natural variability
on both observations and model simulations (see Section 9.8.3). A
subselection of a set of CMIP5 models that fits those criteria, following
the methodology proposed by Massonnet et al. (2012), is applied in
Chapter 12 (Section 12.4.6.1) to the full set of models that provided
the CMIP5 database with sea ice output. Among the five selected
models, four project a nearly ice-free Arctic Ocean in September (sea
ice extent less than 1 × 10⁶
km2
for at least 5 consecutive years) before
2050 for RCP8.5, the earliest and latest years of near disappearance of
the sea ice pack being about 2040 and about 2060, respectively. The
potential irreversibility of the Arctic sea ice loss and the possibility of
an abrupt transition toward an ice-free Arctic Ocean are discussed in
Section 12.5.5.7.
In light of all these results and others discussed in greater detail in Section
12.4.6.1, it is very likely that the Arctic sea ice cover will continue
to shrink and thin all year round during the 21st century as the annual
mean global surface temperature rises. It is also likely that the Arctic
Ocean will become nearly ice-free in September before the middle of
the century for high GHG emissions such as those corresponding to
RCP8.5 (medium confidence).
Really, Mr. Mosher? Model speculation? There are enough IPCC weasel words there to prove just about any “projection.”
Stick to wandering in data weed patches.
Charlie Skeptic
Oh, by the way. “Medium confidence” in IPCC-speak is 50/50 crap shoot.
Nope.. Read the IPCC.. I posted it (chapter 11) but looks like the mods dont want you to read it
Don’t see it yet, may be in spam filter, if I find it, I’ll post it. Meanwhile, stop making conspiracy ideation assumptions.
Gonzo, your comment gets to the heart of the problem with climate change. Your perception is that “every reputable climate scientist claimed, predicted, projected, promised, etc… the Arctic sea ice would be gone/almost by now.”
I would invite you to entertain an alternate hypothesis. There are certain media outlets that will hype the fringe claims of scientists and when the fringe is proven wrong, they hype that the science was wrong and imply that all scientists were wrong. And then people reading it will eventually say that “every reputable scientist claimed the sea ice would be gone.”. Meanwhile, the majority of the scientists’ predictions are ignored. So what I would encourage you to do is go ahead and take the time to do just a minimal amount of research to find on your own when the majority (dare I say consensus?) of sea ice experts actually predicted when sea ice would be “gone/almost”. And then determine if the sea ice extent loss is actually well ahead of scientists predictions.
What you may realize is that the media you are consuming may not actually be as factual/honest as you would have liked. In fact, they might actually produce articles like, well, this one.
Mosh, the IPCC is not a good science document anymore, since it has a lot of crap in it. It is loaded with unverified modeling garbage to year 2100. The few short range models are ALWAYS running waaaay too high, there is still no unusual per decade warming rate going on and that the warming trend since 2001 is about flat to cooling.
Give it up Mosh,you are reaching the bottom of the barrel here.
Read up on The Scientific Method instead. I think the second part of the AGW conjecture is NEVER going to show up.
Koop,
Gonzo has a reason to mock because many Arctic scientists, for around ten years now, keep saying there will be no summer ice by year 2008,then 2009,then 2010 and so on.THE MEDIA LAPS IT UP because such predictions came from the mouths of warmist loudmouths. The public gets mislead or lied to on it,that is the problem when you have people who are scientists, making propaganda style predictions as part of their effort to alarm the public.
Mark Serezze says the Arctic is screaming,Death Spiral. Wadhams ,several different years, says there will be no summer ice left. Beckwith,Gore,Box and other warmist loons,even the United States NAVY have made similar nonsense.in recent years.The MEDIA prints it over and over,year after year, despite the 10 year running prediction failure rate.
Anthony, has a reason to show that once gain the Arctic has a lot of Summer ice left in it,to help the public see that the media along with a few warmist loudmouths, are misleading them. Anthony made his case in a rational manner showing the data and the chart.
Koop,why not instead of complaining about what Gonzo says,go pick on those who are misleading or lying to the media, and the public about the true state of the Arctic region.
Mosher, the IPCC entry you pasted to here doesn’t support your fantasy at all,since it is all modeling junk. They run up to year 2100:
“Though most of the CMIP5 models project a nearly ice-free Arctic (sea
ice extent less than 1 × 10⁶ km2 for at least 5 consecutive years) at the
end of summer by 2100 in the RCP8.5 scenario (see Section 12.4.6.1),
some show large changes in the near term as well. Some previous
models project an ice-free summer period in the Arctic Ocean by 2040
(Holland et al., 2006), and even as early as the late 2030s using a
criterion of 80% sea ice area loss (e.g., Zhang, 2010). By scaling six
CMIP3 models to recent observed September sea ice changes, a nearly
ice-free Arctic in September is projected to occur by 2037, reaching the
first quartile of the distribution for timing of September sea ice loss by
2028 (Wang and Overland, 2009)….”
The above is modeling scenarios decades into the future,is non science, since these Models are NOT testable or falsifiable.
The same IPCC group that have been predicting/Projecting per decade warming rate since 1990, are waaaay above the actual temperature data per decade warming rate.
Stop embarrassing yourself mosh.
Now, now, Tommy. Don’t be so hard on Mr. Mosher. It is past quitting time on the West Coast and he was probably just hurried.
Wait until tomorrow after he clocks in. He should be able to produce much, much more confusing nonsense while on the payroll.
In fact, Tommy, we should feel sorry for Mr. Mosher. It is obvious he has been given the tedious assignment of trolling WUWT.
Steve Mosher:
What!?
Normally, in areas of government publications there is a clear and very definitive notice that places a publication as the absolute reference and that all previous editions are null and void.
Or, as all too many governments use, there is a continuous publication of the latest modifications published as addendums.
The prior practice is obvious when the publication includes detailed instructions on disposing portions or all of the prior publications.
The latter practice leaves all of the publications hanging out there, forever.
Take Ar4 for example:
And
Without the IPCC ever officially cancelling their earlier predictions and claims, along with their dodgy methods of collecting and summarizing science; just which predictions are valid?
Well, that is a trick question! The answer is none of them!
None of the models are validated or certified.
None of the models have proved useful for anything beyond a few days; all else has proven purely speculation.
The obvious visual evidence of the last few years has finally caused some of the alarmists to distance themselves from the noisiest alarmist scientists with their most off the wall predictions.
Unfortunately these same scientists now distancing themselves from people like Wadhams, still include in their closed circles all of the somewhat less outlandish alarmists.
e.g. pulling arguments from a website where the denizens photo shopped their pictures into 3rd Reich uniforms.
My goodness Moshe, do you spend this much time reading and cogitating on such utter claptrap as the portfolio of fantasy climate models? I didn’t know it had gotten so bad with you. Some years ago you commanded respect. I’ve noticed you’ve gotten into a deep groove since you got into BEST. Now BEST isn’t so bad- seems as good as the rest, but the exercise seems to have enlisted you into an omnibus orthodoxy. Please try to disagree in some small way with the consensus, just to get some of your old mojo back.
This thread wins my award for missing the point. Gonzo says every reputable scientist claimed ice would be gone or nearly gone by now. Mosh posts a lengthy, definitive and I would have thought unarguable post demonstrating that most reputable scientists said no such thing. Most reputable scientists are predicting somewhere between 2030 and 2100. Charlieskeptic misses the point and talks about model speculations. Sunsettommy misses the point and claims the models are not testable. Gary Pierce, AndyG55 and angech all miss the point.
Your “most reputable scientists” base their “predictions” on speculative model “projections.”
Please, seaice1, name the “reputable scientists” and model(s) and scenario(s) used.
Average Arctic sea ice since AMO topped out in 2007
Get over it, Mosh.
http://s19.postimg.org/425r9zipf/Arctic_ice_area_trend.png
Sunsettommy September 27, 2016 at 7:52 pm
“Mosher, The above is modeling scenarios decades into the future,is non science, since these Models are NOT testable or falsifiable.”
While your comment “it is all modeling junk.” is perfectly acceptable the previous comment is a bit harsh.
Modelling scenarios into the future can be quite scientific and all models of any future are not testable or falsifiable now.
Modelling rubbish into the future like RCP8.5 and then trying hard to believe it is what a warmist does. Steven knows it is right or all his castles fall down.
Steven Mosher September 27, 2016 at 12:43 pm
“Having lost your paws in temperature, now you try to fabricate one in the arctic”
A comment worth noting for the fact that it shows a true warmist whatever other labels might be pretended from time to time.
The pause is not lost. The pause exists for all time in that 18 years interval until the El Nino contributing ocean heat created a temperature rise. The fact that it does not exist from now is different to from now 2 years ago.
Further, given a drop in temps in the next 2 years a new pause will develop. Further this new pause will incorporate the old pause and hence be 4 years longer. Tamino of all people has a nice post up on trends but does not realize this explains the pause as well.
Anyone who denies the pause existed, SM for one, is and out and out warmist, which is fine [but not very scientific].
Like saying the emperor has clothes on, he has to keep his faith up..
“Since hitting its earliest minimum extent since 1997, Arctic sea ice has been expanding at a phenomenal rate.”
______________
It’s back up to between 1.5 and 2 million square kilometres *below* the 1981-2010 average extent for the same date.
Too early to cancel ‘global warming’?
‘Global warming’s’ ticket got punched by radiosondes and satellites long ago, DWR54. Now it’s ARGO’s turn to heap soil on its grave. I’ll add the contents of my bladder.
Charlie Skeptic
“‘Global warming’s’ ticket got punched by radiosondes and satellites long ago…”
________________
It was satellites that showed that Arctic sea ice extent in 2016 was the second lowest in the instrument record, wasn’t it?
The same as it was in 2007, DWR54.
“….got punched by radiosondes and satellites long ago”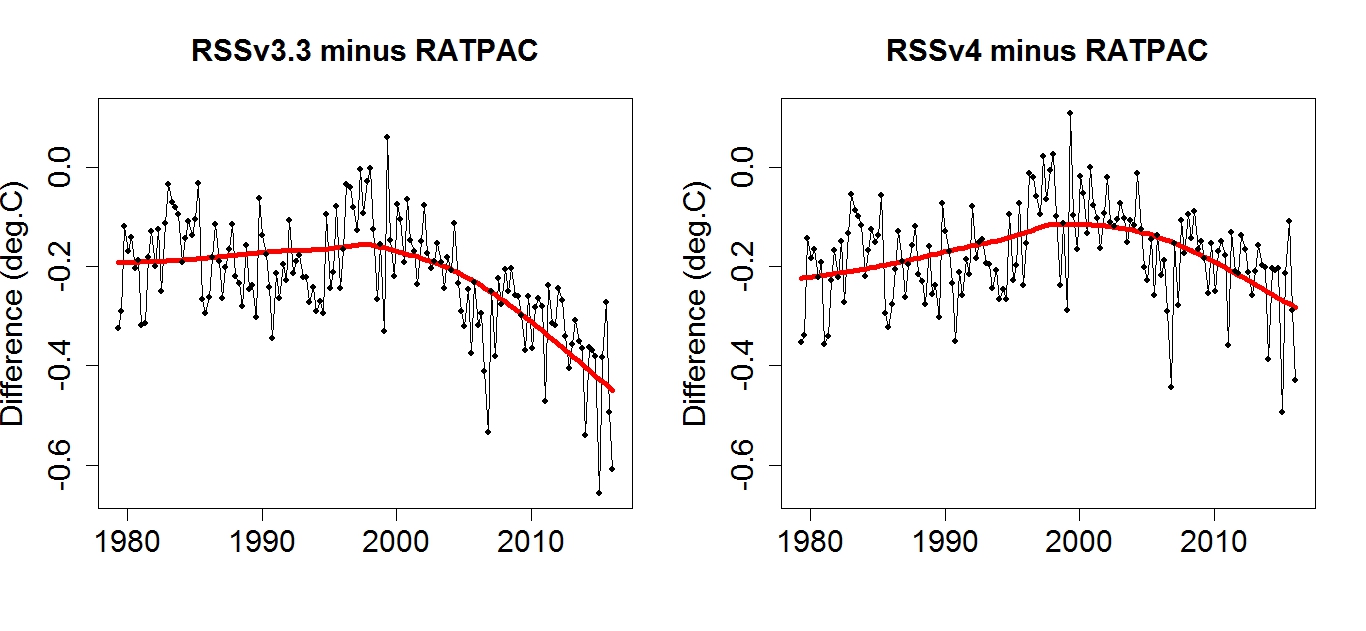

 ?w=700
Sorry – but no.
They are not consistent with each other…
Your Sat temp data does not agree with the RATPAC radiosonde group … chosen for:
See:
https://www.ncdc.noaa.gov/data-access/weather-balloon/radiosonde-atmospheric-temperature-products-accessing-climate
And the Sat data is too cold against them since a change of sensor/platform since 2000.
I’ll refer you to Nick Stokes:
https://moyhu.blogspot.co.uk/2016/01/satellite-temperature-readings-diverge.html
And, of the current UAH v6.0 Beta is still secret.
Which, as I’m sure you will agree – you would find scandalous if it were showing greater warming than the surface record and not cooler?
I thought the RATPAC quit playing Vegas years ago.
And radiosonde and satellite data are consistent with IPCC (one through five) model projections?
Wot no Griff? (or ‘Northabout’ crew for that matter, perhaps too busy filling the diesel tank)
“hitting its earliest minimum extent since 1997,”
Did you mean 2007?
Nevermind…..
Wadhams seriously runs the risk of being tagged “Crazy Wadhams”. Nobody seeks out his “expertise”. He simply emails his stuff to the Guardian periodically. I think he is at least a decade past due for his ice free Arctic. S’Truth, they still list Oxford and Cambridge as top Universities. I guess they got tagged that some time ago like Crazy Wadhams is getting set up for. I’m sure their are several Russian universities with real top billing but in this day and age of self aggrandizement in collapsing cultures, this won’t get any traction (Ozzy Centre of Excellence in Climate Science, for example which awarded the leader of the Antarctic Ship of Fools expedition a couple of years ago, who then upstaged himself by discovering frozen Adelie Penguins who, unbeknownst to him were naturally collecting dead over multidecades).
I know of a few people who are making fun of Wadhams by using his last name,by calling 1 million equals a Wadham. I am one of them to mock his supporters at another blog.
4 Wadhams means 4 Million.
He he….
…square kilometers of ice.
Thanks for that tommy… keep pushing it until it becomes common use. 🙂
Current arctic sea ice is 1.18 Wadhams above 2012 on the same date (NSIDC)
In looking at the sea ice minimum in the Arctic 2016, I found this from NSIDC:
‘During the first ten days of September this year, the Arctic lost ice at a faster than average rate. On average, the Arctic lost 34,100 square kilometers (13,200 square miles) per day compared to the 1981 to 2010 long-term average of 21,000 square kilometers (8,100 square miles) per day.’ – http://nsidc.org/news/newsroom/2016-ties-2007-second-lowest-arctic-sea-ice-minimum
Now I am no scientist but something is wrong here. You cannot achieve the growth rate reported by NOOA over September when NSIDC claim major losses. If NSIDC is correct then there are 14 days to get to the NOOA figure.
What’s going on here? Can some smartie pants please explain.
Here are the net changes from Sept 1 to Sept 26 for the last 10 years (from NSIDC)
2007 -0.252
2008 -0.175
2009 0.028
2010 -0.126
2011 0.185
2012 0.087
2013 0.111
2014 -0.012
2015 0.449
2016 0.528
2016 bottomed out early and is growing fast.
Just updating with most recent September to date, net growth
2007 -0.239
2008 -0.099
2009 0.126
2010 -0.071
2011 0.18
2012 0.162
2013 0.113
2014 -0.003
2015 0.458
2016 0.638
Man, look at that sea ice GROW. !!!!
Now over 5 Wadhams (NSIDC)
So a fantasist and conspiracy theorist is the “leading expert on Arctic Ice”. Tells you everything you need to know about the Guardian as a serious source.
“You cannot achieve the growth rate reported by NOOA over September when NSIDC claim major losses.”
_______________
There’s no contradiction. Your NSIDC quote refers to conditions between the 1st – 10th September. The NOAA figure refers to conditions from 1st to 24th. The ice reached its minimum extent relatively early this September, meaning that there has been plenty of time for it to expand again.
Article says “the three previous tears”. Should that read “the three previous years”?
Obvious Freudian slip – it’s that “little bitty tear” that let them down:
Anthony, Paul,
Great presentation of the data. I have been watching the Aris for weeks and sending emails to my contacts. This data presentation is by far the best!
Arctic not Aris
I like watching Sci-Fi movies, esp the older ones from the 50’s, 60’s and 70’s. For a laugh, and to watch something different, I searched for “Soylent Green” made in 1972 with Charlton Heston, a classic doom mongering film. Set in the year 2020, greenhouse gases, heat waves every day of the year, no food, oil or power. Only one tree sanctuary left. 40,000,000 people in New York. Anyway, there is a book dated 2015 – 2019 about the state of the oceans, because Soylent Green was supposed to be made from plankton from the ocean. The oceans are barren. And then the truth is discovered; Soylent Green is People!
All of the predictions about climate doom have failed. Every single one! 2015 was a pretty good year for food production, and 2016 is looking to beat 2015. The world is not boiling hot, the oceans are still there and productive, the ice is still there, not melting away like predictions suggest. The environment is clean.
How AGW works:
Ignore pre-1970’s warming trends.
Assume 1970’s through 1990’s warming trend is caused by man.
Model 1970’s through 1990’s warming trend to continue indefinitely.
Guess that “projected” temperatures will cause all sorts of bad things.
Stir up the rubes.
Charlie Skeptic
Ignore pre 1940s warming trends.
Ignore 1940 to 1970 cooling trend, and adjust data to get rid of this inconvenient fact.
Ignore the tree ring data that shows no significant warming post 1940 and, instead, splice a on the adjusted thermometer record to produce hockey sticks.
Hope that public do not appreciate that there is no correlation either in the land based thermometer record, the satellite data, or ice core data between CO2 and temperature, and ignore the proxy data that suggests that CO2 lags temperature changes and does not drive those changes.
Follow the remainder of your recipe. A recipe for disaster.
Cook on a high over and claim that the planet has a fever even though it is in an ice age (but fortunately for us in the relative mild conditions of an inter glacial).
Cobblers …

omg! look at that hockey stick! it’s unprecedented and robust!
Anyone have the links to these graphs … I looked a while ago and just couldn’t find them. I especially like the top graph.
Thanks.
The data is here. Same stuff, just different shampoo. Says Excel on the bottle …
https://www.youtube.com/watch?v=o6rBK0BqL2w
Thanks for the truth! There is nothing scientific about environmentalism consensus.
Mods:
Typo Alert!
Four lines above ‘Figure 2’.
My assumption is that the author meant years, but used my fingers.
The story of the above comments, Mr. Mosher: There is always another guy with his own weed patch. Beware sweeping conclusions based on your wandering in your own weed patch.
Exactly what is inconvenient about this?
The sea ice starts refreezing in September.
It is the extent and area etc at the minimum which is most important – this year second lowest in the record, lower, just, than 2007, with the ice in a worse state than 2007.
You may note there was a heck of a lot of open water near the Pole to refreeze…
You are apparently going to ignore this inconvenient fact,
“This years minimum was reached on day 254 (September 10th) of the year (nothing unusual). The minimum ice extent was also nothing unusual at 4.1 million km2, not the lowest and about the same as 2007. Some media reports portrayed this as the second lowest (behind the anomalous year of 2012) and mentioned its comparison with 2007 without making the obvious comment that it was curious in these days of much talk of rapid ice decline in the Arctic that the minimum extent was the same as it was 9 years ago!”
Since 2007, there has been NO sea ice decline.
“Since 2007, there has been NO sea ice decline.”
But there has in maximum extent……
http://greatwhitecon.info/wp-content/uploads/2016/04/CT-Max-2016-Final.png
And this is a more certain indicator of AGW at work as it has it’s greatest effect in raising min temps. At night, yes? The long Arctic night, Yes?
Glad you’re with me (sarc)
Can I remind of the science that has shown that the summer melt season is senistive to early warmth and the formation of melt ponds. And therefore the summermelt season is not only much more dependnd on the seasons weather than that of winter, it is also uniquely sensitive to the weather in the eary part of it.
It’s about the albedo you see.
http://sci-hub.bz/10.1016/j.cnsns.2014.09.003
In a decade we’ve had two years lower than 2007 and 2015 not far off it… and that’s just extent…
Go here and look at the extent from 1979 to 2006 compared with today and tell me that there hasn’t been a step change in the arctic ice state…
http://nsidc.org/arcticseaicenews/charctic-interactive-sea-ice-graph/
And you ignore area, age, mass, thickness changes.
Its like saying there has been no change in the amount of darkness between 1 am and 2 am… when the point is, its dark now…
Yeah Griff, it’s dark at my house at 5:28am too, big deal.
looking at trends in circumpolar water temps in the top 1500m i would not bet on the extent trends for both winter and summer continuing . it’s getting a bit chilly up there 😉
Latest
September to date, net growth
2007 -0.239
2008 -0.099
2009 0.126
2010 -0.071
2011 0.18
2012 0.162
2013 0.113
2014 -0.003
2015 0.458
2016 0.638
Man, look at that sea ice GROW. !!!!
Now over 5 Wadhams (NSIDC)
And NO, the Minimum is a transient short term event, the AVERAGE is far more important.
http://s19.postimg.org/425r9zipf/Arctic_ice_area_trend.png
AndyG55 September 28, 2016 at 2:53 am
And NO, the Minimum is a transient short term event, the AVERAGE is far more important.
Really, well this year is on target to have the lowest average Arctic extent in the satellite record.
Griff, please explain why the minimum is the most important. Who gets to decide?
It is the point at which the (current state of the) decline shows most clearly…
It will for decades/centuries freeze over each winter, even when we reach the ice free summer state…
There is nothing to be shown about the health or otherwise of the ice by the expected September refreeze.
Griff,who has been shown a few science papers at another blog,that for long periods of time in the early Holocene,there were little to no summer ice.
He simply doesn’t want to learn, that the ecosystem survived intact through all that, while CO2 hovered around the 260 ppm level.
Compare it to a reservoir that fills up each winter and empties to varying extents during summer. If you wanted to monitor changing conditions of water usage and rainfall, you could use the winter levels which are always full, but they would tell you nothing. Or you could measure the lowest summer level, which would tell you a lot.
seaice1, you are so far wrong on your reservoir analogy that I am not going to spend the time correcting your misconceptions.
Suffice it to say, I was responsible for supervising the water and power operations studies of a major Federal hydroelectric system in the West. Like for Arctic ice, you exhibit no understanding of the complexities involved. Or simply choose to ignore them.
Charlie Skeptic.
What Griff and seaice1 don’t grasp is that summer ice in the Arctic is a new phenomenon, perhaps even all year. We know redwoods grew at the Arctic circle, can’t imagine much ice then.
Dr Peter Wadhams – ‘leading expert on Arctic sea ice’ – predicted in 2012 that all the sea ice would be gone ‘within four years’…
Well, here we are,Doctor – four years later – and the Arctic ice is doing what its always done – thawing in the summer, and then freezing again (this year rather quickly)….
So – your explanation is…?
(I used to live in Cambridge – where they replaced a perfectly good cycle lane with – er – another, more expensive, cycle lane….)
“Since hitting its earliest minimum extent since 1997, Arctic sea ice has been expanding at a phenomenal rate. Already it is greater than at the same date in 2007, 2008, 2010, 2011, 2012 and 2015. Put another way, it is the fourth highest extent in the last ten years. Even more remarkably, ice growth since the start of the month is actually the greatest on record, since daily figures started to be kept in 1987”
You have to be kidding me. Arctic sea ice is one of the clearest indicators of global warming. For most of the year extent was 1st, 2nd or 3rd lowest in the record and nothing from this site was said.
As soon as there is any chance to mention a narrative on Arctic sea ice that looks like the opposite of what is clear to the dimmest dunce WUWT pounces on it. And this is purely about weather, not climate. The 4th highest extent in the last 10 years? Also the 6th lowest extent in the last 38 years. C’mon, people. Are we trying to spin ‘recovery!’ again? It happens every year, ya know.
This breathless announcement looks more like desperation than innocent excitement, and in the context of near-silence for the rest of the year that extent was tracking very low, the one-sided opportunism is patent. I know some semblance of neutrality is too much to ask for, but does it have to be so witlessly obvious?
And CAGWers swooning breathlessly over every bad weather event isn’t desperation, barry?
Tacit agreement with the criticism: noted. Witless partisanship is always annoying or boring.
I wonder if those who claim the reduction trend in sea ice is and illusion, or not a problem, would feel the same way if it were their money being managed by an investor showing the same trend.
Quite frankly the article is laughable, it displays a complete lack of understanding in relation to Arctic sea ice extent. There is great variability from day to day. The important dates for sea ice extent are April and September when the maximum and minimum sea ice extents are established. But, sea ice volume is another matter, the volume of sea ice in 1979 was 12,700 km3, for 2015 it was 5,700 km3, the provisional volume for 2016 is 4,400 km3 rounded up. In other words since 1979 around 12,000 km3 of volume has been lost. That’s rounding up to a very conservative figure.
Freezing has been quick which means that the little multi year ice left has not compacted into larger and thicker areas.
and,
if I may ask
how exactly did you measure the sea ice volume/?
Henry,
By satellite, PIOMASS
But, to suggest that there is to be a huge rebound for 2017 is like using a crystal ball to come up with a prediction. There can be changes up or down of 10 km2 or even 100,000 km2 of sea ice extent from one day to the next. The trend lines for loss sea ice by volume and extent have been going down since 1979.
It won’t be until 11 months have elapsed that we will know what the minimum sea ice extent will be.
How is it measured?
How is “the volume” of antarctic ice doing?
@Robert
I note that you are not answering me on how much “volume” of ice is lost in the Antarctic?
Could it be because the volume of Antarctic ice is increasing?
Looking at global maxima and minima, I find that earth is cooling.
The solar cycle related to this, Gleissberg, is in fact 86.5 years.
http://www.nonlin-processes-geophys.net/17/585/2010/npg-17-585-2010.html
So, looking at the sun, our climate is in like it was in 1930.
Two more years you have
http://ocp.ldeo.columbia.edu/res/div/ocp/drought/dust_storms.shtml
Go south, young man, go south.
or, you could also say,
the weather now is like it was in 1843
http://www.buffalofieldcampaign.org/habitat/documents2/Woodhouse.pdf
two more years to go before the big drought times.
Go, go south young man
go south.
I hate to say this but none of the participants to this Arctic review knows anything about the Arctic. I have already written two comments to straighten out peoples’ Arctic views this week and am getting tired of it. Your basic problem is that you are non-readers. None of you bothered to read my 2011 article in Energy and Environment, volume 22, issue 8. But you are not alone – the “experts” also are screwed up. Below I will go over Arctic history one more time but recommend that you read the article itself for more.
Starting from the beginning, Kaufman et al. [1] studied Arctic history by analyzing sediments in small circum-Arctic lakes. They determined that for the last 2000 years there was nothing notable there except for a slow, linear cooling. But this changed at the turn of the twentieth century when an unexpected heat wave arrived. It caused melting but was soon interrupted by a thirty-year cold spell in midcentury. This lasted from 1940 to 1970, after which warming returned. It is this late warming phase that everybody has been reporting on. It starts in the seventies and no one has any idea of what happened before. Global warming theory based on the greenhouse effect predicts that the Arctic should warm faster than the rest of the glob does. But when models are used to calculate this difference it turns out that the actual warming is twice as fast as predicted by rhe greenhouse effect. To try to resolve this difference the “Arctic amplification” idea was suggested. It predicts that once the ice has melted the darker ocean exposed absorbs more sunlight and speeds up warming. Polyakoff et al. [3] even attempted to discover this Arctic amplification directly but were unsuccessful. As David Whitehouse demonstrates graphically, Arctic warming by 2015 could be traced back for 36 years of steady, linear warming. At the same time atmospheric carbon dioxide increased by 20 percent. .If one was being “strict,” he says, using data based only on the arctic ice and CO2 information, one would have to conclude that there is no correlation between Arctic sea ice extent and atmospheric CO2 levels! But he rejects and wanders off course looking for some alternate explanation which he never finds. He is an examp;e of someone brainwashed into disbelieving that carbon dioxide can ever fail to produce its vaunted greenhouse effect. And when he stumbles onto clear proof that Arctic warming cannot be greenhouse warming he does not know what to do and simply rejects the logic of science staring him in the face. He is not alone – there are thousands of scientifically trained people writing for the climate change movement who also fail to understand the logic of science and end up spouting pseudo-science. In the Arctic warming case the greenhouse theory is out and we need an alternate theory. There are not many choices and I found only one of them that fits: a sudden rearrangement of North Atlantic current system that caused the northward flow of the Gulf Stream to more directly enter the Arctic Ocean. Its cause is unknown and I suggest using some of the 2.6 billion dollars we spend for climate research to find out what is going on. I bet there is more than just ocean circulation involved. There is no doubt now that warn Atlantic water entering the Arctic Ocean is causing the warming. Spielhagen et al. [2] made an Arctic expedition and reported in 2011 that they had made direct measurements of the temperature of Atlantic water flowing into the Arctic. It’s temperature, they say, exceeded anything seen in the Arctic before this. That takes care of that but the mid-century cold wave needs an explanation. It is shown as figure 2 in my paper (Also as figure 20 in “What Warming”) [4, 5]. The most likely cause of it is a temporary return of the original Atlantic flow pattern. It is not out of the question that natire may send us another such cold wave, or, worse yet, bring back the original flow pattern for good. The mid-century cold wave may also have wider influence, not confined to the Arctic. As figure 2 shows its starting point is the year 1940. Looking at NOAA global temperature chart we notice that it shows a warming period ending in 1940. The early forties that follow are shown as a warm peak. But this is wrong because that was the time of World War 2. It was fought in bone-chilling cold. As an example, the opening battle of the Finnish Winter War in January 1940 was fought in minus 40 Celsius and one meter of snow. German troops under Moscow in 1941 froze to death in their trenches and even the Battle of the Bulge in 1944/45 was fought bin unusual cold. NOAA does show cooling but just after the war ends. I propose moving it back to `940 where it belongs. And when this is done we find that the start of WWII cold wave coincides with the mid-twentieth century cold wave in the Arctic. According to NOAA chart the global temperature never reached the peak it had in 1940 until about 1980. The Arctic cold spell ended in 1970 when current warming begins. Allowing for some lag see distinct parallels between the Arctic temperature history and comparable NOAA global temperatures that could profitably be investigated using Uncle Sam’ billions intended for climate research.
[1] Darrell S. Kaufman, David P. Schneider, Nicholas McKay, Caspar M.
Ammann, Raymond S. Bradley, Keith R. Briffa, Jonathan T. Overpeck, Bo M. Vinther, Arctic Lakes 2K Project members, “Recent warming Reverses Long-Term Arctic Cooling” Science 325:1236-1239 (4 September 2009)
[2] Robert F. Spielhagen, Kirstin Werner, Steffen Aagaard Sorensen,
Katarzina Zamelczyc, Evgenia Kandiano, Gereon Budeus, Katrine Husum, Thomas M. Marchitto, & Morten Hald, “Enhanced Modern Heat Transfer to the Arctic by Warm Atlantic Water” Science, 331:450-453 (28 January 2011)
[3] I.G. Polyakov et al “Observationally based assessment of polar amplification
of global warming” Geophys Res. Lett. 29:1878
[4] Arno Arrak, “Arctic Warming is not Greenhouse Warming”
E&E 22(8):269-283 (2011)
[5] Arno Arrak, “What Warming?” (CreateSpace 2010)
all true
and
correct
but global T is still falling
as determined by myself and Gleissberg & others
The interesting part is that we seem to be cooling from the top latitudes downward….
Hence most people have not yet even noticed it
although last winter around Chicago did look a bit cooler than usual?