At WUWT, we’ve gotten several tips about the XKCD cartoon that makes yet another “hockey stick” out of climate over recorded history. Nylo comments on WUWT Tips and Notes:
Marcott 2013 is still alive! Last to resurrect it is XKCD
Note the references vertically written on the right:

You can view it here: http://xkcd.com/1732/
Two things that make Josh’s take on it better (besides his superior artistic skills):
- The sources used are not just pro climate change like XKCD did
- It is factually correct, rather than illustrating a preferred narrative.
Here is is: prepare to scroll. Some people with lame un-updated operating systems, low RAM, and/or outdated browsers may not be able to see the entire thing.

The reference to Marcott http://climateaudit.org/?s=marcott
Top tip: Visit CartoonsbyJosh and give him a donation.
UPDATE: Chart corrected as per comments – the earlier version was posted before I had a chance to update. Any other comments and corrections are very welcome!
Wonderful!
Wonderful enough that I couldn’t resist a hit to the Josh Tip Jar!
No it’s not. The solid line is fake.
Is that an end of the pier reviewed cartoon?
Well, it’s the wrong weather for fishing (and a weekday besides), so it has not been pier-reviewed by me at least.
Okay I know it’s a cartoon but I want just one nitpick, meltwater pulse 1A at about 13,500-14,000 years ago should show a huge warming and probably something written on the side like sea levels were rising 30-60 times faster than today.
Loved Josh’s cartoon and even liked the XKCD original, but had a similar thought. It would be great if a similar cartoon was made to show sea level rise through time and compare present day sea levels to those of the LGM. I think people’s minds open up when they actually have an opportunity to put things in perspective.
Me too, I like Josh´s and I also liked the XKCD, except the northern passage and current path bits, The 2000 to 2016 period is totally wrong. Without that he could not have drawn the “current path” extrapolation. That is why he drew the 2000 to 2016 period that way.
Anyway, todays XKCD cartoon is also very interesting. It is entitled Fashion Police and Grammar Police, ( http://xkcd.com/1735/ ) Randall points out that both types of groups are esentially the same. I would add the Climate Police as a group, which are also judgemental, smug, and everything Randall says about Fashion and Grammar police. A pity he does not realize about that. I guess you have to be outside the herd to realize that the Climate Police is as bad as the Grammar or Fashion Police.
Oh, and talking about Grammar, or something, it is not “(Christopher) Columbus” The name written in the historical documents about the first voyage to America is Cristoval Colón.
Me too! Great idea and please do send me any info/links you think would be useful.
I am sure ‘evil’ Exxon would oblige with their latest sea level curve which they use for sedimentary studies.
Josh,
I know it’s “only” wikipedia, but here’s one to start (I hope, if it links correctly).
https://en.wikipedia.org/wiki/Sea_level_rise
You may have already seen this, but the two graphs on the right of the page I think says it all. the top is recent (last 200 years or so) and shows about 10 inches of SL rise, while the bottom one is past 20k years or so, and shows about 140m SL rise, with about a 60m rise (Mark I eyeball) since younger Dryas.
urederra,
Cristoval (Cristobal) Colón has a plaza and statue in San Juan, PR (just an historical side note).
Ure,
Depends. Las Casas uses his Italian name, ie Cristoforo Colombo, in his notes on the Journal. In Castillian, it’s Cristóbal Colón; Portuguese Cristóvão Colombo; Latin: Christophorus Columbus and Catalan, I don’t know, but some have suspected him of actually being Catalonian, not Italian, ie Genovese. As you know, “b” and “v” can be and often are interchanged in Spanish orthography, although these days there is a standard.
@ Gabro and Phil
Thanks for the info. 🙂
Well, if we’re going to nitpick, there is no actual evidence ‘Jesus Christ’ was born.
There is actually.
Whoever or whatever he may have been, divine-wise, there is ample evidence that he existed.
There is however good evidence from hostile pagan 1st century sources, such as Tacitus, generally considered authentic, that a Jewish preacher called Christus or Chrestus by his followers, was executed under Pontius Pilate.
Actually, the Tacitus passage is rather doubtful. Even if Tacitus actually wrote it, it looks like he is simply repeating second-hand information.
“Chrestus” is the name Suetonius gives to a Jew who instigated Jewish riots in Rome. He also refers to “Christians” (with an ‘i’) as a “mischievous superstition”, but seems to differentiate them from Jews.
Interestingly, in the earliest (11C?) manuscript of Tacitus that we have, the original scribe might have written “Chrestianos”.
http://www.textexcavation.com/documents/zaratacituschrestianos.pdf
However, we know that both early and mediaeval Christians were much given to forgery, so we cannot put too much trust in texts that have passed through their hands.
Josephus knew otherwise. Seems some people also want to use wuwt to push OT nastiness.
RoHa,
The consensus of classical scholars is that Tacitus’ comments were by him and not forged by Medieval copyists. It’s possible that one ms has the “e” changed to an “i”, but there is also abundant evidence that Christians were originally called Chrestians.
And Tacitus isn’t the only near-contemporary source. There is more evidence for the existence of a “Christ” in 1st century Palestine than for many other contemporary figures accepted as genuine.
Brett,
The scholarly consensus, if not indeed unanimous conclusion, is that the Jesus in Josephus isn’t the Jesus whose followers called the Christ.
His text also shows signs of having been tampered with by Medieval Christian scribes.
Scholarly consensus changes with the tides. The Tacitus passage may, indeed, be genuine, but, if so, it seems unlikely Tacitus was reporting anything more than hearsay.
As for “more evidence for the existence of a “Christ” in 1st century Palestine than for many other contemporary figures accepted as genuine”, I would love to see it.
Josephus mentions a lot of people called Jesus. The one in the Testamonium Flavianum is pretty clearly the Jesus of Christianity, but is almost certainly partly, and possibly wholly, a later forgery.
Some discussion here.
http://www.earlychristianwritings.com/testimonium.html
I have no firm idea on whether Jesus existed or not. After a great deal of study of the question, I do have a firmish idea that, in view of the mass of fiction, forgery, and document tampering by early and mediaeval Christians, no firm idea about the existence of Jesus can be justified.
Amen to that, RoHa.
As I said, no actual evidence, Brett (and others), I was merely responding to a point in the cartoon as though it is fact. It isn’t. No matter what your beliefs (note the word), if something isn’t a fact, it isn’t a fact. The climate debate is such because there are few facts, and little or no evidence at all for the principle theory of AGW. Feedbacks are largely mysterious, and we rely on the opinions of experts to try and figure them out. There are some things that are factual, and some that are not. Despite what any of us believe, we MUST always go by what is really factual, and not what is merely hearsay with nothing substantial to back it up. If we start down the path of stating something as ‘fact’ when we don’t actually know that for anywhere near certainty, then we end up in the grotesque chaos of accepting anything as fact on very little or no evidence. There is no actual evidence Jesus Christ was ever born. Regrettable for many across the world, but that’s how it is. Deal with it, just like those who ‘believe’ that AGW is true have to deal with the fact that there is no convincing scientific evidence for it. If there were, this website wouldn’t exist.
Gabro – we are not entirely sure that the references are original – manuscripts we have were copied and sometimes improved after the empire became Christian
Which scholars dispute Josphesus was talking about Christ? Most think the parts saying he was Messiah were forged, but the rest are authentic.
Also, not looking at the New Testament as evidence is utterly bankrupt methodology. Scholarly consensus is absolutely, 100% that Jesus, the one called Christ, was a real human being, and his followers were the first Christians, and that the gospels are at the very least roughly accurate to his time with his disciples.
Even Bart Ehrman, who proudly proclaims himself as a former Christian affirms such. Only the wacko Jesus Seminar types, or Jesus mythicists like Gerald Massey and his modern Zeitgeist zombies, and clueless Atheists deny that Jesus existed.
If you want to apply your same standards of historicity to every other figure from antiquity, you will end up discarding a massive amount of history. Not because Jesus’s existence is so tenuous, but because so many other people are much, much more tenuous. Jesus is well-attested. I’m sorry that your dogmatic Atheism can’t handle a religious figure being a real person.
Also, Antarctic cores show even the end of the Last Glacial Maximum (c. 18 Ka) still colder than the Younger Dryas, let alone its depths (c. 20-22 Ka).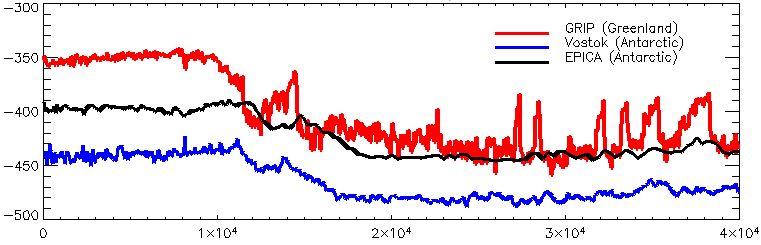
During the LGM, tropical Brazil was ~5 degrees C. cooler than AD 1995:
https://www.researchgate.net/publication/5999846_Cooling_of_Tropical_Brazil_5C_During_the_Last_Glacial_Maximum
Correct. Younger Dryas temperatures were intermediate between LGM and Holocene. There is a problem with 18O in Greenland cores. That data is not supported by data elsewhere and by sea levels.
http://i1039.photobucket.com/albums/a475/Knownuthing/chinavsgreenland_zps0ol40v1k.gif
Who on earth was Dryas? Was there an elder Dryas, as well as a younger one? Where is the Wetas period?
The coming and the going of the Younger Dryas could have caused a greater temperature change around Greenland than in China or Antarctica, due to regional high positive feedback from change of ice/snow cover.
Another nitpick.
14,000BP – rice cultivated in China
13,000BP – agriculture started
Doesn’t cultivation of rice count as agriculture?
And another. “Phonetic alphabet”, not “phoenetic”.
“Doesn’t cultivation of rice count as agriculture?”
What’s going on is that hunter gatherers were probably spreading edible plants like rice around suitable places well before they farmed it – which is a very primitive form of cultivation. This probably was good enough to create evolutionary selection pressure for more productive rice. At some combination of rice nutrition and technology development, it would have made more sense from the effort point of view to stay put and farm rice at good locations rather than merely spread it around.
North American First Nations people on the edge of the ice sheet were harvesting rice a very long time ago from the shallow shores of lakes where it grows naturally. Is that agriculture? Is there some interpretation of agriculture where ‘plenty’ is harvested and stored for long periods? I would think that ‘helping it’ by casting some around in places where it didn’t occur naturally would qualify.
Some places like Central Java which, though highly populated, look like wild tropical jungle but are in fact managed like an enormous permaculture garden with very long timelines the norm. I doubt we can detect when agriculture started or where. Ploughing, maybe.
If you live somewhere that doesn’t require accumulation and storage of food farming can be well hidden. Among the Orang Asli (Malaysia) some trees are and were owned and managed by the owner even though they simply stood in a forest without no conventional boundaries around them. In southern Nigeria there are trees that are owned by people who don’t live near them, even on other people’s land. Orchards are farms, even if they are spread out.
Maybe we should ask them how their ancestors developed this form of food-finding.
Very Nice! There is a typo at 17,500 BP…. temepratures
Great catch. Temepratures don’t appear until circa 14,300.
Yes, it should be tamperatures (sic).
i lolled.
nothing like a good pun to greet the day
🙂
Thanks. Will correct and update.
so is Randall Monroe honest enough to correct his post and admit his error to his readership, or will he stick his fingers in his ears and say “nyaa nyaa nyaa”?
I posted this link in another thread, but it’s applicable to this article:
William Briggs’ take-down of the original xkcd cartoon…
https://stream.org/xkcds-global-warming-time-series-mistakes/
“The xkcd post (…) entitled “A Timeline Of Earth’s Average Temperature” makes a slew of fun errors, but — and I want to emphasize this — it isn’t xkcd’s fault. The picture he shows is the result of the way temperature and proxy data are handled by most of the climatological community. Mr. Munroe, the xkcd cartoonist, is repeating what he has learned from experts, and repeating things from experts when you yourself don’t know the subject is a rational thing to do.”
That argument has justified everything from the sacrificing of virgins to Quetzalcoatl to discarding Impressionist paintings.
Experts aren’t right because they are experts. They are right only because they know about the subject. And if they can’t explain why they are right when others dispute their opinion then they aren’t really experts.
Just accepting the expertise without trying to understand how it was derived… that’s ‘just following orders’.
Not acceptable.
And if they can’t explain why they are right when others dispute their opinion then they aren’t really experts.
If Wegener only knew!
Well, there is also this thing called critical thinking, which is something that any rational person must have. And if after drawing a cartoon showing how the Earth temperature has changed during the last 22000 years he still thinks that the temperature change during the last 100 years is 100 % due to mankind then he does not practice much critical thinking.
… or maybe he wants to jump into the Global Warming gravy train.
More important than Critical Thinking is following the Scientific Method, always. That means, always examining new data to falsify your current hypothesis – and changing that hypothesis based on new data.
He does point out that temperature spikes are damped out by the proxy data, then fails to connect the dot that the current jump (such as it is) may be merely a repeat of previous spikes of largely unknown origin.
The most egregious, which everyone seems to ignore, is there there is no meaningful average global temperature. So the whole exercise is just a flight of fancy.
Temepratures?
A Temeprature is the inverse of a semipraline. Don’t you know anything?
I always misspell Etipoa.
I think you mean ‘utopia’.
Tamperatures?
Some interesting history is that the UK’s Met took down an article after Marcott had to publicly admit what they claimed about recent warming was not true.
Article removed
We previously posted an article entitled “New analysis suggests the Earth is warming at a rate unprecedented for 11,300 years” covering the paper by Marcott et al in Nature. The title of our article drew on the original press release for the paper. However, we note that authors of the paper have since issued an extensive response to media coverage [http://www.realclimate.org/index.php/archives/2013/03/response-by-marcott-et-al/] which includes the following statement:
Q: Is the rate of global temperature rise over the last 100 years faster than at any time during the past 11,300 years?
A: Our study did not directly address this question because the paleotemperature records used in our study have a temporal resolution of ~120 years on average, which precludes us from examining variations in rates of change occurring within a century. Other factors also contribute to smoothing the proxy temperature signals contained in many of the records we used, such as organisms burrowing through deep-sea mud, and chronological uncertainties in the proxy records that tend to smooth the signals when compositing them into a globally averaged reconstruction. We showed that no temperature variability is preserved in our reconstruction at cycles shorter than 300 years, 50% is preserved at 1000-year time scales, and nearly all is preserved at 2000-year periods and longer. Our Monte-Carlo analysis accounts for these sources of uncertainty to yield a robust (albeit smoothed) global record. Any small “upticks” or “downticks” in temperature that last less than several hundred years in our compilation of paleoclimate data are probably not robust, as stated in the paper.
In the light of this statement from the authors, we no longer consider our headline to be appropriate.
http://www.myclimateandme.com/2013/03/12/new-analysis-suggests-the-earth-is-warming-at-a-rate-unprecedented-for-11300-years/#comments
Link does not go where the name would imply.
You’re absolutely right! Looks like myclimateandme gave up the ghost at some point. However, in support of Don B’s post, I just happen to have two posts on the Marcott matter, so all is not lost. Although the UK Met Office – aka “the jewel in the crown of British science and global science” – was indisputably the “parent” of this now apparently defunct site.
I had documented (with screen captures!) the various and sundry very slow moving machinations, incarnations and eventual disappearance of this particular tortured travesty which had been foisted on the blogosphere circa March 12, 2013
For those who might be interested …
Questions for a “jewel in the crown” of U.K. (and global) science
and
BREAKING: No comment will be heard from “jewel in the crown” … alarmist headline intact
By strange coincidence, the first of these two posts happens to begin with a brief discussion of the eventually retracted – and more recently revived – PAGES2K paper authored by a cast of 70+
But all of the above aside … my hat’s off to Josh for yet another fabulous cartoon:-)
I copied that link from correspondence which is now 3 years old – it worked then! For a possible explanation, go here:
https://hro001.wordpress.com/2013/04/26/breaking-no-comment-will-be-heard-from-jewel-in-the-crown-alarmist-headline-intact/
somebody doesnt want us to see that ref – I am not interested in Miami cleaning services – which has no relevance to the pathway above…..tampering again maybe? Destroying the evidence – always such a good argument (sarc)
Did you’all notice the anomaly base period? 1961-1990.
1961-1990 average is the zero line for the XKCD version. In the Josh version, the zero line is the 1700-1800 average.
Except for the last 200 years and only in parts of Europe and North America, we have only proxy records. The chief two most important are the changing shorelines as the oceans rise or fall depending on ice levels and the marks glaciers make when the grow and retreat. There are no ‘degree’ data at all. Just proxies.
So any graph or chart is very much ‘guesstimates’ rather than hard, cold numbers. But the fact that glaciers were far greater in size and reach at various intervals is most important because the chances of this happening again is highly likely.
I pointed out over at /r/dataisbeautiful that XKCD’s own legend about spurious numbers negates the validity of the chart showing the warming dashes at the end. People didn’t like that.
/r/worldnews is filled with editorials about warming destroying things when editorials aren’t allowed.
Yes, indeed, climate has changed in the past.
“The ice cores (Alley 2000) show that over 100,000 years there were more than two dozen reversals like that of the Younger Dryas, with very rapid changes of at least 18 degrees Fahrenheit (10 degrees Celsius) from warm to cold and cold to warm.”
“Twilight of the Mammoths” by Paul S. Martin, paperback page 170
Lose the references to Christ. No matter what your faith (or lack thereof), I guaran-damn-tee that the pro-AGW crowd will point to this and use it to equate Josh with bible-thumping evolution-haters who think the flat Earth is only six thousand years old. Do not give them that harbor.
Well the fact is that the birth of Christ is a point in history, used in many many climate science and many other scholarly articles where they cite anno Domini or A.D. and B.C.
Ref: https://en.wikipedia.org/wiki/Anno_Domini
So, unless they are prepared to wipe Wikipedia clean of it, history clean of it, and science clean of it, I think we are perfectly safe and justified in using it. And quite frankly, who cares if some wackadoodles like Sou (Miriam O’Brien) or Joe Romm get upset about it? Point them to the religious based writings of 350.org’s Bill McKibben and suggest they either condemn him too [or] kindly STFU.
How about CACCA-advocate Katherine Hayhoe’s husband, a minister of the gospel:
http://www1.cbn.com/cbnnews/healthscience/2015/July/Most-US-Kids-Dont-Meet-Fitness-Standards
..Plus 500 Gold Stars…
There is no year zero. One BCE and one CE are the same 365 days. The period between jan 1, 100 BCE and jan 1, 2 CE is 100 years.
“There is no year zero.”
I’m not so sure. No-one from that period is left alive to deny or confirm this.
ShrNfr September 20, 2016 at 3:03 pm
“There is no year zero. One BCE and one CE are the same 365 days.”
Your statement that there is no year zero is correct, but that does not mean that one BCE and one CE are the same 365 days.
It means that one BCE immediately precedes one CE without any year in between.
SR
Also, please see my comment on the historicity of the Jewish religious figure from Roman Syria-Palestine revered by the earliest Christians.
A person we now call ‘Jesus’ certainly existed. It is unlikely he did all the things that are now attributed to him, but there certainly was a sage around that time – we have multiple accounts from people close to eyewitnesses.
What is even more fascinating is that the Mohammed of Islam is mostly mythological and the claims made by Islam about its origin do not match the archeological evidence – yet very, very few people in the West understand this (which is why I’m posting it here, I think it will be of interest to you and several other fact-based WUWT readers).
“An Historical Critique of Islam’s Beginnings – Jay Smith”
I find it interesting that only the Christians seem to be paying attention to the scholarship. As an atheist I feel that far to many of my fellow atheists are as smug as the global-warming crowd in not checking the facts about Islam (which is a thoroughly evil totalitarian ideology designed to advance Arab Imperialism for the benefit of a ‘Caliph’). So I think atheists can benefit from the video from a Christian apologist as well as the Christians here – because the data (satellite imagery showing Islam is false and fictional) are the data.
Moa, et al: before commenting on the historicity of Jesus, you might want to check your facts.
Start here:
http://issuesetc.org/tag/historical-jesus/
http://issuesetc.org/tag/evidential-apologetics/
Moa, nothing that humans do is ever “totally” good or evil. Maybe you mean to imply that Muslims are, I dunno, some sort of supernatural beings? To call other humans “totally” evil is known in psychological circles as “projection”, a refusal to acknowledge our own dark sides.
Moa
September 20, 2016 at 3:03 pm
IMO the Jesus who served as the center of Paul’s new religion did exist. Of course all the stories in the NT about him are not factual.
But at least the OT and NT have more validity than the fantastic novels made up (and ripped off in Cliff’s Notes version of the Bible, in the Arabic case) by those scamming, fiction-writing scoundrels Mohamed (who did exist, however at variance with his legend) and Joseph Smith.
Moa, you cannot say “A person we now call ‘Jesus’ certainly existed” with any validity at all…none at all. Or else I can say Elvis is certainly still alive. Nonsensical.
I think the star gazing wise men are entirely appropriate 😉
Right — it was brilliant (no pun intended)!
Josh, did you know that the Bible doesn’t say there were three wise men? It says “There came wise men from the east”. Not once does it say there were three! Another twisted little story in the whole sorry fabrication. It’s funny how even Christians repeat this fallacy over and over. But then Christians are easily suckered in to believe stuff!
bazzer1959 September 21, 2016 at 4:38 am:
It says “There came wise men from the east”. Not once does it say there were three!
=============================================
The Bible does say the wise man brought three gifts (gold, frankincense and myrrh). To thus represent the unknown number of wise men with three, each bearing one of the gifts, does not negate the entire Bible.
Exactly how many actors representing the wise men do you suggest should be employed in a pageantry play?
bazzer1959 September 21, 2016 at 4:38 am:
the Bible doesn’t say there were three wise men? It says “There came wise men from the east”. Not once does it say there were three!
===================================
The Bible does say the wise men brought three gifts (gold, frankincense and myrrh). To represent the unknown number of wise men with three, each bearing one of the three gifts, does not negate the entire Bible.
Exactly how many actors do you think should be employed in a pageantry play?
(2nd try at this reply – 1st got lost)
SR
Why have my attempts to post at this particular “Reply” failed, when posting just an hour before at another “reply” worked?
(This is a question and also a test)
SR
Mod., my question/test appeared immediately. What was wrong with my actual posts?
SR
[The proper place for any series of “Test” html or link questions is not an active thread, but the “Test Thread” itself. Other readers are not distracted nor misled by your attempts at testing your response prior to a final posting to others if those attempts are in a thread designed and intended for “testing” one’s efforts. You will notice that all professionals (cook, journalist, scientist, actor, sports figure or writer) do not “practice” their craft in front of their audience either. .mod]
Mod, I think there is a miscommunication here. I was not testing a link, nor an html in an attempt to do anything new. I had posted a reply earlier today with no problem, using my same-as-always home computer. Then, suddenly a reply would not post. So I reposted it, with no better result. I called my question of why my reply would not post “also a test” because I was trying to determine whether I had lost the ability to post replies. Since the question did post, I do not understand why you didn’t simply answer my question of why two attempts to post a reply failed to appear, even if the answer was “don’t know”. I also don’t see the relevancy of your “professionals do not practice their craft in front of their audience” comment. You have my email if you think this discussion is distracting to the thread.
SR
I prefer the name “Jesus” or Jesus of Nazareth in public forums. He is mentioned by Flavius Josephus, but whether he was “The Christ” is in dispute. Whether he was or not, his philosophy is badly needed in the Near East, as well as in a certain corporation in Rome currently headed by a chem lab technician posing as a climate expert.
The reference in Josephus is widely disputed. The big question is whether all of it is a forgery, or only parts of it.
The Jesus mentioned by Josephus wasn’t the Jesus called Christ. Yeshua, Aramaic for Joshua, was a common name.
psion, i get your point. The specific reference to the wise men and the star might just put a greenie over the top… If it were me, i would have started the thing 6000 years ago, included adam, noah (& the flood), abraham, david AND the birth of christ just to tee them off. (at the end i’d have added “petrus romanus” to make ’em go crazy)…
* “petrus romanus” (peter the roman) would be the last pope before the return of christ…
psion (@psion) September 20, 2016 at 12:58 pm:
“bible-thumping evolution-haters who think the flat Earth is only six thousand years old”
I don’t think there are any Bible-thumpers who believe in a flat Earth. Every Bible-Thumper I know thinks the Bible describes a spherical Earth:
Job 26:10 He drew a circular horizon on the face of the waters,
At the boundary of light and darkness.
SR
Jesus Christ is the central person and event in human history. Millions upon millions have trusted him and found him faithful. He defeated sin and death. However, this accomplishment pales in the light of modern-day saviors who can mark the day the oceans began to recede.
‘Fraid not. There isn’t sufficient evidence he ever existed. The other things you say are insipid platitudes. No offence, of course, but what the frack does ‘central person’ actually mean? How did he (since you believe he existed) defeat sin? Sorry, but you are just writing complete nonsense.
So… Theology is nonsense? You atheists ought to learn a little something about christianity before you start bashing it.
Studied it…at length. Otherwise I wouldn’t comment.
The simple fact is that the Church destroyed so much classical literature that we don’t really know what people said or thought about these matters.
That being the case, it does weigh heavily towards the argument that reason for the destruction of literature was to conceal inaccuracies in the official account of 1st Century events. As they say, history is written by the victors, never by the vanquished.
Oh what a crock! What the hell were all those monks doing , but recording Aristotle and all the other Greek and Roman texts? How ELSE do we even know about them?
Aristotle, perhaps. Archimedes, not so much, unless you consider bleaching the text away “preservation”. Apparently standard practice at this particular monastery, we will likely never know what has been destroyed.
https://en.wikipedia.org/wiki/Archimedes_Palimpsest
It would be nice to see atmospheric CO2 concentrations overlayed on the timeline too.
I agree, Roger
I found this online and have been posting it in the facebook keyboard wars:
https://www.facebook.com/photo.php?fbid=1682963532023612&set=p.1682963532023612&type=3
Dr. LeBlanc Smith, the author of the above chart, was kind enough to send me two more charts to share online. He made them explicitly for the purpose of educating lay people about the actual relationship of co2 to temperature. It seems appropriate to post them here, as ideas of what could be done with future cartoons/comics. They are intended to be shared, so help yourselves.
I am awaiting Dr. LeBlanc Smith’s permission to share his letter. I will add it here if he agrees.
https://www.facebook.com/photo.php?fbid=1683719631948002&set=p.1683719631948002&type=3
https://www.facebook.com/photo.php?fbid=1683731011946864&set=p.1683731011946864&type=3
Trying again.
https://www.facebook.com/photo.php?fbid=1683731011946864&set=p.1683731011946864&type=3
Last try before looking for a photo host. If this doesn’t work mods please delete.
https://www.facebook.com/photo.php?fbid=1683745865278712&set=a.1417775408542427.1073741827.100009299453885&type=3
[Far better to use the Test Thread (see link on WUWT Home Page, across the top set of links. .mod]
Look at the above Facebook notifications.
This is what crowd-sourced eco-fasc1sm looks like.
Mod- I did use the test page to try the first chart above, successfully. I don’t know why the others didn’t work. I just signed up with tinypic.
http://oi66.tinypic.com/2wghf01.jpg
http://oi63.tinypic.com/fdw1fq.jpg
Dr. LeBlanc Smith’s letter:
Jeff,
Thanks for using my chart.
I too have been fighting this fraudulent ‘human-caused & CO2 driven’ climate variation issue for decades.
I have used this graphic (with others) to counter teaching this fraud in our Australian education system, who started teaching the AGW fraud to school kids, mine particularly, and I wanted information that would be seen in context easily by kids and the less illiterate, so they would not get lost in text.
Being a scientist, I further wanted to see the climate information from source, to check its veracity, hence downloading the data from NOAA at Boulder all those years back, and making my own graphic to show context. Al Gore would not have got started if he had overlaid his temperature and CO2 graphics on a common timeline… where the temperature driver is clearly exposed. I am truly surprised these ‘green terrorists’ are still free to prosecute this fraud.
I am a retired Principal Research Scientist with Australian government CSIRO (Commonwealth Scientific and Industrial Research Organisation).
I fought against this from within the organisation for years. There are still those there who like the gravy train funding resulting from supporting the erroneous but politically convenient mantra of humans and CO2 climate alarm, despite it flying in the face of decades of empirical science showing AGW is a myth and fraud.
I would draw your attention to the Clexit campaign, which I am a signatory and founding member…
To view this release with all images intact click:
http://clexit.net/wp-content/uploads/2016/08/clexit.pdf
I would also draw your attention to the information compilations at the Carbon Sense website…
I have other graphics there… http://carbon-sense.com/2013/11/30/nothing-new-about-climate-change/
There is also some interesting additional material.
I am continuing to try and get our collective leaders here to adopt ‘mining sunlight and CO2’ using algae, to generate food, fuel, and nutraceuticle precursors (medicines). We demonstrated this potential back in 1981… and there are many really positive startups following this, despite our collective stupid governments and their advisors trying to sequester CO2 at great cost, rather than using it to make stuff and employ people – the science has long been there to show how this works.
I still enjoy the video graphics at CO2 science.org website, of the pea growing in CO2 enriched atmosphere…
Also their detailed demonstration of the agricultural production increases from rising CO2 levels, all at no cost.
Gratifying broadly that doubling CO2 will increase crop production by more than half again, whilst using 20% less water whilst doing this, and further increasing resilience of plants to heat stress by an additional 10 degrees celsius – all for free! Why are we trying to tax this?
Anyway, thanks for the response to my graphic.
best regards
Guy
Dr Guy LeBlanc Smith, PhD, MAIG, MAAPG
Director Rock Knowledge Services Pty Ltd
Queensland Australia
The stone-age didn’t end because we ran out of stones…think smart!
Just a repost of the first chart for blogs that are reposting, in case the fb link dies.
http://oi63.tinypic.com/vecc3c.jpg
One glaring error: Josh has it that Homo sapiens has been around since average temperatures were 8 degrees Celsius – “double the temperature of modern times.”
8 degrees Celsius is *not* twice as hot as 4 degrees Celsius. It’s less than a 1.5% increase.
I see the text now has it that temperatures for early H. sapiens were “well above” those of modern times. That’s more like it.
This makes me incredibly sad. I love XKCD (and his What if series), read it regularly. When I saw this cartoon it made me want to abandon the site. This is the same mistake that Michael Mann made with his hockey stick, tacking on modern measurements onto a proxy timeline. Munroe even doubles down on the error and adds the unproven, unrealistic model projections to it.
This must be how it feels when someone we trust goes to the dark side of the force. I really wish there was a way for me to express my anger with Munroe other than avoiding his comics in the future.
XKCD was actually a regular here for a couple months some time back. He seemed a very reasonable fellow and I would have pegged him much more sceptic/lukewarmish than CAGW.
Maybe not. Here is one from 2 1/2 years ago or so. https://xkcd.com/1321/ I wonder how he keeps these in his head with this one http://xkcd.com/1725/
“This chart uses GISP2 ice core data…”
Folks don’t like Marcott, but are OK with Greenland as a proxy for the whole world??
Greenland at least is real, and over time, apt to mirror what the rest of the planet does. Marcott on the other hand is pure Warmist hockey stick fancy, and pure nonsense.
Is ir just me, or did the younger dryas only occur in the northern hemisphere? (according to Jeff Hayes graph)
It looks like it is also in the Antarctic record, but more pronounced in NH. Axial tilt from a Mylankovich cycle? I’ll solve the photo posting problem tomorrow- it’s almost 5 am here. Keyboard warfare eats up time. Meanwhile some more of Dr LeBlanc Smith’s charts are here:
http://carbon-sense.com/2013/11/30/nothing-new-about-climate-change/
There are 2 on the front page, don’t know about the rest. Too tired to go exploring. G’night all.
Here’s a portion of what the “prestigious” IPCC has to say about the abrupt and rapid change in global climate associated with warming exiting the Younger Dryas cold period (source: http://www.ipcc.ch/ipccreports/tar/wg1/074.htm ):
“The central Greenland ice core record (GRIP and GISP2) has a near annual resolution across the entire glacial to Holocene transition, and reveals episodes of very rapid change. The return to the cold conditions of the Younger Dryas from the incipient inter-glacial warming 13,000 years ago took place within a few decades or less (Alley et al., 1993). The warming phase, that took place about 11,500 years ago, at the end of the Younger Dryas was also very abrupt and central Greenland temperatures increased by 7°C or more in a few decades (Johnsen et al., 1992; Grootes et al., 1993; Severinghaus et al., 1998). Most of the changes in wind-blown materials and some other climate indicators were accomplished in a few years (Alley et al., 1993; Taylor et al., 1993; Hammer et al., 1997). Broad regions of the Earth experienced almost synchronous changes over periods of 0 to 30 years (Severinghaus et al., 1998), and changes were very abrupt in at least some regions (Bard et al., 1987), e.g. requiring as little as 10 years off Venezuela (Hughen et al., 1996). Fluctuations in ice conductivity indicate that atmospheric circulation was reorganised extremely rapidly (Taylor et al., 1993). A similar, correlated sequence of abrupt deglacial events also occurred in the tropical and temperate North Atlantic (Bard et al., 1987; Hughen et al., 1996) and in Western Europe (von Grafenstein et al., 1999).” and “Speleothem data from New Zealand, and positions of mountain glacier moraine termini suggest warming rates of 2°C/millennium from 15 to 13 ky BP (Salinger and McGlone, 1989). Speleothem data for South Africa suggest a warming rate of 1.5°C/millennium (Partridge, 1997) over the same time period.”
Also, here is a link to one of literally hundreds of graphs available on the Internet that show the abrupt GLOBAL temperature change exiting the Younger Dryas cold period:
http://theresilientearth.com/files/images/102-Younger_Dryas_Temperatures.png
This graph is only for atmospheric temperatures over Greenland, but others are available for the poles and other areas of Earth over this time period.
It is a clear mistake to think that Greenland temperatures represent Holocene global temperatures. On top of that GISP and GRIP are not corrected for altitude changes, that Bo Vinther demonstrated in 2009 was essential. But that’s OK, almost everybody at both sides of the debate is just happy to find a curve that represents their beliefs and don’t give a damn about how correct it is.
A fair enough point. but when you add in stalactite growth in Oman and New Zealand etc etc etc you see that the Greenland data are not too far off what was seen globally.
Furthermore, the Minoan, Roman and Medieval Warm Periods, as well as the Little Ice Age were real based on contemporary accounts and archeological evidence.
So unfortunately the XKCD depiction is not correct.
We can debate whether variations were regional or global, but there is no question they are greater than today.
Furthermore, it was also clear previous computer simulations of future temperatures do not match the observed reality which has subsequently occurred. According to the Scientific Method the simulations are considered ‘hypothesis’ and are NOT ‘observations’ – and when we do get the observations we find the hypothesis of the simulations does not match reality.
The paleo data does show large NATURAL variability, on the regional scale at least. You can quibble whether the variability was global or not, but what you cannot dispute is that the variability seen in the past at the regional level (or larger) is significantly greater than today.
Hold on Moa,
I am not defending other interpretations.
“Greenland data are not too far off what was seen globally”
Depends on your definition of “not too far off”. The main problem is that it does not show the general temperature trend because of a gross artifact, and very few are conscious of this problem with Greenland data. Take a look at this figure from Vinther’s article:
“the Minoan, Roman and Medieval Warm Periods, as well as the Little Ice Age were real based on contemporary accounts and archeological evidence.”
I do not dispute their reality, however we do not have good data on how warm they were compared to now or between each other.
“the XKCD depiction is not correct”
I did not defend it. But Josh’s version is also not correct.
“We can debate whether variations were regional or global, but there is no question they are greater than today.”
There are two very large global variations in temperature during the Holocene, the 8.2 kyr event and the warming from the bottom of the LIA to present. We do not know which one was bigger, but we do know that all the rest were smaller. That is what the majority of proxies show.
Javier on September 20, 2016 at 3:59 pm
Many thanks Javier!
Vikings (or maybe somebody else?) was growing barleycorn on Greenland at the ~1000 YBP point – http://icelandreview.com/news/2012/01/11/vikings-grew-barley-greenland?language=en
So probably warmer than now, ref – https://wattsupwiththat.com/2016/01/19/debunking-the-vikings-werent-victims-of-climate-myth/
..I’ve seen Josh’s version (the best, of course) four or five times and this is the first time I noticed a spelling error ?.. I think…
” Homo Sapiens has been around for 200,000 years”. Should that be “have been around” ?
Hmm, dunno. “Homo Sapiens” is a species, not plural. So “it has” would be correct I think.
Great job!
May I suggest adding tree line reached the shores of the Arctic Ocean around 9000 AD, further north than today.
I yield to Josh – too many cooks spoil the graph.
(Or just one John Cook.)
Besides, 6000 years ago there were forests in Peru that glaciers are uncovering as they retreat.
The Iceman Otzi met his death around then too.
And more – http://wermenh.com/climate/6000.html
That’s an interesting argument:
If Ötzi was frozen 5200 years ago and became unfrozen in 1991, what does that tell us about the temperatures between 5200 and 1991? Could they have been higher than now without Ötzi becoming unfrozen and disappearing?
IMO he might well have been exposed for brief periods at perhaps ~1000-year intervals, but was already preserved as a freeze-dried mummy and not subject to scavenging at that altitude, or even much fungal growth.
Brief thawings are obviously a possibility but they do not really change the picture. There are a lot of organic remains appearing now that were frozen between 6000 and 4000 years ago. Temperatures cannot have been much higher in between then and now or they would have disappeared, nor could 5000 years ago have been much colder or hotter than now or they would have not frozen at spots that are melting now.
Intermittent passes in the Alps now opening up again show artifacts from the recognized warm periods and nothing in between. Some of them are made of biodegradable materials, so must have been dropped in snow or on ice.
It doesn’t mean much as glaciers move downhill and tend to melt a lower elevation.
The flow around the passes is a lot slower than that on a steep valley.
However, for things like that Peruvian forest, it means that the trees being exposed today were much higher when the glacier took them down. Hence, it was warmer back then than one might first guess.
There are also trees coming out of melting glaciers in Switzerland demonstrating that tree line was significantly higher several times since the end of the Pleistocene.
https://wattsupwiththat.com/2014/08/08/receding-swiss-glaciers-incoveniently-reveal-4000-year-old-forests-and-make-it-clear-that-glacier-retreat-is-nothing-new/
Once the Grubber Carbon Tax is in place, it won’t really matter which way the lines move because the revenue will be in the political tax base at that point. But if the line moves to the cold side, there will only be negative preparedness for that case. I suppose portions of the climate equity redistribution budget could be used for heating bills.
I see some XKCD fans here feeling a little poleaxed by this strip. It shouldn’t be surprising; Randall is decidedly leftish and parrots many of the talking points you’d expect, his scientific expertise notwithstanding. And if the timeline comic upset you, well, I’m sorry, but I was appalled by him long before now, when he posted his atrocious understanding of free speech.
Josh’s cartoon’s ‘projected’ range for the next 1400 years is +0.4 °C to -0.9 °C with respect to current temperatures. Any basis for that, anywhere?
XKCD cartoonist Randall Munroe based his 85-year extrapolation on peer-reviewed science. Little details like that matter.
…1,400 years ?? Josh’s graph CLEARLY says ” The next 500 years” !!
Hmmm….I seem to recall that the whole CAGW meme started (or at least gained a whole lot of steam. (hot air)) when Hansen presented his best and worst case scenarios before Congress.
CO2 is, if I’m not mistaken, above his worst case yet actual measurements are below his best case scenario.
Are you saying that his testimony that started all the political efforts in the US to stop CAGW was not peer-reviewed and so is BS or that is was peer-reviewed but remains BS?
He was wrong after all.
“the whole CAGW meme started (or at least gained a whole lot of steam. (hot air)) when Hansen presented his best and worst case scenarios before Congress.”
No-one pays any attention to Congress. What really kicked it off was Margaret Thatcher peddling the idea. That put it into international politics.
http://www.john-daly.com/history.htm
His graph doesn’t speculate further than 500 years, where you claim 1400. How did you get there?
Little details matter.
..Yes MH, I was trying to figure that out too ? Strange…
_400_ years
*sigh*
LOL. Peer review does not stop science from being completely broken and corrupted.
Many people have probably died because of this peer reviewed crap.
Around here we call it pal review.
..Off Topic ….but this is hard on an American at heart living in Canada…If the USA loses, they are out because of their loss to Europe..
http://www.cbc.ca/sports/hockey/nhl/canada-united-states-world-cup-hockey-preview-1.3768816
It’s hard to watch with friends when your cheering for the “other” team !
@jgriggs3: then you may have missed these other XKCD comics.
Cold https://xkcd.com/1321/
4.5 Degrees http://xkcd.com/1379/
Thanks Magma, I had actually missed the second comic somehow. I had simply ignored the first as political stammering and not much more. Silly mistake on my part.
I’ll keep all of the scientific issues I have with both of those cartoons to myself, I think most folks on this site can figure them out for themselves anyways.
Alarmists usually like to choose a start date for their temperature trends at a relatively cold period, Josh’s timeline would have been better to start ~16,000 years earlier to capture the peak of the Eemian IMO.
The Eemian was about 115,000 to 130,000 years ago.
Dear oh dear, I ran out of fingers and toes.
I did not know that glaciers reached all the way down to Boston and New York.
Doesn’t that mean that these places were once permafrost?
Long Island is the remnant of the “terminal moraine” of the last continental glacier — the pile of rubble pushed forward by the advancing wall of ice.
Cape Cod was under a lot of ice, too.
http://pubs.usgs.gov/gip/capecod/glacial.html
Even further south. In northern Princeton, there are many places you can find large rounded boulders that hitched a ride on the glacier and were left behind when the glacier retreated. There are three quarries that mine basalt from previous volcanic activity. To the east, say east of US 1, you will find triassic and jurassic sand as you head to the shore. With all of that, Princeton U has a geology lodge in Red Lodge, Mt. Go figure. Perhaps they enjoy the great small stream trout fishing.
Hmmm, according to xkcd, CO2 levels start to increase about 17,300 BC. I didn’t know that there were SUVs back then. And it continues to get the start of the industrial revolution wrong – I was taught, and even Wikipedia says, that the Industrial revolution began about 1760.
If memory serves me the Earth was at around 280 ppm for CO2 before the industrial revolution. If CO2 started rising back in 17,300 BCE then what the heck was it back then? Much lower than 280 ppm and plants can’t perform photosynthesis.
..Repeat after me…Up and Down, Up and Down…..etc…….
The warming period following Younger Dryas (i.e., starting about 12,000 years ago) had an associated large increase in atmospheric CO2 content (from about 190 ppm to 260 ppm, a 37% increase), and this obviously happened without any mankind-related burning of fossil fuels and associated mankind-related release of CO2 into the atmosphere.
Late Glacial Interstadial not Interstitial! ( or the Bolling Allerod Interstadial)
But I want to know when the Pastafarians first cooked their noodles.
Right after the Dogarians learned how to fry, not boil, their weenies ( in Garlic Butter) ?
Marcott 2013 is still alive! Last to resurrect it is XKCD
marcott is still alive – I thought even the most diehard climate alarmist accepted that the study has been throughly discredited
Brilliant work Josh
George McFly,
Heh, at first I read, “I’m your dentist.”
..And now, for something completely different…. ?oh=d46c0dac9fd0ae6bb39c1b37438e6f1c&oe=588105B3
Of topic in this thread:
game changing batteries.
There already exist drones the size of insects. Not that useful without fitting batteries.
https://www.seas.harvard.edu/news/2013/05/robotic-insects-make-first-controlled-flight
Then why did you post it???
Because I leave to [mod] to sort out.
Lovely work.
A crazy thought ran through my mind to fix XKCD with error bars. Just be glad you haven’t seen my cartooning. What about the error bars for any of this stuff?
Great comic Josh! Obviously it would make for a HORRIBLE comic, but I always find myself talking about the uncertainty in those old proxy reading with friends. We just have no way of knowing how quickly the earth cooled or warmed in those periods that meet our current standards of specificity. Whether it be, 1,000 years ago, 100,000 years ago or a million years ago. So when we talk about the current acceleration, it honestly means practically nothing to me.
Thanks, Josh! I have been waiting for this. Meanwhile, I decided to play around with a data extraction of the ‘modern’ component of the xkcd ‘data’.
The solid red line is a digitized version of the xkcd cartoon. The data points are the GISS data pulled from the NASA site. The red line is the smoothed version of the GISS data with a 39 year smooth and a 13 year shift in order to match the slope, the (missing) 1940s bump and the magnitude of the anomaly. No conclusions to be drawn except that, following their flawed sources, the cartoonist based it on data that, at best, ended at the beginning of the pause and involved a smoothing function that neither fits modern data nor is consistent with paleo estimates.
[IMG]http://i67.tinypic.com/20608s0.jpg[/IMG]
http://tinypic.com/view.php?pic=20608s0&s=9
Fixed it…I think …
I already did for you.
http://oi67.tinypic.com/20608s0.jpg
you realize, of course, it’s only 2016?
Thanks, Jeff.
probono: The last GISS data point is 2015. The red ‘dash’ at the end is the beginning of the xkcd extrapolation (oops … model projection).
great post Josh…the “hockey stick” is just bad statistics great that you footnoted the real world. Thankyou
I did not see a place for the greatest discovery ever by man, BEER.
The greening of the Sahara around 8000 BP was not due to more CO2, because CO2 was hardly over mid 9th century level then. The Saharan greening sas due to something else – probably a shift in precipitation patterns due to the warmer global temperature.
The invention of a “global average temperature” – a timeline and a hockey stick: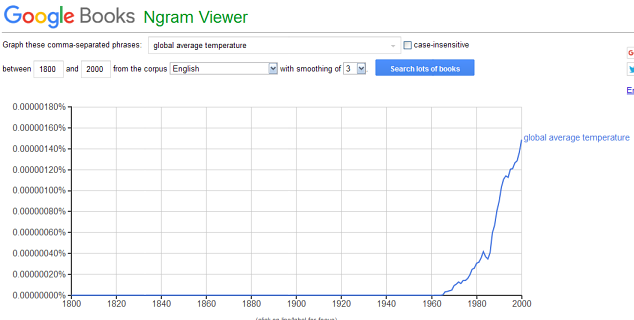
Josh’s Younger Dryas temperature changes are quite wrong. It should show a warming 16 times as fast as the past 160 years.
Josh might like to replot from here
ftp://ftp.ncdc.noaa.gov/pub/data/paleo/icecore/greenland/summit/gisp2/isotopes/gisp2_temp_accum_alley2000.txt
Tony,
Not so. A comparison of Josh’s Younger Dryas temperature changes and those from the GISP2 data you reference show that they are virtually identical when the GISP2 data are scaled down (by dividing by 4) to match the 4 C Last Glacial Maximum to preindustrial change estimated in Annan et al (2013) “A new global reconstruction of temperature changes at the Last Glacial Maximum” and shifted to a zero preindiustrial (1700-1800 mean) baseline. Try it.
My goodness. A cartoon should be precise, when paleoproxies themselves are anything but? Folks here have to get a grip. Splendid Josh cartoon. Contrast point to previous agreed. Else stop.
“Phoenetic alphabet” should probably be “phonetic alphabet” unless Josh is making a joke about Phoenicians I don’t get.
One thing noticeable in Josh’s timeline, and other reasonable paleotemperature reconstructions going back at least 20,000 years: The global climate was more unstable during the last glaciation and around the Younger Drias than it was after the warming that followed the Younger Drias. This seems to be from greater positive feedback from large variability of sunlit snow/ice cover from a temperature change.
I think the red-dotted projections in the Josh version should include at least the median (less-warming than the mean) of the two lowest, or the lowest and third lowest, of the four RCPs of the CMIP5 model projections. I expect the median of the projections in the lowest of the four RCPs of the CMIP5 projections to be close to what actually happens.
Alternatively, lump together the projections of the three lowest of the four RCPs, and plot the 10th percentile and the 50th percentile (median, which will have less warming than the mean). I expect the 10th percentile to be close to what actually happens.
None of the three red-dotted curves in the Josh version show and warming from now to 2150, which seems unrealistic.
Folks over at Climate Audit are asking Steve McIntyre to make his own assessment of the most probably Holocene temperature history. He is probably best placed to do so, having looked at the source data for all supposed reconstructions and thus having knowledge of the strengths and weaknesses of them all.
Here is a recent post by Steve at CA where he comments on attempts by the Australian climate establishment to bury and destroy the Antarctic Law Dome ice core data series:
https://climateaudit.org/2016/08/03/gergis-and-law-dome/
don’t miss this one from xkcd!
https://xkcd.com/1321/
Has Josh made his into a meme I can post on FB to counter the xkcd meme?
1) Y-D drop larger than XK shows, and faster as well
2) Holocene Optimum ~6,000-3,000 bce was 2-4C warmer than present
3) Ceaser fround grapes growing on the England, Scotland boarder. That’s 400 miles farther north than they can be grown today. Temperature must have been warmer than indicated.
4) People in London, England had Ice Fairs on the Thames in winder as river froze over most winters during depth of LIA. Not happening now, so LIA colder than indicated!
5) Stalagmites and stalagtites analysis from caves in Asutralia and China show LIA was world wide event and not just in Northern Hemisphere or Europe.
SInce present temperatures are still below Holocene Optimum 8,000 years ago, forecasts for pending disaster are highly overblown! But you must have a pending tragedy to con people out of money so worthless research can be funded!
But both scrolls were very well done, far beyond my artistic talents!
Perhaps I’m misinterpreting, but I had always liked the xkcd climate change cartoon. It sure made it look to me like past ice ages were a bad thing and a warming world was where you wanted to be.
Like others, I greatly enjoyed Josh’s cartoon. And since you invited comments and corrections, here are a few to consider (with outright apologies for the rather lengthy post required for the relevant data):
1. Ice Ages (per accepted scientific climatology terminology; note use of caps) last tens of millions to hundreds of millions of years, but within an Ice Age there are multiple shorter-term periods of warmer temperatures when glaciers retreat (called interglacials or interglacial cycles) and periods of colder temperatures when glaciers advance (called glacials or glacial cycles). The last Ice Age started around 3 million years ago so technically we are most likely still deep in an Ice Age, but within a warming interglacial period that began 12-14 thousand years ago . . . well before human civilization and any human-originated CO2 emissions, as Josh noted.
Thus, I would hope that we can be more careful about using the phrase “ice age” when the more proper terminology would be “glacial period”.
Over the last million years, glacial events have occurred at an average frequency of about once every 100,000 years. The exact end of the last glacial period is somewhat uncertain: it may have occurred about 14,000 years ago when the Earth’s average global temperature warmed relatively quickly by about 30 deg-F to nearly the average temperature we have today, or it might have occurred at about 12,000 years ago at the end of the Younger Dryas cold period. Climate scientists aren’t sure whether the brief (it only lasted about 500 years) warming period 14,000 years ago or the end of the Younger Dryas cold period (it lasted about 2,000 years) is the real end of the last glacial period.
In any event, the last 12,000 years or so (the Holocene period) has been a period of relatively stable global temperatures, again as noted by Josh.
2. The global warming period that followed Younger Dryas is extremely important because we do not know if the same processes that caused it have not reappeared within the last 200 years, and are therefore the predominant cause of Earth’s recent warming trend. This would further support that mankind is not the primary or even a secondary cause of Earth’s recent warming, often attributed to mankind-related CO2 release due to the burning of fossil fuels.
More specifically:
a) The warming period following Younger Dryas and leading into the Holocene had an average warming rate (about 1 deg-C every 100 years) that is similar to, but higher than, what Earth has experienced over the last 100 years. During this ~2,500 year period of warming, averaged annual temperatures on the Greenland ice sheet hit a maximum warming rate of around 8 °C over 40 years, and the total temperature rise was about 20°C.
b) The warming period following Younger Dryas had an associated large increase in atmospheric CO2 content (from about 190 ppm to 260 ppm, a 37% increase), and this obviously happened without any mankind-related burning of fossil fuels and associated mankind-related release of CO2 into the atmosphere.
c) The transition from the cold minimum of the Younger Dryas period to the start of the rapid warming recovery happened extremely rapidly, on the order of 200 years or less, which interestingly is close to the same duration that Earth has most recently seen a large increase in global warming (i.e., the last 200 years).
d) The warming period exiting Younger Dryas lasted for about 2,500 years, and if the same natural processes that caused this event—and there is no scientific consensus as to what they are—have again become active within the last 200 years, then mankind can do little to prevent this and thus needs to globally concentrate thought and resources for planning how to adapt to/survive a long (1000 years or more) long-term warming period and not how to fight or reverse an overpowering natural climate event (reference Dansgaard-Oeschger events).
e) If the world’s best climate models cannot even back-predict (“hindcast”) the 2,500 year warming exit from Younger Dryas and the world’s best climate scientists have not even explained (reached a “consensus”) on the causes of this warming, then how do we know that the same processes of this warming aren’t happening right now?
f) It appears that humanity is preparing to spend untold TRILLIONS of dollars fighting man-made global warming (AGW)—largely on the basis of “scientific” climate models that forecast most of global warming is AGW and thus requires immediate drastic actions—despite the facts that the Younger Dryas event and its subsequent warming period show that similar rapid global climate change has occurred without any influence from humans.
“If the world’s best climate models cannot even back-predict (“hindcast”) the 2,500 year warming exit from Younger Dryas”
Nobody has even tried. Running a GCM and a Glaciology model in parallell and at a reasonably high definition (say 100×100 km) over a 2,500 year interval would take years and cost billions even on the fastest supercomputers.
tty, you posted: “Nobody has even tried . . . ”
Hmmm . . . I was totally unaware that GCM and glaciology models (huh?) were the only types of climate models that existed with capability to hindcast.
So much, I guess, for ever building a Earth-centric computer model to see if Dr. Milankovitch’s theories correlate to reality.
/sarc
This is outside my skillset, but would a distributed computing system be feasible for climate research, both hindcast and then forecasts? I’m thinking of a project like the seti-at-home or human genome projects.
Sorry, but an orbital model does not count as a climate model. Orbital mechanics are simple.
tty,
It is true that an orbital model is not a climate model, but in the case of Milankovitch, that’s largely a distinction without a difference. One is hard pressed to assert that Milankovitch’s theory of orbital cycles—and critical parameter variations therein (e.g., Earth’s obliquity, Earth’s orbital eccentricity, equinox precession, etc.)—have not been used as the basis of MODELING how those variations affect solar insolation which in turn is the primary driver of Earth’s climate.
Heck, here’s what NOAA has to say about this: “The Milankovitch or astronomical theory of climate change is an explanation for changes in the seasons which result from changes in the earth’s orbit around the sun. . . . Orbital changes occur over thousands of years, and the climate system may also take thousands of years to respond to orbital forcing. Theory suggests that the primary driver of ice ages is the total summer radiation received in northern latitude zones where major ice sheets have formed in the past, near 65 degrees north. Past ice ages correlate well to 65N summer insolation (Imbrie 1982).” (source: http://www.ncdc.noaa.gov/paleo/milankovitch.html )
I could go on and on, but why bother.
So, if you want to imply, as you did earlier, that only GCM and Glaciology models qualify as the “best climate models”, especially in terms of hindcasting, go ahead and be my guest.
But please consider that there are useful theories and associated models that correlate well paleoclimate data records (e.g., that of Milankovitch), and then there are other models (most notably tens of currently-used GCMs) that don’t even correlate well with each other, let alone having any accuracy in predicting climate ten years into the future . . . as the IPCC and this website have clearly demonstrated.
Categories of climate models currently in use:
0-D EBM
1-D EBM
2-D EMIC
3-D EMIC
GCM
OGCM
AGCM
CGCM
(source: http://www.climate.be/textbook/chapter3_node4.html )
0-D EBMs are simple.
The 8.2 KA cold event was bigger and sharper than in the timeline. And sabretooths stopped roaming North America just before, not just after Younger Dryas. The youngest reliable date is 11,130 BP, but this is in radiocarbon years which are about 10% lower than calendar years in this range.
I think that the thing the xkcd cartoon brought to mind was how it chose a narrow section of time. If you look at a chart by the Smithsonian – one that does not purport to have anything to do with global warming – then you can easily see that over the course of human evolution the temps have been getting cooler but the amplitude of the changes in temperature have become larger: http://humanorigins.si.edu/evidence/human-evolution-timeline-interactive
There are also a couple of nitpicks I can add to the excellent version of the chart that Josh made: I believe that farming started in Europe before the Younger Dryas as well – we had to go back to hunting and herding until the weather improved. (I do not know if the rice cultivation in China was put on Pause for the Younger Dryas.) Also, the development of writing per se might be added (as opposed to alphabetic writing).
Thank you for the corrected chart.
Jan
“I believe that farming started in Europe before the Younger Dryas as well – we had to go back to hunting and herding until the weather improved.”
No, farming didn’t come to Europe until long after Younger Dryas, but it seems to have started in the Near East during Younger Dryas.
Timeline’s final 2,500-year scale is inconsistent with previous 500-year intervals, compressing periods 40% to 300 years. Might also note that the so-called Younger Dryas “cold shock” was verifiably an artifact of episodic cometary/meteorite impacts, wholly unrelated to Earth’s climatic or equinoctial precessional regimes.
Also, a rudimentary geophysical –plate tectonic– plot of “drifting” continental landmasses would be apropos, tying cyclical Pleistocene Ice Ages to North and South American continental dispositions’ interference with global atmospheric/oceanic circulation patterns as well as long-term fluctuations in total solar irradiance (TSI).
Needless to say, willfully deviant Klimat Kooks, the new Lysenkoists/Anabaptists of Munster, will go to any lengths to suppress empirically objective or even rational scientific fact.
LLoyd, please cite a scientifically-credible reference (or two) to support your statement that the Younger Dryas cold period was “verifiably an artifact of episodic cometary/meteorite impacts” . . . emphasis on VERIFIABLY as opposed to hypothetically.
According to Wikipedia (https://en.wikipedia.org/wiki/Younger_Dryas_impact_hypothesis ): “The Younger Dryas impact hypothesis, also known as the Clovis comet hypothesis, is one of the competing scientific explanations for the onset of the Younger Dryas cold period after the last glacial period. The hypothesis, which scientists continue to debate, proposes that the climate of that time was cooled by the impact or air burst of one or more comets.[1][2][3]. ” And further on: “Recently new studies were published in the matter of the YDB impact hypothesis, criticizing the methodology and pointing to inconsistencies regarding the chronological data.[59][60][61] This new research, which analyzed sediments claimed, by the hypothesis proponents, to be deposits resulting from a bolide impact were, in fact, dated from much later or much earlier time periods than the proposed date of the cosmic impact. The researchers examined 29 sites that are commonly referenced to support the impact theory to determine if they can be geologically dated to around 13,000 years ago. Crucially, only three of the sites actually date from that time. According to the researchers, the Younger Dryas impact event evidence “fails the critical chronological test of an isochronous event at the Younger Dryas onset, which, coupled with the many published concerns about the extraterrestrial origin of the purported impact markers, renders the Younger Dryas impact hypothesis unsupported. There is no reason or compelling evidence to accept the claim that a cosmic impact occurred about 12,800 years ago and caused the Younger Dryas.[59]”
Perhaps your definition of “verifiable” is different from mine and that of the scientists who wrote those papers referenced in the Wikipedia article?
Now, you were saying something about “empirically objective or even rational scientific fact” . . .
I was about to share this on social media then noticed the 2000 to 2016 period is indeed completely wrong and reflects the original comic’s erroneous attribution of a steep incline when in fact it was flat.
A pity, fix that and it’s useable, despite some of the astute observations of posters here about missed warmings thousands of years ago.
It would’ve been better if he’d used the same scale with a clear 2000 to 2016 demarcation to demonstrate the difference and lack of warming.
Still, great work!
I posted this chart to Slashdot after someone posted the XKCD one. The post was modded up more than down and ended at 4. A few years ago it would have been at -1. There were lots of encouraging replies showing that people are thinking instead of blindly following. https://slashdot.org/comments.pl?sid=9703345&cid=52966897