Suggested Disclaimer: Climate Model Outputs Have Been Manipulated By NOAA to Make Models Appear to Perform Well
Guest Post by Bob Tisdale
This post introduces readers to a newly revised “product” from NOAA, called “Climate Explorer”, which is part of their U.S. Climate Resilience Toolkit. NOAA released this misleading product on July 27, 2016 and so far it has received little attention by the blogosphere and mainstream media.
That’s a good thing.
NOAA has manipulated the climate model outputs to make the models stored in the CMIP5 archive appear to perform well regionally on an absolute basis.
Also, both data and model hindcast outputs are available on the related NOAA Climate Explorer webpages, and when we compare their linear trends, we rediscover what we already know: climate models do not properly simulate surface temperatures in the United States.
IMPORTANT INITIAL NOTE: The NOAA Climate Explorer is not to be confused with the KNMI Climate Explorer, the latter of which IS a very useful tool.
INTRODUCTION
The NOAA press release Climate change in your county: Plan with this new tool begins:
Residents, communities and businesses now have easy access to climate projections, through a few easy keystrokes, for every county in the contiguous United States.
NOAA’s newly updated Climate Explorer offers downloadable maps, graphs, and data tables of observed and projected temperature, precipitation and climate-related variables dating back to 1950 and out to 2100.
Built to accompany the U.S. Climate Resilience Toolkit, the Climate Explorer helps community leaders, business owners, municipal planners, and utility and resource managers understand how environmental conditions may change over the next several decades.
It continues (my boldface and underline):
Climate Explorer projections are based on two global climate model scenarios that describe how the abundance of heat-trapping gases in Earth’s atmosphere may change through 2100. The tool provides projections for parameters such as changes in the number of days over 95 degrees F, number of days with heavy rain, and heating and cooling degree days.
“The Climate Explorer is designed to help users visualize how climate conditions may change over the coming decades,” said David Herring, communication and education program manager at NOAA’s Climate Program Office. “Projections of how much and how fast change is happening is crucial to help communities prepare and become more resilient.”
I enjoy weasel words: may, might, could, etc. NOAA used a few in the above quotes. Weasel words are prevalent in climate studies and their press releases. With their constant use, over the past decades of reading climate-related weasel words, I’ve come to read a phrase such as “may change over the coming decades” as “may (or may not) change over the coming decades”. That’s the reality.
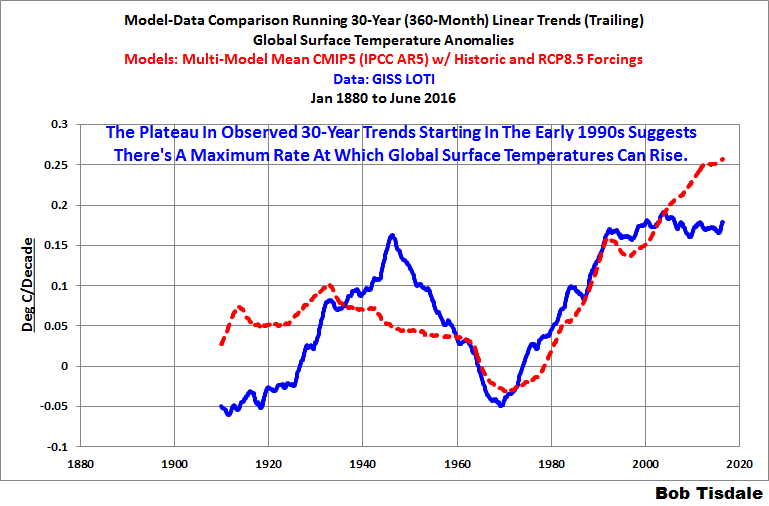
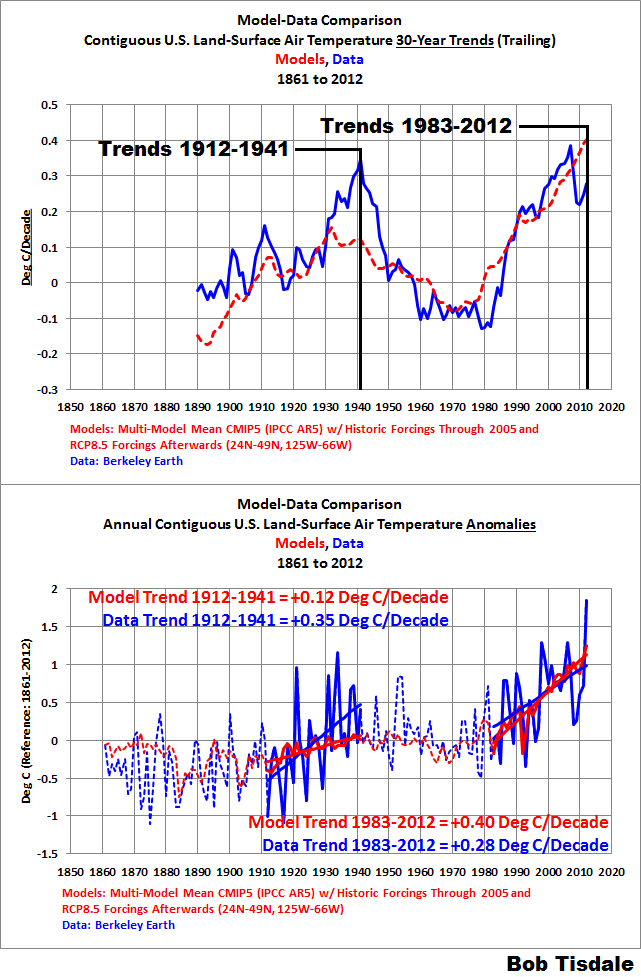
I’ve also highlighted the appearance of the word global in the quotes. The climate models used by NOAA for projections in their Climate Explorer are those stored in the CMIP5 archive, with the climate model forcings associated with the RCP4.5 and RCP8.5 emission projections. They are global models, not regional models. We already know that climate models can’t simulate the multidecadal variations in the surface temperature trends globally or for the contiguous United States. See Figure 12 from the June 2016 Global Surface and Lower Troposphere Temperature Anomaly Update and Figure 5 from In Honor of the 4th of July, A Few Model-Data Comparisons of Contiguous U.S. Surface Air Temperatures. Yet with their Climate Explorer, NOAA is presenting regional outputs from global climate models.
NOTE: If climate model forcings are new to you, see Chapter 2.3 of my free ebook On Global Warming and the Illusion of Control – Part 1 (25MB pdf), and if you’re new to RCPs (Representative Concentration Pathways), see Chapter 2.4.[End note.]
Let’s see how well and poorly those climate models supposedly simulated the surface temperatures of the 4 largest U.S. cities – Chicago, Houston, Los Angeles and New York – according to the data and model outputs supplied by NOAA’s Climate Explorer. As examples we’ll also present sample actual outputs of the CMIP5-archived climate model simulations (hindcasts) of Chicago’s annual minimum daily minimum temperatures and compare them to the spread provided by NOAA. Reality is quite different than what NOAA presents. And there’s something very obviously absent from the data provided by NOAA for coastal communities.
But first…
SAMPLE MODEL-DATA PRESENTATIONS BY NOAA AT THEIR CLIMATE EXPLORER
Please visit the NOAA Climate Explorer website, and select “Search by Location” from the blue menu. Enter your home town in the field, and select the appropriate county from the drop-down menu. I’ve chosen “Chicago IL, United States”, one of my old stomping grounds, which provides information for Cook County. Figure 1 is the time-series graph supplied by NOAA of the Mean Daily Maximum Temperature for Cook County on an annual basis, from their Chicago – Cook County webpage. It includes:
(1) the (optional) observations-based data from 1950 to 2010,
(2) the spread of the climate model hindcasts from 1950 to 2005, and
(3) the spreads and medians of the climate model projections from 2006 to 2100 for the RCP4.5 and RCP8.5 scenarios.
The data and model outputs are in deg F for U.S. audiences. Note that you can click on and download the data and model outputs from the link above and to the right of the graph, which are the sources of the data for many of the illustrations to follow. The data and model outputs provided by NOAA are in deg C, so you’d have to convert the data to deg F to match the NOAA presentation. There are also “Monthly” and “Seasonal” graphs available.
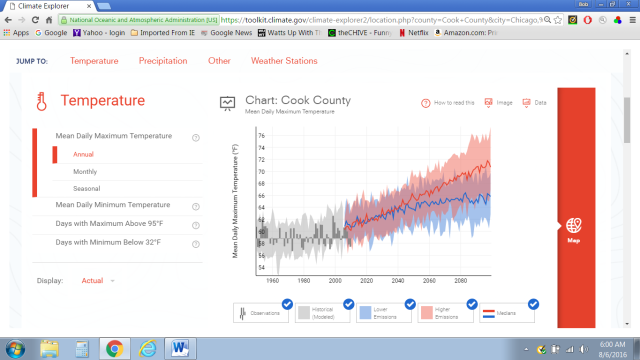
Figure 1
Note also that the left-hand menu also includes Mean Daily Minimum Temperatures, Days with Maximum above 95 Deg F and Days with Minimum below 32 deg F. Figure 2 is the time-series graph of the Mean Daily Minimum Temperature for Cook County on an annual basis, similar to Figure 1.
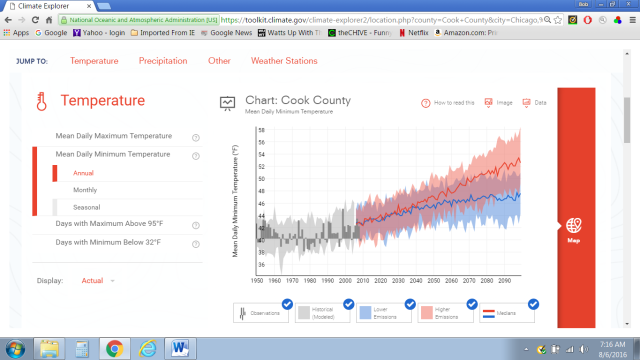
Figure 2
Scrolling down on the Chicago – Cook County webpage, there are model-data comparisons for precipitation, then heating and cooling degree days, and a map of the local weather station locations.
IMPORTANT NOTE: When discussing the model hindcasts, NOAA includes the following note in their “How to Read This” discussions (my boldface and underline):
The light gray band shows the range of model data (hindcast) for the historical period. To get a sense of climate models’ predictive ability for this variable in this county, compare the year-to-year variability of observations (dark gray bars) with the range of modeled projections.
But as you’ll discover later in this post, NOAA has manipulated the model outputs to make them appear to perform well, when the reality of the models is very different.
MODEL-DATA TEMPERATURE TREND COMPARISONS FOR THE BIG-4 CITIES/COUNTIES
Figures 3 through 6 are time-series graphs of the modeled and observed Mean Daily Maximum Temperatures (Tmax) and Mean Daily Minimum Temperatures (Tmin) on an annual basis, and their linear trends, for the four most-populous cities/counties in the United States:
- New York City (New York County),
- Los Angeles (Los Angeles County),
- Chicago – Cook County and
- Houston (Harris County).
The sources of the observations-based data and climate model hindcasts are linked to their respective NOAA Climate Explorer webpages. The graphs cover 1950 to 2005, which is the period provided by NOAA for the “Historical Modeled Data”. The linear trends for the data and model output median are as calculated by MS EXCEL. The graphs also include the supposed upper and lower bounds of the climate model outputs. I’ve also left the model and data in deg C, not deg F as NOAA shows in their graphs (Figures 1 and 2).
The notes at the bottom of each graph read Climate Model Outputs Have Been Manipulated By NOAA To Show Better Model Performance Than Actual Outputs. We’ll confirm that in a moment.
Let’s start the model-data comparisons with the better performances on the parts of the models and work our way toward horrendous.
Figure 3 includes the model-data comparisons for Los Angeles (Los Angeles County), using the data and model outputs provided at the NOAA Climate Explorer. Mean Daily Maximum Temperatures (Tmax) are included in the top graph and Mean Daily Minimum Temperatures (Tmin) are shown in the bottom one. Based on the linear trends of the model median and data provided by NOAA, the models do a good job of simulating the Mean Daily Maximum Temperatures from1950 to 2005 (top graph), but the models grossly underestimate the observed warming in the Mean Daily Minimum Temperatures for Los Angeles County (bottom graph).
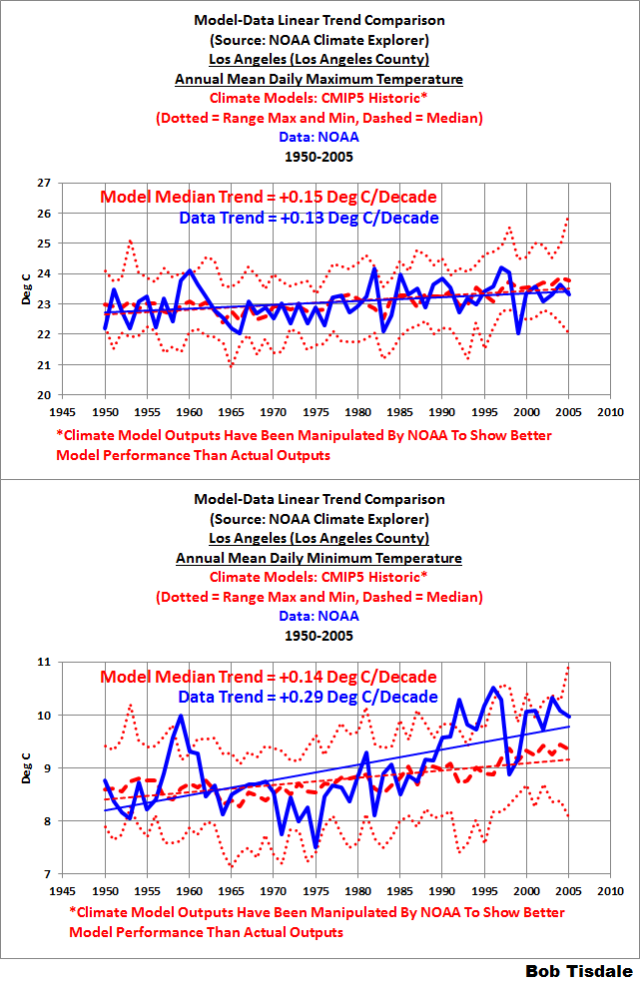
Figure 3
Let’s also keep track of the average spans of the model maximum and minimum temperatures for 1950-2005, because, very oddly—very, very oddly—the ranges seem to capture the observations-based data almost perfectly. The average model spans are calculated simply as average modeled maximum values for a variable for 1950 to 2005 minus its average minimum values. For the Los Angeles Mean Daily Maximum Temperatures, the span of the modeled temperatures averages 2.3 deg C for 1950-2005. And for the Los Angeles Mean Daily Minimum Temperatures, the span averages 1.8 deg C.
The model-data comparisons for New York are next, Figure 4. For the New York Mean Daily Maximum Temperatures, the models double the observed warming rate, and for the New York Mean Daily Minimum Temperatures, the trend of the model median matches the observed trend.
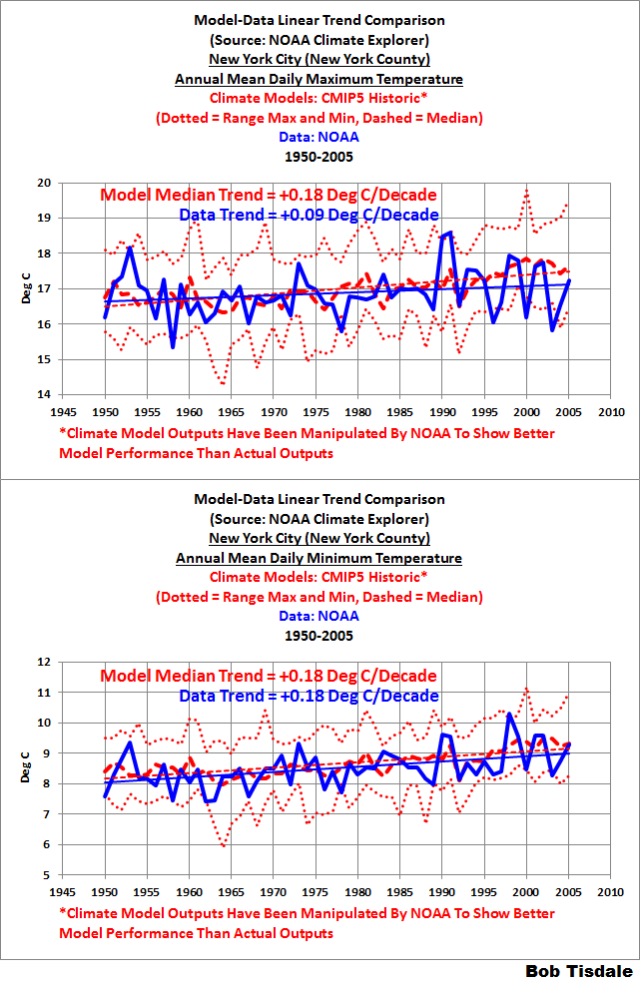
Figure 4
There is apparently no consistency in model performance. For New York, the models performed poorly for the Mean Daily Maximum Temperatures, while for Los Angeles, the models performed poorly for the Mean Daily Minimum Temperatures. That’s a problem for users.
For the New York Mean Daily Maximum Temperatures, the span of the modeled temperatures averages 2.2 deg C for 1950-2005. And for the New York Mean Daily Minimum Temperatures, the span averages 2.5 deg C. Again, the ranges of the modeled maximum and minimum temperatures seem to capture the observations-based data remarkably well.
Figure 5 includes the model-data trend comparisons for Houston (Harris County). The trends of the data for both variables indicate very little warming from 1950 to 2005, and the models overestimated the observed warming for both variables by very noticeable amounts.

Figure 5
For the Houston Mean Daily Maximum Temperatures, the span of the modeled temperatures averages 2.2 deg C for 1950-2005. And for the Houston Mean Daily Minimum Temperatures, the span averages 2.1 deg C. The models continue to perform unbelievably well. The operative word in that sentence is unbelievably.
Last but not least, Figure 6, the model-data comparisons for Chicago (Cook County). Like Houston, the Chicago data show very little warming from 1950-2005 for both variables. In fact, the Mean Daily Minimum Temperatures for Chicago show no warming at all based on the linear trend. But according to the models, there should have been noticeable warming rates for both the Mean Daily Maximum and Minimum Temperatures for Chicago, if Chicago temperatures were governed by the forcings that drive the climate models.
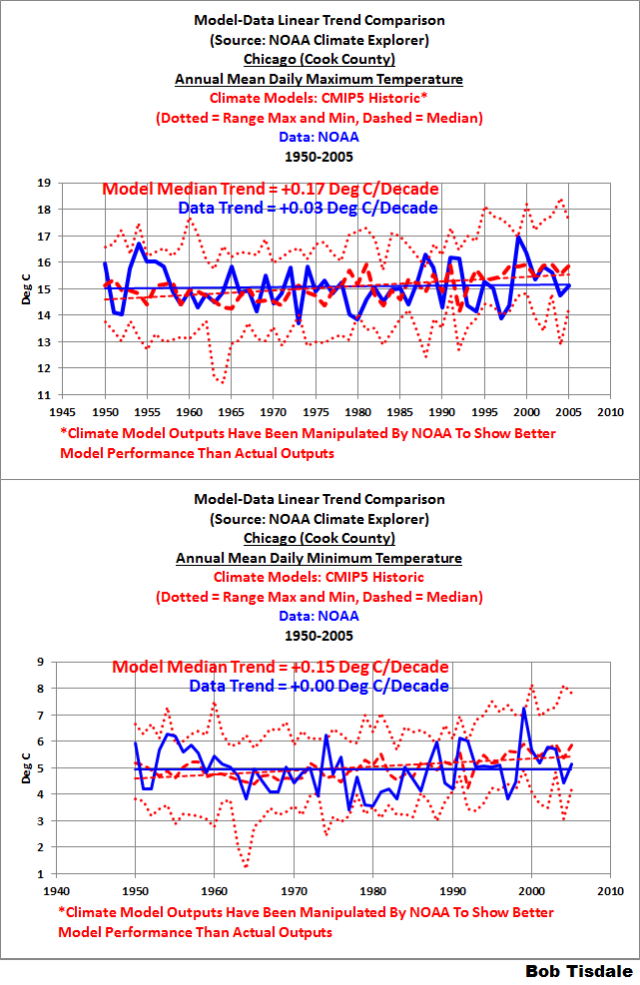
Figure 6
For the Chicago Mean Daily Maximum Temperatures, the span of the modeled maximum and minimum temperatures averages 3.4 deg C for 1950-2005. And for the Chicago Mean Daily Minimum Temperatures, the span averages 3.1 deg C.
Contrary to what NOAA suggests with their statement, the climate model outputs presented by NOAA indicate the models have a very poor “predictive ability”.
WHY THE MODEL SPANS SHOWN BY NOAA LOOK ODD
We discussed and illustrated modeled and observed surface temperatures on a global basis in the November 2014 post On the Elusive Absolute Global Mean Surface Temperature – A Model-Data Comparison. There we discovered that the span of the modeled global mean surface temperatures on an absolute basis was roughly 3 deg C.
Yet, supposedly using the same models, NOAA is showing comparable and smaller spans for their absolute Daily Minimum Temperatures and Daily Maximum Temperatures on regional bases. Would we expect the model spans to be comparable both regionally and globally or would we expect the regional spans to be much greater than the global spans?
ACTUAL SIMULATED ANNUAL MEAN DAILY MINIMUM TEMPERATURE OUTPUTS FOR CHICAGO (COOK COUNTY) FROM THE MODELS STORED IN THE CMIP5 ARCHIVES
As examples of the actual modeled ranges and spans of simulated annual mean daily minimum temperatures for Chicago (Cook County), I downloaded and plotted the model hindcasts (1950-2005) that are part of the runs with the RCP4.5 and RCP8.5 scenarios. Both are available from the KNMI Climate Explorer, specifically the Monthly CMIP5 scenario runs webpage. To get a rough idea of the modeled Tmin ranges and spans for Chicago, I used the coordinates of 40N-42.5N, 90W-87.5W, with land-only values due to its proximity to Lake Michigan (assumes the models simulate that Great Lake). I’ve also shown in thicker red curves the values presented by NOAA.
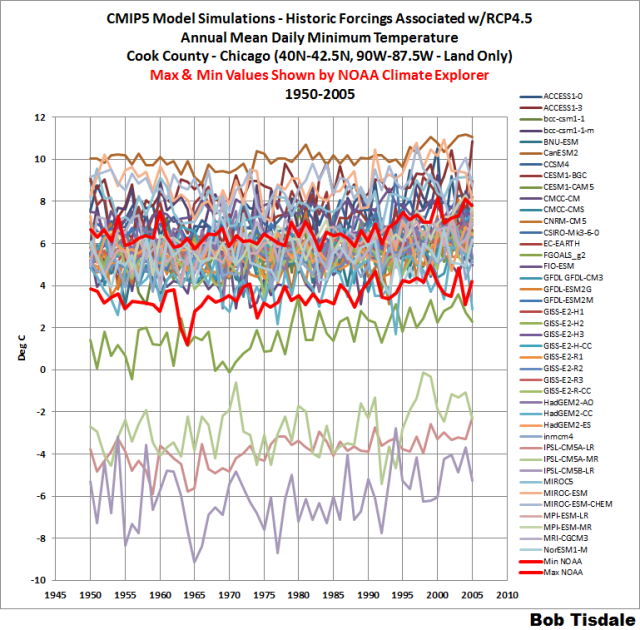
Figure 7
# # #
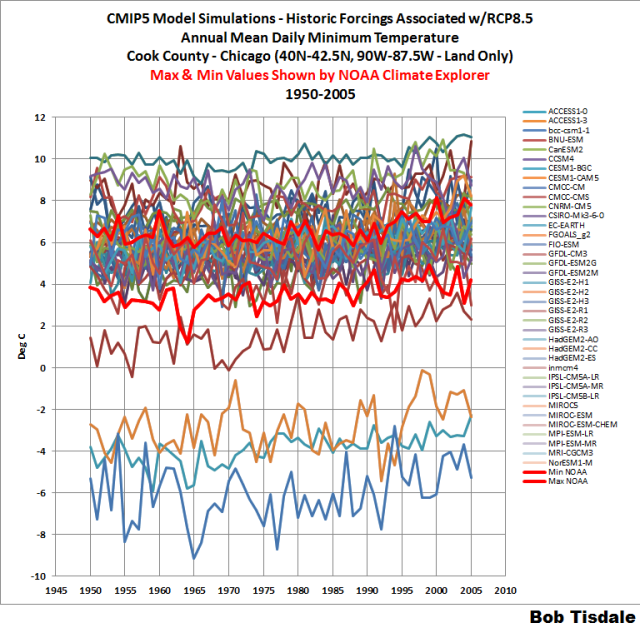
Figure 8
Figures 7 and 8 show the actual modeled ranges and spans of simulated (hindcast) annual mean daily minimum temperatures for Chicago (Cook County) for the RCP4.5 (Figure 7) and RCP8.5 (Figure 8) scenarios. In both cases, the average minimum simulated daily Tmin for Chicago is roughly -6.0 deg C for the period of 1950-2005 and the average maximum simulated daily Tmin roughly +10.0 deg C, giving a modeled Tmin span of roughly 16.0 deg C, which is far greater than the hindcast and forecast changes in temperature.
Yet NOAA is showing a span of roughly 3 deg C and saying, in the text accompanying their presentation, one “can get a sense of climate models’ predictive ability for this variable in this county”.
Really?
HOW DID NOAA ACCOMPLISH THIS ILLUSION?
I suspect (but don’t know for certain) NOAA determined the climate-model simulated temperature anomalies for the variables, which drastically reduces the ranges and spans, and then shifted the results so that they capture the observations-based data. See Animation 1. It includes the Chicago Tmin data and model output presentations from the NOAA Climate Explorer in anomaly and absolute forms. The curves are exactly the same, where in reality they would not be because the actual range and span of the model outputs in absolute form is significantly different than shown.
Animation 1
And as a spot check, Animation 2 includes the same NOAA graphics for the Los Angeles annual Tmin. Similar results.
Animation 2
SOMETHING VERY IMPORTANT IS OBVIOUSLY MISSING
At NOAA’s Climate Explorer, visit a coastal city or town like Miami (Miami-Dade County), or New York City (New York County), or Los Angeles (Los Angeles County). What’s missing?
Sea level.
For communities near coastlines, possible sea level rise is the primary concern, not temperature, not precipitation, not heating or cooling degree days.
Is sea level addressed elsewhere in the NOAA U.S. Climate Resilience Toolkit? Dunno. I haven’t searched through all of the webpages. For coastal communities, it would have been logical for NOAA to include sea level on their Climate Explorer output pages. There’s tide-gauge-based data available from NOAA’s Tides and Current website. Makes one wonder what’s wrong with the climate model-based prognostications of future local sea levels.
CLOSING
For NOAA’s climate model output presentations at their newly updated Climate Explorer website and their claim there that users can “get a sense of climate models’ predictive ability for this variable in this county”, I nominate NOAA for the prestigious Handy Bullshit Button, first introduced by Roger Pielke Jr.

With Tom Karl retiring from NOAA, maybe the new head there will put an end to NOAA’s continued efforts to mislead the public about global warming and climate change. Sadly, I don’t think that’ll happen.
mr. tisdale: as long as obama is at the helm of our government, and, further, if hillary is elected to replace him, i agree with your following statement … and that it will be our unfortunate reality and challenge:
“With Tom Karl retiring from NOAA, maybe the new head there will put an end to NOAA’s continued efforts to mislead the public about global warming and climate change. Sadly, I don’t think that’ll happen.”
i, for one am voting for trump, for several reasons, but i do not feel comfortable in predicting how he will nominate regarding this critical position.
hmmm … we here in the USA have a very livable political system [assuming an informed and active citizenry], but like the remainder of humanity, it is not perfect [nor should it be].
[snip! wildly, stupidly, and annoying political and waaayyyyy off topic. Besides, the photo is a fake. Stop post this crap or your will find yourself banned. – Anthony]
Perhaps the difference between the Los Angeles Model Run (cooler) and Data Stats (warmer) is due to incorrect Karlation of the data
Perhaps they just need to Re-Karlate the model input
As a chef, I prefer the term Karlamize.
Bob, I couldn’t agree with you more, starting with the dislike of “weasel words” (for which I have generated a long list). However I believe you are missing a critical point, namely that regional predictions derived from global models are not and very likely never can provide accurate, meaningful, useful guidance. As mentioned, global models can (but not necessarily do) provide reasonable projections of global means, at least probabilistically (but never deterministically).
The same cannot be said of regional means on the variability on even the largest scales (e.g., continental) other than perhaps the more rapid warming of the Arctic versus lower latitudes. To speak of regionally useful projections at specific geographical points and time frames is totally ludicrous scientifically speaking. Models now and probably never will able to do that. The real hoax is claiming that by “downscaling” global resolution models to higher resolution grids resolves the problem. If the larger scales are off, the higher resolution output simply magnifies the error. The global model would have to be near perfect for the higher resolution downscale output to add more accurate, detailed output (any competent modeler with attest to the validity of this statement (though perhaps only off the record). The same hoax is not unusual in the private sector as well, most notably Climate Central.
Graphs which show very similar colours are completely incomprehensible. It’s impossible to discern the individual runs. As that isn’t necessary here, for the sake of this posting, then there is no need to show them at all. Just show an average. I appreciate your posting, as always, but it does annoy me when graphs are shown that are impossible to follow. The whole issue is complicated enough, and must always be simplified whenever possible. Both ‘sides’ are guilty of producing stuff that an ordinary person finds it rather hard to comprehend.
I shouldn’t do this ..but I must
NASA graphing tends – a glimpse into the future
oops, neglected the image
http://tinyurl.com/hsawzw2
better..
For this posting, displaying all of the model runs is important in order to show what a large range of inaccurate, wrong, misleading, cr@p results there are.
This just adds weight to Bob’s contention that there is no way they can be accurate with regional forecasts/predictions/scenarios/WAGs.
Bob
Love the animations. It does seem odd that they are identical. I have found another “exact duplication” when it comes to the raw data we try to use for studies. After monitoring the Sun and Moon rise and set times that are put out by the US Naval Observatory, started comparing year to year going back for some time. Seems that the last year and the one before that are identical. So I guess that is what we will get from our GVT when they are pressed for real observable data.
Are there real people tending to the helm up there?
Crying out loud, just went back and checked out their “disclaimer” page and it says that it is not real data…. So— that may just reflect on the quality of all of their data. All set in stone. Without observations, we have nothing to compare anything to. All just bullshit!
These non-Kardashian models work much the same as Kardashian models. You tell ’em where to go and how to wiggle.
For communities near coastlines, possible sea level rise is the primary concern, not temperature, not precipitation, not heating or cooling degree days.
B I N G O !
Then its a good job this actually does include sea level data (as I found with a single google search)
“The Climate Explorer allows coastal communities, for example, to overlay anticipated sea-level rise with bridges in their jurisdiction in order to identify vulnerabilities”
“Anticipated”! There’s a great word in the scientific lexicon!
As noted earlier though, it isn’t based on real data. That makes it what we refer to as “useless” in the scientific community. Not bad for government work though. Just need to read the fine print?
Thanks for the reply, the average news story prints preposterous claims, here’s one from today’s sea level news search:
Public News Service
Report: Rising Tides, Rising Concerns Over Sea Level Rise
… sea levels could rise by six feet or more by 2100 …
http://www.publicnewsservice.org/2016-08-22/environment/report-rising-tides-rising-concerns-over-sea-level-rise/a53623-1
Bob- Excellent post! NOAA completely ignores evidence of how poor the multi-decadal climate models perform when tested in hindcasts; eg. see cites we include in https://pielkeclimatesci.wordpress.com/2012/10/09/quotes-from-peer-reviewed-paper-that-document-that-skillful-multi-decadal-regional-climate-predictions-do-not-yet-exist/
It would be valuable for you to write your post up and submit to one of the open review EGU journals.
Roger Sr
This needs to be plastered onto many billboards in southern Louisiana.
http://www.cpc.ncep.noaa.gov/products/predictions/long_range/lead14/off15_prcp.gif
ROFLMAO!
Rapid climate change caught them off-guard!
With the proper adjustments…they can fix that
Adds new meaning to the old adage “A picture is worth a thousand words.”
Those outlook maps never seem to have an area marked ‘N’ for normal, even though it’s in the legend
If everyone on this site wrote to Lamar Smith, and/or Ted Cruz, and cc’d the appropriate persons at NOAA, plus the house and senate reps from their own districts, about the nonsense it would help. It would particulallry help due to the fact that a large number of regular commentors here can use those 3 little letters behind their name, that tend to get some attention, (aka piled-higher-and-deeper). And even more of you have specific education on this subject matter that you can cite in your communication.
I’ve been invovled in House testimony where a junior rep talked about the “overwhelming” response from her district, and when queried by the chair had to admit that it was basically 22 letters, all from Marin County, (a very clearly representative cross-section of the U.S. public opinion).
Sometimes a few hundred well contructed letters from folks with credentials can make a big difference.
Right on. The detailed and sometimes complex articles normally found here are great for the readers but it would be extremely useful to have condensed versions — esp.of those that clearly show NOAA fun and games that readers could forward to representatives — i.e., versions that they could understand.
‘Watts Up With Those Cliffnotes’?
Your “BS” button is so harsh. I prefer a different term, as demonstrated by the following story.
A man dies and goes to Heaven. When he gets there St Peter tells him,”this is not well known, but you still have a choice between Heaven and Hell.”, to which the man replies “Can I take a look at Hell before I decide?” St. Pete says “Yes”, so the guy goes down to Hell to have a look around.
In Hell the Devil shows him the place. Imagine a gigantic ballroom that goes on forever in every direction. Every kilometer there is a different party. Different music. Different booze. Different food. Different women, and so on.
So, the guy goes back and tells St. Peter that he never really got to have that much fun in his life, so he chooses Hell.
When he shows up back in Hell, it is horrible. Fire. Brimstone. Endless suffering. He turns to the Devil and asks, “What happened to the party”, to which the Devil replies “Oh, that was the demo.”
So, maybe this new Climate Explorer is the demo.
About 40 years ago I developed computer models for Supercritical Steam Power plants and Nuclear Power plants. These models were used for developing the accident analysis need for regulatory approval and for developing full scale simulators used in operator training. Back then this was done with punch cards on a remote “main-frame” (which had less power than the CPU in todays cell-phone). If I had spent the amount of time they did, and wasted the thousands of hours of computer time as they have, and my end product was this farcical and inaccurate I have been escorted out the door with no chance to even get my personal belongings. Same would also be true for the “models” used in the IPCC climate change prognostications.
Why does any intelligent person accept this BS?
GIGO’d from the Gitgo. Large scale firings please.
Bob, you still owe me an apology for last October. Admit publicly that you made a mistake and apologize. Aeno
Arno
I assume you refer to your tgread of 29 Oct. Perhaps if you had not turned the the heat up with this reply, Bob would have kept up a dialogue with you –
“Johannes Herbst October 30, 2015 at 2:41 am says that “…Arrak arrak-ized the satellite and the HADCRUT3 data by selcting the yellow temperature points …” You are an obnoxious twerp. A yellow dot marks the instantaneous location of global mean temperature. It is the midpoint between an El Nino peak and the bottpm of its nearest La Nina valley. If there is no warming they line up horizontally as they do in figure 1 (15). The rest of your babble is garbage and all of it should be snipped.”
Instead a little later on you said this, to him –
“You are poorly qualified to judge scientific results but you still have the nerve to question my integrity as a scientist. You owe me an apology for shoving that graph into my face. Unless you can prove that your temperature curve for the eighties and nineties has a source other than yourself it must be regarded as a crude intimidation intended to change scientific results. If, on the other hand, if it does come from an external source please be kind enough and give me the full name and address of that source. Showing such an obviously bogus, anonymous, satellite curve just does not cut it in a scientific controversy.”
I tink his postings here more than qualify him to judge. It may be out of context, and after Bob called your findings garbage after the first reply was posted, but I still remember this particular post and how unpleasant you came across. Perhaps if you had the grace to apologise for that first appalling reply and subsequent reply to Bob you may instigate a dialogue again. Otherwise I would expect him to ignore you still.
Sorry if I have got this wrong Bob but I enjoy lively and passionate debate here but its a shame when it devolves into name calling and bad mouthing. I enjoy your postings enormously even if they do have me scratching my thinning head a bit and can only thank you for the huge amount of time you have put in to educating me (along with Willis!)
The NOAA forgery is about as convicing as the GW Bush National Guard papers, and about as easy to find.
There’s a puzzle in our newspaper called, I believe, “What’s Different?” Two cartoon panels are nearly identical except for a missing line, flower, button on clothing, or a hat at different angle, flower box moved, etc. in one of the panels
That animation would drive fans of that puzzle positively insane! It had me going for a minute. I thought I was missing a software update or something.
One phrase used in the NOAA description of their ‘product’ leaped out at me, and it is nagging me for my professional observations as a Physical Chemist. The phrase is ‘heat-trapping gases.’
There is no such thing, and NOAA should know that.
The phrase ‘heat-trapping gas’ conjures for me an image of a gas molecule with delusions of being Maxwell’s Daemon, telling heat where it can and cannot go.
Gases may absorb heat, radiate heat, and hold heat, depending on certain physical properties – the infrared absorbtion spectrum, the thermal emission spectrum, and the molar heat capacity, respectively.
Compared to nitrogen, oxygen, and argon (99.96% of the atmosphere), methane, water, and carbon dioxide have higher heat capacities.
To give you an intuitive ‘feel’ for ‘heat capacity’ imagine a brass doorknob on a wooden door. Assume both are at the same temperature (room temperature, about 20-25°) and your body is at normal human body temperature (37°). If you touch the doorknob heat will flow out of your hand into the doorknob faster than it would flow from your hand into the wooden door, making the doorknob FEEL cooler than the door. The heat capacity of the brass is higher than that of the wood, as is its ability its ability to *transfer* heat (thermal conductivity, related to heat capacity). It takes more of your body heat to warm the surface of the doorknob to body temperature than it would to warm the door.
Note that if the door and the knob are both at the same temperature as your body, they would feel neither warm nor cool. Under these conditions heat will not flow. Heat needs a temperature DIFFERENCE to flow – from warm to cool. (Newton’s Law of Cooling)
When a molecule in the atmosphere absorbs infrared radiation, the first thing that happens is it gets ‘hotter’. This raises the average energy of the molecules in a small area of the atmosphere – the ‘temperature’ of that little packet of air. When the temperature increases, the pressure and volume increase (the Ideal Gas Law).
When the volume increase, the density decreases and (if the air is free to move) Archimedes’ Law takes over, making the less dense (buoyant) area of air rise (Convection), which lowers the temperature and pressure (the adiabatic process), until it is again in equilibrium with the air around it.
Preventing convection is what makes a ‘greenhouse’ work.
The main effect of raising the concentrations of methane, water, and carbon dioxide is to create a SLIGHT increase in the ability of the atmosphere to hold heat.
Basically it merely makes the blanket of air around our planet a teensy bit ‘thicker’ and a better insulator.
Thanks for the clear explanation of the falacious “heat trapping” claim. Would be nice if you could explain how it works to the World Leader.
TY for that…….as a layman i have pointed out for decades insulators do NOT “trap heat” they do slow its movement but they never “trap” any heat……..now i expect the other fellow to attack my intelligence with some inane link.
This explanation is wrong. Convection cannot explain the heating of the atmosphere since the earth is surrounded by a vacuum and so there cannot be any change in the average temperature of the earth due to
convection.
Nor does a molecule get hotter when it absorbs infrared radiation. The first thing that happens is that it moves to an excited state (typically a vibrational state). It can then re-emit the radiation (called scattering) in a random direction (i.e. 50% of the time up into space and the other 50% of the time back towards the earth) or there will be a non-radiative decay back to the ground state with the energy going into the thermal motion of the molecule.
at say one mile above the surface any radiation released by the co2 would be released at random but far LESS than 50% of a random dispersal would be back towards the surface…and this also brings me this question since the radiation left the earth moving UP why does it do that? and once released what force would alter its course away from the earth?
Interrupted and waylaid.
Reality imitates models.
partially
This is a post with a lot of data to understand.
… I am still reading it…
Every time Bob T posts, I get buried.
Just a comment from an ex-Chicagoan… through the 1960s “official” Chicago/Cook County temperature measurements used to be made at Midway Airport; sometime in the 70s, if I recall correctly, the official weather station was relocated to O’Hare Airport. O’Hare is much further from Lake Michigan than Midway is. The western suburbs (where O’Hare is located) do not enjoy the lake effect cooling.
This has happened in a number of places. We have been watching the situation for Corpus Christi, Texas for years. Moved from a more maritime climate to the inland airport. Especially important because of the (usually) near desert conditions in South Texas. Also for the vegetation.
With all the adjustments made to raw temperature data, does anyone know if the temperature readings from Corpus Christi and Chicago have been adjusted downward since the stations moved to warmer conditions? If not, why not?
Everything is OK.
From the Climate Explorer Page.
“Climate Explorer projections are based on two global climate model scenarios that describe changes in the abundance of heat-trapping gases in Earth’s atmosphere through 2100. The tool provides projections for climate variables such as changes in the number of days over 95°F, number of days with heavy rain, and heating and cooling degree days.”
Which two models? Local coastal meteorologists give us several, as in hurricanes, of course that is usually just called weather. However, I have watched the evolution of hurricane models (both weather and climate types) for half a century. I seem to recall that they have long had something to do with heat. Like I was taught that they help dissipate it from the tropics to higher latitudes.
The sad part is that coastal communities have done a poor job with resilience, with a lot of help from incentives from the states and federal government. Another federal government program, circa 1970s, the Coastal Zone Management Program, was supposed to take care of some of this sort of thing, but I guess got sidetracked into protecting the environment and other things.
Another Suggested Disclaimer: Temperature forecasts seen in the NOAA mirror may appear larger than actual size.
This post introduces readers to a newly revised “product” from NOAA
The problem, for me, is that I now see ‘these people’ as being required to produce ‘science’ upon demand.
(policy driven evidence manufacture).
I have always had a problem with individual ‘papers’ but, of late, it seems that the ‘barrier’ has been torn down. It (the eye opener), for me, was the sudden discovery, before Paris, that there was no pause.
I had always thought that one could buy ‘science’, to an extent, promoting a particular ‘world view’ but had, naively, presumed that one was always constrained by real world data and ‘caught out’ eventually. Not so.
Sorry Bob, I do appreciate your work … But I didn’t read past “newly revised “product” from NOAA”.
(I fully expect the ‘usual suspects’ to arrive soon defending the faith but …)
One thing notable is that in HadCRUT and RSS TLT, a linear trend starting at the beginning of 1979 (or even earlier in the 1970s for HadCRUT) and ending at a chosen breakpoint, and another linear trend starting at this breakpoint and ending either with the most recent datum or when the recent El Nino started, meet each other at the breakpoint when the breakpoint is chosen to be somewhere around 2004. Note the great slope change. The true start time of The Pause seems to me as being then, or just a few years earlier when the endpoint of the first linear trend is chosen to maximize its slope. Try this yourself with the WFT tool – they just got HadCRUT4 current, and this also works for HadCRUT3 during the time it was calculated.
The slope change is apparently from a multidecadal set of natural oscillations, especially AMO.
And notably, the ~2004 breakpoint is close to when the CMIP5 models transition from hindcast to forecast.
Where I think the models went wrong: Assuming AMO and the like don’t exist, so they were tuned to have AGW great enough to account for the warming that actually was from AGW and a multidecadal upward trend combined.
Since the period of the multidecadal item showing up well in HadCRUT is around 64 years, I think the divergence of global temperature from CMIP5 forecast will continue growing until around 2035. After then, if the multidecadal cycle continues (it may do something different because it is noisy), the shortfall of global temperature from CMIP5 models (probably the RCP4.5 or RCP6.5 consensus, more likely 4.5 due to methane increasing slower than projected) would stop growing and hold steady through around 2065-2070, and then start growing again.
I have to agree with Forest, “the proof is in the pudding”. If you give me enough moments I can fit front passenger side tire failure rates to rainfall in Alabama.
I’m not particularly proud of that BTW and I’ve never done it. Well, there was that one time when they offered truly obscene amounts of money. I’m still not proud though.
Data? We don’t need no steenking data!
It is so yesterday that we needed to adjust data.
Now, us progressive guvmt scientist types have transcended the data adjustment barrier and have learned to adjust models directly! If models give you a 16 degree C spread, simply adjust them to a 2-plus degree C spread. Those damned contrary thermodynamic effects on water vapor and clouds thusly go away. The physics are then whatever we choose to say they are!
Now, if we could just disappear Bob Tisdale. That fool keeps trashing our pal reviewed science! Data, data, data, all he has is data. Now that we can adjust model outputs, he ain’t got nuttin.
“The light gray band shows the range of model data (hindcast) for the historical period. To get a sense of climate models’ predictive ability for this variable in this county, compare the year-to-year variability of observations (dark gray bars) with the range of modeled projections.”
Whoever in the government wrote this is either an unabashed propagandist or a fool. A comparison of year-to-year observations to the range of projections says nothing about predictive ability. To prove this point, imagine a cruder model that doubled the width of its “range of modeled projections” i.e. the cruder model is less precise in its predictions. Yet, by the logic of NOAA, since all of the observations (dark gray bars) would still be within the model projections (REALLY wide light gray bars), this cruder model has just as much predictive capacity in its future trends as the other model.
There is only one way to evaluate a model’s predictive capacity. Wait and see whether its predictions come true.
AR5 model means predicted (projected, for sycophants) a hot trend from 2005. The trend didn’t happen, even with 2014 blob and 2015-16 El Nino. What is confounding, people allowed them to hindcast hotter than actuals! It strains credulity that thinking people would allow AGW proponents to use the envelope of super hot vs cold models to imply a range of statistical probability. Hot model speculation or cold model speculation, it’s all speculation.
“A comparison of year-to-year observations to the range of projections says nothing about predictive ability.”
They are the best tool modelers have.
Later versions of climate models will be further refined.
Jim Yushchyshyn
They have had 26 years (1988 to 2016) since Hansen first extrapolated his career higher, his future temperatures higher and his room temperature higher, and NO GCM computer has gotten ANY more accurate despite all of the billions spent propping up their theory. their models, their elaborate computers and thousands of self-called climate “scientists” ….
I wish very much I might leave one of those screeds about “global Warming”, or even something else important.
Because Global Warning is important. It’s way past important. It is without doubt the most important subject in the table. So now what do we do?
Well? In my opinion we engage the most attractive women on the planet and we ask their opinion. Mother Earth. Not rocket science. So. Ladies? Where is this all going? Time to weigh in? No time like the present!
Thanks for your support!
“
On the table! If i wasn’t so drunk I could do this sober.
Computer models have their limitations. They often fail to take PDO and solar activity into account. These models may even be wrong about how much carbon dioxide people put into the atmosphere. But, climate models are not the basis of the fact that carbon dioxide is a greenhouse gas. Direct measurement of the infrared spectrum of carbon dioxide is.
http://www.woodfortrees.org/plot/gistemp/from:1972/scale:200/plot/gistemp/from:1972/trend/scale:200/plot/sidc-ssn/from:1972/plot/sidc-ssn/from:1972/trend/plot/esrl-co2/from:1972/offset:-320
And, while the Sun cools, Earth continues to warm.
http://www.woodfortrees.org/plot/gistemp/from:1972/scale:200/plot/gistemp/from:1972/scale:200/trend/plot/sidc-ssn/from:1972/plot/sidc-ssn/from:1972/trend/plot/jisao-pdo/from:1972/scale:50/plot/jisao-pdo/from:1972/scale:50/trend/plot/esrl-co2/from:1972/offset:-320
Correction for the first link
http://giantsoftheinfinitesimal.co.uk/images/education/large/panel-f-spectra-co2.jpg
Jim:
Mylar balloons of CO2 cast no heat shadow.
i.e.; CO2 is actually IR-transparent.
My biggest peeve now with all the climate forecasts is the inclusion of the extreme case of 1200-1400ppm CO2. Today we are at 400ppm and in 1945 we were at 310 so we’ve gained 90 ppt in 70 years. In another 85 years, we will probably gain LESS THAN 90ppm because I assume that by then we will not be as dependent on fossil fuels for a million reasons besides the effort to reduce them today. Technology will have changed so much that it is inconceivable that we are using the same energy sources or that they have the same outputs. So, this means we will have at most 500ppm by 2100 or maybe on the farthest fringes of possibility 600ppm.
Putting in the 1400ppm case is simply a matter of propaganda. By putting this scenario into all their projections they can have these lines you see in the charts they produce which go off to ridiculous temperature increases. When you put the uncertainty in the charts produced by their explorer show that temperatures could rise 6 degrees C or so. Of course this depends on their CO2 supercharged models which produce massive temp change from CO2 so having a ridiculously high top end scenario biases viewers to believe that this is remotely possible when it isn’t.
I believe the IPCC does this in all its graphs for exactly the same reasons. By showing the 1400ppm line they have graphs that look scary because everyone focuses on the highest line as being the likely line since the other lines are all bunched up at lower temperatures one gets the feeling like the trend is massively up and you are driven psychologically to look at the potential increase.
If they removed the 1400ppm line and produced 3 scenarios which are more realistic say 400ppm in 2100, 500ppm in 2100 and 600ppm the graphs would look dramatically different. Of course, if they also cut their absurdly high supercharging of sensitivity to CO2 to a more realistic number it would also show that the total temperature change in 2100 would be under 1C more than today. Of course, they could always still exaggerate the graphs with their anomaly presentations so every tenth of a degree looks like a huge thing and still make it look somewhat scary people do have a sense that tenths of a degree aren’t a big deal.
I believe we should eliminate all graphs with the top line estimate and simply show the scenarios I suggest or the 600ppm scenario from the IPCC I believe this is called the 2.5 scenario.