Guest essay by David Archibald
The warning signs have been there for some time now – persistent failures of the wheat crop in Norway for example. The North Atlantic is cooling. The cooling trend was evident at the time of an expedition to investigate this phenonemon three years ago. The rate of cooling has now steepened up since then based on the latest data collated by Professor Humlum of the University of Oslo. From that data set, this graph shows the heat loss since 2004 for the top 700 metres of the water column:

Figure 1: Monthly heat content anomaly in the uppermost 700 metres of the North Atlantic
As Figure 1 show, North Atlantic heat content peaked in 2004. The decline since the peak has been steeper than the rise. What would be the reason for 2004 being the peak year? Part of the answer may be that 2004 was the second peak of Solar Cycle 23 with a big increase in the proton flux. Another part of the answer may be that there was a big fall in the Ap Index in 2005 down to solar minimum-like levels followed, a couple of years later, by a discontinuity as the level fell through the floor of the established minimum level of activity. That is shown in this graph:

Figure 2: Ap Index 1932 – 2016
We might not care too much about the animals that live in the North Atlantic water column but the temperature of the surface is the main control on the climate of Europe. So what has that been doing?

Figure 3: Time series depth-temperature diagram along 59 N across the North Atlantic Current from 30° W to 0°W.
As Figure 3 from Professor Humlum’s work shows, summer heating is penetrating to half the depth it used to 10 years ago and in winter earlier this year sub-8°C water was at the surface for the first time in more than ten years. That cooling trend is quantified in the following graph:

Figure 4: Average temperature along 59° N, 30°-0°W, 0-800m depth
This is data from the main part of the North Atlantic Current. The average temperature has fallen 1.0°C from 2006 to 2016. That is a trend of 1.0°C per decade but with 60% of the cooling in the last two years. Europe’s climate has responded with snow down to 2,000 metres in August in Germany this year. And how much lower can the North Atlantic temperature go? The lowest point on Figure 1 was in 1973 during the 1970s cooling period and corresponds to a fall of a further 1.5°C. At the decadal trend since 2016, we would get there in 2031. At the trend of the last two years, we would get there in 2021. That is supported by what is happening to solar activity. Over those last two years the F10.7 flux has been in a steep downtrend:

Figure 5: F10.7 Flux 2014 – 2016
Figure 5 shows that the F10.7 flux is in a steep, orderly downtrend that will take it to the immutable floor of 64 about three years before solar minimum is due. After that comes Solar Cycle 25. Back in 2003, esteemed solar physicists Ken Schatten and Kent Tobiska warned that:
“The surprising result of these long-range predictions is a rapid decline in solar activity, starting with cycle #24. If this trend continues, we may see the Sun heading towards a “Maunder” type of solar activity minimum – an extensive period of reduced levels of solar activity.”
They got the decline of Solar Cycle 24 right and the North Atlantic cooled in response. If they get the “Maunder” part of their prediction correct too, then it will be some years before North Atlantic cooling bottoms out.
David Archibald is the author of Twilight of Abundance (Regnery).
If this trend continues, we may see the Sun heading towards a “Maunder” type of solar activity minimum
The weasel words ‘if’ and ‘may’ stand out. As far as cycle 25 is concerned, the preliminary data shows that the cycle will not be smaller than cycle 24, and likely even a bit stronger as the solar polar fields are still building.
Globally there is no evidence of cooling:
https://news.slashdot.org/story/16/08/20/166208/every-month-this-year-has-been-the-hottest-in-recorded-history
Based upon one data set, GISS, which A) does not cover the entire globe for anything approaching completeness since 1880 (As is claimed in your article’s source) and B) does not agree with other data sets.
Exactly the same can be said about the data from the Northern Atlantic…
Yes, except no one claimed it was complete since the 1880s, and it was looking at a short term trend of the last decade or so of the satellite era.
Which means that it is too short to qualify as a climate record.
lsvagaard~ But the North Atlantic does not cover the entire world and he didn’t claim it did. The GISS data set however IS being claimed to cover the entire world according to Arsivo (above).
ClimateOtter, Not me. lsvaalgard claimed that there was no global evidence of cooling and then posted a slashdot link as his backup.The following quote is from a source story from the Slashdot link posted by lsvaalgard (http://www.citylab.com/weather/2016/07/climate-change-record-heat-global-warming/492131/) which reads; “That’s the longest streak of record-busting temperatures in observations dating back to 1880.”
lsvaalgard: And he didn’t claim that it was a climate record, just showing what the cooling of the North Atlantic means to Europe’s weather, which if it lasts as long as is suspected that it will lead to a colder climate for Europe.
Despite your “weather” vs “climate” snobbery, climate is simply a long term average of weather, which means that, for any predictions to work, it needs to start with weather. It cannot work the other way because averaging removes information you need to predict the weather.
As such, this is a prediction based on several principles the author couples together. The coupling seems logical, and it could be a set of parameters that moves the prediction from weather and into climate if it lasts long enough. Should the prediction comes to pass, it will be more useful than the climate models’ predictions for the European continent. If it doesn’t, it’s one more corpse for the wastebin of science.
http://berkeleyearth.org/wp-content/uploads/2016/08/Trend_Map_since_1970.png
http://berkeleyearth.org/wp-content/uploads/2016/08/Trend_Map_since_1900.png
The claim it isn’t cooling is dumb and untrue.
Further – this represents a loss of about 4 mm of steric sea level.
Steve Mosher:
Cute charts. So, tell me, how extensive was the Pacific temperature recording network in 1900? Or are these model infilling? Knowing your work, I’ll guess the latter. On that same vein, how extensive was the arctic temperature recording network in 1970? I’ll guess more model infilling.
As you well know, from your professional work, infilling has issues in areas where the temperature network is good. The arctic and antarctic infilling, where “the most warming as occurred” is so lacking in extensive temperature data that these charts are jokes.
Note that your charts are poorly labelled. “Since 1900” has had less warming than “Since 1970”. Odd how 117 years warms less than the final period of 47 years in that same 117 year span.
I’ll also note that your obviously selected start date of “1970” pushes the current (or perhaps “ending”) heat cycle squarely into the previous cooling cycle. No doubt that wouldn’t exacerbate any warming trends, would it?
lsvalgaard August 21, 2016 at 9:46 am
Which means that it is too short to qualify as a climate record.
And a century is? You beg the question with such a statement. The concept of climate implicitly presumes some sort of equilibrium in weather over some span of time. That condition is not present at any time scale in geological history, nor, as you point out, in short term cultural data. You need a sounder definitional basis before any theory of climate is going to look any better than the current food fight.
Once we [eventually] get a good theory of climate, the proper time scale(s) will be determined by the theory. An example of this is the time scale for the so-called Kp index of geomagnetic activity. Initially, it was [rather arbitrarily] set at three hours [giving a compact characterization of the activity]. Today we know that three hours is the time it takes the solar wind to flow past the magnetospheric tail of the Earth, so is a physically meaningful length of time.
@Steven Mosher, re: August 21, 2016 at 12:23 pm
The majority of that arctic warming for the years 1970-Present you present–as Joe Bastardi has noted during his recent Saturday summaries–has occurred during the arctic winters (and Bastardi includes warmth during the Antarctica winters as well, which is happening right now). Regular schmoes can see it for themselves graphically by clicking through the years you cite at the government-run Danish site: http://ocean.dmi.dk/arctic/meant80n.uk.php
So I and the rest of humanity are supposed to get all meshugenah because the arctic temps in the winter went from -35C to -29C? That’s the global warming everyone has their panties in a knot over? Because it sure as Hades hasn’t occurred during the summer months, according to the Danish record since 1958.
if you ask me, Berkeley Earth should be more forthcoming amd straighforward with their info.
Sorry for the typing typos. I know how to spell.
Arsivo, I think you are misreading the chart. The two charts aren’t aggregate temperature increases since 1900/1970, they are annualized trends.
However, the prediction that we will have at least a 1970s type AMO minimum is not totally without foundation. The bottom of the AMO cycle appears to be synced with the periods of very low solar magnetic activity. The prediction has been made, now we get to test it. The lower enthalpy of the upper ocean, however, violates the prediction that the earth will retain more enthalpy due to the insulating effect of CO2. I predict it will be cooler in 2020 and cold in 2030. I now await the results of my predictions to see if my hypothesis is wrong. Phase lag in energy storage systems is a well known phenomena.
..A closed mind that is as brilliant as Isvalgaard’s is such a waste…..
““Your assumptions are your windows on the world. Scrub them off every once in a while, or the light won’t come in.”
― Isaac Asimov
If your predictions don’t come true, your hypothesis will be wrong. But if they do, that will tell very little about your hypothesis. It will just not be enough to falsify it. Just saying.
C’mon, Leif. What would be left of climate science if we banned weasel words. Mark Twain said it best:
One gets such wholesale returns of conjecture out of such a trifling investment of fact.
Aptly describes the present article. Archibald is a true alarmist.
It’s so fun to hear Dr. Svalgaard rail about Archibald, whose conjectures are purely that, but remain so silent about the AGW, the UN cudgel for global governance.
I wish I could totally respect Dr. Svalgaard.
Comments on AGW belong in a post about AGW and should not pollute every post regardless of its topic.
Right. Because AGW so inconsequential.
Eric Barnes said:
“It’s so fun to hear Dr. Svalgaard rail about Archibald, whose conjectures are purely that, but remain so silent about the AGW, the UN cudgel for global governance.
I wish I could totally respect Dr. Svalgaard.”
and
“Right. Because AGW so inconsequential.”
Whataboutism at its finest. From wikipedia:
“Whataboutism is a term describing a propaganda technique used by the Soviet Union in its dealings with the Western world during the Cold War. When criticisms were leveled at the Soviet Union, the response would be “What about…” followed by the naming of an event in the Western world.[1][2] It represents a case of tu quoque or the appeal to hypocrisy,[3] a logical fallacy which attempts to discredit the opponent’s position by asserting the opponent’s failure to act consistently in accordance with that position, without directly refuting or disproving the opponent’s initial argument.”
Eric Barnes…..spot on. I couldn’t agree more. I wonder what it feels like to be a brilliant “sell out”, assuming he is. Maybe he isn’t! My opinion, but Isvalgaard seems to ride the margin of respectability in both camps. In military terms…I wouldn’t go into battle with him because I just wouldn’t be sure if he would have my back or frag me at the first opportunity! I do respect that he at least lays out measurable predictions. At some point we may come to realize he is the biggest political genius in the climate business. Switzerland could learn a thing or two from his brand of neutrality….or not! Remember “Pat” from SNL? Oh well…forget about it. Keep up the good work Dr. Isvalgaard…I think! : )
Has Dr. Svalgaard never heard of el nino? (this sounds a lot like a comment from a “weasel warmist”)…
or the cooling effects of la nina?
EXACTAMUNDO !!! Skeptics made the same dopey sort of argument when we saw global temps dip back in ’08 (that global warming was over). You’re not going to find any “evidence of cooling” in the midst of an el nino…
Heh, except in the ocean.
============
I saved a copy of your post Mr lsvalgaard, we will see in time if you are right.
BTW why did you change all past solar records in July 2015?
Here is why: http://www.leif.org/research/Revisiting-the-Sunspot-Number.pdf
a much shorter version: http://www.leif.org/research/Revision-of-the-Sunspot-Number.pdf
and http://www.leif.org/research/Recalibrating-the-Sunspot-Number-CEAB.pdf
The short answer: because the Version 1 of the sunspot number has been found to be flawed in several respects. Flawed data should be corrected. Don’t you think so?
Not necessary to discard the 400-yr long old record when the flaws can be found and corrected.
Leif, thank you for posting this. Very thorough!
Forrest Gardener said:
“lsvalgaard says that flawed data should be corrected. I say it should be discarded.”
I don’t understand how people get themselves tied in such knots over this. Why on earth would you discard data rather than finding ways to allow for the flaws in the way things were measured?
As Willis posted further down in this discussion:
“FOR EXAMPLE: Suppose I took temperatures for ten years using several instruments, and later I found out that one of the mercury thermometers used for two years was ruled incorrectly at the factory and read one degree low.
QUESTIONS:
1. Should we use the raw data as it sits? or …
2. Should we throw out the ten years work because of the problem? or …
3. Should we simply add one degree to the incorrect readings and move on?”
So, what would you do? What are the practical implications of your quibbling over the definition of data in this situation?
What’s the difference between corrected data and bogus data?
You are assuming that you have found and properly corrected the flaws.
Your proof is that the new data matches what you think it should be.
You are assuming that you have found and properly corrected the flaws
If you find a penny on the ground, you do not assume that you found it. You actually did find it.
Same thing with the sunspot record flaws. They were found by noticing differences between observers, by actual statements that the counting method has changed, by comparisons with other solar data [e.g. the EUV flux], etc.
You clearly did not take the trouble to even read our papers on the corrections:
http://www.leif.org/research/Revisiting-the-Sunspot-Number.pdf
http://www.leif.org/research/Reconstruction-of-Group-Number-1610-2015.pdf
“We have reconstructed the sunspot group count, not by comparisons with other reconstructions and correcting those where they were deemed to be deficient, but by a reassessment of original sources. The resulting series is a pure solar index and does not rely on input from other proxies, e.g. radionuclides, auroral sightings, or geomagnetic records. “Backboning” the data sets, our chosen method, provides substance and rigidity by using long-time observers as a stiffness character. Solar activity, as defined by the Group Number, appears to reach and sustain for extended intervals of time the same level in each of the last three centuries since 1700 and the past several decades do not seem to have been exceptionally active, contrary to what is often claimed”.
Really bad analogy.
You did not find a penny, that is a physical object that you can pick up, hold in your hand and show to your friends.
These flaws are not physical things, in many cases they are little more than differences of opinion regarding how things should have been done.
That goes double for your “fixes” to these “flaws”.
An observer makes a drawing or a photograph of what he sees. These are very physical things and not just ‘opinions’, but measurements [i.e. data] of real things. Obviously you have still not read the papers I referred you to. Until you do that, your comments are void of meaning.
Leif said:
“You clearly did not take the trouble to even read our papers on the corrections:”
They won’t. This isn’t a scientific issue. It’s ideological. You can’t win this by reason.
In reply to Leif’s comment that the solar cycle 24 is not unusual and even if the solar cycle did abruptly change to a special mode, the planet would not cool.
The great thing about scientific discussions as opposed to political discussions is that from time to time observations can and do over turn fundamental scientific beliefs.
The “Bond Super Solar Minimum”
Observations support the assertion that solar cycle 24 is peculiar (See paper, “The Peculiar Solar Cycle 24) that lists all of the peculiar sudden changes that occurred prior to and during solar cycle 24). Solar observations (shrinking sunspots for example, the start of spotless days years before the solar minimum) support the assertion that solar cycle is entering into a ‘special state’.
Based correlation in paleo record (both hemispheres, same periodicity, cosmogenic isotope changes correlate with cyclic temperature changes, sometimes abrupt temperature changes) the planet will now significantly cool in response to the abrupt change in the solar cycle and abatement of coronal hole caused solar wind bursts.
As I have stated, there are more than 200 astronomical and solar system anomalies and paradoxes that support the assertion that the sun is significantly different than the standard model.
http://iopscience.iop.org/1742-6596/440/1/012001/pdf/1742-6596_440_1_012001.pdf
http://www.essc.psu.edu/essc_web/seminars/spring2006/Mar1/Bond%20et%20al%202001.pdf
http://cc.oulu.fi/~usoskin/personal/Miyahara_AG06.pdf
Observations support the assertion that solar cycle 24 is peculiar
There are [funding and ‘novelty’] reasons for people making such a wrong claim. SC24 observationally is clearly just like any other low-activity cycle [e.g. SC14, or SC12, or SC5], even to the point where was possible to predict its size correctly. SC25 already looks to be no lower than SC24, and likely a bit stronger.
Post 2005 the sun has entered an inactive mode therefore any predictions made based on solar activity from 1850-2005 when the sun was in an active mode are more or less worthless.
Disclaimer — i am not qualified to comment on any of this but enjoy reading it immensely — and can pick up a tidbit of info here and there.
I would like to say something about “correction of data” which I think is true. That is where “bias” slips in. Don’t correct data unless you give a full and complete explanation for each correction. Let us not go the Gavin Schmidt route. Man may measure all things but man is not the measure of all things.
You may help the data speak, just don’t put words in its mouth.
Eugene WR Gallun
Leif – what do you think of these informations?
http://notrickszone.com/2016/08/20/austrian-solar-charts-expose-small-sensation-fractures-co2-warming-theory/#sthash.oMC3eQt3.dpbs
Eugene,
If everyone here refrained from commenting on topics about which they weren’t qualified to comment, there would be at least 50% fewer comments.
There may be some topics upon which no one is qualified to comment.
Consider the specific heat difference between ice crystals and atmospheric moisture. There’s a definable amount of energy we will literally never see changing because we don’t bother to look at it.
“there is no evidence of cooling”……..That link is referencing fraudulent NASA/NOAA data. How fraudulent? Among other things it’s claiming this July in America was hotter than the infamous “dust bowl” years in the mid 1930s. That’s ludicrous and their own data proves it: https://www.youtube.com/watch?v=Gh-DNNIUjKU&feature=youtu.be&t=806
As you state “If this trend continues, we may see the Sun heading towards a “Maunder” type of solar activity minimum” contains the well known weasel words “if” and “may”.
Perhaps I might be permitted to rewrite the quotation: “any continuation of this trend will see the sun heading towards a “Maunder” type minimum.”
Exact;y the same meaning, no weasel words.
Oops, exactLy.
It’s still a conditional statement.
Is any conditional statement an example of weasel words?
I thought weasel words had to be words or statements that were intentionally ambiguous or misleading — like many of the statements typically appearing in Mr. Mosher’s comments.
I got on to say something along these lines.
I am a skeptic…I am in no way worried about global warming. But at the same time, this is a change in the atlantic that was more or less expected. I’m not going to say it is or isn’t tied to solar influences. But I will say that no dataset shows the kind of cooling one would expect if there were substantial global cooling. If anything it looks like it’s simply covering up the slow, harmless, overall rise in temperatures that’s been going on for over a hundred years.
It will have consequences, especially for europe…much as its warming peak coincided with heat waves. And I must say…having studied what is known from documented changes in climate…I do indeed concern myself more with the idea that there might be some global cooling. I don’t see it as a substantial issue or highly likely that there will be some significant cooling. I just know that between the two, cooling is a far greater threat…especially since the little ice age does stand out in so many ways that it makes me concerned that perhaps that temperature threshold is at the edge of the long slide into a new glacial period.
And once again, LET’S BE HONEST PEOPLE! There is no dataset showing some kind of meaningful cooling globally. I expect this would be something that could help to cause a dip in global temperatures…but we really do have to wait and see.
“The weasel words ‘if’ and ‘may’ stand out”.
Indeed they do.
They are regularly used by climate “scientists” when talking up their latest doom-laden model results.
“Globally there is no evidence of cooling:…..
….every-month-this-year-has-been-the-hottest-in-recorded-history”
Really…
I would have thought at your age you would have been able to recognise the difference between weather and climate, and be aware of precisely what the significance of a trend of seven and a half months is in the great scheme of things.
That is of course entirely leaving aside the debate over the relative reliability of the various temperature databases, there are those who would hesitate to bet their reputation for scientific impartiality on the accuracy of the NOAA version as opposed to the satellite versions.
what the significance of a trend of seven and a half months is in the great scheme of things. ?w=720
Enough said.
so 7 1/2 months can be significant? Excellent. let’s see what the next 8 months bring.
PA, he is talking about the NORTH ATLANTIC, not the worlds oceans.
As some people in Norway have already pointed out. There has been no cooling there and no failure of the wheat crop…
Here is a link for Norway wheat and it depends purely on the definition of failure. I would not describe this as a total failure but it certainly does not look too good to me. Dropping from a high of 450 down to 250 is nearly a 50% reduction. not a total failure but enough to cause shortages to occur
http://www.indexmundi.com/agriculture/?country=no&commodity=wheat&graph=production
Ah, Dr Svalgaard. The words ‘if’ and ‘may’ come from Dr Schatten’s paper. You are complaining about good, sensible, almost saintly Dr Schatten.
The complaint is about you not heeding the uncertainty those words imply.
“…The weasel words ‘if’ and ‘may’ stand out…”
Dr. Svalgaard-San: Have you ever used these words, ‘if’ and ‘may,’ in papers? What, never?
Of course, lots of times. They convey a sense of uncertainty which is proper. The problem begins when the ‘if’ and ‘may’s are treated as ‘when’ and ‘must’.
The problem begins when the ‘if’ and ‘may’s are treated as ‘when’ and ‘must’.
Dr. Svalgaard: Was that actually the case in this case, in your professional opinion?
Did you detect an unstated implication that it was the case, or formulate the impression that it was the case based on your intuition, or because you feel that you know David Archibald well enough to be able to judge this was his intention?
Or are there any clear overt signs that David actually treated “if” and “may” as meaning “when” and “must”?
Leif,
We all know you don’t have much time for Archibald but you shouldn’t let your emotions get the better of you. To suggest as a counter argument that GISS provides credible temp data is either devious or naïve in the extreme and doesn’t do much for your own credibility.
Even a bit stronger is still way weaker than cycles 22 and 23.
Of course the trend will continue, lower output is baked in the Solar cake thru cycle 25 completing long after you’ve passed.
Actually, I hope that cycle 25 is weaker than Sunspot cycle 24. Let’s see the “skeptics” explain the continued warming if it is.
Actually, I hope that cycle 25 does turn out to be smaller than cycle 24.
I’d love to see the “skeptics” squirm to explain the continued warming.
Bah, you know TSI hasn’t much variability.
==========
cycle 25 will be more or less equal to cycle 23
as this is a result of my analysis of the results on the Gleissberg cycle 86.5 years
http://www.nonlin-processes-geophys.net/17/585/2010/npg-17-585-2010.html
we had double [solar] pole switches in 1971 and 2014 as evident from the solar polar field strengths
so that was the half GB cycle
the next 43 years will be the [more or less] the mirror of the next 43 years [counted from 2014]
Added to the losses in ENSO it looks like the Atmosphere is going to have a lot less “sink” energy to rely on.
Added to a quieter sun could really bring some low temps to the Northern Hemisphere.
The Southern Hemisphere is already having some record breaking low temps.
The next 10 years could be see the earth heading in to very cold territory indeed.
well, we’re getting a total solar eclipse next year so….record hot!
Wow, that when the phrase “It is the Sun stupid”, gets in its full proper meaning, fully deserved…….
cheers
Looks like the NOAA fools who replaced temperature with joules ignored the ARGO most recent years for cherry picking reasons.
It also looks like any increases in ocean temperature NOAA was trying to finagle out of weak accuracy; have suffered serious reversals.
Now will come all of the favorite NOAA excuses.
• Aerosols
• Volcanoes
• sensor errors
• Arctic ice contaminating ARGO temperatures
• Mikey ate their research
I fully agree. We have no basis to compare the anomaly with anything. It could be huge or miniscule … we can’t tell. I suspect that’s what they’re trying for.
In the graph, Figure 1, above we have units GJm^2. (I read that as gigajoules meter squared. I used the caret because wordpress doesn’t seem to want me to use superscripts.) That makes no sense to me. GJm^-3 (gigajoules per cubic meter) makes sense. Can anyone enlighten me?
I believe you are correct commieBob.
As I remember Willis’s analysis of NOAA oceanic joules, he converted to cubic meter joules.
But I cannot claim remembering exactly what form of joules NOAA used.
Square meter joules is an planar area measurement without a thickness,
cubic meter is volume, with volume and content.
Which is an irritation whenever I read various watts per meter claims.
Watts per meter is an over simplistic reference to surface layers without thickness.
While solar cells may be referenced by surface area, the truth is that they have thickness and volume.
The volume is specified when the depth is specified, 700 meters. Google Argo floats.
The units there are GJ/m^2, which I would guess represent GJ/m^3 integrated over 700m of vertical depth.
“Looks like the NOAA fools who replaced temperature with joules…”
They missed a trick there.
If they’d used ergs, their big scary number would have had an extra seven zeros on it.
I’m surprised they missed that.
Why would they use ergs?
I have a strong feeling that you have no answer that is not a personal attack.
Jim Yushchyshyn: “Why would they use ergs?”
For the same reason that they converted a few hundredths of a degree of ocean warming into zettajoules (1 zettajoule = 1.0E+21 joules), because it turns a tiny non-frightening temperature increase into a big scary number to frighten the children and the bedwetters, so if they had used ergs they would have got an extra seven zeros, making it an even bigger, scarier number.
As one of the authors of the blogpost in 2013 that inspired O. Humlum to publish the diagramm at “Climate for you” ( see footnote there) I can say: We marked the decline in the upper heat content of parts of the northern Atlantic as a sign of a decline of the overturning and NOT as a direct impact of lower solar activity. Some links are under discussion, anyway, see https://www.researchgate.net/publication/260379066_Evidence_for_external_forcing_of_the_Atlantic_Multidecadal_Oscillation_since_termination_of_the_Little_Ice_Age
best
Frank
sign of a decline of the overturning and NOT as a direct impact of lower solar activity
For the true believers, such facts do not matter. Funny how self-described skeptics are not so skeptical when it comes to cooling alarmism.
I’m way too stupid to even opine, other than the observation that Leif seems to be channeling Mosher 🙂
Even if so, is that a problem for you?
@LSvalgaard
If you think this article is alarmistic, I would really like to know what you think of the pro-AGW articles written elsewhere on the web. Come on, this article is in no way alarmistic.
All Archibald’s posts the last several years have been alarmist. Especially since cold is cause for alarm while warm is not so much.
I don’t recall EVA’ hearing Mr. Archibald claiming that the Earth was going to cool by 6 or 7 degrees !
He has whined about 2 to 3 degrees which is bad enough. Even the Maunder minimum wasn’t that much colder.
yes Leif
The reason is that many AGW skeptics tend to think that skepticism is a POSITION rather than a tool
one uses to get to a better understanding.
in it’s Extreme form you will see it above where one skeptic suggests throwing out the whole sun spot
record rather than correcting it.
This is the anti science, anti understanding, virulent form of skepticism.
lsvalgaard August 21, 2016 at 9:58 am
Hi Doc. on a bit of related information,
Have we been able to observe and record any eleven year cycles on any near by G2 type stars? (I looked on wiki and Sol was listed as a G2V somehow I remembered it as as a G3 . To many years.
And no I am not trying to sand bag you. Its just any observations of like stars tend to give us a better picture of our own.
michael
You are correct. Cold IS alarming. It is the enemy of all critters. It is particularly dangerous if it catches us, while we are frantically scrambling about, chasing AGW pixies and CO2 goblins. GK
Steven Mosher —
Certainly then, you would agree that “consensus” is a position and certainly NOT a tool.
It is anti-science, anti-understanding, yes? Those who use the term favorably are anti-science, anti-understanding, yes?
It is an authoritarian phrase that brooks no opposition. It heralds a new dark age. The people who use that phrase are Luddites. You agree, of course.
I am talking about how that term is used in climate science today — today’s reality. Don’t talk about it in the abstract where today’s reality becomes mush.
Eugene WR Gallun
At some point healthy skepticism can tip over into noxious nihilism. For sure, it’s an unhealthy path to follow.
No, it is just funny reading your hysteric rants. Do I hear the sound of million dollar grants drying up, and a 6 figure salary going away? I hope so.
I wonder, is “many AGW skeptics tend to think” an example of weasel words or simply a crass attempt at a broad and unflattering generalization?
Leif, 2-3 degrees make a heck a lot of difference when you start talking about below 40 degrees and 32 degrees or below as a farmer. The USDA Zone map focuses on minimums and bears it out. Now there is a maximum map, but it has a heck of a lot more wiggle room when it comes to agriculture. But yes, rhubarb and cherries don’t do well in the South…. we get it (heat sensitive and number of chill days). But when the freeze or frost line starts moving south in CA or FL, you get crop failures. That applies to other areas in the sub-tropical to temperate transitions. The warm is safer moving north than the cold south.
Would it not be reasonable to expect a lag in the effect of solar activity?
The upper oceans would warm as a function of the time interval of increased solar activity, then gradually cool under a regime of lower activity, would they not?
Quiet sun and low solar activity will cause cooling has been talked about for quite some time.
Actual cooling should have shown up by now. So far, there is no indication of that in the UAH data set.
Personally, I have been predicting a strong cooling trend since 2005, and I have been strongly wrong since 2005.
*sigh*
..The cooling is hiding deep in the Oceans….
Or perhaps in the inherent randomness of natural variability?
That’s funny.
I don’t think that climate change is random. We might not understand what drives it, but it does change more or less cyclically, on various time scales.
In the long run, of course, Earth is doomed, unless future earthlings practice solar system engineering and pioneering on a grand scale. Or leave the system.
Funny Marcus, but I think you’re exactly right. Long term turn over of deep ocean waters probably has more effect on global and regional weather on multi-decadal time scales than whatever the sun does. We know next to nothing about these turn overs and their heat absorption potentials dwarf any solar imbalance by multiple orders of magnitude. The fantastic, pathetic thing about AGW is the persistence of an entire field of (science?)in avoiding every thousand pound gorilla in the room while raving about invisible, microscopic monkeys.
It’s all just politics. Nothing else could be so stupid!
“thousand pound gorilla”
John, Dr Spencer referred to natural internal variability as the “800 pound gorilla in the room” in his 2008 testimony before the u. s. senate… (and, no, he was not metaphorically referring to senator boxer who was “in the room”)
John Harmsworth: “…multi-decadal time scales…
Make that multi-centennial time scales.
There has been a slight cooling trend, however it hasn’t reached the level of statistical significance.
I’m waiting until after the El Nino/La Nina pair has finished.
Well looks like here is a chance to see how data contends with theory to see which result is confirmed. Either the measured temperatures continue falling, rise or stay the same. I look forward to the outcome but as a human being I hope it doesn’t get too cold, too quickly or people could die.
OTOH, the quicker it cools, the quicker al gore shuts up… (☺)
Oh no, that’s wrong. I’ve been through this before back in the 70’s. Cooling won’t shut anybody up, trust me on that one.
Global warming causes Atlantic cooling, don’t you know? At least until NOAA adjusts the Argo float data.
John, a wise observation. Anything other than a worldwide temperature rise through the early 2020’s would be the death knell for AGW. As I previously implied elsewhere, though, a lack of warming would be hotly contested by the individuals, politicians and industrial beneficiaries of the AGW meme. Massive amounts of money and talent would be expended to shore up the idea of future catastrophic “climate change.” Brace yourself, Bridget.
Dave Fair
A cold solar cycle will definitely chill any hot debates.
emsnews — made me laugh — Eugene WR Gallun
What if the world cools, but the mainstream media and consensus science say it’s warming? Just my paranoia kicking in, I’ve read too many Phillip K. Dick novels…
How long has it been since you tried to shear your sheep?
=========
I leave sheep alone; do you?
[Shearly, you can’t be surely serious about that accusation? .mod]
kim: How did you know he posted on an Android?
John, I think you are missing the point about data, it has been and will be adjusted to suit the need of the CAGW crowd. How long was the pause denied until it was busted with data adjustments, That will happen again if needed.
Facts and data don’t matter even if it does not fit the agenda which is redistribution as admitted by the IPCC head.
Cat you hit the nail on he head. Until the Green Blob goes away or gets much smaller, crooks and scoundrels will continue to adjust the data to fit their wants and models.
Cat, Bob Tisdale and others’ outing of Karl’s 2015 adjustments just MAY moderate future attempts. Those adjustments will not impact trends going forward.
Adjustments affect past trends. They would need to come up with new stuff looking back from the mid-2020’s.
Possible? Yeh. Paranoia? Yeh. Vigilance, though, is the price of freedom.
So, paranoia or not, it pays to watch the dealer’s hands.
John, the measured temperatures, whatever they are, can be or rather will be fixed.
“as a human being I hope it doesn’t get too cold, too quickly or people could die”
Population problem solved then.
“Population problem solved then” . Nature is a great balancer of problems….
The Warmists are doubly-wrong, and their wrong-headedness is having, and will have serious consequences for humanity. First, they claim that we are warming at an “alarming” rate, and that it will get much, much worse unless we, to put it bluntly, destroy our economies, which is prong two of their wrong-headedness; that we are to blame. Furthermore, the Warmists have an industry to protect – their own.
Now, what of those like David Archibald who warn of the opposite? Now sure, they could, as individuals sell a book or two. But the bottom line is, since cooling, if it does occur couldn’t possibly be “our fault” (though I wouldn’t put it past the Warmistas to try that gambit) the only thing we really need to do is strengthen our economies instead of weakening them. The horrors.
If white sand, blue water, and palm trees relax you, you may want to vote for Donald Trump.
Because life’s a beach.
You have nailed the reason I live on Florida’s Sun Coast.
Trump might build a wall around Florida, like around his golf course in Ireland.
So, the dynamics are chaotic and therefore unpredictable. We should stick to short-term weather forecasts and avoid causing catastrophic anthropogenic economic misalignments (including population control schemes) that historically and currently pose a greater threat to human viability.
Global Lower Tropospheric average temperature is predictable about 4 months in the future based on the NIno3.4 Anomaly Index, except when major volcanoes cause global cooling.. See the proof below.
Longer term climate is perhaps not as predictable, although some writers have noted a good correlation with solar activity. I have not verified this myself, but have no reason to believe they are incorrect.
In 2002 we predicted global cooling would commence by 2020-2030, based on paleontology studies of climate and solar activity. I am now leaning towards cooling starting by 2020 or perhaps sooner, but it will take many years of data to reach a firm conclusion.
Incidentally, global cooling will probably kill many more people than global warming.
Regards, Allan
__________________
https://wattsupwiththat.com/2016/07/16/does-ipcc-practice-willful-blindness-of-water-vapor-to-prove-a-scientific-point-for-a-political-agenda/comment-page-1/#comment-2262020
[excerpt]
This is interesting: Others have published on it, notably John Christy in 1994 and Bob Tisdale circa 2009-2010.
Nino3.4 Index leads UAHLT (Lower Troposphere) global temperature (and +/-20degreesN-S Precipitable Water – see second plot) by ~four months.
The Nino3.4 area, which is about 1% of the global surface area, apparently drives (or at least predicts) global temperature.
The relationship changed due to major volcanoes in 1982 and 1991, where up to 0.7C of global cooling occurred and then abated.
In the first plot, UAHLT is lagged by 4 months (after UAHLTcalc. from Nino3.4 Index) to show the strong correlation.
https://www.facebook.com/photo.php?fbid=1041547122589516&set=pcb.1041548565922705&type=3&theater
From 1996 onwards after the effect of the volcanoes had abated, R2 = 0.55 between UAHLTactual and UAHLTcalc. from Nino3.4 Index
and R2 = 0.46 between UAHLTactual and Scaled Precipitable Water (+/-20 degrees N, 0-360 degrees W).
https://www.facebook.com/photo.php?fbid=1041547895922772&set=pcb.1041548565922705&type=3&theater
https://www.facebook.com/photo.php?fbid=1041548175922744&set=pcb.1041548565922705&type=3&theater
https://www.facebook.com/photo.php?fbid=1041548405922721&set=pcb.1041548565922705&type=3&theater
History tells us the chances of the earth entering yet another major Ice Age is around 100%. The only real debate is what year this begins in ernest. All Ice Ages began very, very suddenly.
No, they end suddenly, but the decent into a new glaciation takes tens of thousands of years.
I posted a link to and extracts from this 2014 paper, but they haven’t appeared. So I’ll just give its title and authors, to facilitate finding the .pdf.
Solar activity correlation with NAO and ENSO
Simeon Asenovski, Boian Kirov, Yana Asenovska
It also discusses causation as well as correlation.
In figure 3, the time series of the Argo floats, it appears that the cold is coming from the bottom of the ocean. I don’t know where the cold is coming from, but you would think that the temperatures would change from the top down if the solar cycle was responsible.
This is a good point. Perhaps ocean circulation is the real driver of most of the climate.
Exactly.
Doubtful.
Yes, And a forcing from GHG at the low end of the IPCC interval, TCR about 1.3 as Nic Lewis has shown from observations and I could recalculate https://wattsupwiththat.com/2016/05/11/the-transient-climate-response-tcr-revisited-from-observations-once-more/ .
Anyway, some (also solar) forcing of the atlantic variability and other elements are not to exclude as actual papers discuss.
Today’s SSTA and currents from nullschoolearth. Gulf Stream looking weak.
The ocean surface warms the atmosphere unevenly. The atmosphere responds to the gradient with winds. Winds drive the ocean currents and upwelling. Which the real driver of most of climate?
“Perhaps ocean circulation is the real driver of most of the climate.”
I tend to agree with that.
“Perhaps.” 🙂
Today’s currents and SSTA courtesy nullschoolearth. Gulf Stream not looking strong.
The ocean heats the atmosphere unevenly. The atmosphere responds to the gradients with winds. The winds control the ocean currents and usually the upwelling.
Which is the real driver of most of climate?
Which is the real driver of most of climate?
Obviously, the circulation of the ocean.
Yet the proximate cause of ENSO, well recognized as one (with AMO) of two dominant quasi cyclic climatic factors, is the failure of the Pacific trade winds.

It is not at all clear from differential atmospheric heating by the Pacific why the trade winds should quasi periodically fail.
Again courtesy here are the trade winds today. I would call them southern hemisphere dominated today.
Here are the rather desultory currents overlain on SSTA. I would say upwelling rules.
Upwelling is thought to depend not on the currents themselves, but on Ekman transport, a weird phenomenon where moments of wind shear translate progressively to 90 degrees right in the northern hemisphere and left in the southern hemisphere with depth.
“This is a good point. Perhaps ocean circulation is the real driver of most of the climate.”
There are a lot of factors that go into the climate. Anyone who claims that there is a single dominant factor (CO2, ocean circulation, solar wind modulation of cosmic rays) is missing the point – it is a VERY complex system, and a large number of factors are intertwined. In such a dynamic, chaotic system long term prediction is not merely difficult, it is IMPOSSIBLE based on the mathematical nature of chaotic systems.
The largest single factor (which is not a primal cause but is itself influenced by everything else) are the interactions and movements of water vapor, and CO2 is far behind.
Of course any scientifically trained person who has studied the climate system for even a short time understands this, so you must just be trolling a public forum for the lurlz.
Greets, Moa (PhD, Physics)
Moa makes more sense than any of you. It is a complex system and until you can tell us what drives the currents, and the winds and, and, and,… then please do not use your crystal ball program to predict disaster. Average is a fools tool.
“The cold is coming from the bottom…” Cold doesn’t move, but heat does, better to ask where the heat was and where it is going – clearly it must be absorbed to warm some colder (water) or radiated somewhere (space? ) where it is lost – any ideas?
Cold does move! As a negative energy potential embodied in material objects. Ocean waters may move much more slowly than surface weather, but they can suck up an awful lot of heat when they arrive. Just as they can release a lot-el nino.
This sounds like the old “electrons move, holes don’t” argument
That was my first thought when I looked at the ARGO graph too, but it’s not a graph of current, just a measure of heat. I’m familiar with currents around Monterey CA, a famous upwelling of cold water that creates a pretty unique marine environment. When I looked at that graph I thought “upwelling”! But there’d need to be more evidence. What would cause it? Cold water doesn’t just rise, I’d think a shift in flow big enough to cause something like that would also leave a few other clues?
Sorry, I should have mentioned that was in response to John’s comment:
Maybe a slowing, weaker Gulf Stream and its extension north along the west European coast permits more upwelling there of cold water.
Bartleby
August 21, 2016 at 11:14 am :
I think we can say the integral of wind forces is able to bring warm and cold currents to surface areas where they influence air temperatures. Sometimes greatly. From memory, on this or similar blogs we recognised the ICOADS data as telling the real story of proximate cause……. but then it gets complicated?
How can you say the temperature is changing from either direction (surface or depths) from that graphic? There is no indication of energy flow “direction” in the data.
However, you have strong evidence that the major driver of temperature in these data is the sun. The seasonal ups/downs of surface water temperature coincide with the Northern Hemisphere’s summer/winter. So, I think it is safe to say that some other energy source (e.g., currents) is not drowning out the effect of the sun on these data. But that’s about it.
Seasonal changes of surface water temperature are not due to changes in solar output.
Oceanic circulations in each basin interact with each other so as to sometimes supplement and sometimes offset solar influences.
Overall the solar effect is dominant because it affects cloudiness. Solar related processes invoilving ozone in the stratosphere affect the gradient of tropopause height between equator and poles which alters jet stream tracks and global albedo via cloudiness variations. The wavier the jets the longer the lines of air mass mixing and the more clouds.
Active sun less wavy jets, less clouds and warming. Quiet sun more wavy jets and cooling.
The average rate of overturning in all the ocean basins eventually responds to solar variations. The delay depends on the constant dance between the cycles in each ocean basin.
See here:
http://www.newclimatemodel.com/the-real-link-between-solar-energy-ocean-cycles-and-global-temperature/
it appears that the cold is coming from the bottom of the ocean
====
the top is not warming
Yes the top is not warming as the incoming heat from the Sun is less possibly due to albedo or to changes in the distribution of wavelengths that make up the TSI.
Of much more interest is how fast the heat is lost in each annual variation. That should be the cause for concern we would not need much of a bad year for the ocean to cool rapidly; yet this does not seem to be the delivered wisdom.
actually
when the UV and IR reaches the oceans, the top layer of molecules is easily brought to 100 degrees C and hence evaporates to form clouds…
if this were not so happening, life as we know it would not exist.
contrary to some commenters here, I believe it is [mainly] the variation in UV reaching the oceans that is the main factor behind weather…..and the change in weather, as dictated by the sun, i.e. the 87 year Gleissberg cycle
better be prepared for the cold when it comes….
59N is just south of Greenland. 330E – 360E has East Iceland more or less in the center. Present Nullschool surface anomaly gives nearly the whole region warmer than normal surface temperatures: https://earth.nullschool.net/#current/ocean/primary/waves/overlay=sea_surface_temp_anomaly/orthographic=-16.37,52.32,932/loc=-15.628,60.176 Figure 3 and 4 in this post came a bit as a surprise for me.
It would be interesting to get more 3D information from the ARGO buoys about what is happening below the surface, all over the oceans. Even from the seas below 2000 meter (in the future). Until we know, we are only guessing what is happening.
RE John, if you leave your front door open in winter, it’s not cold coming in, it’s heat going out.
It’s hot air going out and cold air coming in.
You might want to rethink that statement.
In my house when the door is open and it’s colder outside than in, warm air goes out the top and cool air comes in below.
John
Agreed – the cause of changes in ocean temperatures is ocean circulation. Solar changes are far too weak to change ocean temperatures especially at depth in the short term. On the long term it is just possible that the sunspot cycle and other solar cycles might weakly entrain nonlinear oscillation of a finely balanced chaotic climate system. See Zebiak and Kane for instance. But weakly forced nonlinear oscillation can be very complex so that a solar signature would be hard to trace.
Ooh, nice. My marker goes here.
=======
How long has it had to entrain? What are the odds it hasn’t entrained? Well, I can’t calculate the odds, but I can see the scale.
===============
Heat rises, energy reaching the ocean from the sun is reduced from the top down, remember, in the graph you’re looking at, observations of reduced energy reaching deeper levels of the ocean is caused by the sun, satellite data that shows increased energy leaving the ocean is also caused by the sun, does that make sense?
Observations of Increased heat leaving the oceans from satellite ties in with observed cooling that is observed in the measurements of cooling.
*of cooling ocean
“Heat rises,”
OMG. It DOES not. Geez … HOT AIR rises due to BUOYANCY.
(DO YOU THINK the astronauts heads ONLY got hot in the suites they wore? Please, get an education. )
It’s a perfectly acceptable shorthand.
That only serves to highlight the importance of long run ocean cycles in the discussion and any correlations. If in fact it is a combination of near term solar effects and long run ocean cycles, then that further complicates the understanding. But to resort to global temps and century long averages or strictly near term solar observations amounts to deflection of the issue.
From looking at the collapse of Atlantic ocean temps, it seems likely the 30-year AMO cool cycle will start from around 2019.
When that occurs, both the Atlantic and the Pacific will be in their respective 30-year cool cycles and global temps ALWAYS fall when this happens…
Moreover, sunspot activity should be near zero from 2019, and the weakest solar cycle since 1790 starts from around 2022, which will likely add to natural global cooling…
CAGW is so dead…
Not sure the chart is that good of an indicator for the AMO. It is one area and I suspect a key area for predicting the AMO in the future but not necessarily a measure of the entire North Atlantic basin. I would still go with 2025 before the entire AMO basin averages out to a negative value. This doesn’t mean the index isn’t falling over the next decade.
This could very likely be the effect of the loss of sea ice over the past decade. As the ice has melted it has allowed vast quantities of energy to be lost to the atmosphere and space. The currents are slowly bringing this water into the North Atlantic which is my own personal view of what is driving the changes (not solar).
I believe there is still enough warm water in the gulf stream flowing into the North Atlantic and Arctic which will need to be cooled before the entire AMO index goes negative.
However, scary talk of a coming Maunder Minimum is a little overblown. IMO the worst we can expect reasonably would be another Dalton Minimum, but maybe not even that bad, since we’re starting from a warmer world, compared to the LIA of the late 18th century. And are unlikely to get a Tambora-scale eruption (1815) during the downturn.
Gabro,
The Little Ice Age started at the end of the Medieval Warm Period. The Great Famine of the years 1315 to 1322 were the start of the change in climate to cold from very warm. To quote Brian Fagan’s book “The Long Summer: How Climate Changed Civilization”:
“Seven weeks after Easter in A.D. 1315, sheets of rain spread across a sodden Europe, turning freshly plowed fields into lakes and quagmires. The deluge continued through June and July, and then August and September. Hay lay flat in the fields; wheat and barley rotted unharvested. The anonymous author of the Chronicle of Malmesbury wondered if divine vengeance had come upon the land: “Therefore is the anger of the Lord kindled against his people, and he hath stretched out his hand against them, and hath smitten them.” Most close-knit farming communities endured the shortages of 1315 and hoped for a better harvest the following year. But heavy spring rains in 1316 prevented proper sowing. Intense gales battered the English Channel and North Sea; flocks and herds withered, crops failed, prices rose, and people again contemplated the wrath of God. By the time the barrage of rains subsided in 1321, over a million-and-a-half people, villagers and city folk alike, had perished from hunger and famine-related epidemics. Giles de Muisit, abbot of Saint-Martin de Tournai in modern-day Belgium, wrote, “Men and women from among the powerful, the middling, and the lowly, old and young, rich and poor, perished daily in such numbers that the air was fetid with the stench.” People everywhere despaired. Guilds and religious orders moved through the streets, the people naked, carrying the bodies of saints and other sacred relics. After generations of good, they believed that divine retribution had come to punish a Europe divided by war and petty strife.
The great rains of 1315 marked the beginning of what climatologists call the Little Ice Age, a period of six centuries of constant climatic shifts that may or may not be still in progress. ”
I think that some have lost their sense of scale for time and the size of the planet and have a degree of hubris over the impact of humanity because of that. * A small hurricane in one day extracts energy from the ocean equivalent to 200 times world total electricity generation capacity;
* Ants and termites generate more CO2 than all of human activities – cement works, aircraft, road transport, coal fired power stations etc.,
That claim is highly implausible.
According to a report in 1996 termites produce around 3.5 Gt of CO2.
http://onlinelibrary.wiley.com/doi/10.1029/96GB01893/full
Human emissions are over 30 Gt a year according to the latest IPCC report.
Ian,
I meant only that the LIA was still going on in 1790.
Figure 1 is mislabeled. I think it should be annual rather than monthly.
A very interesting main post.The charts are the key component and show the trends over time.
Thank you Mr Archibald for taking the time to present them.
2007 marks a number of shifts; end of the downward trend in summer min Arctic sea ice extent and volumn, beginning of N Atlantic cooling, etc. Wonder how this fits in: “2007 — NASA Sees Arctic Ocean Circulation Do an About-Face.”
Here: http://www.jpl.nasa.gov/news/news.php?release=2007-131
Wow, that when the phrase “It is the Sun stupid”, gets in its full proper meaning, fully deserved
David, thanks for the post. However, the ReynoldsOI sea surface temperature data do not agree with your claims. Here is that data:

So I’m sorry, but your claims about the “persistent failures of the wheat crop in Norway” simply don’t ring true—if Norway is in such trouble now, they would have been dead in 1985, when North Atlantic temperatures were much colder. Honestly, David, that kind of “the horror!” alarmism is just as inappropriate when you do it as when Al Gore does it.
Next, if a falling sun is the cause of the current drop in North Atlantic temperatures as you claim, then what is your explanation of the much colder temperatures in the 1980s, when according to you the sun was much stronger?
Finally, the area cited in your top graph and shown in my graph is less than 1% of the surface of the planet … and despite that you are drawing conclusions about the whole planet from that. Now, if Michael Mann tried that kind of nonsense you’d scream bloody murder, and rightly so. But it’s no more proper when you do it …
w.
PS—Other than your own article I don’t find anything about your claimed “persistent failures of the wheat crop in Norway”. Nor have their been any such failures in Sweden, which grows more wheat than Norway. Finally, the yields in both countries have been relatively stable since about 1990 or so. Any “persistent failures” would show up in both the yield and the production figures, and I don’t find evidence of such problems either at FAO or on the web in either Norway or Sweden. Google something like “recent norway wheat failure” and you’ll find what I found.
Nothing.
Well, nothing but your article, which is not that reassuring.
And in any case, wheat is the wrong indicator. Norway and Sweden both grow about ten times the amount of barley as wheat. And just like with the wheat, there’s no great reduction in either yield or production of barley.
Willis,
David links to his 2013 article about Norwegian wheat crops.
Why do you prefer the rather generalised Reynolds data over the more recent Humlum data which is far more specific and targeted?
Stephen Wilde August 21, 2016 at 11:21 am
I said in my comment that I’d found his article. Not impressed, sorry.
a) I don’t “prefer” Reynolds, I’m just pointing out that the Reynolds data doesn’t agree with his conclusions.
b) The ReynoldsOI data goes up to the present, so I’m not clear how the Humlum data could be “more recent”.
c) I have used exactly the same area shown in Archibald’s first plot … what do you mean by “more targeted”?
Regards,
w.
The two data sources differ. I’d like to know why.
Steve, I believe one is SST and the other is ocean heat to 700 meters.
Thanks. Not like with like then. Willis should know that.
Not like with like then.
===
We have a winner.
The Argo data obviously does not match the SST data…..until Argo shows surface cooling
…and then it does
There is no indication in Norwegian wheat production figures of any crop failures:
http://www.indexmundi.com/agriculture/?country=no&commodity=wheat&graph=production
Overall production has been increasing since about 1970. While there is definitely considerable variation in production after 1970 with annual variations ranging up to 175 million tonnes, the timing suggests that economics was more influential than climate, especially since a heavy crop one year will tend to be discouraged by government influences the following year. Norway has one of the most managed agricultural systems in the world.
Peak year for wheat production in Norway was 2008:
http://www.indexmundi.com/agriculture/?country=no&commodity=wheat&graph=production
For whatever reason, it crashed thereafter and has stayed low.
Correlation and causation of solar activity with the ENSO and NAO is clear:
Solar activity correlation with NAO and ENSO
Simeon Asenovski, Boian Kirov, Yana Asenovska
http://www.issibern.ch/teams/interplanetarydisturb/…/Asikainen_03_2014.pdf
For the ENSO, long-term variation is closely related to the secular solar activity variations. Both the intensity and occurrence frequency of El Nino are low at secular solar maximum and high at secular solar minimum. In the 11-year solar cycle, El Nino has a statistically significant minimum one year before solar activity maximum.
For the NAO, solar activity and the latitudes of the North Atlantic centers of action: with increasing solar activity, Iceland low moves to the south, while the Azores high moves to the north, and the two centers of action come closer.
Broken link above. Is it
http://www.issibern.ch/teams/interplanetarydisturb/wp-content/uploads/2015/01/Asikainen_03_2014.pdf
See also
https://tallbloke.wordpress.com/2016/06/30/rj-salvador-predicting-el-nino-predicts-the-climate/
Yes.
Thanks!
I have to say, no, I don’t believe it. Any correlation based on incomplete data should make you nervous. We don’t have a complete picture of the ocean temps. I know when I cared about statistics (which was a LONG time ago), I would be afraid to try and make that link. Mr Park would have been annoyed (WU StL – hardest exams ever – Econometrics exams were all essays in undergrad!)
G3,
The correlation looks strong to me, and their work also discusses causal mechanisms.
Moreover, it stands to reason that even small variations in TSI, its spectral composition and solar magnetic flux over time would affect tropical SSTs, ozone concentration, atmospheric pressure over the oceans, currents and winds.
It was exceptionally cool in april 2013. This effected the crop of all sorts of grain. The farmers in Norway changed in some areas to gras. There are several reasons why farmers close to North Pole and now with wetter climate have to change to other products. The total area of soil is under pressure year by year, so it has decreased, but fr other reasns. As you all know Norway is heavily blessed with rocks and mountains. The rest of our soil is tempting areas for city developers…
Thanks.
http://www.indexmundi.com/agriculture/?country=no&commodity=wheat&graph=production
2013 bad year
2016=1998 oroduction
between these dates better harvest.
Willis states “So I’m sorry, but your claims about the “persistent failures of the wheat crop in Norway” simply don’t ring true”. Since I happen to be a Norwegian living in Norway I found Davids claim a bit strange, so I followed his own link. I’m not convinced. The argument he makes is that since there is ups and downs in our total wheat production, we are going through ups and downs in climate. He does not discuss the impact of political decisions, of how agriculture is organized in our country. That has a major impact, and one that will thoroughly mask any climate signal of any crop grown in this country. He does not touch upon crop prices. When the price drops, do you really think our farmers don’t take notice and grow something else? Besides which, we don’t use domestic wheat for human consumption…the quality is way inferior to imported crops.
So Willis is absolutely right about his statement. Norway is actually warming, we do not have any persistent failure of any crops. I’m skeptical about the rest of Davids post, based on this.
Well with the advances in production and the higher yielding strains currently used I would hope to see better than a peak in 1990 for Barley. Harvesting methods have moved so far forward in 26 years that I think most people would expect to see at least the same level of production.
1990 731 (1000 MT) 24.96 %
1991 691 (1000 MT) -5.47 %
1992 469 (1000 MT) -32.13 %
1993 615 (1000 MT) 31.13 %
1994 510 (1000 MT) -17.07 %
1995 547 (1000 MT) 7.25 %
1996 682 (1000 MT) 24.68 %
1997 663 (1000 MT) -2.79 %
1998 619 (1000 MT) -6.64 %
1999 624 (1000 MT) 0.81 %
2000 574 (1000 MT) -8.01 %
2001 624 (1000 MT) 8.71 %
2002 593 (1000 MT) -4.97 %
2003 585 (1000 MT) -1.35 %
2004 631 (1000 MT) 7.86 %
2005 589 (1000 MT) -6.66 %
2006 538 (1000 MT) -8.66 %
2007 485 (1000 MT) -9.85 %
2008 558 (1000 MT) 15.05 %
2009 473 (1000 MT) -15.23 %
2010 541 (1000 MT) 14.38 %
2011 495 (1000 MT) -8.50 %
2012 573 (1000 MT) 15.76 %
2013 480 (1000 MT) -16.23 %
2014 577 (1000 MT) 20.21 %
2015 577 (1000 MT) 0.00 %
2016 580 (1000 MT) 0.52 %
Fortunately, we live in a world in which global trade allows areas with poor harvests to buy food from areas with good harvests.
The claim that crop failures should have resulted in dead Norwegians may have been true in the 1800’s but is no longer true today.
Don’t have data for every year, but Danish wheat production fell from 5,059,900 metric tonnes in 2010 to 4,139,000 MT in 2013.
http://www.geohive.com/charts/ag_wheat.aspx
Regarding Norway : Since the crop is not harvested until late august / early september we don’t know the results for this year yet. But we have had a cold and rainy summer. Early summer we experienced the highests snow levels in the mountains for over 50 years. Early August some regions in the south got snow down to altitudes of 700 meters above sea level. Normally we don’t experience this until late September. The Norwegian met office has explained this with persitant cold winds pushed down by low pressures in the polar region. It is in any case very unusual.
DA posts a plot that suggests that temps have dropped by just under 1 degC between 2006 to date (DA says the plot suggests a full 1 degC drop but my eyeballing suggests a little less).
Your plot of the Reynolds data shows a significant drop in temperatures as from about 2005, but one which is only about half that shown in the plot used by DA.
In other words, it would appear from a trend perspective that the Reynolds data depicts the point being made by DA, it is just the scale of things where differences occur.
There has been much more cloud from wavy jets as per this hypothesis:
http://joannenova.com.au/2015/01/is-the-sun-driving-ozone-and-changing-the-climate/
which fits more climate observations than any other.
ANd I thought it was due to warmer air overrunning cooler air at the surface (yielding clouds) but newthink says “jetstream”?
Has this been confirmed by movement in the “wheat line” in Canada? (that being the northern most latitude where wheat can be grow to maturity)
The only cite I could find was this from 2009: http://www.ncbi.nlm.nih.gov/pmc/articles/PMC3021086/
I haven’t seen anyone addressing this issue recently but they should be.
Faster maturing grain varieties might muddy those waters, however.
Also, I remember from gardening books, magazines and catalogs of seed houses from the 1950’s that the last day of frost in spring had moved north prior to that time for around 40 years or so. The distance was significant for farmers and gardeners in both Canada and the northern states of the US..
BTW, I found the interesting paper you mentioned but not in Scholar.
Solar activity correlation with NAO and ENSO. Simeon Asenovski, Boian Kirov, Yana Asenovska. The paper appears to be a presentation published by (International Space Science Institute (ISSI), Bern).
http://www.issibern.ch/teams/interplanetarydisturb/wp-content/uploads/2015/01/Asikainen_03_2014.pdf
Main claims: Long-term relations of ENSO and Solar activity demonstrated by 1) The dependence of ENSO on solar activity with a correlation coefficient of -0.76. 2) Higher solar activity – weaker and less frequent El Nino.
They cite van Loon, Meehl, Cubasch with no title or date. Since I could not find a paper by these three authors, I think this may be a reference to Van Loon, Harry, Gerald A. Meehl, and Dennis J. Shea. “Coupled air‐sea response to solar forcing in the Pacific region during northern winter.” Journal of Geophysical Research: Atmospheres 112.D2 (2007).
http://nldr.library.ucar.edu/repository/assets/osgc/OSGC-000-000-004-300.pdf
Lief also has a link to an interesting paper, SOLAR INFLUENCES ON CLIMATE, Gray, et al. 2009 that cites other papers by Van Loon et al.
http://www.leif.org/EOS/2009RG000282.pdf
Hi Fred – see
https://tallbloke.wordpress.com/2016/06/30/rj-salvador-predicting-el-nino-predicts-the-climate/
buck, thank you for that most interesting document. Two points.
1. Yes, farmers have successfully grown and harvested crops in places formerly deemed too cold or too arid, and most of the new fields were in the North. Remarkably, today’s average climate where wheat is produced is both drier and colder:
“The median annual precipitation norm of the 2007 distribution of North American wheat production was one-half that of the 1839 distribution, and the median annual temperature norm was 3.7 °C lower.”
Which brings me to point 2: Agriculture has demonstrated our massive capacity to adapt to changing conditions, whether it becomes warmer or cooler, wetter or drier.
The rational climate change policy has been proven successful: Don’t Fight It, Adapt.
Bumper crops expected here in Western Canada. Cooler and wetter summer than usual. There’s always the possibility of early frost but so far, so good. Much greater crop variety now. 40 years ago, wheat was king.
Manitoba was looking at corn recently, allegedly because of “climate change”, but the interest might more to new, more rapidly maturing strains.
Grains are constantly being bred for different regions. Wheat was once a very tall plant. Over the years, shorter and faster maturing types were developed – less energy used in developing a tall stalk, and more energy pushed into a large productive head. Grains grow from the equator to Alaska. Not always in commercial quantities but the varieties are always being modified.
http://news.uaf.edu/yes-you-can-grow-grain-in-alaskas-interior/
http://dnr.alaska.gov/ag/ADHOC/HayandGrainSummaryFinal100606.pdf
http://modernfarmer.com/2013/10/arctic-farming/
buckwheaton August 21, 2016 at 11:18 am Edit
Has WHAT been confirmed?
w.
I asked a senior farmer advisor based in Montreal about the Canadian growing season. He said it has been getting longer at a rate of 2 days per decade since 1950.
He did not mention the area of the crop regions. Such an area is variety-dependent so any ‘line’ means ‘for a certain variety’ with its need for degree-days.
Sorta misleading. Sorry to fuzz the edges…
Even the Potsdam Palace Guard think that the Gulf Stream might be slowing down:
http://www.scientificamerican.com/article/did-a-slow-gulf-stream-make-the-east-coast-blizzard-worse/
Sometimes I am more than amazed, and this time rather amused, by the commenters such as on this post. Arguing over the proper cause of imminent cooling is rather like a family at the kitchen table, arguing over what caused the house to be on fire while the house is burning down around them: an electrical wiring fault, no, it was arson, no no, it was hot embers from the wildfire outside.
Perhaps it makes a difference in the long term, if the evident Atlantic ocean cooling is due to cold water upwelling, or more clouds blocking the sun, or more Arctic ice melting into the Atlantic (but you’re going to need an awful lot of ice for that one).
Perhaps it makes no difference. No one can stop the oceans from upwelling. No one can stop the clouds from forming. And no one can stop Arctic ice from melting now that ton after ton of black soot, ashes, and jet engine exhaust have settled onto the ice and accelerate the melting.
It would be prudent to examine the recent trends in global cooling, then try to determine exactly what can be done to stop the trend or reverse them, or at the very least reduce the rate of cooling.
I stand by my 2012 speech and article, Warmists Are Wrong – Cooling Is Coming.
So-called “climate scientists” (as opposed to real climatologists) were wrong about coming cooling in 1976 and are liable to be just as wrong about coming warming in 2016. And those, like Callendar, who expected warming to continue after 1938.
Roger Sowell August 21, 2016 at 11:22 am
Thanks, Roger. A few clarifications:
• Your kitchen table analogy fails because you haven’t shown the house is on fire. Or in more practical terms, neither you nor David has shown that there is significant cooling, either now or “imminent”. Might happen, might not, but there is certainly no certainty on the question as you seem to assume …
• I am not “arguing over the proper cause of imminent cooling”. I am laughing at skeptics doing the same things alarmists do—arguing about the cause of a fire that nobody has shown to be actually happening.
• David Archibald has pointed out that there has been minor cooling in less than 1% of the surface of the planet … OMG, it’s all the way down to the temperature it had in 1995, EVERYONE PANIC!.
Obviously, he thinks this change in the 1% area is highly significant and presages the demise of the other 99% of the planet … equally obviously, I don’t.
I assure you that I can easily find another 1% of the planet which has warmed as much as the North Atlantic has cooled … and if you are like David Archibald and you think the vagaries of some other random 1% of the planet’s surface are more important than the vagaries of my warming 1%, I have a fine deal for you on a bridge that just happens to be for sale in Brooklyn …
w.
http://berkeleyearth.org/wp-content/uploads/2016/08/Trend_Map_since_1950.png
There is some evidence that the North Atlantic provides a precursor for the rest of the system
…and melts a lot of ice
Steven Mosher has effectively turned Earth into Mars lol
This graph is proof that “Berkeley Earth” is nonsense.
Sparks said:
“Steven Mosher has effectively turned Earth into Mars lol”
?? Because his graph uses red to show positive trends? That makes no sense whatsoever.
“This graph is proof that “Berkeley Earth” is nonsense.”
Well, please do explain your reasoning. How does this graph prove that Bearkeley Earth is nonsense?
Steven Mosher: ?dl=0
?dl=0
I love the graphic you provided without comment. (Not sarcasm.) It is a decent reply to prior comments.
The Berkeley Graphic shows is there is absolutely nothing to worry about.
Willis and I have been on the planet for about the same number of years. I remember the “weather” before the start of the Berkeley trend. Years ago I went and got the temperature records for a lot of places including where I was born just to make sure my failing memory wasn’t faulty.
The Berkeley plot says that most of Canada and the arctic have gotten “warmer” by less than a half degree C since 1950. Some people want me worry about that? My plots of Canadian data suggest it hasn’t gotten warmer but “less cold”.
In my world, that is a good thing. Today I started a fire in my fireplace because it is 10 degrees outside and snowing in the mountains. Half a degree? Sheesh. But thanks for the graph.
In return, a couple out of many of my own; most are similar:
https://www.dropbox.com/s/08d575pia8wk6h6/Grand%20Forks_BC%20July.tiff?dl=0
“What, me worry?”
Philip Schaeffer
“lol” <—- is usually an indicator of humour, and I usually rag on the guy's to lighten the mood when I see them getting flustered, 'cause they're really not a bad bunch here a WUWT
🙂
Philip Schaeffer
“lol” <—- is usually an indicator of humour, I like to rag on the guys to lighten the mood when I see them getting flustered and give them a hard time until they snap out of it, they're actually not a bad bunch here at WUWT
🙂
The “warming” that climate scientists (at least those in the warmist camp) claim is based on entirely erroneous data manipulation, selective data inclusion, and other invalid methods. One wonders why the temperature record includes hundreds, if not thousands of sites that require adjustments when there are so many pristine sites available. One must also wonder how, exactly, California’s counties refused to warm over most of the 20th century – but only those with a small population of under 100,000 people. At the same time, California counties had substantial warming if the population was 1 million or more in the 1990 census. This is based on the James Goodridge charts.
Eschenbach claims I have not shown that there is significant cooling, either now or “imminent”. Let me point to the past almost 20 years of “no warming” as shown by the warmist scientists, then advance the opinion that the “no warming” is hiding an actual cooling. How will we know? Not by looking at the temperature graphs and published pronouncements of warmist scientists.
Instead, I look at the data that (hopefully) is not manipulated and changed to suit the agenda. One such example is the temperature trend for the US and its regions as measured by the USCRN, the United States Climate Reference Network. USCRN has only a short record at this time, only 11 years, but the first 10 years show a substantial cooling. (I recognize that citing my own work angers many WUWT commenters, but so be it. I have seen no other data analyses from this USCRN, excepting one that is clearly erroneous.)
http://sowellslawblog.blogspot.com/2015/09/us-in-cooling-trend-winters-much-colder.html
The summary is: “An analysis of atmospheric temperature data from 55 pristine United States Climate Reference Network locations show a pronounced annual cooling trend of minus 2.68 degrees Celsius per century over the ten-year period 2005-2014. The Winter cooling trend for the 55 locations is much greater at minus 10.86 degrees Celsius per century. The region with the most rapid Winter cooling is the MidWest and Northern Plains at minus 23.1 degrees Celsius per century. All regions have a cooling for Winter months. All regions but one, the West and Mountains, also have a pronounced annual cooling.”
So, there we have another region that shows cooling, not just the North Atlantic.
In fairness, the El Niño of 2015-16 added a warming blip to the end of the trend. As endpoint issues always do, that skews the trend. As the El Niño has now gone, the cooling trend from 2005 will continue.
“then try to determine exactly what can be done to stop the trend or reverse them”
I very much doubt there are many serious posters on here deluded enough to believe that there is anything whatsoever mankind can do to markedly influence such trends.
Please point out the posts that gave you the impression that there are (ignoring the Usual Suspects, naturally).
We can no more significantly affect the climate than we can significantly alter the time the Sun rises and sets.
Good discussion thus far.
Hmmm. I guess JoNova’s husband’s predictions are looking pretty good right now. Even if the local “we don’t need no stinking sun” fellow thinks otherwise.
I guess JoNova’s husband’s predictions are looking pretty good right now.
Perhaps you should look again and moderate your tone a bit too.
His prediction is partly based on an assumed sharp drop in TSI which actually didn’t happen. On the contrary, TSI now is higher than we would expect from solar activity.
http://www.leif.org/research/TSI-Divergence.png
David Evans doesn’t rely on TSI per se.
Wisely, he recognises that some feature other than raw TSI is having an effect on the climate system.
My proposal is this:
http://joannenova.com.au/2015/01/is-the-sun-driving-ozone-and-changing-the-climate/
which is looking good so far.
Interestingly such an approach completely sidesteps your recent work which tends to reduce the scale of solar variability so from a climate perspective your solar endeavours are irrelevant 🙂
Isvalgaard.. is that averaged TSI ? Depending on where the earth is in its orbit I thought TSI varied by 2. Perhaps there are multiple factors involved rather just TSI in solar activity. If two events are happening ( maybe more) for example, if both are in phase the results would be more dramatic than if they are out of phase. In conjunction with solar wind, CME’S, and magnetic fields.
At any rate, if this solar min is like or exceeds the last one, it should tell us something. This last el nino ended with the sun going into a min. In 1998 el nino ended with the sun going into a max. Which raises a question if solar activity is important, how did an el nino happen at or near the bottom of a a solar min? Pressure probably plays an important role in that.
I haven’t seen anywhere, does SORCE measure microwave energies? And if it does, do you know the strength? Is that incorporated into the total TSI? Also does the TSI, when it declines, fall across all energies in the spectrum or just some?
[No. TOA radiation (TSI at the earth’s position in orbit) varies by 6% over the year (+3% in January 5 at 1410 watts/m^2, down to -3% in July 5 at 1315 watts/m^2). .mod]
As you can see from the spacing of the data points, they are yearly averages in the beginning and changing to half-yearly from 2013. In both cases, the yearly variation due to the shape of the Earth’s orbit is washed out.
how did an el nino happen at or near the bottom of a a solar min
There is no evidence that el Nino has anything to do with solar activity.
And TSI is the TOTAL amount of energy for ALL wavelengths. That is what the ‘T’ in TSI stands for.
Thanks. Although I don’t think all energies from the sun are created equally from the sun, with varying degrees that have wider impacts on absorption rates that translate into heat or cold.
I’ve been thinking about el Nino’s since I posted. I’ll have to check something on that. I also thought that maybe we are looking at Solar activity incorrectly. I have to look at that.
While I still think that solar activity is a key component of climate , I need to show something that repeats besides just the cycles. I think I can do that. While the atmosphere is a resistance and the oceans are a capacitor, I’m thinking about what could be an inductance.
Stephen:
David Evans doesn’t rely on TSI per se
He does not consider any other solar variable in deriving his correlation, so TSI is it.
Lief
There is evidence that solar activity causes El nino spikes.
Regardless,
It is the suns polarities and the timing that cause sunspot activity and its intensity from the core out, as they rotate and reverse.
The polar reversal is not formed from weak magnetic field lines on the surface that build up and reverse the entire solar polarity.
I do understand that the equator on the surface of the sun rotates faster than the poles, but I disagree that weak magnetic fields cause this rotation.
The weak Magnetic Fields and sunspots are the result of the sun’s polarities interacting as they rotate and reverse.
As we have discussed before, you are so far out on the wrongness scale that no education is possible…
but I disagree that weak magnetic fields cause this rotation.
At least this is sort of correct: the [differential] rotation is what causes the magnetic field.
TSI is always higher at solar min.
where, exactly, is TSI measured?
TSI is always higher at solar min.
where, exactly, is TSI measured?
TSI is the Total Solar Irradiance [measure of the TOTAL amount of radiant energy the Sun produces].
TSI is measured in space near the Earth.
And is higher at solar maximum and lowest at solar minimum.
TSI has three parts: TSI = Base B + Sunspots S + Faculae F.
B is very nearly constant on time scale of centuries and represents the energy generated by nuclear fusion near the center of Sun. S is negative and represents the fact that sunspots are darker than the rest of the surface. F is positive and represents the fact that the area around sunspots contains magnetic fields concentrated in flux ‘tubes’ than are nearly evacuated and thus allows us to look deeper into the Sun, where temperatures are higher and thus give us more radiation. On average F = -2*S so the sum TSI will vary as S varies. F and S are controlled by the magnetic field. The magnetic contribution is thus M = F + S = -2S + S = -S, which is positive because S is negative. At solar maximum, M can reach B/1000. At solar minimum B, M is zero.
[1. Please verify the italics were correctly edited in the first paragraph.
2. Numerically, TSI is considered 1362 watts/m^2 at earth’s average distance, cycling between 1410 watt/m^2 in January, dropping to 1315 in July, correct? .mod]
Henry P .. SORCE right now measures TSI. There are probably others. This one seems to be the most accurate.
markstoval August 21, 2016 at 11:54 am
Gotta love selective memory. Here are David Evans’ (JoNova’s husband) actual predictions:

In fact, Dr. Evans’ 2013 prediction, incorporating data up to 2012 (smooth falling brown line starting in 2013), is that by now the globe should be no less than ~ 0.7°C cooler than it was in 2013. That’s more than the earth warmed in the 20th century, so David Evan’s prediction was that by now we should be back around the temperatures prevailing in 1900.
I would hardly call his prediction that we should already be in 1900-style temperatures “looking good right now” …
w.
Just shows one shouldn’t predict.
David’s basic thesis looks sound enough though.The problem is that none of us has a handle on system thermal inertia.
Be patient, y’all! Jus’ wait a year or two ’til the el nino (and subsequent la nina?) is out of the way AND then we’ll see what happens…
Stephen Wilde August 21, 2016 at 1:03 pm
Stop making predictions? That would be the end of science. Science is based in part on the ability to use our knowledge of the real world to make accurate predictions, and I give David Evans kudos for making a prediction … however, it failed.
If the basic thesis says that by now we should be in temperatures last seen in 1900, perhaps you should take another look before saying it “looks sound enough” …
w.
“Gotta love inaccurate quotes”. David’s work is looking good. He didn’t make that “actual” 2013 prediction which wasn’t in 2013. (Willis is quoting Archibald’s interpretation of David’s model). Accurate information is on my site. David’s first published predictions are June 2014: http://joannenova.com.au/2014/06/big-news-viii-new-solar-model-predicts-imminent-global-cooling/. Willis asks everyone to “quote accurately”. What can I say?
As for the TSI fall — the comments here are bizarre. David is talking about 11 year smoothed TSI, for which there is an obvious fall in all the solar datasets except Leif’s which started earlier, and we have discussed. David acknowledges that PMOD appears to be the most useful leading indicator. Whatever it is measuring (differently to Leif’s interpretation) appears to be the best predictor of global temperatures with a delay.
In David’s work, TSI is always only a leading indicator of some other solar effect — likely to be either solar magnetic, solar wind or solar spectral (UV/IR) changes. These solar changes appear to be occurring in the cycle following changes in smoothed TSI, and probably operate through changes in cloud cover. David’s work fits with independent observational studies (Usoskin, Friis-Christensen, Soon, Solheim, Paltridge). See refs here http://joannenova.com.au/2016/02/new-science-22-solar-tsi-leads-earths-temperature-with-an-11-year-delay/
David explains why there is no hotspot and he maps and discovered the exact small but fatal flaw in the basic model feedback architecture. http://sciencespeak.com/climate-basic.html
Willis has always been welcome to discuss it at our site, but has chosen not to in the updated 25 post series. (http://joannenova.com.au/tag/climate-research-2015/). Leif at least does, but has ignored the replies.
We don’t have time to correct the misinformation in comments here. On my site readers are better informed and there is less timewasting from misleading words put out by people who don’t know what they are talking about. Wise people who are two years behind an extensive research project would say nothing.
This summary page points to the relevant recent notch-delay theory posts.
http://sciencespeak.com/climate-nd-solar.html
Looking at Jo Nova’s link it is clear that Willis has misrepresented the prediction of David Evans having apparently confused it with a prediction from David Archibald.
He should apologise.
Thank You… While the experts here at wuwt are truly a godsend and a treasure trove of quite useful knowledge, they do have a tendancy towards polarizing and stunting the discussion. We’d be at a loss without them, but as is, are at a loss with them. (☺) They do need to be challenged at every turn…
Willlis you are being more than a little disingenuous. I created that graph to backtest David Evans’ model. And it worked very well in following the shape of the temperatures record with no big departures. Some others are now predicting a very cold northern winter. Thanks for drawing attention to David Evans’ original work.
Willis? Disingenuous? Well, only now and then, and since it commonly seems undeliberate he may be innocent of ingenuity.
=============
Dang, should be ‘innocent of ingeniousness’.
=============
Willis,
Tell me what is not to like about a hard working guy who enjoys speaking his mind over a few drinks and engaging in scathing social commentary for the humorous intellectual effect of being misunderstood, and I will give you a world when a quote from Mark Twain is always acceptable.
I understand your sense humour, it isn’t too much to ask for the thoughtful understanding of someone else’s.
S.
Willis,
In all fairness, I was giving the benefit of doubt to David as to the context of what he was explaining, as I understand, his own research suggested Cooling, I agree with David in that Solar activity will and in my own opinion [has] caused temperatures not to become the Climasstrophic warming that proponents of doom have warned about.
To be funny, he didn’t say that the rate of 0.2 degrees (in context of his research) would translate into Global cooling, he made a prediction based on the relative rate which means the process isn’t collaborated with the real world or confirmed.
“I guess JoNova’s husband’s predictions are looking pretty good right now”
Well, one set of predictions not looking so good are David Archibald’s predictions to the Australian Senate, 2008 (Summary) which were solar-based:
That would place temperatures about 2°C down from 1998. Instead, of course, they have increased.
Interesting, Nick, I was unaware of that. I do have to give David Archibald props for the staggering size of his prediction. Over the entire 20th century, the world warmed by something on the order of ~ 0.6°C.
David has predicted that after 2009, global cooling would accelerate until it was giving us a century’s worth of cooling EVERY THREE YEARS … a century’s worth of cooling happening every three years, it definitely takes some albondigas to predict that …
However, as Mark Twain is reputed to have remarked, “The reports of my death have been greatly exaggerated” … and so was David’s predicted cooling.
w.
David has never said “global cooling would accelerate after 2009” Your Interpretation is bollox, and in need of some revision.
Mark Twain wrote story books, grow up Willis, he is certainty not someone worthy of ever quoting while we’re discussing science.
I like Mark Twain btw just trying to be funny @Willis 🙂 hahaha
MODS did I hit a nerve? good I must be doing something right lol only joking, let me know and I’ll correct my errors and make amends to my bad ways 🙂
Sparks August 29, 2016 at 3:12 pm Edit
What he said was:
“My prediction is that this rate of cooling will accelerate to 0.2 degrees per annum following the month of solar minimum sometime in 2009.”
I’m unclear why you think my interpretation is wrong. What do you think it means?
w.
Sparks August 29, 2016 at 3:20 pm
Curious. On my planet there is almost no circumstance when it is not appropriate to quote Mark Twain … guess that’s what makes horseraces.
However, I certainly would never try to force my own prejudices on someone regarding quoting or not quoting Mark Twain, or anyone else that they thought was apt and to the point. So you’re in luck, Sparks … I’m not going to bust you for your anti-Twain rhetoric. You put what you want in your comments … but you might as well give up trying to control who I quote.
That dog won’t hunt.
w.
Maybe it’s just me, but Figure 1 doesn’t peak at 2004. The peak looks like it is at 2007. But that may screw-up your meme about the second peak of Solar Cycle 23 in 2004 and the big fall in the Ap Index in 2005 down to solar minimum-like levels.
Just my $0.02 .
Ditto. That was what struck me at first glance — 2004? Huh?
Nonetheless, I do think that our star influences climate by more that the models account for, even if the mechanism isn’t entirely nailed down. Since the temperature run-up coincided with the Modern Maximum of solar activity, it was hard to tell, but Nature is running the experiment for us as we speak. The recently ended cycle was the weakest in almost a century.
Yes, that caught my eye also. And, what do we know about 2007? That is when the first major Arctic sea ice dip took place. The loss of sea ice removes insulation from the cold Arctic air. The oceans have been losing lots of energy which has warmed the Arctic.
Two separate observations explained. The warming of the Arctic and the cooling of the ocean. Unfortunately, we know warmists will blame both of them on CO2.
I have been reading this blog for a long time and over the years have come to an understanding about what is going on. There is till much i have not pieced together.
Here is a short summary:
The geenhouse effect is real.
AGW is real , Man likely has some influence on climate, especially at the local level. Overall the numbers indicate lower than 10% globally.
Overall the Holocene has been cooling towards another glacial period and that trend is likely to continue.
CO2 as well as C2H4 are established as greenhouse gases.
CO2 and C2H4 are not the control on climate and may at times act as a warming aid and other times combine with other phenomenon to cool the atmosphere. CO2 and C2H4 effects are poorly understood and there is little real conclusive connection of CO2 and C2H4 to climate effects vs natural variation.
The sun is the ultimate driver of weather and planet temperature but may not be directly involved in short term climate variability.
The likely driver of short term climate variability (30 to 2000 yrs+) is the oceans combined with the hydrologic cycle. Again poorly understood.
Surface temperature records are hopelessly unreliable for anomaly climate work and ripe for political bias.
CAGW does not exist and eugenics is certainly involved in some way.
Doesn’t matter what climate does, the surfs get fleeced. Always keep your eye on the pea.
The oceans likely have climate phenomenon associated with them that man is currently and totally unaware of. The same goes for the sun and the cosmos.
Humans have wasted much money over the last 35 years on climate and gained little understanding.
Lief and Mosher are not idealists, just realists.
That’s it in a nuts shell.
Do you mean CH4, ie methane, or C2H4, ie ethylene?
little slow today. I meant methane CH4. Typing today by hunt and peck after hand injury from bike accident. I loose the train of thought.
Hope you get well soon.
Typing while wounded: above and beyond the call of commenting.
Pierre DM, can we summarize an understanding about what’s going on:
Reading WUWT while biking a long time over the years.
Finally typing today after hand injury from bike accident.
In a nutshell.
[Congratulations on your recovery. .mod]
Might I suggest not reading WUWT while biking?
Not reading while biking, no writings in nut shells.
A former pastor of mine had a placard on her wall, on it was half of a walnut shell. Inside the walnut shell was a small piece of paper on which was written John 3:16. The placard was entitled, “The Gospel in a nut shell”.
– nuts shell?
Typo or an apt description of our little WUWT universe?
“Lief and Mosher are not idealists, just realists.”
Mosh is neither a idealist, nor far form a realist,. He is undoubtedly an opportunist..
To quote the inimitable Mosh, “All raw data is crap data,”
Not exactly a view of someone who has a true interest in science or an interest in the .truth.
““All raw data is crap data,”
yes for SST and SAT…. the raw data shows MORE WARMING..
but go ahead.. forego quality control
Mr. Mosher, forever condemned to “Wandering in the Weeds.”
All of his little squiggles in the data will mean nothing come mid-2020. [None of yours will, either.]
Take a chance! Make a bet! Temps up? Temps down? Temps flat? It’s only AGW on the line. AR6 is already shaping up to be a massive joke. Read IPCC’s plans. Make a bet! What fools you are.
Mr. Mosher can’t make a bet. He is constrained by his data-mongering nature. A congenital lack of imagination? Innate fear of real risk-taking? I can only but imagine a Mr. Mole when I think of him. On the other hand, maybe he is aware of how the various charlatans could manipulate the results? That could lead to a major pucker factor on his part. I might hesitate to bet, if I were him!
I’ll bet flat. That way, no matter what happens, I’ll take it or argue it up or down, as needed. Screw you and your tenths or hundredths of a degree. I’ll hire Mr. Mosher to prove whatever I say! Data is only as good as the guy who makes it.
Actually, I love Mr. Mosher. In him I have found the perfect foil for my climate blogging fantasies; he reminds me of an older brother of mine I always made fun of because of his waspish but nerdish and earnest nature. I’ll always refer to him as the whimsical “Mr. Mosher.” It would ruin it if I ever met him.
Seriously, guys, gals and others, the end of the dance draws near. Mostly, you have placed your bets already. The early 2020’s must decide the outcome if global temperatures are the metric. I guess if one muddies the water with “climate change” one could continue the arguments indefinitely. If so, count me out.
Adios,
Dave Fair
Reg Nelson August 21, 2016 at 12:43 pm
While Mosh’s style of posting sometimes drives me nuts, he’s right about raw data being crap data. Only a fool would take data just as it was captured in the wild and use it without FIRST subjecting it to any relevant quality control, verification, validation, external comparison, internal structural analysis, instrument variation investigation, and the like.
FOR EXAMPLE: Suppose I took temperatures for ten years using several instruments, and later I found out that one of the mercury thermometers used for two years was ruled incorrectly at the factory and read one degree low.
QUESTIONS:
1. Should we use the raw data as it sits? or …
2. Should we throw out the ten years work because of the problem? or …
3. Should we simply add one degree to the incorrect readings and move on?
Pick your option, and you’ll see what Mosh means when he says raw data is crap data.
w.
“Pick your option, and you’ll see what Mosh means when he says raw data is crap data.”
Any data that doesn’t agree with his precious
computer gamesclimate models is crap data and must be Mannipulated until it does.“Suppose I took temperatures for ten years using several instruments, and later I found out that one of the mercury thermometers used for two years was ruled incorrectly at the factory and read one degree low. ” –Willis
Meteorological thermometers are, of course, calibrated after ruling. Your “one degree low” scenario requires a much better story.
Back in the 18th century most thermometers were calibrated in Reaumur units: https://en.wikipedia.org/wiki/R%C3%A9aumur_scale
Suppose that it was not always clear which scale was used [Reaumur or Celsius], then when constructing a composite of several observer’s data it could happen that the data from one [or more] observer was assigned to the wrong scale. When it is later discovered that the wrong scale was used, it is necessary [and easy] to convert to the nominal scale for the series [e.g. Celsius].
“it could happen that the data from one [or more] observer was assigned to the wrong scale. ”
You mean like the time the Mars probe crashed because the engineers mixed up which scale they used to program the decent.
“Pick your option, and you’ll see what Mosh means when he says raw data is crap data.”
I see lots of good raw data every day. Scads of it. Yes it is checked to prove it is good data. That is due diligence. There is a big difference between good raw data that has been checked and bad raw data that has been adjusted. I make the ‘lab rats’ change the font colour on every data point they change. They are not allowed to change raw data, that is sacrosanct, only their copy of it, so I can see if I approve of each decision. I check the guy who checks the raw data.
If I found that a temperature data set was out by one degree because of a factory flaw I will rage at the lab rat who didn’t find out when the thermometers were calibrated before the experiment. Where’s the QC protocol??
All data is good data until proven otherwise by a quality check. You cannot default data to the bad side without evidence because measurements ARE evidence.
It’s crap because it doesn’t show what you want it to show.
Yup, definitely interested only in the science. /sarc
Great summary AND a powerful statement. GK
Pierre DM: Good comment and pretty close to where I am at after watching climate change for about 60 years. I first got interested in the early Viking voyages and settlements at about age 11 and have read about history and climate affects on civilizations ever since. Clearly, history tells us that the climate always changes. And no doubt humans have an impact on regional climate and probably global climate. How much? Probably not much. Mostly natural variation. If the Netherlands can hold back the sea for hundreds of years, surely we can deal with a bit of climate change, whatever way it goes.
Adapt or die. Darwin was mostly right.
What we don’t know significantly outweighs what we do know.
Might want to add H2O vapor to that list of “greenhouse gases” …
Pardon me for asking a dumb question, but if -8°C water is making it to the surface of the North Atlantic, shouldn’t it increase Arctic ice cover?
I’m pretty sure that “sub-8C” means below 8C, not below -8C. In this case the ‘-‘ is a spacer, not a negative number indicator.
Definitely confusing.
This is simply not true.
I live in Norway, read daily newspapers and consider myself well oriented, but I have never heard any mention of failures of the wheat crop. The reason is that the temperatures are not falling and the crops are doing well.
Wheat production cannot be used as a proxy for temperatures in Norway. The production level is dominated by the subsidies the farmers receive for different crops.
Anyway, there is no reason to use proxy for temperatures, when good temperature data are available.
Norway has an excellent site for national climate statistics, although it is only in Norwegian language, the graphs should be easy to understand. See http://www.yr.no/sted/Norge/klima.html
/Jan
Have subsidies been cut, accounting for the drop in production?
I looked here on the farmer organization’s web site.
The subsidies are a complicated affair, but a clue is that they say that grain production in recent years has had very low pay per workhour, compared to other farmer products such as meat and milk.
/Jan
Thanks, Jan.
As the son, grandson, great grandson, etc of wheat and other grain farmers, I appreciate your looking. I know little of agriculture in Norway.
Thank you for the link Jan .
I highly recommend readers looking at that site and cycling through the individual months .
It was , to me , very interesting to note that over decades the trend is effectively flat for most months, except for the Spring period where there is a slight warming trend in the last 20 years . But the difference is very small compared to the year to year difference and is not something anyone would be alarmed about , surely – well not at present anyway.
Thanks, Jan. I’d already come to the same conclusion above, based on zero Google hits and the FAO data, but it is always a plus to get information firsthand. It’s just another of David Archibald’s attempts to prop up his failing solar theories.
w.
Indeed, Willis.
There is a language drop down box in the upper right hand corner. English is an option or here is a link to the English version http://www.yr.no/place/Norway/climate.html
Thanks.
This site tells me that:
“In recent years, the mean temperature in Norway has generally been higher than normal. The exception was 2010, which was one of the coldest years since 1900. The highest mean temperature was recorded in 2014 with 2,2 °C above average. Other years with high averages are 1934, 1990 2006 and 2011, with 1.8 °C above average.”
http://www.environment.no/Topics/Climate/Norways-climate/
So is this nut shell the one the pea is under? Sorry, couldn’t resist. I’m an inquisitive serf, m’ lord..
Sorry, meant to be a reply to Pierre.
There is an important advantage of cycle 24, it’s short term. Soon the outcome will be known.
As usual, no matter what climate change cause camp one favors, the science is never ever settled.
The spawning stock of Northeast Arctic cod is currently at a high level. The northeast Arctic cod is the largest cod stock in the world, and the population has for centuries been central to Norwegian fisheries.
http://www.mosj.no/no/fauna/hav/torsk.html
lol .. what go’s up must come down .. and for the last 3-4k yrs it’s been going up .. shame we see so little that has come before …and we prepare for what is now rather than what will come .. would there be a climate scientist that would say this is not true ?? i’m sure 97% of you would agree in the long run ..
I find fig 3 the most interesting. I immediately thought ‘ocean currents’ in relation to the steep rise (cooling) in the last 2 years. However the gradual cooling throughout the record is also interesting, and possibly more significant
The problem is establishing the degree of change. When one looks at charts one needs to study scale and convert change to a %. We could be talking about a pea on a pumpkin. I never did enjoy maths
Whatever, this is useful data and an example of why I keep coming back to this site
Thank you
Just another solar takedown by Willis. 😉
https://iceagenow.info/video-headed-ice-age-scientist/
PROFESSOR ZHARKOVA has no agenda which makes what she says meaningful.
Further she has a good chance of being correct.
As far as the climate of the earth this period of time is in no way unique.
The climate in the big picture is controlled by Milankovitch Cycles, Land Ocean arrangements, with Solar Activity and the Geo Magnetic Field Strength of the earth superimposed upon this.
These factors then exert influences on the terrestrial items on the earth that determine the climate.
Terrestrial Items
Atmospheric Circulation
Sea Surface Temperatures
Global Cloud Coverage
Global Snow Coverage
Global Sea Ice Coverage
Enso
Volcanic Activity
All of this gives an x climate over x time. The historical climatic record supports this.
That is WHAT likely makes the climate change, NOT the scam they promote which is AGW.
The historical climatic record showing this period of time in the climate is in no way unique while changes in CO2 concentrations having no correlation in leading to resultant climate changes.
Now how the cooling evolves will have to be monitored. Of course going from an El Nino condition to an La Nina condition is going to cause an initial cooling.
For clues that if solar is involved the depth of the cooling will have to be monitored and if the cooling is accompanied by the terrestrial items I have mentioned above.
Each one of those terrestrial items having been shown to be linked to Milankovitch Cycles Land Ocean Arrangements in the big slow moving picture while solar and geo magnetic variability being factors that can change these terrestrial items on a much smaller time scale.
The solar parameters needed are
Solar Wind sub 350 km/sec.
AP index 5 or lower
EUV LIGHT 100 units or less
COSMIC RAY COUNTS – 6500 or greater
SOLAR IRRADIANCE – off by .15% or greater.
All very attainable going forward and being compounded by a weakening geo magnetic which if attained with sufficient duration of time will translate into bringing the terrestrial items that control our climate to values which will cause the climate to cool gradually if not in a sharp drop off if certain thresholds should be meant.
In addition the Arctic is starting to cool and the global temperatures from this point on will be down.
I really don’t care what any of you think. I’m far more concerned about a colder climate than a warmer one. Cold kills far more of us old folk than warm weather does.
My prediction is alive and well and once the low average solar parameters I have called for are attained then we shall see how the cooling evolves.
UV light is weakening and this is the wave length which penetrates the ocean surface the most and is responsible for the warming of the oceans in addition EUV light is on the decline which will influence the atmospheric circulation patterns. This will result in an increase in global cloud coverage, snow coverage and sea ice coverage.
Galactic cosmic rays will be on the increase which should result in more global cloud coverage and volcanic activity both cooling agents..
Solar irradiance itself will be on the decline which should aid with a .2 c drop in global temperatures in addition to what I have mentioned.
The real key to cooling is to get an increase in albedo which only needs to be on the order of .5 to 1% to get marked cooling wiping out all of the recent temperature gains.
volcanic activity is caused more by coronal holes which while the sun is in a low period are more common and can be larger ..
coronal streams effect large portions of the earth and the weather .
I want to remind you that we are in the process of inversion of the magnetic poles and we have a weaker magnetic field by 20% compared to the 1600s
A weaker magnetic field allows more of the lower end frequencies, such as microwaves. If you have a microwave oven in your house you will know that the microwave only generates one frequency to heat your food. Your food will not cook if water is not present. In fact except for water vapor already present, it wont even heat up. You might ruin your device though as there is nothing to absorb the waves. Microwaves are used extensively in satellite observations as they zip through clouds. Of course water won’t heat up immediately from a declining magnetic field. Nor will the water in your microwave.
Unfortunately I can’t find a read out of how much energy in the TSI is in different wavelengths. A magnetic field has no effect on light frequencies and above.. ( except exceptional strong fields like galaxies) .
While this may explain part of what’s going on today, it doesn’t explain past fluctuations.
A weaker magnetic field allows more of the lower end frequencies, such as microwaves.
No, there is no such ‘allowance’. A weaker solar magnetic field also means a lower microwave flux.
http://www.leif.org/research/HMI-Nugget-1.pdf
Unfortunately I can’t find a read out of how much energy in the TSI is in different wavelengths.
Earth’s magnetic field has declined. That does have an effect on incoming microwave energy.
No, none. And the microwave energy is truly minuscule and have no effect whatsoever on anything. It has been estimated that the total energy of all the radio [and micro-] waves ever received by all our radio [and micro-] wave telescopes since they were invented almost a century ago equals the kinetic energy of a single falling snow flake.
So the sun puts out very little energy below the IR Band? Really? Anyway this argument is academic anyway. However, as you know the field strength at the equator is different than at the poles. A decline at the equator would have very little effect on climate. However, moving towards the poles one would see an increase due to the cross sectional field decreasing significantly. Additionaly, there is the time component associated with warming due to energies in that band. Without knowing for sure what those energies are, I can’t calculate. But prima facia, it would look a lot what AGW says would be happening, in this particular instance. I suppose I could do a calculus problem and set it up so that one variable would be time function of energy and another with decreasing field strength from the equator to the magnetic pole and over time.
Perhaps if I do it backward I can calculate what that energy might be ( how much) over a 170 years.
Like I said it’s academic because I have no way of knowing whether the magnetic field strength weaken or increased during other time periods. I also don’t know what the Flux level is at a particular wavelength I am interested in, 2054 Mhz at top of field strength.
Just to give you an idea, I’ve seen some really strange things with lighting. I saw a plasma cloud set up over a house from lighting and fed energy into it for over an hour. Every piece of metal, silverware, edging, electrical wiring and components, door knobs, plumbing,( stick your hand in the toilet tank to see if the waters warm… no thanks, you first) and things you wouldnt think had metal in it, cooked. The house did not take a hit from the lighting.
One other thing that is puzzling to me is salt. Namely the sodium part and it’s ability to hold heat. As you also know pure water will not carry an electrical current. It’s a pretty good insulator. Salt water on the other hand conducts pretty well.
In any case, if I had a choice, I wouldn’t live on this rock. So very little to which there is control over. At the mercy of whatever happens at any given time. Except for an extremely few people, most of us live in little spaceship like pods, called houses.
I’m not done with this. The magnetic field exists for a reason. I think that without it, this planet would be a dead one. A 20% drop, as has been reported, I last saw 10%, but even so the field strength at the poles is substantially more. It is not a uniform drop everywhere, and can not be calculated as such. That’s not to say there aren’t spotty stronger umbrella areas, it means it isn’t a straight line.
http://www.windows2universe.org/sun/spectrum/solar_em_spectrum_smoothed_graph.gif
The Sun emits very little microwave energy.
Svalgard = Mosh very credible science. Just being sarcastic sorry if I offend LOL
I have( I must say) the best most straight forward comprehensive theory as to why and how the climate my cool. I have sent the complete theory over this site in the past which the monitors of this site found to be very interesting. How do I know because they said it after I sent it and I have that saved.
@Mike the Morlock: yes, “solar cycles” have been observed on some nearby stars.
http://www.aanda.org/articles/aa/pdf/2012/07/aa19046-12.pdf
The deniers of a solar /climate connection are in fantasy land because all of the data show this not to be the reality. Cooling is coming the question is how extensive will it be and how will it evolve.
This first stage of the cooling having an ENSO connection.
Cooling is coming the question is how extensive will it be and how will it evolve.
And since it has not arrived yet, the question is also ‘when’. There is no doubt that cooling will come eventually [almost certainly in several thousand years], but nobody knows when.
It is happening now.
No sign of it.
Since around ’07.
=============
Since around ’07. ?w=720
hardly:
We shall see, Leif. Your illustration is of a tiny portion of the total. It is however, a pertinent portion and by a method in which I have trust.
================
For example, how much cooling of the ocean is represented by your lower tropospheric temperature spike recently? Maybe ARGO is showing it as we speak. I haven’t the chops to calculate it, but you do.
==========
http://ossfoundation.us/projects/environment/global-warming/myths/images/mwp/ipcc_6_1_large.jpg
Sal, i found this interesting ipcc reconstruction graph… note the dalton dip (!) Goes to show what a little change in solar output can do. It’s my understanding that there was a volcano (tambora?) about that time, too. At least this gives us a taste of what may or may not happen…
Yes, starting winter 2017-18 using past plunges in ENSO as a guide then declining AMO after that. These are artifacts of solar. Real time solar minimums might contribute slight cooling but great effect regionally with stronger jet streams and cooler summers.
ur comment is lost due to some grammar error
lost in translation
Steven Mosher’s charts on temperature trends since 1900, 1950 and 1970 raise some interesting questions. They demonstrate that “‘global warming” is not global. Why is the greatest warming trend above 60 degrees north? Why does the smallest warming trend occur across all of the southern hemisphere? Is it the water/land ratio? Or does it get less sun? What meaning is there in reporting that the average global temperature is about 15 degrees C? Would 16 degrees be catastrophic?
“Steven Mosher’s charts on temperature trends since 1900, 1950 and 1970 raise some interesting questions. They demonstrate that “‘global warming” is not global. ”
global doesnt mean everywhere. technically it means in any given random location.
Why is the greatest warming trend above 60 degrees north?
Polar amplification, and you have localized feedbacks.
Why does the smallest warming trend occur across all of the southern hemisphere?
Ocean
Is it the water/land ratio?
Yup
Or does it get less sun? What meaning is there in reporting that the average global temperature is about 15 degrees C?
Very little meaning. its just a top level low dimension metric
Would 16 degrees be catastrophic?
probably not. if you live by a coast… maybe..
Robber,
There are almost no thermometers above 60 degrees N. Mosher knows this, and loves it, as he and his boss, Professor Mueller’s DAUGHTER, can spin this scant data any way they like. Guess which way they like?
And the media love it too, as a story encouraging us to destroy the economy of the First World appeals to media types, all of whom chose not to participate in the economy of the First World. Coal, oil, gas, which have produced Prosperity, all ENEMIES! Corporations which produce prosperity do it by Corruption.
This is where guys who cannot make it in the Corporate world find themselves, inevitably…
“Why is the greatest warming trend above 60 degrees North?” Because that is where there are almost no thermometers, and BEST can claim accurate extrapolations across 1,200 kilometers.
Because Professor Mueller’s daughter told him to do this.
Because Mosher needs a job, having been run out of the Profitable economy.
Sorry to dance on your head Steve, but you ask for it daily…
Global cooling is proof of global warming, just like everything else
Yes, the North Atlantic appears cooling, and 100F plus days across the globe are fewer than in recent decades. Claims that months in 2016 are the warmest on record are based on anomalous peak daily temps. above rend lines. Its like measuring micro-sunspots vs. actual visible sunspots.
CAGW folks argue/disagree in private.
Skeptics do it in public.
Just an observation.
Not true. watch Gavin criticize wadhams.
Has Gavin become that much of an outlier?
Did he also criticize Paul Beckwith too?
Way to respond to a probabilistic argument with anecdotal evidence.
Geez mosh.
Maybe if “JohnWho” had written something along the lines of
“CAGW folks always argue/disagree in private.”, or
CAGW folks only argue/disagree in private.”,
your point would be more probative.
The exception proves the rule. Moshestatistics.
============
JohnWho, your comment just jerked my head around. It slapped me silly with the realization that the “consegnati” would privately hold divergent beliefs, but withhold their true opinions in the public sphere.
The implication is that when an outlandish or untrue pronouncement is bruited by fellow climitariat members or compliant media outlets, all denizens of the “in crowd” will be expected to withhold any critical comment. That refusal to confront error reflects the evil results of ideological and coercive thought processes on the human soul. To sit idly by when untruths or shaded interpretations are propagated throughout professional and popular media is the ultimate in self-debasement.
Man-up, worms. If you cannot publicly speak known truth in the face of contrary orthodoxy, then why should the public support your pointless existence? What value have you? Simply regurgitating tired lines of study is not scholarship nor science.
Most of my intended audience will be uncaring of my exhortations. A few of you, hopefully, will look in the mirror. For that minority, I can offer only the many scars I bear from speaking truth to authority. In recompense, I have the memories of many triumphs, spiritual and monetary.
Dave Fair
I’ve long suspected that there will come a time when we feel sorry for these trapped climate scientists.
===============
Yes, first my observation is “in general”. There are virtually always exceptions. This thread stands as an example of how various “skeptics” disagree. Hopefully it enhances good science and our understanding of the climate. Contrast this to the CAGW folks responses to the bad science and misunderstandings that is the mainstay of the “SkS” site: crickets chirping.
I believe that Stephen Mosher could spend, in general, every waking moment for the next solar cycle correcting and debunking the misinformation on that site as long as he did it on his site because they would erase/delete his comments. I suppose though, that he wouldn’t think it is the “best” use of his time.
I about half think that with some of them, though it may once have been about fame money or power, it is now about shame.
==============
I was skeptical of this claim, given JB’s recent talks about the heat in the Atlantic and the hurricane season. But the NCEP data is backing up David Archibald’s claim about the North Atlantic running cooler.
Interesting…
Let me say this which is this period of time from now going forward gives us an opportunity to see who is on the correct path.
so…not enough advection and CO2?
God “Earth” (He sits at the center where his home is) is fighting back against Human Beings (Not Mankind) and their destructive Global “Warming” behavior by “cooling” our Oceans (And cooling the Sun too because He is all powerful) and bringing upon us an Ice Age !
The only thing that We can do to save ourselves is to give Him back “all” of the Oil We have extracted (With “Interest”), give Him back all of the Natural Gas We have extracted (With “Interest”), put/poor all of the Coal We have extracted into the mouths of Volcanoes so that it might find its way back to Him as to “restore” our Planet back to where it was when He created it !!!
It’s our only “Hope” !
Perhaps if the cooling gets to extreme before We can can complete our assignment, He can “Bring Fire down from the Heavens” to give Us warmth again ?
Perfect !
The dive is just getting started. The fact that Brits have not recognized the risk is unfortunate. They have the most to lose here, especially with policy directed in the opposite direction. Getting a seasonal or shorter term prediction backwards is nothing compared to this.
Hi Dr. S.,
The illusion still growing. Take a look again at the focusing cone and read the text below.
Then we can get back to MRI magnetic rotational instabilities.
http://www.leif.org/research/He-Focusing-Cone.png
MAGNETIZED JETS DRIVEN BY THE SUN: THE STRUCTURE OF THE HELIOSPHERE REVISITED
M. Opher1,3, J. F. Drake2, B. Zieger3, and T. I. Gombosi4
Published 2015 February 19
http://iopscience.iop.org/article/10.1088/2041-8205/800/2/L28/meta
….The overall two-lobe structure is consistent with the ENA images from IBEX that for the first time mapped the heliotail. Such images show two lobes (McComas et al. 2013) with an excess of low energy ENA (2 keV) around the solar equator. A view of the data from the MHD simulation (Figure 5) also reveals two lobes centered at high latitude (seen in the lower density and higher temperature of the heliosheath). It is possible that the denser ISM between the lobes at low latitude is responsible for the two lobes seen in maps of the low energy IBEX data (via a pick-up ion contribution in the ISM or a secondary ENA process)…
…The two-lobe structure of the heliosphere is similar to astrophysical jets in protostellar systems (Fendt & Zinnercker 1998; Gueth & Guilloteau 1999) and clusters of galaxies (Owen & Rudnick 1976; Douglas et al. 2011), which are collimated by the magnetic field and are often seen as bent as a result of interaction of the jets and their surrounding media….
MAGNETIZED JETS DRIVEN BY THE SUN
Yes, it is the Sun that control the jets, not the jets that control solar activity.
One more time: nothing [magnetic or electric] from the outside can travel upstream all the way to the Sun and influence solar activity.
David Archibald’s pronouncements certainly have a track record of being flawed, but who else is commenting on the sharp fall of North Atlantic OHC? Why?
See https://wattsupwiththat.com/2016/08/21/the-north-atlantic-ground-zero-of-global-cooling/#comment-2282646
Yeah, but does the temp show this in the sea surface nighttime ships buckets or whatever karelization of temp method was used in 2015? Karl was handed the short straw because he was a year away from retirement and he’s now collecting his 75k a year forever.
Remember thousands of Argo buoys didn’t perform as expected so we’re abandoned in favour of NCAR/NOOAA/NASA few hundred ships in the night.
Gary, your “75k per year” indicates you do not understand senior Federal Government pension packages.
If the NA is cooling it hasn’t affected Norwegian grain production significantly yet.
https://www.ssb.no/en/jord-skog-jakt-og-fiskeri/statistikker/korn/aar/2015-11-26#content
There’s a slight long term downward trend in grain production but that could be for reasons other than weather/climate.
I am intrigued by the comment from Salvatore above (Aug 21 , 2.12 pm ) that the UV component of the solar spectrum is weakening . Is there any confirmation of this from NASA or academic research?
My interest is due to my observing the apparent inability of my tomatoes(here in Cheshire, UK ) to ripen despite being plump, green and blight free for weeks now. By now I should have enough red tomatoes to launch my own Spanish Festival but they are not responding to the daylight despite day and night temperatures being normal or slightly above normal for the past month .
Effectively my tomatoes are chemical dosimeters, like the Fricke and ceric sulphate dosimeters used by radiation chemists for years before solid state sensors , so something is different this year.
I have been doing what the distinguished Prof Mann advised us to do : observe climate change by looking out of the window – in my case at my frustratingly green tomatoes .
I am intrigued by the comment from Salvatore above (Aug 21 , 2.12 pm ) that the UV component of the solar spectrum is weakening . Is there any confirmation of this from NASA or academic research?
The UV follows the sunspot number, so as we move towards the coming solar cycle minimum [in about 3-4 years], the UV will decrease, but it does that during every solar cycle so there is nothing special about the current one.
Western Mojave Desert, CA. Palmdale and Lancaster and Mojave. Year is 2002. Weeks at a time in summer the max is 110-115 F. Forward to this year. Not one day over 105 F. Highs now in August around 95 F. That is 20 F cooler than normal. Very few days around 105 F last year. Things are dramatically cooling here as well. Noticed this for the past 3 years.
There has also frosts in Europe in August.
The coldest August night on record for the Netherlands.
3 feet of snow in New Zealand, normally just a dusting.
Snow on 6 of the seven Continents.
But in the world of Adjusted Temperatures it is the hottest month/year ever, just not in the real world.
Just like the current Historic Temperature record does not match the actual real world experiences of our ancestors.
I met a blueberry farmer from Idaho a couple of years ago who said the same thing – it was getting colder and that was affecting his crop.
The vineyards planted in OR and WA in the past three decades are in danger of winter kill in coming years. A friend of mine, who made a fortune in potato chips, lost most of his excellent vineyard to a single digit F temperature November cold snap in the Walla Walla Valley in 2014. He’s selling out.
The author of this article, David Archibald, appears to be the same individual who predicted in in 2009 that temperatures across mid-latitude regions, specifically New Hampshire in the US, would decline by -2.2 C over the course of the current solar cycle, No. 24: http://www.davidarchibald.info/papers/Archibald2009E&E.pdf
Solar cycle 24 started in 2008 and appears to have already peaked. It is currently in decline: http://www.swpc.noaa.gov/products/solar-cycle-progression
During the course of SC24 to date, temperatures across New Hampshire have *warmed* slightly (+0.5 F/dec), not cooled at all: http://www.ncdc.noaa.gov/cag/time-series/us/27/0/tavg/12/7/2008-2016?base_prd=true&firstbaseyear=1901&lastbaseyear=2000&trend=true&trend_base=10&firsttrendyear=2008&lasttrendyear=2016
Five new state-wide monthly warmest records have been set in New Hampshire since 2008, including most recently December 2015, which beat the previous warmest December by 3.6 F. This during a period when David was predicting record fast cooling.
Caution is required when assessing the value of David’s solar-based temperature forecasts.
Archibald has made a prediction. We shall see if he is right in the next 6-10 years. This is how science should work. That being said, I wonder if more time should be spent studying events like the Younger Dryas (and other Heinrich events) cooling. Whether caused by the slowing of the AMOC, a surge of glacial meltwater, a comet or meteorite, or any other theory, the question is why did it NOT lead to an Ice Age.
Chuck L
“Archibald has made a prediction. We shall see if he is right in the next 6-10 years.”
____________
David A is a prolific maker of solar-based temperature predictions (see the ‘mid-latitude cooling of -2.2 C during solar cycle 24’ episode detailed above, for example). He appears to be less prolific in acknowledging the failure of his predictions when they turn out to be wrong.
As far as I can see, where sufficient time to judge their outcome has elapsed, all David A’s solar-based temperature predictions to date have failed.
True, but at least he puts the predictions out there so others can judge.
If one is a skeptic, one wrong prediction is sufficient to destroy your reputation forever.
However for alarmists, no amount of bad predictions will ever harm your reputation with the true believers.
If one is a skeptic, one wrong prediction is sufficient to destroy your reputation forever.
If all of your many predictions are wrong, your reputation takes a really big hit.
That has not proven true for those who back the CAGW line.
People maybe mocking it’s only the North Atlantic Ocean, but this region has been shown in numerous papers to be a key cog in Northern hemisphere temperatures and global temperatures. Understanding how this region influences global temperatures is key to understanding future climate. Please don’t remain ignorant like the alarmists have for many years.
ALBEDO IS THE GAME AS OPPOSED TO CO2 TRAPPING LONG WAVE HEAT RADIATION.
This is what is going to determine the future course of the climate.
The most important factors determining albedo are clouds, snow coverage, and sea ice coverage.
If these factors change albedo will change and hence the climate.
Great post. It’s spot on, if a bit early. Someone has to be early though. The critique is rather off base using global temps and century long averages of solar output. The point is ocean cycles, not averages and most likely regional changes ahead of global measures.
Say look at the AMO in the Gleissberg solar minimum in the late 1880’s. A warm AMO, moving generally anti-phase to sunspot cycles, it’s warm because negative North Atlantic Oscillation increases through solar minima. That’s why there was a brief AMO/Arctic cooling around this last sunspot maximum. The AMO is cooking now, and should do a strong warm phase though to the next sunspot maximum.
http://www.woodfortrees.org/graph/esrl-amo/from:1880/mean:13/plot/sidc-ssn/from:1880/normalise
Don’t underestimate the rate of AMO pull back, somewhat like the El Nino collapse on a shorter time scale.
http://www.climate4you.com/images/NOAA%20SST-NorthAtlantic%20GlobalMonthlyTempSince1979%20With37monthRunningAverage.gif
Given that the solar cycle to AMO phase reversal would have to be solar in origin, it demands a solar metric that is weaker around sunspot maximum but generally stronger through the rest of the cycle when the AMO is cold, and the full reverse of that when the AMO is warm.
http://snag.gy/PrMAr.jpg
Given that the solar cycle to AMO phase reversal would have to be solar in origin
That is not a given.
It most certainly is. There could be no ‘internal’ reason for such behaviour.
That you don’t know of or can think of one, does not mean there is none.
If you make a claim, you must show by analysis that the claim is justified.
Otherwise it is just plain argumentum ad ignorantiam.
You claimed “That is not a given”, yet you showed no justification for it.
The old Latin saying Onus probandi addresses that problem:
“onus probandi incumbit ei qui dicit, non ei qui negat” the burden of proof is on the person who makes the claim, not on the person who denies (or questions the claim).
How could such a relationship with solar activity not be connected to it?
UV is the one to look at
it is the main one that feeds the oceans with energy
“UV is the one to look at”
That cannot explain the phase change.
For me, this is the most remarkable chart I have seen. It not only show a strong link between solar and the AMO, but also predicts a reduced solar wind strength around the sunspot maxima during a cold AMO, like around 1969 and 1980.
http://www.woodfortrees.org/graph/esrl-amo/from:1880/mean:13/plot/sidc-ssn/from:1880/normalise
ulrich, the AMO is well documented in paleo-studies since at least 500 years: https://www.researchgate.net/publication/241061486_A_Tree-Ring_Based_Reconstruction_of_the_Atlantic_Multidecadal_Oscillation_Since_1567_AD
The periode is 60…100 years and it seems to me not very likely that in every reversal the sun was the main driver.
ulrich: “There could be no ‘internal’ reason for such behaviour.” How do you know it? This paper says: “Solar forcing is therefore not likely to be responsible for the dominant 55- to 70-year Holocene AMO pattern, ..” http://www.nature.com/ncomms/journal/v2/n2/full/ncomms1186.html . Much more likely is a ocean-atmosphere-cryosphere mechanism.
best
Frank
How could such a relationship with solar activity not be connected to it?
It is an interesting article and set of arguments as always.
1. Saying that the AMO cooling is linked to “persistent” Norway wheat failures is a very, very strong line to draw. I am sure there is not a single factor that would cause a direct correlation between it and the failures. Perhaps a better conclusion is that the AMO cold could increase the rate of failures. I am sure that the AMO is a significant influence in Europe, just like The Blob in the eastern Pacific is on the US. But not the ONLY influence.
2. I hate “may” and “if” on the other side of the argument just as much as I hate it on the AGW side. If temperatures continue to warm at the rate they did from January through July this year, in 2100 we will all melt like they did in Indiana Jones when they opened the Ark. The “ifs” and “buts” will drive you nuts.
3. I think the AMO is much less understood than El Nino/La Nina, and we don’t have a great understanding of those either. For instance, forecasts/outlooks widely held a crash to a deep La Nina after such a steep climb in El Nino, when in fact it could be just borderline Nina/neutral or weak Nina. If those fundamental errors can be made with ENSO, how little do the experts know about AMO?
4. We all know that “adjusted” and “corrected” temperature data is flawed. It completely muddies the waters for any analysis from it. In actuality, satellite data for maybe 35+ years (1979?) is the only accurate surface temperature record we can rely on. Not NOAA, which has managed to shave almost 2F off Jan 1977’s already record cold in the eastern US in how they calculate “30 year normal”. Anybody with a calculator or Excel can use NWS station data to disprove “30 year normal” via simple arithmetic.
5. I would think that one or two solar cycles worth of data is too little to draw a conclusion with it and the AMO. It certainly LOOKS like it follows the trend, but any reasonable scientist would want to see several more cycles and some variations in cycles to see if the AMO follows.
6. The article does touch upon solar influence which I regard as the most important factor into global climate. What would the surface temperature be if there was no sun? If the sun was a red giant? Therefore it stands to reason that fluctuations in the heat radiating from the sun would cause fluctuations on the earth. I defer to lsvaalgard for all things solar, but I think that the solar influence is incredibly underestimated as a climate influence. Unfortunately it will be another 20 or 30 years before we can bear that out, given what looks like 2 or 3 weak cycles in a row.
Just my 2 cents…
Exactly Kevin.
Kevin: “What would the surface temperature be if there was no sun? If the sun was a red giant?” response: This blog woudn’t exist because nobody could ask this question. Anyway: For our earth it’s not the question that matters. A question of great interest would be: What impacts do we see when the output of the sun oscillates as ist does? Too less!
JoNova August 21, 2016 at 8:45 pm
Thanks for your comments, Joanne. First, the graph was put up on David Evans site. It was described there as follows:
Now, David said nothing about the graph being his and not yours. At that time there was a whole host of back and forth discussion about the graph, which was well known to you. I note that NEITHER YOU NOR DAVID EVANS SAID ONE WORD IN DISAVOWAL OF WHAT YOU NOW SAY IS DAVID ARCHIBALD’S WORK ALONE. Not one word. In particular, you and David Evans did NOT say that his predictions were in any way incorrect or unrepresentative of your model.

But now that your forecast has proven to be garbage, now that your prediction is shown to be junk, NOW suddenly it is only David’s child and you had nothing to do with it? … boy, I gotta add that whoever said “Success has many mothers but failure is an orphan” was a better forecaster than you, because they sure saw you coming …
Hey, Archibald, are you just going to stand there and let her kick what is now revealed as your graph alone to the curb? Did you just make the graph up out of the whole cloth as JoNova implies? Do you agree that your graph is an incorrect representation of David Evans’ theory as Joanne now claims, and that the forecasts shown there are wrong, wrong, wrong as she implies?
The world wonders …
But heck, Jo, since it appears you are suddenly allergic to David’s graph which caused no reaction in the past, how about we use this one instead? Because this one is assuredly yours, but just like David’s graph, IT ALSO PREDICTS THE SAME 0.6°C COOLING by the year 2017.
Since your graph gives the same improbable forecast as David Archibald’s, 0.6°C cooling, a century’s worth of cooling over a mere three years, why your sudden Pilate-like denial of David’s graph that didn’t bother you one bit in the past?
And do you still think that we’ll see 0.6°C cooling by 2017?
…
In fact, Joanne, I have NEVER felt “welcome” at your site. Every time I’ve said something supportive it’s been fine … but whenever I asked hard questions I got nothing but bafflegab and delay from you and David and ugly personal attacks from the peanut gallery, so I gave it up.
So although I posted there for a while at the start of the series, I got tired of waiting for David to reveal things. Far too often his answer to a question was I’m not going to tell you now, you’ll have to wait, it will all be revealed at some future date.
Now, if you want to unroll your ideas one teasing drop at a time like it was a Dickens serial magazine story in 1870 instead of waiting until the story is complete and publishing it all at once, that’s your privilege … but don’t expect the rest of the world to sit at your feet and wait patiently for the drops of wisdom to fall. I got bored with y’all saying “Just wait and it will all be revealed”, and I left … so sue me.
You don’t have time to NOT correct the misinformation in comments here, because if you can’t sell your theory here, you can’t sell it anywhere but your own site and maybe Tallbloke’s shop. As someone commented at your own site, “… after years of reading skeptic blogs, it’ll be hard for me to believe this until Steve McIntyre approves the math and Willis Eschenbach likes the model.”
Yeah, I know you’d like me to “say nothing” … not gonna happen, neither for me nor for lots of other wise people. Me, if I see someone driving a bus over a cliff, my first statement is not “Is this bus part of an extensive research project that has been going on for more than two years, because if so I shouldn’t comment on the imminent crash”.
Instead, my first statement is “You’re driving the bus over the cliff”. We can discuss if I’m right or not, but I will speak up then. On your site the readers don’t ask the hard questions and point out the ugly imminent crashes, it’s all softball, plus of course you have your coterie of “wise” people who simply shut up.
If you would actually like to get solid critical review of your work, I’d suggest you post it up here, and that you stick around to field the difficult inquiries …
Best regards,
w.
Brevity is the soul of wit.
Mr. Archibald’s work has been little changed in its overarching themes since I discovered them in 2007.
Willis, I’m a new recruit over at that so called ‘peanut gallery’ and haven’t had the pleasure of your company, and wonder if you could give me a critique of this graph?
http://www.landscheidt.info/images/Powerwave.png
Thanks for the invite, ironicman.
What to say about the graph? Well … to start with, it has the problem that always happen with the work of He-who-must-not-be-named-at-WUWT, which is that Ted (and now his followers) choose various points on some curve and give them names like “Medium” and “Strong” and “Weak” … what do they refer to and how were they chosen?
Then there are supposed to be “reversals”. I always found this to be special pleading invoked to explain away the times when things are going opposite to how the whizbang theory says they should go. I wrote to Ted to find out how he determined the “reversals”, but I fear that all I got back was bafflegab about “big hand formations” and the like.
Next, anything that comes from Nicola Scafetta has an approximately 99.956% chance of being nonsense. Scafetta routinely refuses to reveal his methods and math, which alone is enough to totally discredit his work.
Finally, there is a huge problem with Ted’s work. Yes, there are variations in angular momentum of the sun around the barycenter, but physics says that the only effect that will be felt is tidal. Other than that, planets in orbit around a sun are IDENTICAL to planets in free-fall. And that leads to the real problem. Ted thought that the gravitational forces of e.g. Jupiter or Saturn were the cause of sensible disturbances to the sun, and thence to the planets. But in fact, only the tides are sensed on the planet or the sun.
So … care to guess how high a tide Jupiter can raise on the sun?
One stinkin’ millimetre … and if you think that is enough to affect the climate on earth, well, then there is no scientific hope for you.
TL;DR version? It’s just like the rest of Ted’s stuff, full of sound and fury but signifying nothing.
Look, if the theory worked, they wouldn’t have to dick around with unverifiable guesses about what will happen between now and 2100. If it worked, they would hone the theory on half the data and using that, be able to hindcast the evolution of the sun since 1850 or so … but they can’t do that, so they bother us with predictions of the future.
All the best to you, keep asking questions,
w.
Willis always tortures the data to make it somehow validate the point or points he is trying to get across.
Which is the climate is very stable and yet the earth has alternated between glacial and non glacial conditions and even more telling very abrupt climatic changes sometimes in the course of decades.
That fact renders his thoughts on the terrestrial thermostatic climate regulators he subscribes to as being plain old wrong for if it were the case the climate would always remain in either a glacial or non glacial state once that mode in the climate were to be attained.
This in turn strengthens the case for climatic influences that go beyond the notion that random slight changes in terrestrial climatic items will maintain the climate in a steady state oblivious to extra terrestrial influences.
Yes, Salvatore, there are problems with Willis’s thermostat hypothesis in that it is incomplete for reasons I have given him several times and it ignores the effect of solar induced albedo changes via cloud quantity variations.
I’m perfectly content with Willis’s simple observation that convection at the equator ramps up at a specific temperature which I attribute to the weight of the atmosphere bearing down on the ocean surface at the equator. That weight determines the energy value of the latent heat of vaporisation and so is critical to setting the amount of evaporation at a given level of solar input.
The thing is that albedo changes then affect that level of solar input on average globally so that one can have a rise in system temperature in conjunction with enhanced tropical convection whilst the temperatutre at which the enhancement occurs remains the same.
Willis doesn’t know as much as he thinks he does IMHO.
Stephen you are so correct , his thermostat hypothesis is plain old wrong and does not stand the test of time when viewed through the historical climatic record. I would take it even further and say the historical climatic record proves his thermostat hypothesis 100% wrong.
Salvatore Del Prete August 22, 2016 at 10:06 am
Since you have failed to quote or link to even one example in support of the ad hominem claim you are making, I will consider it just another example of Salvatore running off at the mouth … sadly typical. Salvatore, this is why I very rarely reply to you. You are full of accusations and devoid of science, seemingly content to throw mud at the walls and hope that it will stick.
Not interested … when a man starts throwing mud, it’s a sure sign he’s out of ammunition.
w.
Willis the historical climatic record disputes your thermostat hypothesis. It is that clear and simple.
I should say invalidates it.
Willis we disagree that is all it is. You think my solar theory is wrong and I think your thermostat hypothesis is wrong .
PROVE ME WRONG.
The climate in the big picture is controlled by Milankovitch Cycles, Land Ocean arrangements, with Solar Activity and the Geo Magnetic Field Strength of the earth superimposed upon this.
These factors then exert influences on the terrestrial items on the earth that determine the climate.
Terrestrial Items
Atmospheric Circulation
Sea Surface Temperatures
Global Cloud Coverage
Global Snow Coverage
Global Sea Ice Coverage
Enso
Volcanic Activity
All of this gives an x climate over x time. The historical climatic record supports this.
That is WHAT likely makes the climate change, NOT the scam they promote which is AGW.
The historical climatic record showing this period of time in the climate is in no way unique while changes in CO2 concentrations having no correlation in leading to resultant climate changes.
Now how the cooling evolves will have to be monitored. Of course going from an El Nino condition to an La Nina condition is going to cause an initial cooling.
For clues that if solar is involved the depth of the cooling will have to be monitored and if the cooling is accompanied by the terrestrial items I have mentioned above.
Each one of those terrestrial items having been shown to be linked to Milankovitch Cycles Land Ocean Arrangements in the big slow moving picture while solar and geo magnetic variability being factors that can change these terrestrial items on a much smaller time scale.
The solar parameters needed are
Solar Wind sub 350 km/sec.
AP index 5 or lower
EUV LIGHT 100 units or less
COSMIC RAY COUNTS – 6500 or greater
SOLAR IRRADIANCE – off by .15% or greater.
SOLAR FLUX SUB 90
All very attainable going forward and being compounded by a weakening geo magnetic which if attained with sufficient duration of time will translate into bringing the terrestrial items that control our climate to values which will cause the climate to cool gradually if not in a sharp drop off if certain thresholds should be meant.
What about YOU giving US an accurate scientific proof you are right instead?
I’m so sad of all these people pretending anything they never and never will be able to prove, and thus leaving the readers alone with a simple-minded “PROVE ME WRONG”.
In Jo’s link this is said:
If the temperature on Earth is entirely controlled by solar effects, the cooling will return us to the temperature levels of the 1950s or even the 1920s, undoing the last 50 or 100 years of global warming in just a few short years.
The temperature data from land thermometers from 1850 to 1978 may have exaggerated past temperature rises. The solar model here trained on that data so it may be too sensitive, in which case the imminent cooling will not be as large as shown in absolute terms.
At least a small portion of the recent global warming was due to rising carbon dioxide, so the fall will not be as large as shown in Figure 2.
and:
“So the cooling is most likely to begin in 2017.
The delay could be as much as 20 years, in which case the drop could be as late as 2024. Or it could occur as soon as 2014. An El Nino or La Nina could affect the timing too. At this stage, we don’t know. But by the end of 2018 seems fairly likely.”
which is quite different to David Archibald’s ‘prediction’ in that it is more cautious and still potentially reasonably accurate.
I’m somewhat disappointed by Willis’s attitude here.
My horrid thought is that the cycling in temperature faster than Milankovich cycles could very well be entirely due to the climate being a chaotic system, and I am bad enough in higher math to doubt I could understand any expositon on chaotic math. I am biased towards there being a discrete physical cause, but I recognize that is bias with no foundation.
I’m somewhat disappointed by Willis’s attitude here
Stephen his attitude will always be negative when climate theories go against his thermostat theory which the historical climatic record shows can not be correct.
So that is out ,plan and symbol while our thinking is in.
cor -simple
Stephen Wilde August 22, 2016 at 10:14 am
Take a look at the damn graph again, Stephen. Words can lie, people can lie, but David Evans made the graph and you can read it. It does NOT show “the cooling is most likely to begin in 2017” as your quote claims. It shows that by 2017 the global temperature will have dropped by as much as it did over the entire 20th century.

Who you gonna believe? Jo’s claim that the cooling won’t start until 2017, or your own lying eyes?
I’m somewhat disappointed by your attitude here.
w.
The words adequately qualify both the scale of change and the timing shown on the graph.
there is ample evidence showing that a change from warming to cooling started around 20 years ago.
I’m going to guess that in the very near future, some ‘scientific’ paper will be published–and splashed across world news–which ‘proves’ that anthropogenic CO2 causes a reduction in solar activity.
Surely until proven otherwise this data merely indicates a downturn in the Atlantic Multidecadal Oscillation??
Perhaps others more expert than me would like to comment about that??
With 70% of our planet covered to an average depth of 12000 ft of water and two sources of heat, sun and geothermal, there in lies the answer as to what the thermostat for the earth is. The oceans collect and circulate and redistribute the heat in a manner which we do not yet understand. I would note, however, that the undersea geothermal sources, since out of sight, seem to be ignored in all of the grand schemes and theories and since we know little about the actual heat energy they input, could play a significant role. Just saying.
What ever the cause, Figure 3 got my attention.
There are may questions.
Is it a traverse that is different than most others?
Why does it stop at 800 dbar. (a dbar is approximately one meter). Argo’s report data to 2000 dbar.
Why the heck does it describe longitude as 330E to 360E instead of more traditional terms.
Nevertheless, I love the display of this ARGO data.
Two things the poster gets wrong:
ONE:
“… North Atlantic water column but the temperature of the surface is the main control on the climate of Europe.”
The Source of Europe’s Mild Climate
The notion that the Gulf Stream is responsible for keeping Europe anomalously warm turns out to be a myth
by Richard Seager
https://www.americanscientist.org/issues/pub/the-source-of-europes-mild-climate/1
TWO:
“… persistent failures of the wheat crop in Norway …”
An old, 2013, story. Norway wheat is now (last 3 years) about the same as in the 1990s while the 2000s was higher.
In the last few years (following 2012) field crop production in the USA has been at record levels.
You can grow wheat but is it good enough for human consumption or is it sold as cattle feed:
https://wattsupwiththat.com/2013/10/05/norways-wheat-production-impacted-by-climate-change/
Norway, 1000 MT Wheat
1970: 11,601
1980: 65,000
1990: 223,606
2000: 313,400
2010: 331,358
2013: 199,400
2016: ~250,000
http://www.indexmundi.com/agriculture/?country=no&commodity=wheat&graph=production
Pierre Gosselin’s No Tricks Zone has a post by Kenneth Richard with a collection of papers on the correlation between solar activity and sea temperature:
http://notrickszone.com/2016/08/22/scientists-ocean-temps-vary-robustly-and-near-synchronously-with-solar-activity/#sthash.if1HBF0G.dpbs
Including this summary of a paper by Serjup et al:
“We have presented an oxygen isotopic proxy record of near-surface temperature of Atlantic waters from the area of their primary flow into the eastern Norwegian Sea and find that it is robustly and near-synchronously correlated with various proxies of solar variability spanning the last millennium.”
“Here is a link for Norway wheat and it depends purely on the definition of failure. I would not describe this as a total failure but it certainly does not look too good to me. Dropping from a high of 450 down to 250 is nearly a 50% reduction. not a total failure but enough to cause shortages to occur”
Most people in their rush for navel gazing in Norway, seem totally unaware of the recent total failure of the harvest in FRANCE this summer.
Yield is typically 60% down to the extent farmers have requested moratoria on their interest payments to the banks.
Luckily successful season 2015 storage won’t affect the prices for now…..
The reason for the unusually low yield?
An unusually cold wet spring, followed by a really lacklustre relatively damp summer.
YES chaps it IS cooler!
Colder northern hemisphere fanatics only need to look nearer to home in the UK and France, not even anywhere near 59N or even Norway, (which has nothing much to do with Greenland, – more of interest to the [Grain growing] Baltic states and St Petersburg region of Russia).
All those regions can testify to a miserable cool summer, the exception being URAL region which has been HOT, – largely unaffected by N Atlantic temps.
As Max Boyce used to say “I WAS THERE!”
I have been watching the weather in Southern Spain most days this year, and it is typically 2 to 3 degC below average temperatures.
I have a holiday home and the swimming pool has struggled to reach 30 degC, often being 28 to 29 degC. In previous years my swimming pool usually reaches 33 to 34 degC in late July/Mid August.
There have been very few really hot days, and the night time temperatures have fallen away quickly and are noticeably cooler than usual.
2016 will not be the ‘warmest year ever’ in Southern Spain, and I suspect that applies to most of the countries that boarder the Northern shores of the Med. There has, however, been very little rain.
Salvatore
Which is the climate is very stable and yet the earth has alternated between glacial and non glacial conditions and even more telling very abrupt climatic changes sometimes in the course of decades.
No. Lets take the phanerozoic, the last half billion years during which multicellular life has existed our climate proxy knowledge is reasonable. The earth is not continuously oscillating between ice age an interglacial. less than 10% of the phanerozoic has been in ice age. Glacial periods typically last a few tens of millions of years (e.g. Cryogenian, Minoan-Varangian, Saharan-Andean). The current glacial-interglacial flip-flopping of the Pleistocene simply represents a transitional phase as we cross the threshold into another prolonged glaciation which will deepen to eventually full uninterrupted glaciation for some tens of million years. As we all know, interstate flip-flops are typical of state transitions in quasi-chaotic systems:
https://farside.ph.utexas.edu/teaching/qm/Quantum/node78.html
http://www.buildart.com/images/Images2011/TIMELINE_FULL.jpg
http://www.hugovandermolen.nl/environmental%20affairs/pics/atmossphericCO2andtemperature,600million-years.gif
I AGREE.
Excellent work, David A., and well within your predicted 2 degrees down for cycle 24 made years back.
Here, astride the Mississippi in Central MN we’re experiencing the cloudiest, rainiest August in the nearly 60 I recall with a yet reliable memory. Normally, from 1970 thru the end of last millennium huge- high pressure systems setting up in the Rockies assured days of cloudless skies, hot and dry.
Normally we get 30 inches year round, this year 15 inches since mid-July.
@Oystein in Norway
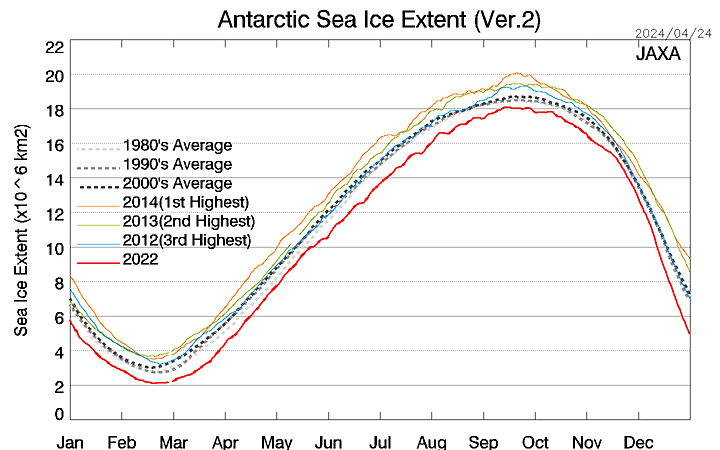
Thanks for your comment. It gives me perspective and I it confirms my measurements,
namely that earth has already started cooling,
and that it happens from the top latitudes downwards, as evident from the increase of the amount of ice in the Antarctic for the past couple of years..
hence most people in between the poles have not yet noticed much change
[and are being deceived by the AGW supporters]
please keep us all informed of the development of the weather in Norway?
I have also been forecasting an extremely cold winter for this year for anyone in EUROPE north of 56N.
It only has to resemble 2010, for the UK to be within days of running out of fuel, and an electricity grid built for constant AGW.
It surely has to be the same competency that got the somerset levels flooded, because they failed they sold off all the dredging machines…
A wealthy “brexit designed” UK that imports more fuel and diesel oil than it refines…that put a generation of nuclear engineers into retirement, and burnt up all its own oil and gas reserves when climate was optimal and warm.
Cold, still freezing weather at -15C, no wind and little sunlight.
Just perfect conditions to test the theory and practice of all those over-hyped “renewables” .
In fact it only has to be another failed harvest in France in 2017.
We will have a plague of agricultural bankrupcies, a number of French banks fail, the French farmers blocking the ports, and everyone in France blaming everyone else.
The French revolution was started by repeated harvest failures.
I wouldn’t be suprised to see a repeat of it, when you look at the behaviour of that eco idiot mal-baisee Segolene Royale and her latest ideas to ban people even from driving a 2CV to the Tour Eiffel & her con men president ex who claimed to reduce unemployment then plans to close down the most successful thing in France:-
, – Its nuclear electricity.
Those belonging to the Church of Climatology have run afoul of this principle: Theory often heavily influences interpretation of data, particularly when the data isn’t comprehensive or complete. By claiming “the science is settled” they’ve automatically committed themselves to excluding certain data sets which don’t fit their theory and then heavily “interpreted” those data sets which are ambiguous at best. I just don’t see how “science” can go from preaching man-made cooling to man-made warming in just a matter of decades. And then there’s the warming “pause” which many of the apostles of global warming now strenuously deny by jiggering yet more data based on their a priori interpretative narrative.
Besides, if AGW is a reality, why don’t the true believers actually live like it’s true? I bet my carbon footprint is a hundred times less than the movers and shakers of the Church of Climatology with their jetting about and still driving ICE vehicles or taking diesel-powered public transportation. And I also bet that I have a smaller carbon footprint than 70% of those rank-and-file AGW true believers. And If the climate change evangelists really wanted no-carbon green power they’d be jumping on the nuclear electricity train.
BTW, dollar to donuts that in less than 20 years the eco-warriors will begin complaining about what an eyesore wind and solar farms have become.
William Astley August 21, 2016 at 10:58 am
———————————————————–
The peculiar solar cycle 24 — where do we stand?
Sarbani Basu
Department of Astronomy, Yale University,
http://iopscience.iop.org/article/10.1088/1742-6596/440/1/012001/pdf;jsessionid=5258A2ABFA450E49964864E82318A677.c5.iopscience.cld.iop.org
Thanks for bringing the above article to our attention, William.
A solar cycle prediction for Cycle 25 back at you..
..Given this floor value
for the HMF, our analysis suggests that the estimated peak sunspot number for solar
Cycle 25 is likely to be ∼ 62 (±12).
A Twenty Year Decline in Solar Photospheric Magnetic Fields:
Inner-Heliospheric Signatures and Possible Implications?
P. Janardhan,1 Susanta Kumar Bisoi,2 Fujiki,4
S. Ananthakrishnan,3 M. Tokumaru,4 K. . Jose,5
and R. Sridharan,5
11 July 2015
Abstract.
We report observations of a steady 20 year decline of solar photospheric fields
at latitudes ≥45 degrees starting from ∼1995.
This prolonged and continuing decline, combined
with the fact that Cycle 24 is already past its peak, implies that magnetic fields are likely
to continue to decline until ∼2020, the expected minimum of the ongoing solar Cycle
24. In addition, interplanetary scintillation (IPS) observations of the inner heliosphere
for the period 1983–2013 and in the distance range 0.2–0.8 AU, have also shown a similar
and steady decline in solar wind micro-turbulence levels, in sync with the declining
photospheric fields. Using the correlation between the polar field and heliospheric magnetic
field (HMF) at solar minimum, we have estimated the value of the HMF in 2020
to be 3.9 (±0.6) and a floor value of the HMF of ∼3.2 (±0.4) nT. Given this floor value
for the HMF, our analysis suggests that the estimated peak sunspot number for solar
Cycle 25 is likely to be ∼ 62 (±12).
Hmm also a prediction of a Heliospheric Magnetic Field floor value of ∼3.2 (±0.4) nT.
Is that consistent with the historical models floor value. Who might know that off the top of their head?
From another article..
“”It is important to bear in mind here that the transition seen in the wavelet spectra around
1995−1996 corresponds to the time when both solar high-latitude fields above ±45◦
and solar wind
turbulence levels in the entire inner-heliosphere began declining (Janardhan, Bisoi, and Gosain, 2010;
Janardhan et al., 2011).””
Maybe we should bring to the attention of the ‘Interstellar’ Astrophysical community the idea that a change in the interstellar wind direction may have occurred back in the mid 90’s. They probably all ready know this.
Maybe we should bring to the attention of the ‘Interstellar’ Astrophysical community the idea that a change in the interstellar wind direction may have occurred back in the mid 90’s. They probably all ready know this.
And as we have said before, nothing that happens out there has any influence whatsoever on solar activity, due to the supersonic solar wind.
To: Moderator
From: Me
Why did my last post go to the recycle bin?
Had a fairly reliable source doing a solar cycle prediction for Cycle 25 and everything.
[Messages drop into the queue based on several factors, several “key words and tricky phrases” as well. Be patient, we’ve gotten through the previous 1,860,000 responses in pretty good order. 8<) .mod]
Worse yet, their prediction of 62(+-12) is close to Dr. S.’s prediction of sorts for cycle 25 being slightly more spots in Cycle 25 than Cycle 24.
And the post hit the trash barrel?
Clearly this is another sign of AGW and/or climate change. The loss of heat in the North Atlantic is further proof of warming elsewhere. Once you realize every year is the hottest year ever, and especially so since all the previous data needed (will continue to need) adjustments, then it’s all the more dire that the Earth is hurtling towards heat death while the North Atlantic chills.
Amirite?
Is it reasonable to imply that the reduced solar influx is partially compensating for GHG-induced warming and that when the sun returns to normal that the compensation will end, producing a temperature spike?
No, as the variation of the solar output is so very tiny and has an effect less than 0.1 degrees.
There’s more to it than that. You are correct that, since Total Solar Irradiance (TSI) varies very little over a ≈ 22-year solar cycle, it probably also varies only a little between longer term minima and maxima. Yet there’s ample evidence suggesting that on multi-decadal time scales the longer term ebbs and flows of solar activity do, in fact, have a strong influence on the Earth’s climate. They are certainly correlated, anyhow.
So the question is, why are they correlated? Why does the earth’s climate cool so much during solar minima?
There are three main schools of thought:
1. Since TSI probably doesn’t vary much with shifts in sunspot cycle length/strength, the major climate shifts associated with those small TSI changes are evidence that the Earth’s climate is quite unstable, and easily perturbed, presumably due to strong positive feedbacks. That supports climate alarmists’ worries about the effect of anthropogenic CO2, because it suggests an improbably high climate sensitivity to apparently-minor forcings like anthropogenic CO2, presumably through the effects of positive (amplifying) feedbacks.
2. Coincidence. Correlation does not always imply causation. It could just be coincidences.
That seems unlikely, though. Solar minima certainly do seem to cause cold periods on Earth. The Little Ice Age (LIA) began with the Wolf Minimum, eased a bit, then had another cold period during the Spörer Minimum, and was at its worst/coldest during the longest and most pronounced solar minimum, the Maunder Minimum. The later, less pronounced, Dalton Minimum coincided with another worsening of the LIA, though not as bad as the Maunder Minimum. That’s a lot of coincidences.
3. Indirect effects. The work of Henrik Svensmark, Jasper Kirkby & others suggests a third possibility: solar variation might be a much larger effective forcing than previously thought, not because of changes in TSI, but because of a much more obscure chain of effects: changes in the Sun’s magnetic field, which are strongly correlated with sunspot cycle minima & maxima, affect cosmic rays reaching the Earth, which affects cloud formation, which affects climate.
That would be consistent with both a low climate sensitivity to things like CO2 and TSI, yet a large effect from sunspot cycle changes. If Svensmark is right (or if there’s some other causal chain that isn’t yet understood) then it is quite possible that the cooling effect of another Maunder Minimum could exceed the warming effect of anthropogenic CO2, leading to another LIA even with CO2 levels in the 400-600 ppmv range.
Or, if mankind is very fortunate, the two effects could roughly cancel, resulting in a continuation of the current Climate Optimum. In fact it is quite possible that the warming effect of anthropogenic CO2 is already preventing or delaying the onset of a new LIA.
If so, it means that it’s a mistake to try to reduce CO2 emissions.
OTOH, if that’s the case, then when CO2 emissions fall, due to mankind’s eventual transition to non-fossil fuels (e.g., thorium), the delayed next LIA can be expected to finally arrive, just as crop yields are falling due to reduced CO2 fertilization. Should both of those things happen at the same time, producing enough food to feed the world’s population could be challenging.
For more about the work of Svensmark, Kirkby, et al, see this interesting video:
The work of Henrik Svensmark, Jasper Kirkby & others suggests a third possibility
http://www.leif.org/EOS/swsc120049-GCR-Clouds.pdf
“it is clear that there is no robust evidence of a widespread link between the cosmic ray flux and clouds.”
from 1995 ozone is increasing, both NH and SH
as a consequence more UV is deflected out to space
BTW, I think that video is by:
http://mortensenfilm.dk/documentary
(I don’t know anything about them.)
New paper:
http://onlinelibrary.wiley.com/doi/10.1002/2016JA022689/abstract
Discussion is here:
https://wattsupwiththat.com/2016/08/25/svensmark-publishes-solar-activity-has-a-direct-impact-on-earths-cloud-cover/
The paper concludes that Forbush decreases have an effect on ions and suggests that ions play a significant role in the life-cycle of clouds, but the number of such decreases is very small [one per year on average] and each lasts only a few days, so the effect on climate is negligible.
Leif, why do you think the earth’s climate seems to be so well correlated with the strength of solar cycles? Why do you think the earth’s climate cools so much during solar minima, like the Maunder & Dalton minima?
Leif, why do you think the earth’s climate seems to be so well correlated with the strength of solar cycles?
I don’t think it is. And there is no good correlation. For example, solar activity have decreased the past several solar cycles and the climate has warmed instead of cooled.
I asked, “Leif, why do you think the earth’s climate seems to be so well correlated with the strength of solar cycles?”
Leif Svalgaard replied, “I don’t think it is. And there is no good correlation. For example, solar activity have decreased the past several solar cycles and the climate has warmed instead of cooled.”
1. Is two (Solar Cycles 23 & 24) your definition of “several?” In fact, even #23 was above average in solar activity. It only represented a decrease because #21 & #22 were extremely strong.
The decline in solar activity has only been clearly evident for less than a decade. In late 2006 NASA was still predicting a very strong Solar Cycle #24. They wrote that Solar Cycle 24 was expected to be “one of the most intense cycles since record-keeping began almost 400 years ago.”
2. Even if you use the start of Solar Cycle 23 as the start of the decline in solar activity, that means 1996. But when the effects of volcanic aerosols and ENSO are subtracted, there’s been no appreciable warming since about 1993. Here’s a graph, from a paper by MIT’s Ben Santer and many co-authors:
http://sealevel.info/Santer_2014-02_fig2_graphC_1_100pct.png
As you can see, Solar Cycles 23 & 24 are associated with a plateau in temperatures, not with a significant warming trend.
3. I realize that your adjusted SN & SG numbers for the late 1700s seem to be a possible exception to the general correlation between solar activity and climate, but you know better than anyone that the solar observation data from that period is very sparse. I realize that you went to extraordinary exertions to do the best possible analysis of that data that you could, but I’m sure you agree that there’s considerable unavoidable uncertainty in them.
But do you at least agree that, other than that possible exceptional period, before human activity began dramatically increasing atmospheric CO2 & CH4 levels, the major solar minima (most recently, Maunder & Dalton) were strongly correlated with colder climate? Assuming that you do, then what do you think accounts for that correlation?
BTW, if you’d like a suggestion for your next paper, I’d like to offer one. I think it would be very valuable if you would try to put error bars around your SN & SG numbers.
I realize that’s difficult. But omitting error bars invites the sort of confusion you lamented in your paper: “In most analyses and publications, the sunspot number series is assumed to be carved in stone, i.e. it is considered largely as a homogeneous, well-understood and thus immutable data set.”
1. Is two (Solar Cycles 23 & 24) your definition of “several?”
21, 22, 23, 24 are several.
In late 2006 NASA was still predicting a very strong Solar Cycle #24.
So what? They were wrong. And I predicted [correctly] that cycle 24 would be the weakest in a 100 years:
http://www.leif.org/research/Cycle%2024%20Smallest%20100%20years.pdf
As you can see, Solar Cycles 23 & 24 are associated with a plateau in temperatures, not with a significant warming trend.
21 to 24 has a warming trend. It is called Global Warming.
but I’m sure you agree that there’s considerable unavoidable uncertainty in them.
They are good enough for the purpose.
Dalton) were strongly correlated with colder climate? Assuming that you do, then what do you think accounts for that correlation?
Solar activity now is comparable to the Dalton. Is climate?
BTW, if you’d like a suggestion for your next paper, I’d like to offer one. I think it would be very valuable if you would try to put error bars around your SN & SG numbers.
I suggest that you actually read the paper: http://www.leif.org/research/Reconstruction-of-Group-Number-1610-2015.pdf and study the careful determination of the error bars [e.g. sction 3.4]. Then come back and apologize.
Leif wrote, “solar activity have decreased the past several solar cycles and the climate has warmed instead of cooled.”
I asked Leif, “1. Is two (Solar Cycles 23 & 24) your definition of “several?””
Leif replied, “21, 22, 23, 24 are several.”
#21 & 22 were not decreases, Leif.
#21 was an increase, not a decrease, to a very high level of activity.
#22 was the virtually identical to #21, still very high, not a decrease, at least not a significant one.
#23 was finally a decrease compared to #21 & #22, but still bigger than average
#24 is a big decrease.
.
Leif wrote, “They [NASA] were wrong. And I predicted [correctly] that cycle 24 would be the weakest in a 100 years.”
And the 1/2005 paper said, “we predict that the approaching solar cycle 24 (~2011 maximum) will have a peak smoothed monthly sunspot number of 75 ± 8, making it potentially the smallest cycle in the last 100 years,”
I am impressed! Truly!
That SN prediction was spot on.
Your date prediction was off by several years, but even that (“~2011”) was better than NASA’s prediction (“2010 or 2011”), despite the fact that NASA wrote their prediction 2 years later than you wrote yours!
Well done!
.
I wrote, “Solar Cycles 23 & 24 are associated with a plateau in temperatures, not with a significant warming trend.”
Leif replied, “21 to 24 has a warming trend. It is called Global Warming.”
That’s wrong. #21 & 22 (1976-1996) were unusually strong solar cycles, and they were associated with a warming trend. #23 & #24 (1996-present) are weakening solar cycles, and they are associated with a temperature plateau.
.
I wrote, “…for the late 1700s… you know better than anyone that the solar observation data from that period is very sparse. … I’m sure you agree that there’s considerable unavoidable uncertainty in them.”
.
Leif replied, “They are good enough for the purpose.”
Arguably. You mentioned in your 2014 paper there is “still ongoing debate about a missing short cycle between cycles 4 and 5,” in the late 1700s. That is a testament to the paucity of data from that time period.
.
I wrote, “before human activity began dramatically increasing atmospheric CO2 & CH4 levels, the major solar minima (most recently, Maunder & Dalton) were strongly correlated with colder climate… what do you think accounts for that correlation?”
Leif replied, “Solar activity now is comparable to the Dalton. Is climate?”
Of course not. Why would it? “Now” is not “before human activity began dramatically increasing atmospheric CO2 & CH4 levels.” Do you suppose that 120 ppmv of CO2 and 1.1 ppmv of CH4 have had no warming effect at all? (Did you think I was one of those people?)
Also, of course, the Dalton Minimum lasted for several solar cycles, and we’re just barely past the peak of the first Dalton-level solar cycle, this time. So it’s a little early to be assessing the effects, don’t you think?
.
I wrote, “if you’d like a suggestion… I think it would be very valuable if you would try to put error bars around your SN & SG numbers.”
Leif replied, “I suggest that you actually read the paper: http://www.leif.org/research/Reconstruction-of-Group-Number-1610-2015.pdf and study the careful determination of the error bars [e.g. sction 3.4]. Then come back and apologize.”
That is great! I had not seen that 2015 paper. I was talking about your 2014 paper. I thank you for the link, and I look forward to reading it.
http://www.leif.org/research/SC21-to-24.png ?w=720
That’s wrong. #21 & 22 (1976-1996) were unusually strong solar cycles, and they were associated with a warming trend. #23 & #24 (1996-present) are weakening solar cycles, and they are associated with a temperature plateau
the late 1700s. That is a testament to the paucity of data from that time period
As http://www.leif.org/research/Reconstruction-of-Group-Number-1610-2015.pdf demonstrate, there is enough data to get a reasonable reconstruction of solar activity.
Just a comment, no conclusions drawn, but notice from the graph that atmospheric temperature estimates during the 1998 Super El Nino exceed those of surface estimates? By the 2016 Super El Nino, that had been reversed, significantly.
Just Mk1 eyeballs, again, but it does seem that late 20th Century generally higher tropospheric estimates had been erased by the early 21st Century. In contrast, though, over the last 10 years or so, surface estimates become higher.
Maybe a Phd. or two could explain how my “lie’n eyes” may have deceived me?
Leif, read your graph
notice the double pole switch 1971 and 2014
notice that you can draw bi-nominals for the field strengths top to bottom and bottom to top, representing the average polar field strength
what is there not to understand that the Gleissberg is for real, and lasts ca. 86.5 years, on average?
hence I find the bending point at 1995.9
nov. 1995
live with
it will be getting cooler
wherever you live
Back in early 2013, I analysed all results from 54 weather stations, balanced, ie
27 NH, 27 SH, balanced to zero latitude, and 70/30 @sea/inland
To summarize the results on maxima, I had the following average results, in K/annum
38 0.036
32 0.028
22 0.015
12 -0.013
the relationship is best given by
y=0.042ln (x) – 0.1167
where y = speed of warming/cooling in K/annum
x = years in the past counted back from 2012.
the Rsquare on that is 0.9966
If your maths is not too rusted you can work out that when y=0, x= 16,1 years ago, counted from 2012, i.e.
ca. 1995.9
that means the change from warming to cooling occurred toward the end of 1995.
I think if we all started looking at maxima and minima we will gain more insight as to what happens on the sun instead of looking at means and getting confused.
http://oi60.tinypic.com/2d7ja79.jpg
Note that the results of one weather station in Alaska would have been enough for me to come to the same conclusion as the global result….
Here is a graph from stations in my surroundings on minima that shows you how you can repeat my results (using a different sample of stations)
To the contrary there is much evidence of cosmic ray links to global cloud coverage.
there is much evidence of cosmic ray links to global cloud coverage.
You mean like this one:
http://www.leif.org/research/Cloud-Cover-GCR-Disconnect.png
I do not think we had a prolonged solar minimum condition during that time interval.
I do not think we had a prolonged solar minimum condition during that time interval.
Svensmark bases his hypothesis on that interval, so you are saying that he was wrong on this.
Leif, to what do you attribute the declining trend in low clouds shown in that graph over the decade from about 1997 to 2007?
I have no idea, except it is not due to increase of cosmic ray flux.
“The most elementary and valuable statement in science, the beginning of wisdom, is, ‘I do not know.’” Jack B. Sowards (screenwriter), voiced by Lt Cdr Data (Brent Spiner).
http://phys.org/news/2016-08-solar-impact-earth-cloud.html
One of many studies.
Which concludes:
“The effect from Forbush decreases on clouds is too brief to have any impact on long-term temperature changes.”
That is not the point the point is cosmic rays do effect cloud coverage as shown with Forbush events which gives evidence to the idea that galactic cosmic ray increases associated with prolonged solar minimum conditions will also effect cloud coverage.
Apart from the fact that it is not generally accepted that Forbush decreases changes cloud cover, it does not follow that the lack of Forbush decreases increases cloud cover:
http://www.leif.org/EOS/Clouds-GCR-Temps-Palle.pdf
“It seems likely therefore, that the simplified scenario of cloud amount governed by solar activity (GCR) alone, is not valid as trends in cloudiness go the opposite way to predicted”.
ABSTRACT
Despite over 35 years of constant satellite-based measurements of cloud, reliable evidence of a long-hypothesized link between
changes in solar activity and Earth’s cloud cover remains elusive. This work examines evidence of a cosmic ray cloud link from
a range of sources, including satellite-based cloud measurements and long-term ground-based climatological measurements. The
satellite-based studies can be divided into two categories: (1) monthly to decadal timescale analysis and (2) daily timescale epochsuperpositional (composite) analysis. The latter analyses frequently focus on sudden high-magnitude reductions in the cosmic ray
flux known as Forbush Decrease events. At present, two long-term independent global satellite cloud datasets are available (ISCCP
and MODIS). Although the differences between them are considerable, neither shows evidence of a solar-cloud link at either long
or short timescales. Furthermore, reports of observed correlations between solar activity and cloud over the
1983–1995 period are attributed to the chance agreement between solar changes and artificially induced cloud trends. It is possible
that the satellite cloud datasets and analysis methods may simply be too insensitive to detect a small solar signal. Evidence from
ground-based studies suggests that some weak but statistically significant cosmic ray-cloud relationships may exist at regional
scales, involving mechanisms related to the global electric circuit. However, a poor understanding of these mechanisms and their
effects on cloud makes the net impacts of such links uncertain. Regardless of this, it is clear that there is no robust evidence of a
widespread link between the cosmic ray flux and clouds.
it is clear that there is no robust evidence of a widespread link between the cosmic ray flux and clouds.
Good to see that you agree with the conclusion of your link, that there is no robust evidence for what you claim.
Which you sent which does absolutely nothing to prove there is no link between GCR and global cloud coverage.
Why because there was no prolonged solar minimum condition during that time and the threshold of cosmic ray intensity needed was not reached during that time interval which is sustained counts of 6500 units or better for several years.
Which you sent which does absolutely nothing to prove there is no link between GCR and global cloud coverage.
That interval was what Svensmark used as evidence for his hypothesis. So it does absolutely nothing to prove there is a link between GCR and global cloud cover. So you are advocating that Svensmark was mistaken.
Here is another recent analysis:
http://www.leif.org/EOS/No-Cloud-Cover-GCR-Link.pdf
“The contribution of CR to ‘climate change’ is quite negligible”
http://www.leif.org/EOS/Cosmic-Rays-and-Clouds.pdf
“Once more there is no support for the cosmic ray hypothesis for cloud modulation”
the threshold of cosmic ray intensity needed was not reached during that time interval which is sustained counts of 6500 units or better for several years.
When was that ‘threshold’ reached the last time in the past? And what is your evidence for that?
It was reached during the 2008-2010 solar minimum.
and I might add we are close that level now once again and will exceed it gong forward.
http://www.sciencedirect.com/science/article/pii/S1364682697000011
This study has a different conclusion.
That study is what has been repeatedly debunked ever since [1997]. And did the GCR count reach 6500 units for ‘several years’ back then? The level you claim is NECESSARY to trigger the effect.
http://ruby.fgcu.edu/courses/twimberley/EnviroPhilo/PalleBago.pdf
Another study and we can go on and on forever. All studies you do not agree with are debunked which means nothing .
The data mean everything, and they show no evidence for GCR having any effect on climate.
And was the cloud cover higher then?
http://www.leif.org/research/Cloud-Fraction-2001-2011.png
That chart shows a slight increase in cloudiness since 2000 which (as I’ve been saying since 2007) was when I saw the jet stream tracks becoming more wavy again after a period of greater zonality.
That increase, being slight, has only put a stop to the warming trend. Cloudiness needs to increase a little more for cooling to begin though some say there has been slight cooling since 1998 or so despite the recent large El Nino.
That increase in cloudiness ties in with the decline in solar activity since the peak of cycle 23.
It is not just GCR it also has to do with what Stephen has been saying which is how meridional the atmospheric circulation is.
I also think the geomagnetic pole positions play a role, and sea surface temperatures, ENSO etc.
Many items effect total cloud coverage.
except, evidently, GCRs.
I don’t think it is GCRs because I couldn’t think of any way they could disturb the jet stream tracks.
To do that one must somehow interfere with the temperature of the stratosphere so as to alter the gradient of tropopause height between equator and poles.
You can do that by changing the balance of the ozone creation/destruction process differently above equator and poles.
Various particles and wavelengths from the sun do indeed do that and they vary by far more than does simple TSI.
I don’t think it is GCRs because I couldn’t think of any way they could disturb the jet stream tracks.
That is the Argument from (personal) incredulity fallacy.
It is an argument from careful study and lengthy consideration.
Do you know of anyone who proposes thar GCRs change the gradient of tropopause height between equator and poles when ozone is the dominant player and GCRs are not known to have an effect on ozone?
The fallacy stands.
Tell me who you have in mind for your question.
follow the logic that I used to explain my result:
=> decreased solar polar field strengths
=> more of the most energetic particles can escape from the sun
=> more ozone TOA
=> less UV reaching the oceans
oceans is the capacitor [of warmth/energy]
hence we are currently cooling
despite what anyone else may tell you…
Thanks Henry, I agree.
Well, you are the expert on arguing from ignorance because that is the basis of all your doubts about solar effects on climate.
That was intended for Leif but is incorrectly nested
Let us remove the sun from our solar system for a while and just see where that would leave us…..
Quite so, Henry.
Leif doesn’t accept that any other feature of solar activity other than simple TSI could possibly have any effect on the earthly climate.
That is an argument from ignorance par excellence.
Leif’s nickname from now on should be ‘the hypocrite’ 🙂
@Stephen
I already chirped in before you,
I nicknamed Leif: Dr. No
Dr. No
that will stay in my mind
but I still wonder why?
perhaps trying to please too many people
[and characters]
does become a problem to one’s brains
Trolls will be trolls, distracting, minimizing, denying and prevaricating with their last breath.
May their data be corrected in the future by Boeotians.
I think the biggest thing as far as global temperature is concerned is that the vast majority of the warming is taking place during Antarctic and Arctic winters. It’s no longer -30F anymore it’s more like -20F (probably due to increased water vapor in the atmosphere and oceans losing latent heat). I believe I have read somewhere that surface temperatures lag roughly a decade behind solar conditions because of the fact oceans cover 70%+ of the planet’s surface area. It takes a long time for oceans to lose built up heat over decades. Pre satellite data didn’t really take water temperatures into account at all because you can’t have a buoy everywhere taking measurements. However, everyone wants to take 1979 as the first year for comparison even though clearly it had to begin warming up because the 1970s was a cold decade. Before I go off on a tangent let me make my point, since solar activity has been dropping off beginning around 2004 you have seen water temperatures respond. Once you lose that latent heat energy the water has stored to the atmosphere you will see even more rapid temperature drops on the surface it’s just now picking up steam in the North Atlantic. This last El Niño masked a lot of this evidence, what it has done in making this such a warm year is release massive energy reserves from the Pacific Ocean but see this time there isn’t any solar energy to replenish those reserves
That’s pretty much what I think as well. If this argument was to support CAGW, it’d be widely accepted.
Sparks August 30, 2016 at 10:03 am
Sparks, there is a name used all over the web for that kind of behavior. It is called “trolling”, meaning exactly what you described—seeing if you can rile people up for no reason. It has nothing to do with humor.
You obviously think that what you call “ragging on the guys” is funny ha ha … the overwhelming majority of folks on the web think it is scummy, which is why trolls have a very bad name and a very bad reputation everywhere.
Including you, Sparks. Definitely including you.
DFTT,
w.