Relationship between decadal variations in temperatures in the Pacific and the tropopause identified
From the HELMHOLTZ CENTRE FOR OCEAN RESEARCH KIEL (GEOMAR)
Water plays a major role for our planet not only in its liquid form at the surface. In the atmosphere too, it considerably affects our lives as well as weather and climate. Clouds and rainfall are one example. Water vapor, the gaseous form of water, also plays a prominent role on Earth. It is the most important greenhouse gas in the atmosphere, without it the Earth would be a frozen planet. For climate variations, water vapor is particularly important in the stratosphere at altitudes between 15 and 50 kilometers. How much of the gas actually reaches the stratosphere mainly depends on the temperature at the transition between the lowest atmospheric layer, the troposphere, and the overlying stratosphere. This boundary layer is called the tropopause.

Now scientists of the GEOMAR Helmholtz Centre for Ocean Research Kiel, together with a colleague from Bergen (Norway), were able to demonstrate for the first time that natural fluctuations in water temperatures of the Pacific – which occur on decadal timescales – are directly related to the temperature of the tropical tropopause. “It has long been thought that human influences already affected the tropopause. However, it seems that natural variability is still the dominating factor,” says Dr. Wuke Wang from GEOMAR, lead author of the study just published in the international journal Scientific Reports.
For their study, the researchers used observations for the period 1979-2013 and also climate models. “We were thus able to extend the study period to nearly 150 years. The model allows us to easily look at both human and natural influences and to separate their impacts from each other,” explains Prof. Dr. Katja Matthes, climate researcher at GEOMAR and co-author of the study.

A well-known climatic phenomenon is the so-called Pacific Decadal Oscillation (PDO). “This natural variation with decadal timescale leads to anomalously high or low water temperatures of the Pacific,” explained Dr. Wang. The PDO influences the climate and ecosystems in the Pacific region and also the global mean temperature of the Earth.
The model simulations show that the fluctuations in water temperatures also affect the wind systems over the tropical and subtropical Pacific. This in turn also alters the air transport between the lower and upper layers of the troposphere, ultimately regulating the temperatures at the boundary to the stratosphere. “We were now able to demonstrate these relationships for the first time,” said Dr. Wang.
Thus, the current study contradicts earlier hypotheses about the temperature variability of the tropical tropopause. As early as in the late 20th century, scientists had seen a cooling trend there which began in the 1970s. They traced this observation back to anthropogenic causes, in particular the increase in greenhouse gases. “However, this assumption was based on a rather patchy data base and simplified climate models. Our study shows that the cooling of the tropical tropopause does not have to be a one-way street but could also be part of a natural fluctuation which extends over several decades,” Professor Matthes emphasized.
This knowledge is also of paramount importance for the general climate research. The temperature of the tropopause decides on the input of water vapor into the stratosphere: The higher the water vapor content in the stratosphere, the higher the increase in surface temperatures. Anthropogenic climate change also has an effect on the temperature of the tropopause, and this effect could become more evident in the coming decades. “Only if we can clearly distinguish natural variability from anthropogenic influences, we can make reliable forecasts for the future development of our climate,” Prof. Matthes summarizes.
###
The paper:
Wang, W., K. Matthes, N.-E. Omrani, and M. Latif, 2016: Decadal variability of tropical tropopause temperature and its relationship to the Pacific Decadal Oscillation.Scientific Reports, 6:29537, DOI: 10.1038/srep29537
Open access: http://www.ncbi.nlm.nih.gov/pubmed/27404090
This sounds suspiciously like proper science. Off to the gulag with these people!
This sounds suspiciously like proper science
No, it sounds like confirmation bias for skeptics using bad methods:
Extending real observations of 34 years out to 150 years using anything, especially opaque fancy models, is called “dry labbing”. GIGO. Pick your favorite sarcastic euphemism.
We simply have to wait another 80 years for another cycle of PDO to happen. “Not enough data” is simply “not enough data”, it’s not “extend it out with models”…
Peter
But isn’t that what warmists do all the time?
bazzer1959 is correct
BAD METHODS??????
The warmists project their model results well into the future and then they create energy policy based on what you just said was not correct.
You cannot have it both ways.
What’s good for the goose is good for the gander.
Yes, and that’s their confirmation bias. You wish to be like them? Or appreciate actual real science?
This won’t sit well with the CAGW Brownshirts.
A little help here for the natural science impaired, (yes technically I am a social scientist, sic). Does this reinforce the argument that 2015 “wamist yer evah!” was driven by the El Nino, and by the end of 2017 we can turn off the fridge and just leave our frozen foods in the garage?
yes that’s exactly what it means
“Middle atmosphere temperature in sync with the ocean PDO”
and PDO since 1950s is in loose sync with the Sunspot cycles (every SSN cycle is followed by an inflection in the average PDO index). Progressively increased delay indicates the heat distribution is a function of a variable Pacific currents velocity/volume dependency.
If the PDO data before 1950s is reliable than prior to 1950s the PDO relationship to the SSN doesn’t hold true.
http://www.vukcevic.talktalk.net/PDO-16.gif
Vuk
love you, but I don’t see any real pattern in this graph.
Hi Bob
no ‘ a la carta’ available on the climate change menu, it’s all explained a bit further below (see my comment at July 26, 2016 at 9:47 am
I will agree with Bob Boder that there is no shown relationship between the PDO and sunspots before or after 1950, and I find no explanation for that in vukcevic’s comment at July 26, 2016 at 9:47 am.
Cheers
This in turn alters surface(land) weather and temperatures.
Agreed. The PDO/SSN connection before 1950 may fail, but note the spikes in the 1930’s in the PDO, that correlate nicely to the land temperature spikes during that period and another peak 1900-1910 – any correlation there? Otherwise it looks a bit muddy more recently, but with a decline from 2000, and a peak recently, maybe this index makes a lot of sense…
You can even see this in the modern temperature record.

This is the average day to day change of min and max temp for surface station in the continental US
It’s not baselined, pure change. But it can also be subject to some of the many station changes that happened. Now I use QA’d NCDC GSoD data, but when you look at the number of active station by year, it’s not good. But there is a transition mid 70’s in the record, after the number of stations go up, a lot in some places.
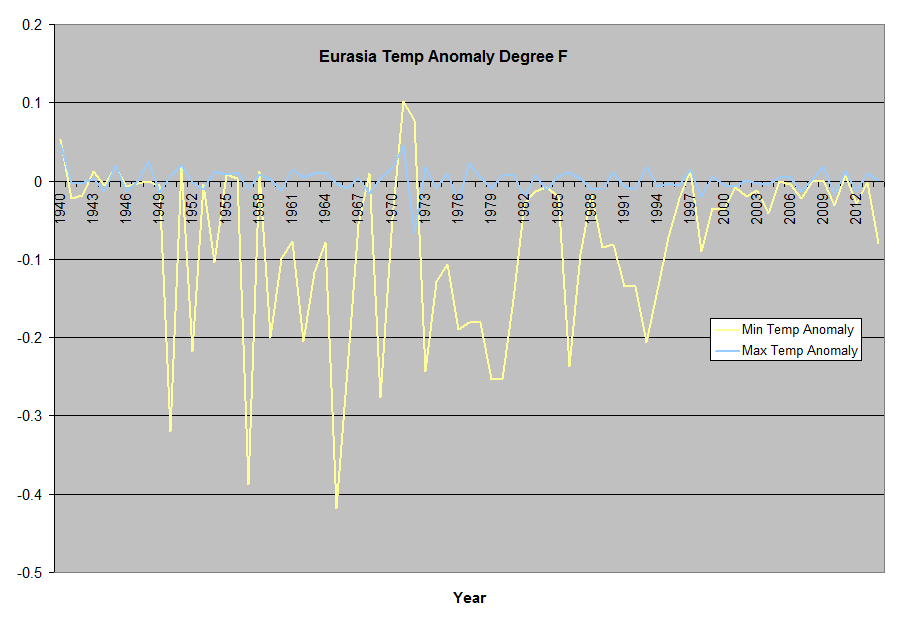
Then Eurasia
You can see that the US station had a burst of warming prior to 97, then both the US and then Eurasia shortly there after both experienced a increase in min temp about 97.
This is the climate sensitivity of 20-30 N lat in degree F/Whr, none of the other band has the signal in the late 90’s
Occurrence of the PDO peaks is influenced by the balance between two major N. Pacific currents Kuroshio (warm) – Oyashio (cold) forming the North Pacific Current.
Speeding or slowing of one of these two currents would cause smaller or greater delay in the PDO peaks. The above graph shows that since 1950 each PDO peak follows a sunspot cycle but with progressive increase in the delay. In relation to the SSN peaks, the1960 PDO peak and small 1969 inflection are about 2 years delayed, the 1985 peak 5 years delayed, 1996 peak is 5-6 years delayed, 2005 peak 5 years and latest peak will be delayed too.
actually it should be clearer if you would use a PDO+AMO plot with the PDO and AMO and sunspots curves. Then you would see why the PDO sometimes goes “off synch”. (AMO and PDO cycles are not of the same length)
the “off syncs” happen when AMO and PDO are both in a negative phase, the correlation amplifies when they both are positive. when they oppose each other it’s a bit the “law of the strongest”
just compare the charts and it’s clearly visible
so in that way you can say the PDO does respond to solar cycles, and i dare to guess that the AMO would respond to it as well…
My model can beat up on your model. Nyah Nyah
Using (unadjusted) history beats and some common sense beats all the models, if you ask me.
(Sorry about the double beats)
“Di-dit, di-dit, di-dit, di-dit, dit, dit….”
No apologies, Pop Piasa, I hear that snare line too. =D
“Only if we can clearly distinguish natural variability from anthropogenic influences, we can make reliable forecasts for the future development of our climate,” Prof. Matthes summarizes.
Blasphemer!
If half the research funds that have been spent on attempting to find evidence of anthropogenic influences on climate had been spent on gaining a better understanding of natural influences, we would be better able to determine whether anthropogenic influences have any significance.
Unfortunately the IPPC’s definition of climate change has driven research up the wrong alley.
Whoops: IPCC
The model allows us to easily look at both human and natural influences and to separate their impacts from each other,” explains Prof. Dr. Katja Matthes
Is this the same anthropogenic influence Mikey is still trying to parce out of the modest warming? Dr. Matthes should give Mikey a call.
What Water Vapour is the dominant GHG and also the main COOLANT?
Well I never!
we
dont
have
the
data
period
wake me up when an honest study claims “we have no idea”. That’s were we are still at on AGW
With the data we have, there is just no way we can say, not on your life, we cant confirm of deny AGW though CAGW is bollocks
“The model simulations show that the fluctuations in water temperatures also affect the wind systems over the tropical and subtropical Pacific.”
The dog also wags the tail, the trade winds drive ENSO.
“Only if we can clearly distinguish natural variability from anthropogenic influences, we can make reliable forecasts for the future development of our climate,”
One can with the Arctic, rising CO2 should increase positive North Atlantic Oscillation conditions, that will cool the Arctic. But the more important matter is the source of the natural variability, unless the solar factors driving it are acknowledged, they’ll be forecasting nothing at all.
At least the study gives that ocean sector a major input on climate changes. Bravo for that.
Obamas, Clintons or Gore champions will still only recognize this as part of the minority 3% of Scientists and they are populist leaders that have little car for minorities.
In the atmosphere, the pressure of the air decreases with increasing altitude. This pressure difference causes an upward force called the pressure-gradient force. The force of gravity balances this out, keeping the atmosphere bound to Earth and maintaining pressure differences with altitude.
https://en.wikipedia.org/wiki/Hydrostatic_equilibrium
http://www.cpc.ncep.noaa.gov/products/stratosphere/strat-trop/gif_files/time_pres_TEMP_MEAN_ALL_NH_2015.png
http://www.cpc.ncep.noaa.gov/products/stratosphere/strat-trop/gif_files/time_pres_TEMP_MEAN_ALL_EQ_2015.png
http://www.cpc.ncep.noaa.gov/products/stratosphere/strat-trop/
It is not just the PDO that matters but overall global sea surface temperatures which will soon be on the decline due to very low solar activity going forward. UV light which penetrates the ocean surface to depth of several meters will be on the decline which should result eventually in lower sea surface temperatures.
As far as water vapor concentrations in the stratosphere and the effects upon the climate it is not a simple as this article suggest.
Spencer on water vapor feedback | Watts Up With That?
https://wattsupwiththat.com/2010/09/14/spencer-on-water-vapor-feedback
Sep 14, 2010 · Five Reasons Why Water Vapor Feedback Might Not Be Positive By Dr. Roy Spencer Since it … Spencer on water vapor feedback … stratosphere showed …
.
This article goes into depth about how complex water vapor in stratosphere versus a climate impact may be.
2) Negative Water vapor Feedback Can Occur Even with a Water Vapor Increase
Most atmospheric water vapor resides in the lowest levels, in the ‘turbulent boundary layer’, while the water vapor content of the free troposphere is more closely tied to precipitation processes. But because the outgoing longwave radiation is so much more sensitive to small changes in upper-layer humidity especially at low humidities (e.g. see Spencer & Braswell, 1997), it is possible to have a net increase in total integrated water vapor, but negative water vapor feedback from a small decrease in free-tropospheric humidity. See #4 (below) for observational support for this possibility
I highlighted the above from the article I just sent which is my point.
But the article I guess said the more water vapor there is in the stratosphere the warmer the climate, which I agree with .
All global climate change is simply a matter of varying the gradient of tropopause height between equator and poles.
The gradient variation is the negative system response to ALL system forcing agents.
The equatorial oceans push the tropopause up or pull it down depending on sea surface temperatures and solar effects on the ozone creation/ destruction process pull it up or push it down depending on the level of solar activity.
In so far as the change in the gradient affects global cloudiness (albedo) then the earth will warm or cool naturally.
If CO2 has any effect it would be too small to measure relative to natural variation.
The mechanism is described here:
http://joannenova.com.au/2015/01/is-the-sun-driving-ozone-and-changing-the-climate/
Bob Tisdale July 27, 2016 at 2:41 am says:
“I will agree with Bob Boder that there is no shown relationship between the PDO and sunspots before or after 1950, and I find no explanation for that in vukcevic’s comment at July 26, 2016 at 9:47 am.”
Mr Tisdale
Explanation very clear in the original comment which you may have missed, and there was no point repeating, but here it is anyway:
If the PDO data before 1950s is reliable than prior to 1950s the PDO relationship to the SSN doesn’t hold true.
I hope that is clear enough
Is the PDO data before 1950s reliable?
Anyway, I would suggest that one should really consider the interplay between top down solar effects and bottom up oceanic effects and so it is conceivable that for multidecadal periods of time PDO is in phase with SSN and for other multidecadal periods of time PDO is out of phase with SSN.
The NCEP GDAS and CPC temperature and height analyses are used to monitor processes in the Stratosphere and Troposphere. In the table below are zonal mean time series of Temperature, Zonal Wind Component, Normalized Geopotential Height anomalies, amplitude of the height field’s Wave 1, Wave 2, and Wave 3.
http://www.cpc.ncep.noaa.gov/products/stratosphere/strat-trop/
http://www.cpc.ncep.noaa.gov/products/stratosphere/strat-trop/gif_files/time_pres_TEMP_ANOM_ALL_EQ_2016.png
http://www.cpc.ncep.noaa.gov/products/stratosphere/strat-trop/gif_files/time_pres_TEMP_ANOM_ALL_EQ_2015.png
http://oi68.tinypic.com/jfarlk.jpg
The location of the tropopause is determined by chemistry and convection. Ozone is eroded by NOx that is a produced in soils and via biomass burning predominantly in summer. It is carried upwards in the tropics. Ozone is also highly soluble in water.But for the activity of these chemicals.ozone would increase in its partial pressure all the way to the surface of the planet. Consequently the tropopause rises in the summer hemisphere and more particularly so in the northern hemisphere because of the abundance of land.See here: ?ssl=1&w=450
Check out the distribution of NOX at 100 hPa against the distribution of ozone at this very useful site:http://macc.aeronomie.be/4_NRT_products/5_Browse_plots/1_Snapshot_maps/index.php?src=MACC_o-suite&l=TC
This statement is just plain wrong: “The higher the water vapor content in the stratosphere, the higher the increase in surface temperatures”.
In fact, in low latitudes (20°N to 20° south both surface pressure and the ozone content of the atmospheric column correlate very nicely with the temperature of the surface. It is observed that when 500 hPa geopotential height increases in the mid latitudes, the surface warms.Ozone entrained in high pressure cells of descending air causes geopotential height to increase and cloud to thin. Ozone is a potent absorber of infrared.Hence the warmth of the stratosphere.
This statement is sensible: “Only if we can clearly distinguish natural variability from anthropogenic influences, we can make reliable forecasts for the future development of our climate,”