A brief summary of the new paper published in Science Direct
Summary by Ralph Ellis
Why do ice ages occur? Surprisingly, even after many decades of paleoclimatic research we simply do not know for sure. Most scientists will agree that ice age cycles have something to do with precession: the slow wobble of the axis of the Earth. The ancient Egyptians and Greeks knew of precession and called it the Great Year, because it gives warm and cool seasons over its approximate 23,000-year cycle. But there is a problem with invoking the Great Year as the regulator of ice ages, because we should really get an interglacial warming every 23,000 years or so. And we don’t – they only happen every fourth or fifth Great Year.
But why should the global climate give a selective response to orbital warming and cooling? (Called ‘forcing’ in the climate trade.) This is one of the great unknowns of modern science. Many suggestions have been made, from interstellar dust blocking sunlight to the weight of the ice sheets depressing the lithosphere and warming the ice. And yet all of these theories share one thing in common – they stretch credulity. The only thing that is certain, is that the science is not settled in this area of climate research.
But a new peer-reviewed theory by independent researcher Ralph Ellis may have unlocked this perennial conundrum of paleoclimatology.*1 And considering the myriad implications that flow from this theory, its mechanism is nevertheless very simple to understand. What we need is a selective feedback system that can act either in concert with or in opposition to, the warming and cooling provided by the ~23,000-year Great Year. At present it is claimed that this feedback agent is CO2, because CO2 is a warming agent and its concentrations do indeed rise and fall with the ice ages. But there is a big problem with this assertion, because when CO2 concentrations reach a minimum in the depths of the ice age, the world warms. And when CO2 concentrations reach a maximum during the warm interglacial period, the world cools. And yet this is the very opposite of what should happen if CO2 was the primary warming feedback agent.
This is where the new theory by Ralph Ellis shifts the paradigm, and the primary character in this new climatic drama is albedo – the reflectivity of the Earth. Obviously polar ice sheets are highly reflective, they have a high albedo, and reflect up to 90% of the incident sunlight during the all-important northern summer. The cooling effect from this high albedo allows the polar ice sheets to slowly grow, year after year, and slowly reflect more and more incident sunlight in the process. And this ice-albedo reflection mechanism is so strong, it can even resist the next Great Summer when northern sunlight (insolation) is once again at a maximum, which is why some Great Summers produce no global warming whatsoever.

But if albedo is so strong that it can shrug off the increased sunlight of a Great Summer, then how does the climate system generate an interglacial warming? The answer is that ice-sheet albedo has a very prominent Achilles heel – dust. If dust gets on ice sheets their albedo is reduced considerably and they can melt very quickly. And surprising as it may seem this is exactly what happens, because every interglacial warming period is preceded by about 10,000 years of intense dust storms. And we know that this dust settles on polar ice-sheets, because the ice-cores taken from Greenland and Antarctica still contain that dust. And in Greenland, the majority of this dust appears to have originated from the Gobi Desert. But rather than being a shifting-sand desert most of the Gobi is currently pastoral steppe grasslands, where the herds of the Mongolian nomads graze. So how and why does this large steppe plateau become a true sand desert?
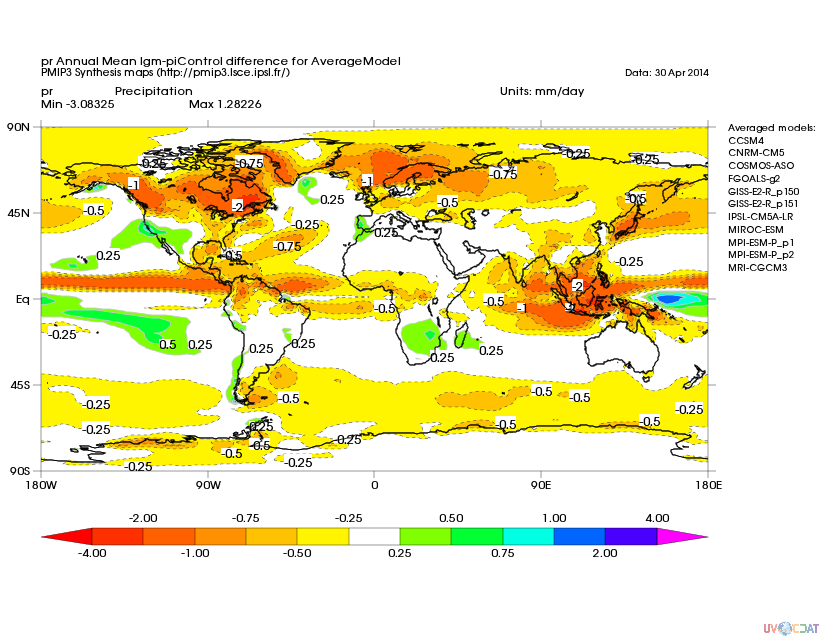
It has been claimed that desertification at the ice age maximum was caused by a cooling and drying of the climate. But there are many strands of evidence that conflict with this argument, and point towards a cooling of just 3ºc in tropical and extra-tropical regions, combined with only slight reductions in precipitation.*2 And much of the western Gobi was actually much wetter during the glacial maximum era.*3 The answer to this problem is CO2 concentrations, which reduced during the ice ages as the seas cooled and absorbed more atmospheric CO2. They eventually reached as low as 190 ppm, which is dangerously low for much of the world’s plant-life. Most plants suffer severe stress at 190 ppm CO2 and die at 150 ppm, because CO2 is a primary plant-food. And the fact that vegetation was suffering from CO2 starvation during the depths of the ice age was confirmed recently by a study of ancient trees preserved in the La Brea tar pits in southern California.*4
And so now we have the entire ice age forcing and feedback mechanism, laid out and plain for all to see. It begins when a Great Summer turns into a Great Winter, which reduces the sun-strength in the northern hemisphere and allows ice sheets to grow. This is a slow process that takes tens of thousands of years, and appears destined to turn the world into a complete snowball. However, the high albedo polar ice sheets have an Achilles heel – dust. As the ice sheets grow and the seas cool, CO2 also reduces. The concentration finally reaches the critical 190 ppm level where world flora begins to die, especially at higher altitude, and the Gobi steppe-lands turn into a true sand desert. This turns northern China into the equivalent of 1930s Dust Bowl America, and the ensuing dust storms dump thousands of tonnes of dust onto the northern ice sheets each year. And so when the next Great Summer comes along, the dusty polar ice sheets can warm and melt and the next interglacial is born. So CO2 can indeed cause global warming but its effect is much more pronounced at low concentrations, rather than high concentrations.

*1 Academia.edu link:
Modulation of Ice Ages via Precession and Dust-Albedo Feedbacks https://www.academia.edu/20051643/Modulation_of_Ice_Ages_via_Precession_and_Dust-Albedo_Feedbacks
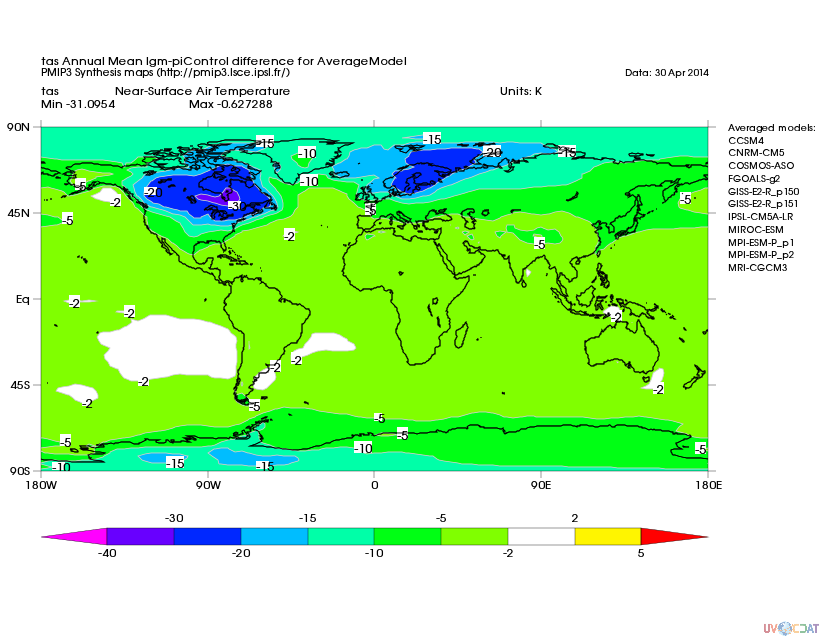
*2 PMIP (2015)
Paleoclimate Modeling Intercomparison Project (PMIP) http://pmip3.lsce.ipsl.fr/
The following map is an average of eleven precipitation models: http://pmip3.lsce.ipsl.fr/share/database/maps/lgm/pr_ann_piControl_diff_lgm_AverageModel.png The following map is an average of eleven temperature models: http://pmip3.lsce.ipsl.fr/share/database/maps/lgm/tas_ann_piControl_diff_lgm_AverageModel.png
*3 Yu, G. Xue, B et al (2003) LGM lake records from China and an analysis of climate dynamics using a modeling approach. Global and Planetary Change 38-3 p223-256 Sept 2003. doi: 10.1016/S0921-8181(02)00257-6
*4 Ward, J. et al (2004) Carbon starvation in glacial trees recovered from the La Brea tar pits in southern California. Well-preserved wood samples from the tar pits date from the Holocene to 55 kyr ago. http://www.pnas.org/content/102/3/690.full
Figs Laskar, J. Joutel, F. Boudin, F. et al (2004)
The Institut de mecanique celeste et de calcul des ephemerides. http://vo.imcce.fr/insola/earth/online/earth/online/index.php
Epica3 data (2007, 2008, 2015):
For Epica3 dating methodology please see:
Parrenin, F. Barnola, J. Beer, J. Blunier, T. Castellano, E. Chappellaz, J. Dreyfus, G. Fischer, H. Fujita, S.
The EDC3 chronology for the Epica Dome C ice core
http://www.clim-past.net/3/485/2007/cp-3-485-2007.pdf
Whoa! Makes total sense. So fire up those coal generation plants and SUV’s boys and girls, we are saving the planet.
The irony is that, if we should succeed in keeping the CO2 levels high through the next glacial maximum, we would remove the mechanism that would trigger the glacial termination, and we might end up (extreme scenario, of course) another Snowball Earth.
Nah, just remove all those diesel/coal regulation rules for soot; could also cover ice with artificial black. Would have to be cheaper than the present scrap industry programs; however I’m sure the greenies wouldn’t agree and would insist on our (and their) doom.
>>Nah, just remove all those diesel/coal regulation rules
>>for soot; could also cover ice with artificial black.
Indeed, you have it in one. And this is geoengineering which may actually work.
a. Blacken the polar ice caps to induce warming.
b. Keep them clean to induce cooling.
It has already been suggested that Alpine glacial retreat over the last century was caused by industrial soot.
End of the Little Ice Age in the Alps forced by industrial black carbon
http://www.pnas.org/content/110/38/15216.full.pdf
Ralph
Michael: Yes, but the process described here leaves the earth in glaciation for several procession cycles (great years). Only after several procession cycles would the CO2 levels drop so low that the Gobi desert vegetation dies, and the dust starts to blow.
During the next glaciation, human society would not last for 46 or 69 thousand years of ice age. So this process is irrelevant when talking about human society. But as others have suggested, if this theory is correct, we could bring about the early termination of, or possibly prevent the next glaciation via soot or artificial dust.
I fear you’ve taken his statement “And when CO2 concentrations reach a maximum during the warm interglacial period, the world cools. ” a little out of context.
But it’s worth a try all the same. 😉
No. The causal chain is
dropping temperatures -> CO2 sequestratio in the oceans -> low atmospheric CO2 -> plants die off, desertification -> dust storms -> dirty ice -> deglaciation come next “Great Summer.”
Take out low CO2, and you get continued dropping temperatures and even deeper glaciation.
@Michael
I get that. Very nice summation btw.
Just addressing the prior post where the humorous inference made was that increasing CO2 would reduce temps on earth.
Unless I’m missing something again? 😉
>>Just addressing the prior post where the humorous inference
>>made was that increasing CO2 would reduce temps on earth.
Not entirely humorous, just stating the facts. Increasing CO2 does result in lower temperatures. Which is somewhat at odds with the established rationale that CO2 modulates world temperature. And so the true inference to be drawn here, is that the correlation between glacial CO2 and glacial temperature is consequential rather than causal. Which is not what Al Gore implied.
Al Gore implying that CO2 controls glacial temperatures.
And the audience just laugh, instead of groaning and booing.
So they took the CO2 temperature-control bait, hook, line and sinker.
P.S. We are ganging up here.
If you don’t agree with me, I’ll get my big brother to beat you up….. 😉
Cheers,
Ralph
Interesting model.
Great paper. Get’s those neurons firing.
Yes. Very interesting. Note that our host Anthony has been raising the question of dirty ice for many years. I find this new twist fascinating – that the loss of CO2 causes desertification which leads to warming.
Wouldn’t this dust show up in the ice core record. Yearly influxes over thousands of years would be needed making a very identifiable trend? I’d have to see this correlation.
“And we know that this dust settles on polar ice-sheets, because the ice-cores taken from Greenland and Antarctica still contain that dust.”
“And we know that this dust settles on polar ice-sheets, because the ice-cores taken from Greenland and Antarctica still contain that dust. And in Greenland, the majority of this dust appears to have originated from the Gobi Desert. “. (3rd para from end)
The dust shows up very clearly, as does the correlation with CO2; see for example Figure 9 in the paper.
Michael,
Absolutely brilliant paper. Just two questions.
First, not that the Gobi and Taklamakan deserts aren’t in the same neighborhood, but could you clarify the origin of the dust source, Gobi or Taklamakan.
The Bory (2014) paper points to the Taklamakan desert (west of Gobi) as being the source point of the dust. The dust particles are finer, travel further, plus elemental and isotopic signatures match better than the Gobi.
Nice 2 page summary of Bory (2014). A “10,,000km dust highway between Taklamakan desert and Greenland”
http://pastglobalchanges.org/download/docs/magazine/2014-2/PAGESmagazine_2014(2)_72-73_Bory.pdf
Secondly, do you know if there has there been any dust analysis from any Barnes Ice Cap cores that may exist?
Thanks again for the great paper.
>>First, not that the Gobi and Taklamakan deserts aren’t
>>in the same neighborhood, but could you clarify the
>>origin of the dust source, Gobi or Taklamakan.
The modern source of Greenland dust is the Taklamakan. But isotopic analysis shows that there was a shift in sources during the LGM. From the dust analysis of the Loess Plateau in China and the ice core dust in Greenland, it seems fairly certain that the majority of the new LGM dust came from the Gobi.
So the modern high altitude pastoral Gobi steppe-land, turned into a vast CO2 shifting-sand desert. And this augmented and dominated the dust from the Taklamakan.
.
>>Secondly, do you know if there has there been any dust
>>analysis from any Barnes Ice Cap cores that may exist?
Most of the ice cores have dust analysis of them. In the paper I use Epica3 dust for Antarctica, and NGRIP for Greenland. There is much more dust in the Greenland cores than the Antarctic cores, because of the size of the Gobi in comparison to the Argentinian highlands.
The only problem with Greenland dust is it destroys the Greenland CO2 data, because of carbonate contamination. This is why this paper is dependent on Antarctic CO2 data (if the Royal Society is listening).
Ralph
The Takla Makan desert is the main dust source during interglacials because it is always a desert due to rain shadow effects. Also it is a windy place. I’ve flown over it several times and you rarely see the ground clearly because of the dust.
SC, just to be clear — my name is on the paper, but my role was minor. The key ideas are all Ralph’s, as is most of the footwork.
There is plenty of data on dust deposition from Antarctic Ice Cores. There are also a number of good scientific papers describing trends in dust content and sources of the dust. The data goes back hundreds of thousands of years. There is an “ice core data centre” with a searchable database. Check it out.
This looks interesting, time to read the paper.
Mac
I can save
phrenologistsclimatologists billions of dollars. It’s random.But… but they WANT the billions of dollars…
>> It’s random
….. but it appears not to be random. There appears to be logic and reason, within Gaia’s seeming madness. 🙂
R
As a key on a kite habit, I’ve made effort to be mindful of arctic temperature & weather patterns coincident with sea ice extent changes during summer months. I had hypothesized, like others, most likely, that albedo contributes to stratospheric height rises marked by surface temperatures sustaining rapid melting. When melting is sufficient, heights fall …mid-latitudes enjoyed tempered weather within weeks. These albedo height rises are similar to what evidently supports desert climate differentiations and distinguish rainforest water vapor availing climate from water vapor thinness in deforested areas. I am drawing attention to atmospheric heights (stratosphere particularly—-taiga…CO2 molar weight/ SSW) to suggest that lower atmospheric height forcing must be in place to overcome the height/temperature consequences of albedo counters…….
ideas,…
criticisms….
Off teh cuff
Wouldn’t it be nice to see a model correlating tectonic plate shift patterns to long period Ocean & surface Temperature Changes & magnetic field density changes (Milankovitch consequences/ mico-periodicities*eruptive*) so that albedo & dust causative potentiations can be merited,…..
> Most scientists will agree that ice age cycles have something to do with precession…
Hopefully, Ralph Ellis knows the difference between an “age AGE” (the current ice age began 2.6 million years ago) and a glacial PERIOD lasting on the order of 100,000 years. Is the summary really “by Ralph Ellis”?
I can assure you that Ralph is well read and knows the difference, even though he may use the terminology somewhat loosely.
The term “ice age” is used loosely even by geologists and climatologists.
Does it mean the whole Cenozoic “Ice House” interval, which began at the Eocene/Oligocene boundary, when Antarctica became surrounded by deep oceanic currents separating it from South America and Australia? In this case, then the Ordovician and Carboniferous Ice House glaciations of the Paleozoic Era were also “Ice Ages”, as of course were the global or nearly global “Iceball, Snowball or Slushball Earth” episodes during the Precambrian. (The Mesozoic Ice House didn’t produce major glaciations, the world being too warm then and the continents not ideally situated for the formation of vast ice sheets.)
Or, as David suggests, should it be restricted just to the Pleistocene glaciations of the Northern Hemisphere?
Or, as often used colloquially, can it refer to each glacial advance during the Pleistocene?
Quote:
Hopefully, Ralph Ellis knows the difference between an “age AGE” (the current ice age began 2.6 million years ago) and a glacial PERIOD lasting on the order of 100,000 years. Is the summary really “by Ralph Ellis”?
________________________________
I have used ‘ice age’ to signify the period post the Mid-Pleistocene Transition (MPT), as I think I make clear in the paper. The reason being that the temperature fluctuations prior to the MPT did not result in significant or enduring glaciation.
I write for the general public rather than academia, which is one reason why academia don’t like my style and are quite vocal and scathing about it. Even trying to exclude the paper on that basis alone. But I think the general public are quite familiar with the concept of major ice ages, and will find this paper much easier to understand as a result of my populist style.
Plus the mechanism explained in this paper ONLY applies to the major ice ages post the MPT. Prior to this time the small amount of polar ice was modulated by orbital obliquity. The reason for this dramatic change at the MPT is a topic for a later paper.
Ralph
“The reason being that the temperature fluctuations prior to the MPT did not result in significant or enduring glaciation.”
You should amend that to “..significant or enduring low-latitude glaciation in the Northern hemisphere”. There was a fair amount of glaciation in the 41 KA world too. Antarctica of course has been fully glaciated for 14 MA, Greenland for at least 2.5 MA, and there were substantial though short lived ice-caps in North America and Scandinavia before the MPT.
Antarctica of course has been fully glaciated for 14 MA, Greenland for at least 2.5 MA, and there were substantial though short lived ice-caps in North America and Scandinavia before the MPT.
______________________________
Indeed for Antarctica. But as to N America, one paper I saw showed only small rumps of ice sheets over northern Canada. But Greenland will always have an ice sheet due to its unique topography, as I explain in the full paper. See fig 13.
Yet a Royal Society reviewer said: “The Greenland ice-sheet is at the same latitude as the European ice-sheet. So why did that ice-sheet melt due to dust and not the Greenland ice sheet? This aspect seems to strongly undermine the proposed dust-driven ice ages theory.”
The succinct answer to which is: “read the paper, dude”. The text around fig 13 gives the full reason for this dichotomy.
The full paper:
http://www.sciencedirect.com/science/article/pii/S1674987116300305
Congratulations on getting this published. I have seen delta T, delta CO2, and delta CH4. I do not recall having seen an analysis of delta dust as you show from the Epica ice core in your revealing figure above. Nice spot.
We know from the black carbon ‘dirtification’ of Greenland summer ice that the soot is not all washed away into moulins during the summer melt. So there should be a residual change in dust. Epica confirms this.
Is the Epica core dust also replicated in other ice cores? Reason to ask is dust is very locationally specific to sources nd prevailing winds. That is why in today’s climate there are large stretches of ‘barren’ ocean lacking iron fertilization from dust. Sahara fertilizes middle Atlantic all the way to the Amazon. Australia fertilizes part of the high latitude Southern ocean. But vast stretches of the Pacific and Indian oceans are ‘barren’. For example, Station Aloha north of Hawaii, where ocean pH is measured without a biological seasonal signal.
“We know from the black carbon ‘dirtification’ of Greenland summer ice that the soot is not all washed away into moulins during the summer melt. So there should be a residual change in dust. Epica confirms this.”
—
Does the surface at the top of the Antarctic ice shield even melt in summer? I thought not.
The dust records of Antarctica and Greenland are pretty much in phase, as far as Greenland goes back of course, but the absolute levels are about five times higher in Greenland. Records from various mountain glaciers — yet shorter in duration, but some do capture the last glacial termination — are also compatible.
MP, perhaps you misconstrued my point. For RE’s thesis to be valid, there should be confirmation more generally from other ice cores. Dusy is local/regional because of sources and prevailing winds. Entering and leaving ice ages is probably not triggered locally/regionally. Even if the most recent main additional ice age accumulation, the Laurentide ice sheet, was regional to northern North America. That is not a place where dust would logically accumulate even if north China desertified. Sahara dust barely reaches the Amazon, not half way around the world. Sub-stratospheric volcanic aerosols, a lot ‘lighter’ than dust, have a troposphere residence time of 4 weeks or less. Half way round the world is 12000 miles at the equator. To spread dust that far in 4 weeks requires a constant wind of >18mph. And remember, almost nothing remains at the end of that 4 week journey. Implausible that there is a constant 18 mph wind in the lower troposphere in only one direction that persists for millennia. Hence, my query to RE about additional broader ice core support.
Dust is indeed strongly local and regional, but there is substantial long-distance travel also. The Antarctic dust is apparently predominantly of South American origin in glacial periods, but in interglacials a significant share comes from Australia, which is further off.
The dust from Central Asia should indeed affect regions immediate to the North more strongly, and this has been proposed to account for the lack of major ice sheets in Northern Siberia. This illustrates that the idea of dust as a major factor in controlling ice sheet extent as such is not new.
Just some random thoughts for what they are worth,
Gobi desert dust today is known to occasionally travel across the Pacific at 5,000m+. Bory (2014) however considers the Taklamakan desert to be the source of Greenland ice core dust and since the particles are even finer I would assume a longer atmospheric residency.
http://pastglobalchanges.org/download/docs/magazine/2014-2/PAGESmagazine_2014(2)_72-73_Bory.pdf
(A 10,000km dust highway between the Taklamakan desert and Greenland)
As far as transport of dust is concerned there are several atmospheric models to look at. Bromwell et al. is just the first one I came across but be advised I have absolutely NO idea where this issue stands today.
It postulates air speeds over the Laurentide ice sheet (Northern fork, 21kya before present, NH winter) at velocities of 45 m/s (160km/h) at 500 hPa (5,500m.) Now THAT is what I would call a speedy delivery service.
https://courses.eas.ualberta.ca/eas570/bromwich_etal.jclim04.pdf
Thoughts?
“The dust from Central Asia should indeed affect regions immediate to the North more strongly, and this has been proposed to account for the lack of major ice sheets in Northern Siberia.”
The Dust theory might fit in with the “westward trend” of ice distribution during the last glaciation. During the first cold intervals (MIS 5b and particularily MIS 5d) there was quite substantial glaciation in Siberia, but much less during MIS 4, while during the LGM (MIS 2) there was very little glaciation east of the Urals.
SC
I support your pathway analysis above. There is a pathway that extends in winter from Botswana to Australia which was photographed in 2002 as I recall. A team of more than 200 scientists headed by Prof Harold Annegarn of the University of Johannesburg set fire to a large piece of land during dry season. The smoke was followed by aircraft including a U2, and satellite. The Satellite tracked it all the way to Western Australia. This indicates that atmospheric mixing is a lot less than it is trumped up to be.
I find the albedo hypothesis convincing. Don’t forget the algae. There should be evidence of the algal blooms in the ice. Perhaps one triggers the other. Once it gets melting there are lots of things that can grow. It should be possible to spot this on the edge of ice sheets in summer, not so?
Just don’t look only for dust in ice cores. Seewhat find in regions close to those old ice-shields. In Germany, close to the former Scandinavian ice sheet you find…Loess (https://en.wikipedia.org/wiki/Loess)
Indeed, but what kind of loess?
The dust in the Greenland ice cores is demonstrably from the Gobi.
R
>>I have seen delta T, delta CO2, and delta CH4.
>>I do not recall having seen an analysis of delta
>>dust as you show from the Epica ice core in your
>>revealing figure above. Nice spot.
Thanks. As I said to one of my critics – most of the pieces of this jigsaw puzzle were already on the table. The only difference is that I have arranged them into the right order, and created a coherent picture that makes sense. And I have done so without frequency analyses and models, because they were an unnecessary distraction that more often than not gave the wrong answer.
.
>>We know from the black carbon ‘dirtification’ of Greenland
>>summer ice that the soot is not all washed away into
>>moulins during the summer melt. So there should be a
>>residual change in dust. Epica confirms this.
>>Is the Epica core dust also replicated in other ice cores?
Yes, the NGRIP core shows ten times as much dust in Greenland as Antarctica. But the dusty ice high up on the Greenland ice dome never melts, as it is too high and too cold. The important factor was the dust on the lower reaches of the Laurentide and Euro-Asian ice sheets, at their terminus. These regions not only received more dust, they were also low enough and south facing enough, to trigger rapid melting. But even then, only when coincident with a Great Summer (a Milankovitch maximum insolation period).
Ralph
Ok this truck driver has a question. If desertification and conversion of vast areas from forest to Savanna was not caused by a lack of water then where did the water come from with so much of earths water was trapped in ice? I mean sea levels dropped almost 400′ during the last one. That is a whole lot of water trapped in the ice. Or was it?
I should have been clearer “the last one” referred to period of glaciation and not ice age.
Yes, almost all of the water trapped in the ice sheets was removed from the oceans. That would be the case regardless of how arid the land really was, since the amount of water stored in freshwater lakes is tiny by comparison.
Maybe you are a truck driver now, but were a former special forces medic. Smart, not dumb. Survived. Sir (with salute) another partial answer to your excellent common sense question.
When sea level drops that much during LGM (about 150 meters), we have no clue what prevailing weather patterns do. The Bering Strait was dry land. The Aleutians were a land bridge to Asia. The Fucca Strait was dry land in SE Asia. Much of the North Sea was a vast dry land called Doggerland–British Isles were not isles. You could walk from PNG to north Queensland across the Torres Strait.
So to project where and how land desertification occurred, and where the resulting desert dust blew is mere speculation until sufficient ice cores from around the world suggest such prehistoric patterns. IMO.
ristvan
I describe myself as a truck driver because that is what I do now but also for another reason. To many it seems that particular job description indicates a particular lack of intelligence or education in those that do it. It’s true there are a lot of ignorant truck drivers out there but on the whole that characterization is not accurate. Plenty of truck drivers out there with bachelor degrees and some with even higher levels of education. Lots of us do the job because we enjoy it and observe and think about what we see in our travels. It is an excellent 2nd or 3rd career for many of us. Like many fields there is a great variation in the demands of particular jobs within the field. In truck driving anyone that is a dummy is not going to be successful doing true over the road driving hauling different loads to different places about the country all the time.
As for having been an SF medic. Thank you for your expression of respect and your apparent understanding of what that job required and the training involved. The Army gave back to me every bit as much as I put into it. When I went through the SF qualification course (SFQC)there were 3 phases of training with the 2nd phase specific to the MOS or job specialty the SF soldier would serve in (Weapons, Commo, Engineer, or Medic). That 2nd phase was broken down into 3 sub phases for medics. When I went through the first phase 202 went in and 99 finished. The first portion of the 2nd phase 60 started and 42 finished. The 3rd portion of the 2nd phase, known as Medlab 40 started and 18 of us finished. And the attrition didn’t end there. There were four of us medics in my graduating class that went to 10th SFG(A). In less than a year one had quit and another had been stripped of his SF qualification having been found unsuitable.
I did lawn care for 40 years with BS in chemistry and math to the masters level but skipped the degree. Got four months off to do study of math working on some of those well known unsolved problems during winters. I did not like the ACS and NFS registration programs. Odd thing was that only one long term custom treated me as anything other than what one old lady did who just referred to me as ‘jobber’.
By the way, does anyone see how the glaciations changed from 40,000 years to the more present ones of 100,000 years?
Ristvan,
We do have an idea as to prevailing weather patterns during the Last Glacial Maximum. Also ocean currents and other climatic phenomena besides temperature and precipitation.
more ice leads to more land leads to more dust leads to less ice………..>>>>>
>>If desertification and conversion of vast areas from
>>forest to Savanna was not caused by a lack of water
>>then where did the water come from with so much
>>of earths water was trapped in ice?
The tropical temperature during the Last Glacial Maximum (LGM) was only about 3.5ºc lower than today, and precipitation levels were much the same as today. See my fig 7a and 7b in the paper, taken from the standard PMIP3 models. The seas were quite large enough during the LGM to deliver precipitation. In fact, you would not have much noticed much difference in the tropics, to today’s tropical climate.
And this produces a dichotomy. If everything was much the same, then why the sudden desertification and dust at the peak of the LGM? The answer that nobody wanted to address, is that the deserts were caused by a lack of CO2. They were not aridity deserts, they were CO2 deserts. (Why have you not heard that term before…?)
And the reason why this explanation has been avoided, is it implies that CO2 does not control glacial temperature. Instead, the controlling feedback agents are dust and albedo. And the real heresy is that the dust was caused by a lack of CO2, which implies that CO2 is generally good for us.
R
If that average temperature for the tropics is correct then it must have been a very extended and intense windy and stormy time with such a contrast in temperatures between the arctic circle and the tropics and that would of course enhance the amount of dust being carried into the atmosphere.
If that average temperature for the tropics is correct then it must have been a very extended and intense windy and stormy time.
_________________________________
The Loess Plateau in China does indeed record an increase in windspeeds in the Gobi region. And for each glacial cycle. But further north in Greenland, the evidence is for much the same winds as today. But that is not so surprising, as Greenland is far from the ice sheet termini and the temperature differences there.
R
Ristvan
There seem to be two major theses about the limiting factors for global average temperature: the CO2 desert and the tropical thunderstorm. One limits how low CO2 can go pretty much no matter what the solar isolation is (within the limits of orbital radius). The other sets an upper temperature for the globe-girdling tropical zone which can expand and shrink pole-wards but not rise above an average of 32 C. The limit is it can even include the poles, which has happened.
Very interesting, and you heard them both first on WUWT.
As for the snowball earth period, that is quite easy to explain. If the continents were sized and placed such that the vast majority of the land were covered with at least some snow and ice, there would be no available source of dust no matter how low the CO2 went.
In fact it wouldn’t matter what the CO2 level was! Once the air becomes dry enough (water vapour being the dominant greenhouse gas) the temperature would keep dropping until it was 20 or more degrees below what it is now as the absolute humidity plummeted.
Now I see three mechanisms at work: water vapour warming, CO2 deserts and thunderstorm feedbacks. With various combinations of these we can envisage every known long term climate episode. Yes, yes, ocean circulation is another impacter, but the oceans are more consequential than causal, more like a flywheel than an engine. The heat available is modulated by the cloud cover which is dominated by tropical thermals and storms.
Fascinating.
>>There seem to be two major theses about the limiting
>>factors for global average temperature: the CO2 desert
>>and the tropical thunderstorm.
Indeed, and as I say that the end of the paper, I think they are complimentary.
The ice sheet dust-albedo changes set the stage, with their massive influence over temperature and climate. But when we reach an glacial era or an interglacial era, it is the cloud feedback that modulates the temperature, to keep it steady in that new regime.
Ralph
Oh FFS. Here they are calling glaciation periods ice ages, and this is technically wrong. Alarm bells go off loudly. And then they nit-pick over just one Milankovitch cycle, precession and which is the shortest of the Milankovitch cycles, and wonder why the alleged “ice ages” are longer. Nothing of interest here …
Try to focus on the big picture, not on the nit-picking. The rule that only every 4th to 5th “great summer” starts an interglacial holds up throughout the entire Antarctic record. Moreover, each of these deglaciation events is preceded by a strong dust peak that lasts for several thousand years, and in turn is associated with a minimum of atmospheric CO2.
There are a lot of possible substantial objections to this hypothesis, but obsessing over terminology or other details of presentation is not useful.
The reason why precession starts every 4th or 5th great summer is because precession cycles occur approximately 4.35 times during one eccentricity cycle, and it is the eccentricity cycle that is the main driver.
Look at the first illustration. There is absolutely no regular 4.35 periodicity anywhere. The interval between interglacials varies from ~90 to ~120 millennia.
“First they ignore you, then they laugh at you, then they fight you, then you win.”
Forget the nitpickers, you are at stage 3.
FJ
The reason why precession starts every 4th or 5th great summer is because precession cycles occur approximately 4.35 times during one eccentricity cycle, and it is the eccentricity cycle that is the main driver.
___________________________________
Eccentricity only becomes a ‘driver’ because it enhances the effects of the precessionary cycle.
However, this link with the eccentricity cycle does not explain the missing Great Summers (Milankovitch insolation maximums). If you look at figs 2 and 3 in the paper, you will see many eccentricity-enhanced Great Summers that produced barely a whimper in the temperature record, let alone a full-blown interglacial.
Why was that? Why should the climate produce a selective response to Great Summer insolation?
The reason has never been explained before, but the answer is simple – the high albedo of the northern ice sheets can reflect and reject all of that extra insolation. Ok, but the question then becomes – how can an interglacial ever occur? Why don’t we end up with a snowball Earth?
The reason is dust. Dust can lower the albedo, and give the Great Summer a fighting chance at warming the ice sheets. And now all you need to do is explain the dust production……
Ralph
Isn’t the 100,000 year cycle associated with the eccentricity of the earth’s orbit?
Wouldn’t this cyclicity explain why we don’t get a strong glaicial signal every 24,000 years?
The problem with the eccentricity hypothesis is that there is no compelling or agreed-upon physical mechanism that links eccentricity to deglaciation; it is really only based on “frequency analysis.” Also, the two are not that closely in phase.
John Reistroffer–
The article considers all three of the Milankovitch cycles, and finds some effect of all, but settles on precession as the main driver. The four or five cycles between glaciation periods occur because there has to be a dieoff of plants due to low CO2 followed by dust coating the Arctic ice to reduce albedo enough to allow the ice to melt.
Precession works only through the other more major Milankovitch cycles – obliquity and eccentricity. Without the other two, it has little impact.
Earlier glaciation cycles (of the current ice age) were about 40,000 years, not the 100,000 years of the most recent. Can this hypothesis explain that?
FJ, that’s just the point. In conjunction with the other, shorter cycles, eccentricity produces the variations in the intensity of Northern Hemisphere summer insolation shown as the blue curve in the first graph above. SO, we are back to the question: Why doesn’t each of those insolation maxima (“Great Summer”) result in deglaciation?
If you compare the insolation graph with the temperature graph, you can see that each full deglaciation coincides with one of the “Great Summers”. There is no strictly observed constant frequency; the interval between deglaciations varies from ~90 to ~120 millennia. This suggests that there is no tight, exclusive coupling between eccentricity and the glacial cycle.
When obliquity is approaching maximum and NH summer solstice is approaching perihelion and eccentricity is higher the great northern ice sheets melt. These three cycles must come together to create the melt conditions in the northern hemisphere and they only do so approximately every 100,000 years. Perhaps the combination also is responsible for increasing the dust.
andyH – no. A key problem is that the Antarctic ice record, on which much of the hypothesis is based, doesn’t go back beyond the switch to the 100 k-year cycle.
>>FJ
>>Precession works only through the other more major
>>Milankovitch cycles – obliquity and eccentricity.
>>Without the other two, it has little impact.
Not quite FJ. There is only ONE Milankovitch cycle, which is an amalgam of all three orbital parameters, and measured in insolation strength.
The effectiveness of precession (the Great Year) is indeed dependent on eccentricity. But obliquity is not, and has an effect on insolation whatever the eccentricity. That is why the interglacials 400 kyr ago and 19 kyr ago happened, because of obliquity assistance in times of low eccentricity.
.
>>Andy
>>Earlier glaciation cycles (of the current ice age) were about
>>40,000 years, not the 100,000 years of the most recent.
>>Can this hypothesis explain that?
No. This is a topic for the next paper.
These shorter 40 kyr cycles were obliquity modulated, rather than Great Summer modulated (Milankovitch modulated). The difference is likely to be the propensity of the north pole to produce ice sheets, which demand a much stronger insolation effect to dissipate them, than obliquity can provide. And this may in turn be due to the extent of the Himalayan ice sheet. More on this later.
.
>>Tom
>>When obliquity is approaching maximum and NH
>>summer solstice is approaching perihelion and eccentricity
>>is higher the great northern ice sheets melt.
But as you can see in figs 2 and 3 in the paper, there are many strong Milankovitch Great Summers that produce no warming at all. To explain the mechanism that modulates the post MPT ice age cycle, you need to explain all of these anomalies and discrepancies. And this paper does that.
R
This is one long connected argument dealing with all of the major forces and feedbacks comprising the theory. Wide range of references, including even Eschenbach! Looks like years of effort. Very nicely done. Ellis has no affiliation listed. Is he still active in the field?
Insightful article, thanks Ralf.
What makes the glacial maxima more dusty is CO2 starvation and plant die-off.
Indeed. And this is something that has not been addressed before. There have been previous papers on flora and dust, and flora and CO2. But nothing tying in low CO2 with high altitude and low partial pressures, causing CO2 deserts, and therefore dust production and albedo reductions. I could not even find the term ‘CO2 Desert’ on the net (apart from references to pistols).
In fact one reviewer from the Royal Society claimed that CO2 concentrations do not decrease with altitude, and so plants cannot be starved of CO2 at high altitude. **facepalm** So I invited him or her to go to the top of Everest and see if they could breathe as easily there as at sea level – after all, the O2 concentration on Everest is exactly the same as at sea level.
Where do they get them from….?
Ralph
The higher the elevation, the less particles in the air, so the less CO2 particles per dm3. Never thought about that before! The less CO2 particles per dm3 (absolute), the more water a plant needs. So, ‘CO2 deserts’ and ‘CO2 desertification’ are real phenomena which occur first at higher altitudes when global CO2 levels are going down.
The 150 ppm CO2 starvation level will be first met in drier situations at higher altitudes. Like in the Gobi desert, 920 – 1520 metres above sea level. Dry and deprived of sufficient CO2.
It would be better to define the CO2 starvation level in parts per dm3. Resulting in a nice table for elevation and ‘parts of CO2 per dm3’
Wim, Ralph and I started out with that idea as well, but there is actually no simple relationship between absolute CO2 levels at higher elevation and plant starvation. One effect that plays into this is that absolute oxygen levels are reduced also, and oxygen is an inhibitor of CO2 fixation. Another is the accelerated diffusion of gases at reduced pressure, which compensates the lower CO2 levels to some degree. Overall the effect of CO2 reduction with elevation is therefore smaller than expected, but somewhat difficult to accurately quantify. Here is one reference on the subject.
>>Overall the effect of CO2 reduction with elevation is
>>therefore smaller than expected, but somewhat difficult
>>to accurately quantify.
But reduced partial pressures with altitude most certainly have a great effect when combined with the reduced moisture conditions of somewhere like the Gobi. Plants get stuck between the CO2 and moisture jaws of Gaia’s climatic vice.
I thought I would put that one in… 😉
R
Global (i.e. uniform) warming, whether natural (potentially sustainable), or anthropogenic (likely punctuated), may be the impetus for creating a favorable environment for biodiversity, and either accelerating or stabilizing thermodynamic gradients.
This is a very compelling theory and model. Certainly the best one out there currently.
The Last Glacial Maximum was definitely dry, windy and dusty.
The problem is that the dust was maximum when there was no melting. When the melting is done dust levels have gone down considerably.
From Clive Best at http://clivebest.com/blog/?p=7024
http://clivebest.com/blog/wp-content/uploads/2016/01/Details-Eemian-1024×462.png
Figure 1: The blue curve is a calculation of the maximum insolation in summer at the north pole. The ice volume data is the benthic d18O stack. In red is the Epica temperature anomaly data from Antarctica. In yellow is the Epica CO2 data and in purple their dust data. The black curve is the change in the Earth’s orbital eccentricity. The temperature, dust, and ice volume data have all been scaled for comparison purposes. Click to expand
But the effect of the dust will be most pronounced when the precession is producing a certain higher summer insolation. So, prior to that, the dust isn’t having much effect.
True.
The idea is that the dust is deposited on the ice sheets, layer by layer, while it is cold and the ice sheets are not melting. Through outward glacier flow, the ice sheets turn over on a time scale of thousands of years. When dust storms rage continuously for several thousand years, then a large part of the entire ice sheet volume ultimately becomes tainted with dust. As such, this doesn’t suffice to induce melting, but when the next insolation maximum hits, the dust that was entrapped in the ice and now becomes exposed again as the surface melts ensures that albedo stays low and the melting continues apace.
The idea strikes me as plausible, but hard proof is of course hard to come by. Once the modelers get hold of it, they will choose their parameters to confirm or reject this mechanism as desired.
It’s certainly an interesting hypothesis, but it still seems unlikely to me. From Javier’s graph above, dust is high and CO2 low throughout the glacial periods. Dust affecting albedo would sound plausible, but we’re talking about 10k’s of years. I find it hard to believe that dust can continue to have a significant effect over any long period of time, because it is covered up by the next snowfall. And why would the dust have no effect for 10k’s of years and then have a sudden effect? Also, as the ice melts again to uncover the dust, would the dust really stay on the surface or would it warm and melt its way in again? Sorry, I haven’t read the whole thing, so maybe it’s all explained there.
Mike, the ice sheets undergo partial advances and retreats throughout each glacial period. The partial retreats are not typically preceded by major dusty periods, so the arrival of an insolation maximum alone must suffice to get the melting started. However, the melt-off seems to progress more slowly and runs out of steam before completion when the insolation maximum subsides.
To reiterate: as new, dusty snow layers are deposited on top of the ice sheet, the older, compacted ones below are displaced sideways as glacier ice. Snowfall on top of the Laurentide and Fennoscandian ice sheets was likely higher, and ice sheet turnover faster than in Greenland, so a few thousand years of dustiness would taint a large part or even the whole of the ice sheet volume. Once that has happened, and the next Great Summer arrives, any dust removed with surface melt-water runoff would be continually replaced by freshly exposed, pent-up dust, ensuring that ice albedo remains low, and melting continues apace. This is why the dustiness has to precede the melting to be effective, not coincide with it.
Michael Palmer,
We don’t know if it works like you say. It is possible that the dust gets washed away to glacial lakes and streams during melting episodes and over thousands of years may even go to the sea or outside the ice sheet through glacier advance and iceberg calving. Ice is very dynamic and we are talking thousands of years.
What is clear is that the melting at glacial terminations is not proportional to the amount of dust produced, as some glacial periods produce a lot less dust than others.
Javier, of course the dust will get washed away when the ice melts. That’s the point — dust that is being washed off the surface must be replaced from within the melting ice itself to ensure that the ice stays dark.
As to the variability of dust produced — yes. It may well be that the duration of a dusty period is as important, or more so, than its peak intensity. Of course, there is also the variability in the “great summer” insolation intensity.
And yes, we can’t be sure whether this hypothesis is true. All I’m trying to do here is to clarify and make the case. Well-founded criticism is most welcome.
Nothing much to add to Michael’s explanation there. It says it all.
Perhaps to add that of course the dust will stop as soon as the warming begins, because CO2 increases and the CO2 deserts in the Gobi return to being pastoral steppe-lands. So no more dust. Warming then continued because continued melting brings old dust layers to the surface, further lowering the albedo.
And the dust on the ice sheets is not easily washed away, as the images in the paper demonstrate.
Ralph
Mike Jonas, blown away particles (sand, loess, dust) cover big parts of the Earth’ surface. Loess alone counts for 10% and can be found in layers up to “more than a hundred meters in areas of China and tens of meters in parts of the Midwestern United States” – https://en.wikipedia.org/wiki/Loess
The influence of aeolian particles must have been immense. Especially at the end of the ice ages large area’s were uncovered by ice and also (a period) uncovered by plants. Big temperature differences resulted in big pressure differences and so in strong winds with massive sand, loess and dust deposits as a consequence. Different from present times.
Michael Palmer – Thanks for the explanation. It will be interesting to see where the idea goes to from here. As you say, the modellers will regrettably choose their parameters to match their preconceptions, so we have to keep looking at the real world.
>>The Last Glacial Maximum was definitely dry, windy and dusty.
Not true.
The PMIP3 map below is a combination of eleven LGM precipitation models. (See also my fig 7.) As you can see, there is a drier band over the equator, but the tropical regions were the same or wetter. And a survey of western Gobi desert lake beds shows that they had much higher levels during the LGM than today. And the Gobi region is the crucial region for Arctic dust production.
So why did the Gobi become a true desert during the LGM, when it was wetter? It has been suggested that it was bitterly cold, just as they said that Columbia was bitterly cold (and dry). (Their tree thermometers says so.) But the facts simply don’t stack up, because neighboring regions and lower regions show no such dramatic temperature reductions.
The answer is that scientist have made a big mistake. If we disregard trees as being thermometers, and agree that they were measuring CO2 partial pressures during the LGM instead, then all these anomalous and highly controversial cold and dry regions disappear. So now there is no need to make unbelievable adjustments to the Columbian temperature lapse rates, to make things ‘fit’.
In truth there were slight reductions in tropical temperatures, averaging 3.5ºc, while precipitation remained largely stable (as the Gobi lake beds attest). And the primary reason for Gobi desertification, was low CO2 and the production of high altitude CO2 deserts.
http://pmip3.lsce.ipsl.fr/share/database/maps/lgm/pr_ann_piControl_diff_lgm_AverageModel.png
What sparse direct evidence of past temperatures there is, however, suggests that PMIP underestimates the temperature drop in the tropics, and by extension the aridity. My sense is that the relative contributions of aridity and of CO2 depletion to the plant die-off in the LGM are very difficult to separate based on the available evidence.
>>What sparse direct evidence of past temperatures there
>>is … suggests that PMIP underestimates the temperature
>>drop in the tropics.
Mostly because some direct evidence used flora as temperature gauges, without taking CO2 into account. The original CLIMAP model came out with smaller tropical temperature falls, which were increased because of the flora temperature gauges.
R.
Ralph, I get that, and thus I went looking for evidence that would not depend on vegetation. Here is one paper that gauges temperature based on some slow, temperature-dependent chemical process that occurs over thousands of years in fossil bones. Few data points, geographically speaking, but I’ll take this kind of evidence over computer models any day of the week.
one would maybe pause in thought that CO2’s nearly inert state combined with it’s high thermal response might make it very mobile in the atmosphere, possibly even capable of becoming a driving force in air circulation…
but that would require an understanding of the law of thermodynamics… something climate scientists have never learned…
Ralf, congratulations on getting your paper published. It is good that new theories get published and discussed, even though you know that I do not think that the evidence available supports your theory, from the discussions we had over at Clive Best’s blog when you presented your theory:
http://clivebest.com/blog/?p=7024
By the way if the figure included above is one of the figures made by Clive you should acknowledge him.
On the timing of interglacials the most credible theory is that they depend on obliquity, not precession. That is why they used to take place every 41 Kyr and now they take place at multiples of 41 Kyr. The best bibliography on this theory is:
Huybers, P. and Wunsch, C. 2005. Obliquity pacing of the late Pleistocene glacial terminations. Nature 434 491-494.
Huybers, P. 2007. Glacial variability over the last two million years: An extended depth-derived agemodel, continuous obliquity pacing, and the Pleistocene progression. Quat. Sci. Rev. 26 37-55.
Liu, Z., Cleaveland, L. C. and Herbert, T. D. 2008. Early onset and origin of 100-kyr cycles in Pleistocene tropical SST records. Earth Planet. Sci. Lett. 265 703-715.
Paillard, D. 1998. The timing of Pleistocene glaciations from a simple multiple-state climate model. Nature 391 378-381.
As I have said before, your data shows that there is a coincidence between very cold, low CO2 periods and dust. We already knew that deserts expand on cold periods, so it is consistent. We also knew that sea productivity increases during glacial periods due to desert dust increase. But all the rest is opinion. Whether interglacials come from increased dust or not, you have shown no evidence, and some interglacials come after little dust increase and others come several thousand years after the dust has fallen from peak levels, and that is not very convincing.
Given that the ice that melted is no more there available to research, I wonder how you could directly link dust on ice sheet to the fact the sheet melted away?
Through mathematics, physics, and experimentation, as always.
It is good that hypothesis get published so more people with different backgrounds can have a go at them.
>>By the way if the figure included above is one of
>>the figures made by Clive you should acknowledge him.
Prof Best is acknowledged. See fig 14 in the paper. And the Acknowledgements section.
.
>>On the timing of interglacials the most credible theory
>>is that they depend on obliquity, not precession. That
>>is why they used to take place every 41 Kyr and now
>>they take place at multiples of 41 Kyr. The best bibliography
>>on this theory is: Huybers, P. and Wunsch, C
But interglacial warming events do NOT take place every 41 kyr, as my table 1 demonstrates. As you can see in Table 1, interglacials occur every 115 and 90 kyrs, which are close to but not the same as the 41 kyr obliquity cycle. This is the problem with a statistical frequency analysis of cycles, because they can lead you down a blind alley, giving intriguing but completely false results.
And even if you wanted to shoehorn the obliquity cycle into the interglacial cycle, you still have the missing cycle problem. Why would the climate miss out one or two obliquity cycles, and produce an interglacial every two or three cycles?? You are back to the selective feedback problem. And this is the very problem that this paper seeks to explain, and does indeed explain.
And with all due respect to Prof Huybers’ undoubted expertise, he has used a non-orbitally tuned glacial temperature record, to make his obliquity theory fit. But if you leave out the orbital tuning, the chronology becomes guesswork. And because this was a sea-bed core, and not an ice core, the chronology is also missing the Laschamp event (41 kyr ago) and the Mont Berlin ash layer (92 kyr ago), which are valuable chronological pegs to stabilise the chronology. So all the Huybers chronology has for verification is the modern interglacial, and the Brunhes-Matuyama magnetic reversal (778 kyr ago), and pure guesswork in-between.
And from this you can be certain that obliquity was modulating ice ages?
Ralph
Oh yes they do take place at 41 kyr multiples and this is very easy to demonstrate, as Euan Mearns did with this figure (pink dots):
http://www.euanmearns.com/wp-content/uploads/2016/03/41000.png
Source:
http://euanmearns.com/can-geology-tell-us-what-is-warming-the-climate/#comment-17050
The 100 kyr periodicity is fictional. It does not exist.
Actually the real problem is to explain how is possible that the glacial-interglacial cycle went from being dominated by the 41 kyr obliquity periodicity to the 100 kyr eccentricity periodicity at the MPT.
Explaining the missing cycle problem is quite easy as the Earth has become progressively cooler and thus more difficult to get out of glacial conditions. Paillard has a very good model from 1998:
Paillard, D. 1998. The timing of Pleistocene glaciations from a simple multiple-state climate model. Nature 391 378-381.
I guess you don’t understand that the obliquity hypothesis does not depend on Huybers methodology. It comes from accepting evidence that obliquity has been in control of glacial-interglacial cycles for 2.5 million years and the situation did not change 1 million years ago. It is still in control, it is just less efficient getting the planet out of glacial conditions.
The corollary is that when obliquity gets low enough in a few thousand years glacial conditions will return.
Javier, can you state in a few words what the actual physical link is supposed to be between obliquity and interglacials? Also, what is the (arbitrary) cutoff between events that count (interglacials) and those that don’t (interstadials)?
Working as a team, you see.
We’ll catch you in a pincer movement….. 😉
R
>>Oh yes they do take place at 41 kyr multiples and this
>>is very easy to demonstrate, as Euan Mearns did with
>>this figure (pink dots):
Another statistical analysis, to take you down another mathematical cul-de-sac.
Take a look at the real data in my table 1. The interglacial spacings from Epica3 data are (older to recent) 99, 90, 90, 115, 117 kyr. In what way are those interglacial spacings bases upon a 41 kyr obliquity cycle?
The full paper:
http://www.sciencedirect.com/science/article/pii/S1674987116300305
R
Michael Palmer, I can actually do it with one figure.
Eccentricity has a very small forcing due to the Earth’s orbit having very low eccentricity, so it acts mostly through changes in precession and obliquity. Precession does not produce annual changes in insolation. Whatever insolation is added to a season, it is taken back from other seasons in the same year. The only orbital change that produces significant annual changes in insolation that accumulate their effect over thousands of years is obliquity.
http://s3-eu-west-1.amazonaws.com/rankia/images/valoraciones/0022/5428/Figure_6.png?1454518807
Figure 6. Annual insolation changes at high latitudes and the symmetry problem. Changes in annual insolation by latitude and time are shown in a colored scale. They are essentially due to changes in obliquity (blue sinusoidal curve), since changes in insolation by precession are averaged between seasons within the same year. The high latitude persistent changes in insolation last for thousands of years and correspond quite well to changes of temperature in Antarctica, shown as a blue line overlay. Glacial-interglacial cycles show symmetric temperature responses in both hemispheres. As we can see Antarctica temperatures respond with warming despite 65°N summer insolation increases corresponding to 65°S summer insolation decreases. Source: Steve Carson. The science of Doom.
The evidence is so clear that I am surprised that so many people still believe that interglacials take place every 100 kyr because of 65°N summer insolation changes due to precession changes. I guess is like global warming due to CO2. People believe it despite mounting evidence on the contrary out of habit and textbooks.
The figure:
http://s3-eu-west-1.amazonaws.com/rankia/images/valoraciones/0022/5428/Figure_6.png
This figure only reinforces that, whichever way you slice it, none of the astronomical cycles closely tracks temperatures, indicating that something important must be missing.
Obliquity seems to induce major insolation changes only very close to the poles. The big ice sheets were considerably further away from the poles. I’m not buying this.
Ralph,
In every single possible way.
http://i1039.photobucket.com/albums/a475/Knownuthing/Milankovitch_Variations2_zpsoz9tlrxg.png
Glacial terminations (interglacial triggering) take place only, with one exception, within the window of opportunity defined by rising obliquity (blue and pink bars in figure). The exception is 7a, when it delayed so much that when it finally triggered it was just a spike.
Interglacial (IG) is favored by high insolation (orange curve above red dashed line) in the second half of the window of opportunity. The second factor is very low temperatures (black curve below purple dashed line) in the first half of the window of opportunity, a factor defined by D. Paillard (1998) probably related to ice melting dynamics as a strong positive feedback. Both factors are marked with red (or green) circles. Glacial conditions are favored by minimum temperatures above the purple dashed line (blue circles). Obliquity cycles with only promoting conditions always produce IGs (red numbers). Cycles with both red and blue circles produce IG only if insolation is very high (green numbers). Cycles with only inhibiting conditions never produce IGs (blue numbers). MIS 13 is the exception, a strange coldest IG with a spike. The two repeats (MIS 7 & 15) show the strongest insolation in the second one (green circles). There are 13 IGs in 1 million years (77 Kyr average). The fake 100 K periodicity is highly favored by the presence of the two repeats (MIS 7 & 15).
This model can predict based only on obliquity, summer 65°N insolation, and time-driven decay in temperature when an interglacial is going to take place for as long as Late Pleistocene conditions are maintained. Eccentricity is not required, and precession is usually a second order factor.
Whatever. There is freedom of faith. But the figure clearly shows that planetary temperatures go down during yellow periods (low obliquity), and go up during blue periods (high obliquity). therefore planetary temperatures respond to obliquity. Whether you believe this or not is not an issue. The evidence is there for everybody to see.
There is a mistake two posts of mine above. When it says 7a it should say 7b.
>>Javier
>>Whatever insolation is added to a season, it is taken
>>back from other seasons in the same year.
You are falling into the same trap as Hansen, Huybers and all the others. You cannot spread the Great Year insolation losses and gains out across the globe and across the year (or across the Great Year). I ask you – what melts the winter snow in Canada? Is it:
a. The summer insolation in Canada?
b. The ambient temperature in Argentina?
The same happens with the Great Year, as with the annual year. The NH Great Summer melts the northern ice sheets, because it greatly enhances the annual summer in the northern hemisphere for a full 5,000 years. This is what melts the ice sheets, and not the average insolation or average temperature spread across the globe. Thus all Hansen’s fancy graphs and models about ice albedo are completely wrong.
.
>>Javier
>>Glacial terminations (interglacial triggering) take place only
>>, with one exception, within the window of opportunity defined
>>by rising obliquity (blue and pink bars in figure).
But you are using Huybers chronology again, aren’t you? As I said before, Huyber’s ice age chronology is pure guesswork from start to finish. He only has two chronological pegs – the last interglacial and the Brunhes–Matuyama reversal. Everything in between is guesswork and does not conform to any other ice age chronology.
Ralph
Nope I am using Lisiecki and Raymo 2005 chronology. Go fight them if you dare.
The thing about the ice ages is that, even with the Milankovitch changes in solar strength, the Sun is ALWAYS strong enough to melt the winter snow at 65N (and that goes for every latitude from 70N and south). Even in the deepest downturns, the winter snow at 70N and south should disappear and no glaciers should emerge.
It is the ice build-up at 75N that is the key. When the glaciers build up on northern Greenland and Ellesmere Island and the sea ice does not melt out in the summer at 75N, that is when the ice age starts.
The extra high albedo sea ice and glacier at 75N reflects just enough sunlight so that the glaciers move to 74N and then to 73N and so on. It takes a long time for the glaciers to continue moving south and building up ever higher and reflecting just the little extra sunlight before a full-fledged ice age can start up. A long time.
The ice age only ends when the glaciers melt back really fast from 50N to 55N to 60N etc. so that they escape the next downturn in the Milankovitch. Maybe it takes two or three tries to overcome the Milankovitch downturns before it works. Maybe the dust builds up at the edges of the glaciers to melt them off rapidly. (But dust on a glacier or on ice acts more like an insolation layer keeping the cold in rather than a solar energy gatherer and ice-melter – I don’t think it actually works that way in reality – dust and sand on ice slows down the melt versus accelerates it.)
The basic issue is that it takes time to break the back of the glaciers and have enough volume disappear so that solar energy can melt the ice back to 76N and the ice age is over..
If North America and Greenland were about 3 degrees farther south, there would have been no ice ages. That is how tight the conditions need to be.
Bill Illis
Although growing ice albedo is a major factor in cooling, more must be involved.
When 65N latitude receives much less insolation, 65S latitude receives more, and the whole Earth TOA insolation remains about constant. In spite of higher SH insolation, the SH experienced glaciation about in phase with the NH. To enable the far NH to chill, transfer of that SH heat into the north must be curtailed. And this must occur before sea level drops so low that entry of Atlantic water into the north polar regions is impeded. Something like early changes in the AMO or changes in cloud cover may be required. (I believe that Willis has suggested greater clouds in the tropics during warming.) Also, my calculations indicate that NH ice albedo alone is not sufficient to chill the whole globe. Other factors need to reject some of that solar heat.
The problem of the symmetry of glacial terminations and glacial inceptions while precession is anti-symmetric underscores the importance of obliquity, that is also symmetric. In glacial inceptions the reduction in obliquity reduces insolation at both poles.
Cooler and drier conditions as well as less CO2 all result in less and changing vegetation. Mostly resulting in a higher albedo. Could this be the missing factor?
Bill.
The thing about the ice ages is that, even with the Milankovitch changes in solar strength, the Sun is ALWAYS strong enough to melt the winter snow at 65N (and that goes for every latitude from 70N and south). Even in the deepest downturns, the winter snow at 70N and south should disappear and no glaciers should emerge.
_______________________________________
Not true.
a. Because we know that ice sheets formed and grew down to about 40ºN, even through strong Great Summers (Milankovitch maximums). That is way south of your 70ºN.
b. Because we know that fresh snow can reflect 90% of the incident insolation, negating the effect of a Great Summer at almost any latitude. Which is why ice sheets can grow so far south. Albedo is the key here.
c. Because at the north pole, the insolation during a Great Summer is actually higher than for 65ºN. I presume because the Sun is higher in the sky for longer, and does not dip to the horizon at midnight. The upper plot in fig 14 in the paper is for the north pole (90ºN), and demonstrates the strength of the insolation at this high latitude.
Laskar 2004 – Milankovitch insolation data.
http://vo.imcce.fr/insola/earth/online/earth/online/index.php
Ralph
I guess you don’t know that it is not the Sun but the temperatures that melt the ice. You can have all the Sun in the world that if temperatures are below freezing there is no melting. Albedo only contributes as a factor that affects the temperatures, but usually it is not even the main factor as often surface albedo is just a small component of total albedo, as atmospheric albedo is huge.
Ice sheets spread so far South because they accumulate so much cold during the winter that they create their own cold climate during the summer. They even alter the atmosphere, bringing the stratosphere closer to the ground.
I guess you don’t know that it is not the Sun but the temperatures that melt the ice. You can have all the Sun in the world that if temperatures are below freezing there is no melting.
_______________________________
I guess you have never trekked across a glacier. And sun-bathed in -5ºc ambient temperatures.
Try this experiment. Go out on a hot summer’s day, and feel the body of a white car. Now go and feel a black car. (Be careful not to burn your hand….!) So what warmed the black car, the ambient temperature or solar insolation absorption? Ditto for the Laurentide ice sheet – one vast black sedan spread across North America.
R
Yet it won’t melt if temperatures are below freezing. That’s why Central Greenland never melts no matter how much insolation gets and how dirty is the snow there.
In the end is air temperature who does the melting, and ice albedo is only a factor in air temperature.
Yet it won’t melt if temperatures are below freezing. That’s why Central Greenland never melts no matter how much insolation gets and how dirty is the snow there.
__________________________________
More a factor of high albedo reflecting insolation and a vast heat-sink under the surface, which is reinforced and perpetuated by the long arctic winter. You will not melt something with a higher air temperature, when it is effectively sitting on a huge freezer with an infinite capability to absorb heat.
Did you try the car experiment? If ambient air temperature is the key to warming a body, why is the car much warmer than the ambient air?
R
If instead of a hot summer day is a cold winter day, and the black car has the windows open so the interior doesn’t accumulate heat like a greenhouse, then the car surface might be slightly less cold than other surfaces, but it won’t make much difference.
Even in areas of polar regions or Greenland, when air temperatures go above 0°C, pools of melted ice can appear. I guess they are melted by air temperatures and not by the Sun, that can obviously contribute, but doesn`t produce them when temperatures are significantly lower.
>>If instead of a hot summer day is a cold winter
>>day, and the black car has the windows open
Eh? We are talking about insolation effects here – ie: the effect of the Sun on the bodywork of a (metal) car. Touch the body of a white car and then try a black car. Please tell us what you experience. And what does that tell you about the effects of insolation vs ambient temperature?
R
Bill, great comments. Regarding dust/dirt acting as insulation:
1) I have seen this. Up here in Northern Canada, throughout the winter, snow removed from the streets is piled up in huge piles. In the summer, the snow melts, but the dirt (the sand/gravel put on the roads to help improve traction on ice) builds up (meters thick). Eventually, there is so much dirt that the snow at the bottom won’t melt quick enough, and it will last till the next winter. So the city has bulldozers pushing the dirt around to avoid this.
2) However, the dust proposed in this study I don’t think is nearly as thick. Also, even if it was, the loss of albedo would warm up the entire earth system, not just directly melting the ice.
First, Ralph, well done.
Second, sadly, I went to read your paper and the !@#$%^ site wouldn’t let me register …so perhaps you can give me a link, what is the source of the dust data in your graph?
w.
here’s a preprint version
Thanks, Michael.
w.
Bory (2014) was one of the quoted sources. Quick read.
http://pastglobalchanges.org/download/docs/magazine/2014-2/PAGESmagazine_2014(2)_72-73_Bory.pdf
(10,000km dust highway between the Taklamakan desert and Greenland)
>>Willis
>>…so perhaps you can give me a link, what is the source of the dust data in your graph?
Strange. The Science Direct link should not need registration, because they kindly made it open access for me. No paywalls.
http://www.sciencedirect.com/science/article/pii/S1674987116300305
As to the dust data, the Antarctic data was from Epica3, while the Greenland data was from NGRIP.
NGRIP, by Ruth et al.
https://doi.pangaea.de/10.1594/PANGAEA.587836
Epica3, by Lambert et al.
http://www.nature.com/nature/journal/v452/n7187/abs/nature06763.html
(Sorry about the paywall, but Michael may be able to help with the dataset.)
I predict you will find something interesting there…. 😉
Cheers,
Ralph
Thanks greatly, Ralph. I was able to figure out the problem and I got the paper. Now I just need to get the dust data … and analyze it … and finish mowing my back acreage …
My father-in-law was a jazz drummer all his life. He used to complain about the lack of hours in a day by saying:
Some days I feel like that.
Ralph, thanks again for a fascinating paper.
w.
Na. It’s that every interglacial another civilization arises, discovers “CO2 warming”, saves the planet, and sends it into another glaciation.
A Douglas Adams like approach. 😉
If I am reading this correctly, our (arguably) abnormally high CO2 levels may actually make the next glacial maximum last even longer than it naturally would, since it would take longer for those CO2 levels to decline to 190ppm, postponing the start of those dust storms that often precede an interglacial.
Correct.
If I am reading this correctly, our (arguably) abnormally high CO2 levels may actually make the next glacial maximum last even longer than it naturally would, since it would take longer for those CO2 levels to decline to 190ppm.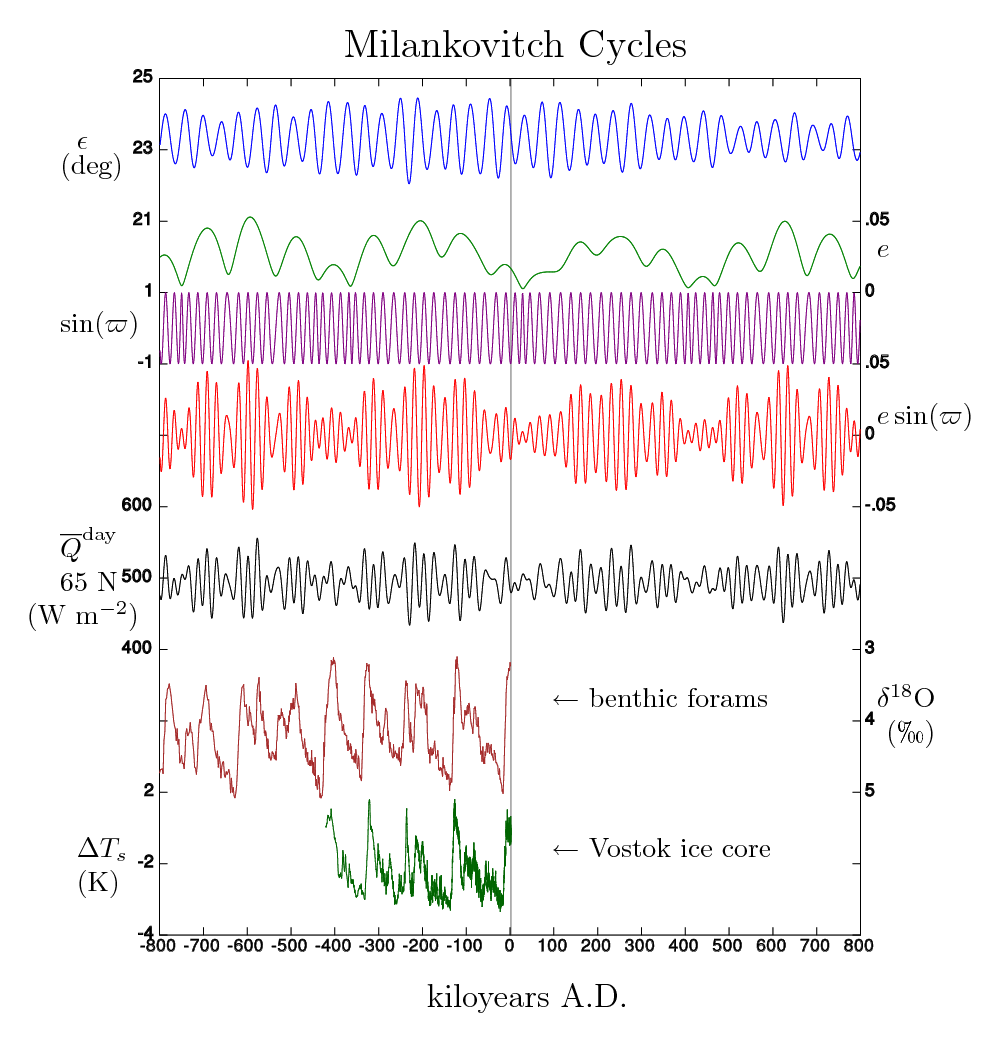
________________________________
Indeed it would. In fact, it may delay the next interglacial for so long, the system may skip an entire eccentricity cycle, and we would have to wait 200,000 years for the next interglacial.
However, some caveats.
a.
We now have the knowledge of how to avoid glaciation – just spray the ice sheets with soot, and presto, no ice sheets. This is why NE Siberia never had an ice sheet during all the post MPT ice ages. Think about this for a moment – why did the coldest region in the NH NOT have a glacial ice sheet?
Answer: Because it was continually covered in very thick aeolian dust from the Gobi, so the albedo was lowered and the ice melted. Ice sheets could only grow further east, where there was less aeolian dust from the Gobi.
b.
We happen to be in a very stable epoch, because of low eccentricity, and so there is no strong Great Winter on the horizon to force us into a glacial era. The next moderate Great Winter is in 70 kyr time, while the next deep Great Winter is not for 180 kyrs. The moderate Great Winter ice age can be certainly be prevented by spreading soot on the ice sheets, which gives us 180 kyr to assess if we can do the same during a deep Great Winter.
See the black plot, five down, in this Wiki plot. This is Milankovitch insolation at 65ºN, with the peaks representing NH Great Summers and the troughs NH Great Winters.
Note that ice ages are only modulated by NH Great Summers and Winters, and not by the opposite in the SH. This is because the great continents are all in the north. So land masses and ice sheets are more influential in ice age modulation than open seas – which gives the clue that albedo is the controlling feedback, and not CO2.
Damn that means they got one thing right higher CO2 might mean colder winters. well even a broken clock is right twice a day.
While all this sounds like a reasonable hypothesis, I find it hard to believe that cloud density doesn’t also play an important roll in long term climate change.
Precipitation was much the same in the tropics during the LGM, so there was little change in cloud cover.
R
Ok, Houston, we have a problem.
Ralph, you give the following figures in your paper:
So I decided to use the CERES data to look at where we are today. As you might imagine, current insolation is between the max and the min. All data are for 65°North, land only unless noted otherwise.
HOWEVER … the problem is in the ice sheet insolation.
As you can see, up at 65°N there’s less sunlight making it to the ground than you claim … a whole lot less. You are using a 20% loss to the absorption and reflection of the clouds and atmosphere, where in fact the atmospheric loss is just over 50%. This is a very large difference between reality and your assumptions.
Next, you assume that the surface albedo up north is 90% when it is ice covered. I have no idea where you got that idea, but it is also in error. Again according to the CERES satellite data, the maximum monthly wintertime land albedo at 65°N is 59%, and including the sea as well gives a max winter albedo of 52%. This is in line with the data in my bible, “The Climate Near The Ground” by Geiger, viz:
(Note that at 65°N, the ocean is only 25% of the surface area)
It’s not clear to me what will be the effect of using these observed values for 65°N (cloud/atmospheric loss 50%, peak albedo 59%) in place of your current estimates. However, it is clear that the numbers will be quite different
My best regards to you, and thanks again for a most interesting piece of analysis.
w.
How do the numbers work out for the southern terminus of the Laurentide ice sheet? After all we are talking more than just Greenland right?
Try Chicago at around 42 degrees N latitude.
Willis.
As you can see, up at 65°N there’s less sunlight making it to the ground than you claim … a whole lot less. You are using a 20% loss to the absorption and reflection of the clouds and atmosphere, where in fact the atmospheric loss is just over 50%. This is a very large difference between reality and your assumptions.
___________________________________
I am not entirely sure what Ceres is supposed to be calculating, and over what period. Is this a summer average insolation, or a midsummer maximum? I was using the latter in the paper, just as an illustration of the maximum differences that can be caused by dust-ice albedo. This was not meant to be a comprehensive annual model.
The standard Energy Budget diagrams, including the IPCCs version estimates about 20% reflected by cloud and aerosols. There is also the absorption of SW by the atmosphere, but the cold arid conditions on the arctic ice sheets would have had less cloud and aerosols than the tropics (dust storms notwithstanding). When Kuhle measured surface insolation in the Himalaya, at high altitudes between 3,800 and 6,000m, he found that there was almost no aerosol albedo at all, and so surface insolation was the same as TOA insolation. (Kuhle 1988. Pleistocene Glaciation of Tibet.)
And when surface measurements were made at 76ºN in Greenland, surface shortwave peaked at 380 – 400 w/m2 during the summer. Measurements that are in close agreement with my estimations. See fig 10 in the following paper. I have no idea why the Ceres figure is different, but I always thought the Ceres figure to be too low when you used it in previous articles. (Van As. Warming, glacier melt and surface energy budget from northwest Greenland.)
http://www.igsoc.org:8080/journal/57/202/j10j045.pdf
Albedo:
It has also been claimed (not just by yourself) that my albedo for snow and ice is too optimistic, because I have assumed fresh snow (snow albedo reduces with age). But Wiscobme and Warren (1980) recorded 0.90 to 0.98 albedo, depending on grain size and wavelength. Kuhle found 0.85 to 0.9 in the Himalaya. Grenfell and Warren (1994) found 0.97. Warren (2009) found 0.97. Svensson found 0.83. And Oerlemans found 0.85 to 0.90 on fresh snow. (See my fig 5a and 5b for some examples.) These figures will reduce with the age of the snow.
But the spring melt season always begins with fresh snow. So the all important spring melt, will begin (or not begin) depending upon the albedo of fresh snow. The albedo of the snow will reduce with age, but that depends upon temperature, because most of this albedo change is due to increasing grain size. Albedo will also change with dust contamination over the summer months, but that is the whole point of this paper. More dust equals less albedo, and a greater chance of spring and summer melt.
But this does not happen much on the Greenland dome, as it is too high and too cold for much in the way of snow aging or annual melt. Which is why an almost complete record for the last ice age can be found there. (But some cores are missing chunks of Holocene data.)
If someone wants to put together a model and start tweaking, more accurate predictions may be made. But that was not the purpose of the paper. This was merely a thought exercise to establish the principle, in the great tradition of Greek Rhetoric. And if it is deemed worthy, I am sure someone will take the concept much further in both depth and breadth.
Cheers,
Ralph
ralfellis June 29, 2016 at 7:35 am
I am using the CERES values for the midsummer maximum monthly insolation.
In the K/T energy budget, the cloud and aerosol reflections are given as about 70 W/m2 out of about 340 W/m2, which is indeed about 20%.
Mmm … not so sure about that. To start with the northern sunlight needs to go through a lot more atmosphere than the tropical sunlight. Let me run the numbers … OK, average global SW absorption is given by CERES as 73 W/m2, in good agreement with the K/T value. However, the absorption at 65°N is not much smaller, at just under 50 W/m2.
Surface insolation the same as TOA insolation? I wouldn’t believe that in a hundred years. Minimum absorption per CERES is about 21 W/m2, over the Antarctic Plateau. And minimum cloud albedo is about 10 W/m2, Again over the Antarctic Plateau.
In addition, we’re not talking about high altitude ice. Much of 65°N is low-lying tundra. Hang on … OK, the average elevation is 467 metres, far from the high elevations you reference.
That figure shows values of hourly peak insolation, which would rarely be the right data to use for an analysis such as yours. For your purposes you need 24/7 averages, not hourly maxima. And yes, hourly peaks will assuredly be much larger than the monthly 24/7 averages of CERES.
I have checked the CERES dataset against a variety of other datasets and rarely found it to be significantly different. I suspect that the difference is that you are looking at hourly peak values at one high elevation site at 75°N, where CERES is looking at the 24/7 average land values at the average of mostly low-elevation gridcells at 65°N. (The elevation is important in part because there’s less atmosphere to get through.)
I would agree with your values for fresh snow. However, we’re not looking at fresh snow.
Actually, by the time the melt season starts we are NOT looking at anything like a smooth blanket of fresh snow. We’re looking at dirty snow which has been collecting dust all spring and is partially melted. Note from the Geiger figures I gave above that even partial melting of snow drives the albedo way down, well below the 90% you used, without even considering the dust factor.
There is a study of the albedo of Himalayan glaciers that is of interest here. See Figs. 7 and 8. The average albedo of the glaciers over the year ranges from a low of about 40% to a high of about 80%. The albedo peaks early in the snow season when the snow is fresh, and not somewhat dirty and partially melted as it is by the end of the winter. In any case the year-round average is about 60% … far from the 90% figure you’ve used.
How did we get to the Greenland dome? I thought we were discussing the values for 65°N, the overwhelming majority of which are NOT high altitude results from Greenland.
Mmmm … the values you’ve used are way different from the measurements, so if you think the measurements actually support your hypothesis you need to redo your figures. Let me be clear that I’m not saying your hypothesis is wrong, or that using the measurements will show it is wrong. I find it quite fascinating, but it needs actual observational support, not imaginary figures.
In any case, all good stuff, my friend. My best to you,
w.
>>Minimum absorption per CERES is about 21 W/m2, over
>>the Antarctic Plateau. And minimum cloud albedo is about
>>10 W/m2, Again over the Antarctic Plateau.
I think that is what Kuhl means by minimal. He was measuring Himalayan insolation of 1,050 wm2, so a reduction of 10 wm2 is not significant. And if you look at Kuhl’s data, the insolation rises to a plateau for many hours around mid-day, before reducing in the evening.
.
>>In addition, we’re not talking about high altitude ice.
>>Much of 65°N is low-lying tundra.
>>I thought we were discussing the values for 65°N, the
>>overwhelming majority of which are NOT high altitude.
During the ice age 65ºN had a 2,000 or 3,000 m ice pack sitting on it. So the comparison with modern Greenland is valid.
And there is a good reason for using peak midday insolation, rather than a diurnal average. It has been shown that contaminants settle down within the snow layers, and are not visible at low Sun angles. So a low angle Sun cannot melt the ice, because the ice retains a high albedo. Minimum albedo and peak insolation only occur around mid-day, when the contaminants are exposed to the insolation, and so that is when the measurements should be taken. And the graphs by Van As and others indicate that the mid-day insolation in Greenland is around 380 wm2, much as I said.
.
>>There is a study of the albedo of Himalayan glaciers that
>>is of interest here. See Figs. 7 and 8. The average albedo
>>of the glaciers over the year ranges from a low of about 40%
>>to a high of about 80%.
If the northern ice sheets had had an albedo of 0.40, there would never have been an ice age. This needs more study, but the consensus appears to be albedos of 0.8 to 0.9 for a normal ice pack. There may be some factors that are reducing this. The modern era is quite dusty, with industrial output, which is demonstrably reducing ice albedo. And the Himalayan ice sheets are very dusty anyway, because the Himalaya are composed of crushed rocks, instead of consolidated strata.
The image below is myself standing standing on the very center of the Baltoro glacier in the Himalaya, near Concordia up at about 6,000m. Yes, that is a glacier I am standing on – one of the largest in the Himalaya, with an albedo of about 0.2 !!
P.S. You should get your Thunderstorm Thermostat paper published too, as it is a complimentary theory.
Cheers,
Ralph
Going a bit OT …
Evil scientists unsettle settled science.
http://press.cern/press-releases/2013/10/cerns-cloud-experiment-shines-new-light-climate-change
http://www.nature.com/news/cloud-seeding-surprise-could-improve-climate-predictions-1.19971
I expect this will very soon be a lead story on WUWT. And I’ve given you the headline
The end of glacial episodes seems to occur very quickly. I would characterize it as appearing to have momentum. As an inhabitant of a wintry land, I have observed snow and ice that melts slowly and lasts into summer. A common characteristic of this ice and snow is its ” dirtiness”. It seems that as deep stands of ice/ snow melt, much of the dirt seems to stay on top, such that the surface gets darker. I have always thought that this was a result mainly of sublimation from sunlight and evaporation from wind. Regardless, I believe this may be a powerful accelerant to melting
The question now, beyond the obvious nonsense of CO2 panic, is what can we do to ensure we don’t start the slide to another 20,000 year cold snap. It’s starting to look due!
I think so far we’ve been saved by the positive AMO and PDO. But what will happen when they are concurrently negative as in the late seventies might prove interesting when coupled with the rise in atmospheric water vapor lately. Are noctilucent clouds a harbinger of fresh snow year-round to come?
>>The question now, beyond the obvious nonsense of CO2
>>panic, is what can we do to ensure we don’t start the slide
>>to another 20,000 year cold snap.
See my post above.
The next ice age is not really due for another 70 kyrs, due to low orbital eccentricity. And if this theory is correct, we can easily dodge this by spraying the growing polar ice sheets with soot.
R
So under this theory it’s the lack of CO2 which causes cancer temperature to rise? Not because of its effects in the atmosphere, but because of starving plant life? This isn’t even remotely close to what we have been told concerning CO2 being a driving force in global temperature change. According to this ,CO2 levels are driven by temperature changes not the case other way around.
So under this theory it’s the lack of CO2 which causes cancer temperature to rise? Not because of its effects in the atmosphere, but because of starving plant life? This isn’t even remotely close to what we have been told concerning CO2 being a driving force in global temperature change.
_________________________________
Indeed. But then I get Royal Society reviewers telling me: “Oh, but we have known about all of this for decades. So the paper is not novel, and should be rejected….”
Seriously, that is what they said.
R
It would be funny if CO2 turned out to have a dangerous cooling effect through plant fertilization.
What? An ice age cometh? I thought the sun had no effect on climate, it’ll all due to CO2!!
http://www.news.com.au/technology/science/space/the-sun-has-gone-blank-twice-this-month-this-is-what-it-means/news-story/d775ecf894ab68415ed0108ced31a4e2
Rubbish.
They may have known about the cycle, and may have called it the Great Year, but they knew about warm and cool over a 23,000 year period? Nonsense.
https://wattsupwiththat.files.wordpress.com/2012/10/cp-8-1473-2012.pdf
Ellis’s theory will be laughed into obscurity. Not a single point helps progressives to achieve the Great Socialist Convergence that the current vapid meme of climate change is able to do.
True.
I think the angle for the warmists to play is that co2 could keep us in an ice age longer. Of course they’d have to abandon the current thermageddon meme.
Here in Finland and the Nordics they quarry rock and crush it for grit.
You can see the effects of winter gritting in the summer, the dust is immense. I mean literally, 3 to 4 days and the apartment is covered in Dust, no doubt Russia Iceland Finland Denmark Norway Sweden ect do this every winter and the dust from the total gritting must be huge amounts.
I have just been home to Ireland, and the dust just does not compare to what we see here in Helsinki. That’s just gritting in the Nordics and Scandinavia and Eurasia, never mind all the other sources
Excerpted from above article:
Well now, I will have to say, the above is the best explanation I have ever read that sensibly explains the “rapid melting” of glacial ice that is portrayed by this Post Glacial Sea Level Rise proxy graph, to wit:
Now, all I need is confirmation that circa 20,000+- years ago was the start of a Great Summer,
>>Now, all I need is confirmation that circa 20,000+-
>>years ago was the start of a Great Summer.
Take a look at fig 3 in the paper, and you will see that it does indeed coincide with a Great Summer in the northern hemisphere.
The full paper is linked at the top of this article, and is also linked here:
http://www.sciencedirect.com/science/article/pii/S1674987116300305
Ralph
Thanks Ralph, ……. I somehow overlooked the 1st graph presented in the above commentary.
After I looked at fig 3 in the paper as you suggested …. I went back to the start of the commentary and there it was.
Now I know the actual, scientific reason that the 1 mile+- thick glacial ice resting atop what is now NYC, Connecticut and Long Island melted down and flowed into the ocean.
Ralph Ellis
I like your theory but there are problems:
1) Looking at the last chart, 130 kya there’s a big drop in ice but no large dust storms. 275 kya there’s big dust storms but no decrease in ice. 700 kya drop in ice but big dust storms came almost 50 ky earlier
2) Plants don’t die at 190 ppm CO2. Alpine plants thrive at 14,000 ft elevation equivalent to 180 ppm CO2 due to low air density
3) Deserts are dry land and dust comes from dry land because the soil particles are not held by water. Assuming all plants die. Without decrease in rainfall, the land will not be arid. It will even increase soil moisture because of loss of plant transpiration
Quote:
1) Looking at the last chart, 130 kya there’s a big drop in ice but no large dust storms. 275 kya there’s big dust storms but no decrease in ice.
130 kya, the dust storms (purple) occurred immediately before the melt. As soon as the melt and warming starts, CO2 is released, plants recover, and so the dust immediately stops. Continued warming occurs because there is 10,000 years of dust layers already in the ice sheets.
275 kya there was no strong Great Summer, to give increased insolation. You need both dust and insolation together. And when the Great Summer did come along, 250 kya, the ice melted and an interglacial was created. (The dust was still in the top 20,000 years of ice layers. And there was another dust peak, just before the interglacial.)
.
Quote:
2) Plants don’t die at 190 ppm CO2. Alpine plants thrive at 14,000 ft elevation equivalent to 180 ppm CO2 due to low air density.
Indeed. But when the surface has 190 ppm CO2, the partial pressure at 1500m altitude will be 160 ubar (an equivalent of 160 ppm). Now 160 ppm is very much a critical CO2 concentration for plants. See Table 4 in the paper.
Quote:
3) Deserts are dry land and dust comes from dry land because the soil particles are not held by water. Assuming all plants die. Without decrease in rainfall, the land will not be arid.
The Gobi is pretty arid anyway, whatever the CO2 concentration is doing. (Precipitation approx 110 to 130 mm a year.) So even if the Gobi did receive a bit of extra moisture during the LGM, as the evidence suggests, it is still an arid location. So once it is stripped of its C3 grasses, due to low CO2 levels, there will be nothing to stop the land becoming a dust desert. And we know this happened, because the Loess Plateau in China records layer after layer of the dust stripped from the Taklamakan and Gobi, during each and every major ice age post the MPT. There is a complete dust record of the region, which equates with the glacial cycle.
The full paper is here:
http://www.sciencedirect.com/science/article/pii/S1674987116300305
Ralph
More problems Ralph:
3) Peaks of dust storm are always thousands of years ahead of glacial meltdowns. If dust storm is just 100 years ahead, dust will be buried under ice and no effect on surface albedo. Also maximum insolations do not always coincide with start of meltdown. Maximum insolation was delayed in 700 kya, 420 kya and 130 kya
4) Air pressure at 1500 m elevation is 840 millibars. You cannot get 160 microbars. That’s three orders of magnitude lower. 570 mbar is more like it
5) Gobi desert is already arid. Not much plants there to kill due to low CO2. Your proposed mechanism works in lush rain forests
6) Die out of plants due to low CO2 leads to mass extinction of land animals. Herbivorous animals die and carnivorous animals eat the herbivorous ones. They all die. There should be mass extinctions every glaciation. But we are still here as well as the cows, sheep, goats, horses, deer and grasshoppers
“due to low CO2 levels, there will be nothing to stop the land becoming a dust desert.”
Gobi desert is a “dust desert” even at 400 ppm CO2. It is today one of the world’s most abundant sources of dust. Dust storms in the Gobi are not limited to glacial periods.
“due to low CO2 levels, there will be nothing to stop the land becoming a dust desert.”
Gobi desert is a “dust desert” even at 400 ppm CO2. It is today one of the world’s most abundant sources of dust. Dust storms in the Gobi are not limited to glacial periods.
On the contrary, I believe Gobi has less dust storms in the glacial periods than interglacials. This is because Gobi has more permafrost in glacial periods preventing the soil from being blown by the wind.
“Relict permafrost structures are present in the Gobi of southern Mongolia… These data show that there was a phase of permafrost development during the latter part of the Last Glacial”
http://onlinelibrary.wiley.com/doi/10.1002/(SICI)1099-1417(1998110)13:6%3C539::AID-JQS390%3E3.0.CO;2-N/abstract
The Appalachian rainforest is higher than Gobi desert. It should have lower CO2 during the glacial period and worse mass extinction. Yet it had high biodiversity of plants and animals.
“In the Last Ice Age, ice did not cover the south Appalachian Mountains. Uncovered area was a refuge for animals and plants which lived in northern area. After the ice receded, some species spread back to north, while some of them stayed in this area. This is one of the reasons why there is a high biodiversity in the temperate rainforest”
https://en.wikipedia.org/wiki/Appalachian_temperate_rainforest
3) Peaks of dust storm are always thousands of years ahead of glacial meltdowns. If dust storm is just 100 years ahead, dust will be buried under ice and no effect on surface albedo.
___________________________
You have not read the paper, have you?
The buried dust becomes a latent feedback agent. It comes to the surface during melting, and enhances the albedo reductions, creating more and more warming and melting.
Please read the paper, before coming up with more objections.
R
An exercise of common sense is helpful here. Let’s say the dust is buried under one meter of ice. You say if you melt one meter of ice, the dust will be exposed and decrease surface albedo. But that’s exactly the problem your theory is supposed to solve – how to break the cycle of increasing ice thickness during glacial periods. Your theory says it’s dust that breaks the cycle. But now you say the cycle must be broken first before dust will have an effect on surface albedo
So sayith: Dr. Strangelove – June 30, 2016 at 4:09 am
HA, it might have been helpful if it had actually been …. “an exercise in common sense thinking”, ….. but it wasn’t, …. nor was it an exercise in logical reasoning or intelligent deductions.
And to insult your injury, ….. your above stated … “Let’s say” verbiage is nothing more than weazelworded “piffle n’ tripe” simply because you defined a situation therein that was directly contrary to what the above published commentary stipulated was a specific requirement, to wit, read it and weep for lack of common sense thinking:
“DUH”, it could very well take 10,000 years for your “Lets say …. one meter of glacial ice” to be deposited ……. but in your brilliant reasoning you placed those denoted “10,000 years of intense dust storms” DEPOSITS underneath that ice.
Samuel you don’t understand the problem. If all that’s needed to melt the ice sheet is continuous deposition of dust, then you cannot predict the interglacials because dust storms happen all the time throughout the glacial periods. For the theory to be useful, the peak dust storm must coincide with the start of glacial meltdown. Or else it does not explain why the meltdown did not happen earlier when you have multiple peaks of insolation before the actual meltdown.
So sayith: Dr. Strangelove – June 30, 2016 at 6:13 pm
GEEEZUS, your common sense reasoning has failed you again when you “put the cart before the horse” ….. in that silly arsed attempt to prove that ralfellis’s commentary is in error.
Or maybe it’s a “reading comprehension” problem that is afflicting your reasoning?
“DUH”, there is no start of a glacial meltdown until after, ….NOT BEFORE, ….. there has been thousands of years of peak dust storms that conjoined with a strong Great Summer.
And “DUH, DUH”, iffen a glacial meltdown had already started….. just how in ell could those peak dust storm start a 2nd glacier meltdown while the 1st meltdown is/was in progress?
Nice narrative but chart does not support it. There are multiple “great summers” and the “greatest summer” does not always coincide with the start of glacial meltdown, sometimes it’s thousands of years delayed. So these are all good narratives but chance alone could explain the coincidences that are not consistent anyway
97% of the female population will never admit they were wrong about anything.
Doc — thanks for your critical comments.
First, to the CO2. Having spent some time poring over the literature myself, I can report that opinion is divided about the relative contributions of aridity and of CO2 to the decline of vegetation cover in the last glacial maximum; and I feel unsure about it myself. However, it is accepted that low CO2 and aridity potentiate each other’s effect on vegetation. Levels of CO2 dropping below some critical threshold for sustaining plant life would seem to explain the very steep (roughly exponential) increase of dust with declining temperatures.
Secondly, the delayed effect of dust on ice albedo. Yes, there may well be a layer of untainted snow/ice on top of the dirty stuff, and this would have to be melted off first. Consider that during each glacial stage the ice sheets underwent multiple partial retreats and then advanced again. Those partial retreats (interstadials) were not typically preceded by major dusty periods, so the ice melt must have been driven by increased insolation alone. However, during interstadials, melting was slower and did not reach completion, and the ice quickly recovered when the insolation maximum subsided.
What Ralph is saying is that, once exposed, the accumulated dirty ice melts faster and may melt completely during a single insolation maximum. Is it true? I don’t know, but it is a plausible hypothesis.
So climate control boils down to albedo control. Earth does it with dust during a great summer. But that warmup destroys the dust producing mechanism (which is too little CO2 to allow the plants to grow) and so the earth descends into another glaciation which lowers CO2 again which causes dust and so the whole cycle repeats.
This is great. All we have to do to control climate is control the albedo of the earth. How about an array of space parasols that can be raised and lowered as the great summers and great winters occur keeping the earth climate relatively stable? We can probably even choose how much glaciation we would like. We could thaw out Antarctic and provide us with another usable continent (if the Greenies won’t object to us destroying all that penguin habitat).
>>So climate control boils down to albedo control.
Which is why there has not been, and cannot be, a runaway warming event. Warming peaks when all the polar ice has melted, and albedo reaches a minimum.
However, there can be a runaway cooling event, where ice continues to grow. Had CO2 deserts not been formed at the glacial maximum, causing dust, the ice would continue to grow. because its albedo is too high for effective insolation absorption and melting.
And the easiest way to control temperature, and prevent another ice age, is to spray the ice sheets with soot.
R
Which China is kinda doing now, remotely…
>>Steve
>>Which China is kinda doing now, remotely…
Indeed they are. And this is one significant reason why the northern glaciers and ice sheets are in retreat. It has been demonstrated that their albedo has been lowered significantly, by industrial polution.
Ralph
Don’t forget the volcanoes.
There are no CO2 deserts when in a “Snowball Earth” condition but there were surely volcanoes that spewed enough dust to terminate those big freezes.
Samuel: Ralf clearly stated that this hypothesis only applies to glaciasions post Mid-Pleistocene Transition (MPT). Snowball Earth does not apply.
Jeff In C: But, but, but ….. dust particulate from volcanic eruptions are to this very day …… affecting the rate of glacier melting.
too funny…
clive best.. what a hoot.
You have gone all cryptic again Mosher.
R
Glacial advance grinding causes dust (creates loess soil which is basically very fine rock powder). Therefore dust should be at a maximum when ice sheet extent is also growing. “The formation of loess packets is correlated with the cold, dry climatic phases of the Pleistocene glaciations in regions marginal to the ice.”
http://hugefloods.com/Lake-Missoula-Rock-Flour.html
https://www.britannica.com/science/loess
Albedo should be hazy due to this airborn dust. The one thing that can wash this out is rain. To do that you need to employ the water cycle which brings evaporated ocean water to the air. To get evaporation of the kind that could do that on a large scale, and quickly, you need a large change in the oceans from wind blown piles of warmed water to the spread out layer (think oil slick-like) of risen to the top warm water that evaporates everywhere. We have a known mechanism for short term anomalies in ocean evaporation. We don’t have long term observations. But what if we did? Would our current wiggles show long term cycles? Tens of thousands of years long? Plausible.
Ergo: ENSO.
The author fails to take into account the entirely plausible long term recharge, discharge function of Earth. It is primarily a water planet, and the current set of land distribution interacting with ocean currents and the Coriolis effect on atmospheric/oceanic modes could explain the past 800,000 years if there is a tens of thousands of years cycle as well as lesser cycles. Given the total water volume of the planet, I believe this could be at least part of the cause of cycles examined by the post’s author.
I don’t fully understand what you are saying here.
It is certainly true that advancing ice produces dust. However, this “glaciogenic” dust is not the whole story. The rate of production of glaciogenic ice should correlate with the rate of ice sheet advance, not total ice sheet extent; but the dust storms are maximal when the ice sheet extent is.
As to the “tens of thousands of years cycle” of “atmospheric/oceanic modes”, are you referring to something widely known and accepted, or are you speculating? If the former, can you provide a name for that cycle, so that we know what we are talking about?
typo – “glaciogenic ice” -> glaciogenic dust
The extent of glacial “flour” produced depends on what the glacial advance is grinding up. Otherwise we would have a fairly uniform layer in front of ice extents. We don’t.
And yes, I am speculating. I speculate because short term oceanic/atmospheric recharge/discharge mechanisms are known in the literature (see link for an earlier article on this proposed ENSO mechanism, something Bob Tisdale has expounded on regularly and continues to be held as the primary hypothesis in the literature). I am simply using common scientific method deductive reasoning that the first encountered pathology is to be given superior consideration in terms of mechanisms for underlying disorders and needs to be ruled out before other causes are considered. I don’t think climate science has adequately ruled out ENSO as a mechanism for long term change seen in the 800,000 year reconstruction.
http://www.soest.hawaii.edu/met/Faculty/jff/1997_02a-%20Jin%20An%20equatorial%20ocean%20recharge%20paradigm%20for%20ENSO.%20Part%20I%20Conceptual%20Model.pdf
Addendum: Determining how much solar energy is absorbed and stored in the oceans over short, long and millennial long terms is an incredibly complex mathematical problem that can only be definitively solved by assigning parameter boundaries. The ocean does no such thing. So the boundaried answer is not very informative.
We might possibly be able to pseudo-calculate total stored energy versus evaporated energy over the past 30 years but only with a very complex model using greatly smeared grid data coupled with made-up data coupled with known solar heating parameters of a variably veiled globe variably titled towards a heat source coupled with a complex clear here and cloudy there total set of water columns. That would tax super computers of which only alarmists can apparently use.
Or we could simply admit that we don’t have enough information to meaningfully constrain such calculations. The whole paleoclimate discussion is as polluted with computer-assisted speculation as the study of current climate, or more so. I much prefer “back-of-the-envelope” estimates or purely qualitative arguments that don’t bamboozle people with fudge factors in fancy dresses.
>Glacial advance grinding causes dust (creates
>>loess soil which is basically very fine rock powder).
>>Therefore dust should be at a maximum when ice
>>sheet extent is also growing.
This was Ganopolski’s idea and paper.
In addition to Michael’s comment, the isotopic analysis of the glacial dust in Greenland demonstrates that it did NOT come from Canadian glaciogenic dust. It is Gobi dust. And Ganopolski’s idea further demanded that all of the underlying silts were removed by the ice sheets, which is why the ice sheets were able to progress further each ice age. However, this demonstrably did not happen, as ancient silts still remain in the ice sheet regions.
So Ganopolski’s idea fails on both counts.
R
Au contraire. I live in Oregon and have spent time collecting loess soil in the South Central and South East corner of Washington. Wind blown loess soil deposition is a key component of glacial advance documentation as well as carbon dating evidence. The Washington scab lands are a veritable notebook of observations, capable of dating loess soil deposition as well as when floods washed exposed depositions down to older basaltic bedrock.
http://web.gps.caltech.edu/~mpl/Ge121a_Scablands/McDonald%20et%20al%202012%20old%20flood%20evidence.pdf
Loess windblown deposition (versus washed out silted deposition) confirms timing and locations of cold regime glacial advance.
Pamela… Do you know if Gobi dust has been detected in Washington ?
Loess soil is windblown and can be identified chemically as to its origin. Depositions have a well-identified connection to ice sheet advancing edge location and the grinding of rock located there. Its windblown location can even provide information regarding wind direction and speed, which then can identify plausible atmospheric pressure patterns that could produce such wind.
I have not read that Gobi desert dust is in Washington deposits, so my answer would be a qualified no.
http://www.environnement.ens.fr/IMG/file/DenisPDF/DDR-PDF-papers/DDR_Loess_mineral-dust_Springer_Muhs2014.pdf
By the way, it is easy to identify loess soil from lake sediment. Loess soil is devoid of mixed composition in terms of size, mass, and weight. Everything in it is light enough to be carried by the wind and lands in dune like fashion and caught in basaltic crevices. It also has a predominantly mineral content as opposed to carbon content. Lake sediment settles out in a much more consistent way and is composed of a variety of materials of different sizes, mass, and weights. It also has a much higher carbon component. In some cases, loess soil layers can be found in lake sediment cores. Depending on other correlated parameters, the lake bed was dry when inundated by blown in loess, or the lake was not dry and served as a collection point for glacial flour.
Au contraire. I live in Oregon and have spent time collecting loess soil in the South Central and South East corner of Washington. Wind blown loess soil deposition is a key component of glacial advance documentation as well as carbon dating evidence.
_____________________________________
I do not doubt it. But the dust in Greenland is from the Gobi, not Washington State. So it would appear that the greatest contribution to ice sheet albedo reductions, was from the Gobi.
I imagine that if your Washington loess is at low altitude, it would be quickly bound and consolidated by vegetation. The Gobi could not do that, because it had become a CO2 desert.
R
ralfellis, you make the common mistake of assuming albedo is confined to surface reflection. It is not. Atmospheric reflection is by far the stronger factor in planetary albedo.
“The vast majority of the observed global average planetary albedo (88%) is due to atmospheric reflection. Surface reflection makes a relatively small contribution to planetary albedo because the atmosphere attenuates the surface contribution to planetary albedo by a factor of approximately 3.”
http://www.atmos.washington.edu/~david/Donohoe_Battisti_Albedo_2012.pdf
RoHa referenced http://www.nature.com/news/cloud-seeding-surprise-could-improve-climate-predictions-1.19971 which can be merged with this CO2-dust theory:
Low enough co2 in great summer -> less plants -> less aerosols -> less cloud seeding -> more sunlight -> more chances to end glaciation albedo ratchet effect this time.
Now the only way l believe that a ice age can form is if there is a marked increase in blocking weather patterns across the NH. Because for a ice age to form there needs to be a major slow down in the amount of change going on in the weather. What l think is a large part of the cause in warming between the ice ages is down to the amount of change that’s taking place in the weather. l understand that during the last ice age the jet stream split into two at least over North America. Now am beginning to think that if this splitting of the jet stream was taking place during the summer months in the NH. lt could be a important factor into why there is move towards an ice age. Because this splitting of the jet looks to have the important effort of keeping the Arctic cooler during the summer months.
Shows how close we are to CO2 starvation. Could be a wake up call for the minority of warming alarmists who think they have been following legitimate science, in contrast to those who are motivated by anti-capitalist ideology and are immune to reason and evidence.
Also confirms my longstanding advice that we need to be dotting the great white north with soot-maximizing dirty coal-burning plants. Electricity production would be secondary and strictly local (makes no sense to build transmission lines in the middle of nowhere). To maintain local power generation in summer when there is no no snow to melt the soot plants could have a clean burning mode.
We are due for cooling and it could begin quickly or slowly. That will be determined essentially by weather, by the extremity of random fluctuations, and we need to be ready to nip an ice-initiating season or three of cold winter weather in the bud.
The Gobi did it. 🙂
It is interesting that enough literature has explored Ice Age oscillations and ENSO parameters (as possible agents in the past 800,000 years of temperature reconstructions based on flora/fauna marine deposition cores and chemical as well as aerosol deposition in polar ice core proxies) that dissertations now explore this arena. Dissertations rarely propose and conduct original research with entirely new results.
So with that base, I propose that when zoomed out, oceanic discharge/recharge could be the cause of the up and down nature of our current Ice Age temperature swings. My suggestion is rather simple, that the vast ocean is capable of building energy reserves that eventually top off and then is discharged, comparatively smoothly and quickly, in contrast to the recharge process that is rather noisy.
http://www.o3d.org/jeg/climate/texts/JEG_dissertation_web.pdf
Finally, I do not dismiss Milankovitch cycles. Indeed, the correlation between temperature reconstructions (which by nature, would be a dependent variable), and orbital mechanics (which by nature, would be an independent variable) cannot be dismissed.
http://www.climatedata.info/forcing/milankovitch-cycles/
But what I see in that correlation is an apparent Earthly energy recharge/discharge which points a finger at the oceans as the only Earth-bound substance with such capability. Else the temperature reconstructions would match the orbital cycles in excursions from baseline. As it is, the match is directional only (when insolation is high/low, temperature is high/low), not anomaly extent. The sudden rise of proxi temperature and the jerky step function back down does not match the orbital cycles, which by nature are far more symmetrical.
Conclusion: Because of the oceanic parameters at play over the past 800,000 years, zoomed out discharge/recharge thermo-fluid dynamics unique to our voluminous oceans in concert with Milankovitch orbital mechanics in the presence of a constant solar source may explain it.
The orbital eccentricity varies with a cycle much longer than precession, and is the only orbital parameter which actually changes the total annual insolation reaching the earth: obliquity (the angle of the earth’s axis of rotation to the orbital plane) and precession (the rotation of the axis itself around the normal to the orbital plane) plainly make no difference. If you do the sums you can see that varying eccentricity does: as eccentricity varies, the semi-major axis remains constant, so at high eccentricity the earth is a little closer to the sun.
Here is a paper I wrote on the linear fit of orbital parameters to Antarctic ice core temperatures, showing the separate eccentricity, obliquity, and precession orbital parameter time series, and how they fit with temperature trends.
http://www.robles-thome.talktalk.net/Milank1.pdf
Very good graphics. And you identify the obvious directional fit between your two parameters as well as issues with different anomaly excursions between the dependent and independent variable.
Caution. Using polar cores should be used with the caveat that the Northern Hemisphere is +60% covered by ocean while the Southern Hemisphere is +80% covered by ocean. One also needs to take into consideration that land volume is a poor and very shallow energy absorber while ocean volume is a very good and deep one. One also needs to take into consideration the difference in peak insolation between the polar caps.
But back to your graph and data. I would use an average of all the cores at both poles to compare with eccentricity to control at least a bit for hemispheric differences in ice core data.
Here is an excellent example of autocorrelation. There is evidence that suggests CO2 lags temperature. There is also some evidence that CO2 leads or at least overtakes and then drives further temperature increase. At the very least the two are connected at the hip, knees, toes, and everywhere else. So to create a psuedo-earth model of the current ice age oscillations between stadial and interstadial temperature changes using CO2 proxies and then publish the amazing feat of producing temperature output is similar to drawing an outline around someone’s foot and then say they have discovered a foot.
While the paper is an interesting use of models that use psuedo-earth parameters, it begs the question, what caused the CO2 to rise. The only way CO2 rises in a steady fashion is if the Earth is warm enough to green it up, and to continue to green it up over a long period of time. That takes a lot of heat to spread over the land, along with the necessary rain to grow green stuff which leads to more animals that eat the green stuff and more other animals who eat the animals that eat the green stuff. So lots of stuff leads to more CO2. More green stuff every year and decade and century, repeatedly. Moist heat has to drive it. Where would that seemingly unending source of moist heat come from when it appeared to have disappeared from the globe during the previous extreme cold plunge so identified in the record? It would have to be from a huge wet, warm source. I leave it unanswered in order to drive thinking.
http://www.clim-past.net/10/2135/2014/cp-10-2135-2014.pdf
hmmm……additional thought. Has anyone figured out just how far the greening needs to progress before it reaches a latitude it cannot survive in? Sort of akin to the “treeline”. I will call it the “greenline”. Would it be the current 10 degrees Celsius isotherm? Is there more buried forage under the ice yet to be exposed?
https://nsidc.org/cryosphere/arctic-meteorology/arctic.html
This article is a refreshing development that Anthony includes research of goodwilled
independent researchers, which do not belong to climate institutes, which only simulate
around with their CMIP3,5… models, and with little success…. Also, Anthony does not start
the title with the previous “CLAIM” (“beware of”), but now with “NEW PAPER”! so to say:
LISTEN!”, which is an honour to the author!.
The question is: What are the real climate drivers, that move global temps up or down……?
(1) Albedo. There recently (3 weeks ago) was a detailed Albedo-article here with Anthony,
showing measurement data for 30 years, proving that the Earth Albedo is a quasi-constant,
deviation +/-0.02% and this with 1 ONE MILLION sqkm less ice surface TODAY as back in 1980!
We see that global albedo into space has not changed although open waters, by logical thinking,
should take up more solar energy
I reckon that a dusty ice surface probably absorps the same energy as a dark
open water surface……but, albedo observations showed that this logical idea did not
materialize…..
. Since observations count more than calculations, the dust effect has herewith been answered.
(2) Those terrible Milankovitch cycle diagrams…. Forget this crap, because the flight of Earth
around the Sun is not a simple Kepler´s ellipse, on which ALL those Milankovitch cycle
calculations are based on. The Earth orbital line is different, it is a 3-D-flight, with the true
flight winding around its ellipse path, therefore, changing the distance Earth-Sun significantly,
thus containing changes in solar energy reception on Earth from Sun. Beware of authors of
Milankovitch diagrams, they all belong to the AGW-gang, keeping the spiral flight of Earth
from view and knowledge of the public. For this reason, with crooked Milankovitch input, the output will
not be better.
(3) There are five important climate drivers, now applied in a series of Holocene time spans,
see under http://www.knowledgeminer.eu/climate/papers.html. They cover the entire
Holocene in 8 parts of Pattern Recognion and explain EACH AND EVERY temp. spike
of the Holocene, starting 8500 BC (outstanding remain 1 AD to 2100 AD following within
this year).
.
Hopefully Anthony encourages independent thoughts with moor room. Regards JS
ralfellis June 30, 2016 at 12:04 am
Thanks, Ralph. I’m sorry, but I’m not following the logic. You say the icecaps melted thousands of years after the dust storms peaked, because of buried dust which only came to the surface once the icecaps were melting … what am I missing here? Isn’t that circular?
w.
>>Willis
>>Isn’t that circular?
I don’t think so. The reasoning is:
Low CO2 causes CO2 deserts and dust storms.
Dust piles up, annual year after annual year on the ice sheets.
But melting and warming cannot happen, because of a Great Winter and low insolation.
So 10,000 years of dust builds up, contaminating the top 1/3 of the 2-3km thick ice sheet.
Then a Great Summer increases the insolation significantly.
Dusty ice now begins to melt.
And 10 year-layers of ice melt, increases surface dust by an order of magnitude.
This concentration of surface dust accelerates the melting process.
Temperatures and Co2 concentrations begin to rise.
The Gobi returns to being pastural steppelands.
Dust storms stop., and skies clear.
This increases insolation absorption even more.
But the ice sheets continue to melt, because of ancient dusty ice layers.
Every year-layer of ice melt, increases surface dust, even though there is no more aeolian dust.
And the ice sheets melt.
All within one Great Summer of 5,000 years.
(Most interglacial warmig events last about 5,000 years.)
I think that makes sense.
Cheers,
Ralph
See my latest comment to you with a link to atmospheric dust and planetary albedo. Atmospheric dust is a response to windy dry air. No dust is a response to precipitation. The former suggests an ocean that is not evaporating much and wind is keeping water piled up against continents with a cooler surface elsewhere, think cold. The latter suggests the ocean is evaporating more which suggests that the oceans have calmed, the warm water is spread out, and is sitting idle on the top, sending water vapor into the atmosphere in copious amounts, think warm.
ralfellis June 30, 2016 at 7:19 am
The part you left out is the thousands of years between the peak of the major dust storms and the start of the melt. This is particularly true given that the dust storms were raging earlier but the ice did NOT melt.

I was hoping that your theory would explain why the world came out of the various glacial eras. However, here’s the difficulty, exemplified in the most recent deglaciation:
OK, so the red line shows the ice area per Huybers, and the dashed purple line is insolation at 60°N. Note that ice area peaks at about 16,000 years BP, when the deglaciation began. The difficulty is, look at the period around 63,000 years BP. There was the same rising insolation and MORE dust than when deglaciation actually began 16,000 years BP, but no deglaciation. Why?
This is the recurring puzzle of the glacial/interglacial cycles … there is no obvious ~ 100,000 year cycle in the Milankovich variation of high-latitude insolation. I suspect that as you say, dust plays a part … but as is usual, the details are unclear.
Nature is always a step ahead …
Thanks for the continued discussion,
w.
The 10,000-year dust build up is a nice narrative but the chart shows there can be 25,000 years of dust build up and multiple peak insolation within a glacial period. The theory does not predict when and when not an interglacial is supposed to happen. If we accept the narrative, then we can always blame dust and insolation for all interglacials. It’s inevitable because all glacial periods have multiple dust storms and multiple peak insolation. That’s the beauty of this theory. It’s not falsifiable. It’s not wrong, it’s not even wrong.
However, the non-extinct plants and animals in the Appalachian mountains and relic permafrost in the Gobi desert despite supposedly increasing wind erosion of dry soil in the last glacial have falsified the theory. Let’s give more weight to nature than to metaphysics.
>>Pamela.
>>Atmospheric dust is a response to windy dry air.
>>No dust is a response to precipitation.
See the PMIP precipitation map in the paper, where precipitation remained largely the same in the critical tropical regions. See also the Chinese paper I linked, that demonstrates that the Gobi was slightly wetter in the LGM. And yet a great deal of extra dust was created by the Gobi at this time. Why? Because it became a CO2 desert.
Cheers,
Ralph
Willis.
The difficulty is, look at the period around 63,000 years BP. There was the same rising insolation and MORE dust than when deglaciation actually began 16,000 years BP, but no deglaciation. Why?
_________________________________
I see no difficulty here.
60 kyr ago there was a smaller dust event, and a small NH Great Summer, and the ice sheet volume did indeed attempt to decrease. But there was insufficient dust and insufficient insolation, for a full interglacial.
And since an interglacials can NEVER happen (has never happened) during a NH Great Winter, the world had to wait for two complete Great Year cycles, before the conditions were right for another attempt. This time there was more dust (plus the old dust), and much more NH Great Summer insolation, and suddenly we get an interglacial. And as soon as the warming begins, CO2 is released from the oceans, plants begin to grow on the Gobi, and the dust storms immediately cease.
.
And from this, we can deduce that the conditions required for an interglacial are finely balanced.
The first two NH Great Summers on your graph were very strong but only produced small dips in the ice volume, because there was no ice-sheet dust contamination and no albedo reductions.
The next NH Great Summer had some dust, but it was weaker, and so it still could not produce any more than a dip in ice sheet volume.
The next NH Great Summer was extremely weak, and produced no effect at all.
But the last NH Great Summer, the Holocene Summer, had just enough dust and just enough insolation, to produce an interglacial. But only just, I think.
Now that is quite a finely balanced climatic system. But then there are many finely balanced systems in climate and weather, like the critical surface temperature for convention and cloud formation. Depending on the adiabatic lapse rate, a degree or two of warming stands between clear skies or widespread cumulous. See a T-phi diagram, for the criticality of cloud formation.
See also glider pilots anxiously watching the morning temperature rise, looking for that all-important extra degree of warming that will signal the time for takeoff. The temperature-ice sheet response on your graph, is no different to a glider pilot waiting for convection (but each pilot-day is represented here by a 23 kyr cycle). The first four ‘days’ on your graph produced no convection, so the pilots retired to the bar to spin aviation yarns of good gliding days. But the fifth ‘day’ was a stonking thermic day, and everyone was rushing to launch. (But Gaia works on different time scales to glider pilots….)
Cheers,
Ralph
The Gobi desert dust storm story is really problematic. It is soot that has low albedo that is causing ice melt. But soot comes from forest fires and Gobi is a desert, not much trees to burn there. Soot-free dust will even cause more snowfall and increase glacier thickness.
“Earlier this month, researchers from the Scripps Institution of Oceanography and the University of California, San Diego, found Asian dust storms were causing the Sierras to be regularly doused with snow.
‘In order for water to condense out of the water vapor and into a droplet, it has to have a surface to condense on,’ said Doug Collins, a chemist at the University of California told the New York Times.
‘Sand particles provide that surface.’
http://www.dailymail.co.uk/news/article-2302322/Sandstorm-China-ends-California-west-coast-wakes-hazy-skies-clouded-sand-Gobi-Desert-6000-miles-away.html
Here’s an alternative theory that’s more consistent with the data. Dust storms in the Gobi feeds snowfall to the glaciers. Look at your chart. Large dust storms always coincide with high ice sheet extent and no or small dust storms coincide with the ‘valleys’ (low points) in the ice sheet graph. There is no time lag. The correlations are in real time.
I postulate that no or small dust storms are caused by formation of permafrost in the Gobi. There is evidence for this. The formation of the relic permafrost found in Gobi was dated 22 kya to 15 kya. Your chart shows little dust storms and large decline in ice sheet during that period. What triggers formation of permafrost in Gobi? I postulate the advance of Siberian glacier to northern Mongolia during glacial periods cools the Gobi desert thus starting permafrost formation.
Develop this theory further and you can call it “Ellis-Strangelove theory” 🙂
I find this all very interesting, especially coming off the heels of Patrick Moore’s paper which was posted here recently on the recent danger of CO2 levels dropping too far (with us coming along at precisely the right time to push things in the other direction). Here we have a dependable and natural (read: non human) mechanism for upping the CO2 and allowing the re-greening of the Earth. It’s a wonder no-one’s thought of this prior (atleast I haven’t come across this idea before).
Thanks Ralph and Michael – hope you or others can refine things and make a compelling case for your theory.
Cheers!
Here is an article using land-based flora temperature/precipitation proxies. From these proxies suggested atmospheric/oceanic conditions are proposed. From the spread of cold=dry signs mixed with, for example, opposite signs in other locations, jet stream position with deep sloping sides can be inferred. These suggestions appear to describe deep, large blocking systems, sending polar cold air towards Southern latitudes in some locations, and equatorial warm air towards Northern latitudes in other locations.
Proxies that show opposite signs at the same time are often averaged out aka Mann’s hokeystick. But in fact he may have uncovered a goldmine that may suggest past atmospheric/oceanic patterns that can predict whether or not we are sliding down to the next stadial. Or at least what to look for. Or at least tell our great-great-great-great-etc-grandchildren what to look for.
http://citeseerx.ist.psu.edu/viewdoc/download?doi=10.1.1.727.4892&rep=rep1&type=pdf
I find this explanation very suspect. The reasoning starts off sound and I particularly like the part about CO2 not behaving as if it is the primary agent. I have always looked at the charts and said they disprove that CO2 is the main agent because we can see clearly that warming and significant cooling both occur without co2 levels being precursor. It is quite apparent something else is forcing the temperature more than CO2. The fact our graphs don’t have other data doesn’t mean that co2 can be the only explanation.
We now know that CO2 TCS at most is 1.2 or 1.5 which means it can’t explain at least 50% of the ice ages. This explanation fails on a number of fronts. There is another theory not mentioned which has to do with underground fissures. I have explained all this in my blog https://logiclogiclogic.wordpress.com/category/climate-policy under the title of another big failure for climate science.
I second the welcoming comments upthread.
“Why do ice ages occur? …we simply do not know for sure.”; well said, and bears repeating. If I may expand: The largest climate variation that our species has experienced is not understood, in the sense that we don’t have all the major pieces of the puzzle. Any claim to full understanding of climate changes of lesser scope is thus ambitious. This paper, in integrating some of the pieces, is a step along the critical-path (whether exactly right or not).
The observed lack of general glaciation in E Siberia and Beringia has always puzzled me. The explanation proposed here of “too dusty” offers a simple, unforced mechanism, so I take that observation as significant supporting evidence.
The Gentle Reader should grasp the timescale here; many of the datapoints in 2nd Fig (this post) are 1 kyr averages (eg ice volume). On the glacial-cycle scale, “a thousand years is but an instant…”, and ocean and atmosphere are both well-mixed. Only features that can persist largely unchanged over several kyr need apply.
One mystery is the periods of rapid and fairly uniform nett land-ice accumulation or melt (see ice-vol in 2nd Fig). These rates are fairly consistent across cycles, with melt-rate about double growth. Identical ice-sheets with identical dust-distributions across cycles is implausible, so while this paper offers a very credible *means* of deglaciation (ie driving force of absorbed insolation), *mechanism* (regulating rate) appears still lacking.
ralfellis and javier upthread divert into a controversy unhelpful because too narrowly focused on the surface. Consider the system: An ice-sheet sub-cooled to -20C with dust distributed in depth. Ice is nearly transparent/translucent to light (recall natural-light images of research under Antarctic sea-ice), and has a thermal conductivity of the order of glass. Blowing warm dry air over this is inefficient (try the experiment, noting that warm wet air is another matter entirely). Surely the key here is *near-surface embedded dust*; this will absorb and trap the Sun’s heat efficiently, first warming the surrounding bulk ice by conduction, then partially melting it, exposing deeper dust…
More on mechanism: The melt rate can be expressed as a persistent nett heat imbalance. My BoE indicates about +4 W-m-2 (5 if I include the sub-cooling). The insolation and albedo values in the paper show that this is relatively minor, and the rate could be (maybe) 10x observed. Why not? There appears to be (yet) another “missing piece”.