And Those Too-Cool Surface Temperatures Create Obvious Problems for Researchers
Guest Post by Bob Tisdale
UPDATE: The closing has been revised.
The sea surface temperatures of the tropical North Atlantic are one of many factors that contribute to the development and maintenance of hurricanes. In fact, 26 deg C (about 79 deg F) is the sea surface temperature that’s typically quoted as the threshold for hurricanes.
This post provides model-data comparisons of the sea surface temperatures for the portion of the North Atlantic where hurricanes tend to breed, also known as the Main Development Region. I’ve used the coordinates of 10N-20N, 80W-20W for the Main Development Region. See Figure 1 for a map of May 2016 sea surface temperatures of a portion of the North Atlantic, on which I’ve highlighted those coordinates.

Figure 1
As you’ll discover in this post, and as noted in its title, the sea surface temperatures, as simulated by the climate models used by the Intergovernmental Panel on Climate Change (IPCC) for their 5th Assessment Report (AR5), are too cool for the Main Development Region. The models’ differences with reality create significant problems for the modelers and their speculations about past, present and future hurricane strength and activity.
MODELS AND DATA
The climate models for this post are represented by the mean of the model outputs stored in the CMIP5 (Coupled Model Intercomparison Project Phase 5) archive, with historic forcings through 2005 and RCP8.5 forcings thereafter. (The individual climate model outputs and model mean are available through the KNMI Climate Explorer.) The CMIP5-archived models were used by the IPCC for their 5th Assessment Report. The RCP8.5 forcings are the worst-case scenario. We’re using the model-mean (the average of the climate model outputs) because the model-mean represents the consensus (the groupthink) of the modeling groups for how sea surface temperatures in this example should warm if they were warmed by the forcings that drive the models. See the post On the Use of the Multi-Model Mean for a further discussion of its use in model-data comparisons.
For the sea surface temperature data, we’re presenting the original version of the satellite-enhanced Optimum Interpolation Sea Surface temperature data from NOAA, commonly referred to as Reynolds OI.v2. The original version of the Reynolds OI.v2 data is available on weekly and monthly bases, and at a 1-deg (latitude/longitude) resolution. The monthly Reynolds OI.v2 data are available from the KNMI Climate Explorer for the period of November 1981 to present. There they are identified as 1982-now: 1° NOAA (“Reynolds”) OI v2 SST.
NOTE: We are not using the daily, high-resolution (0.25-deg latitude/longitude) version of the Reynolds OI.v2 data. As illustrated in the post On the Monumental Differences in Warming Rates between Global Sea Surface Temperature Datasets during the NOAA-Picked Global-Warming Hiatus Period of 2000 to 2014, the daily, high-resolution version has been adjusted by NOAA so much that its warming rate for the period of 2000-2014 falls well above of the parametric uncertainty range of NOAA’s ERSST.v4 data. See the discussion of Figure 6 from that post. [End note.]
TIME-SERIES GRAPHS
Climate modelers prefer to show climate model outputs in anomaly form. (See the RealClimate post is Absolute temperatures and relative anomalies authored by Gavin Schmidt, Director of the Goddard Institute of Space Studies, GISS. It’s worth the time to read it.) In it, Gavin Schmidt was downplaying the need for climate models to simulate Earth’s absolute surface temperatures. If we present a model-data comparison of the sea surface temperature for the main development region of the North Atlantic in anomaly form (the top graph in Figure 2), we would have to say that, based on the consensus of the models, the models do a very good job of simulating the warming of ocean surfaces there during the satellite era. No surprise there. The North Atlantic is one of the few ocean basins where models perform reasonably well at simulating warming rates during the satellite era. See Part 2 of the most recent model-data comparison of sea surface temperatures here.
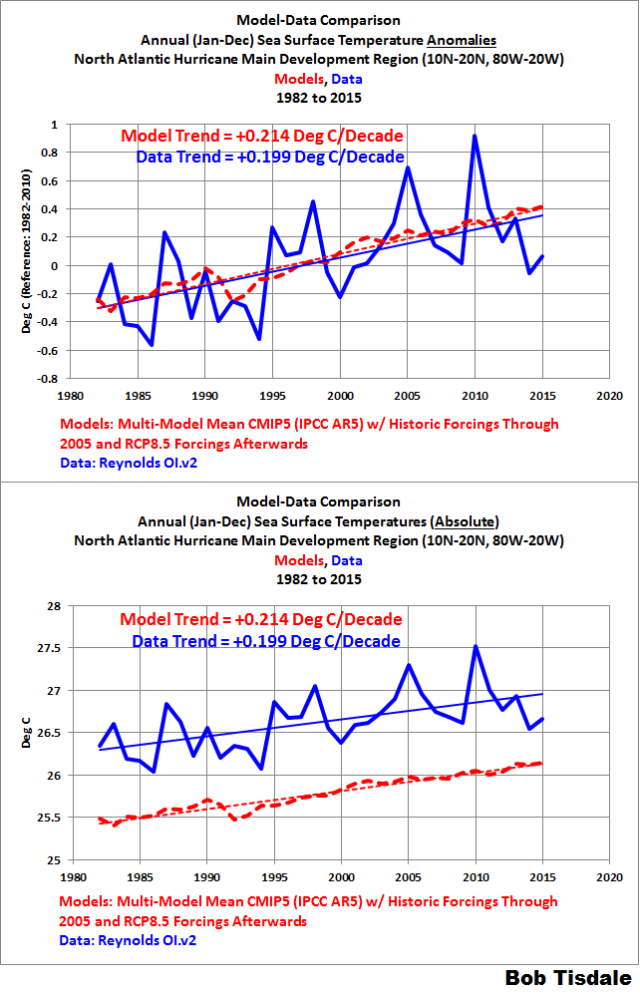
Figure 2
But if we look at the model outputs and data in absolute form, we can see that the models are simulating ocean surfaces that are too cool. See the bottom graph in Figure 2. For the period of 1982-2015, the models are about 0.8 deg C cooler than the observations.
GRAPHS OF ANNUAL CYCLES
It’s only 0.8 deg C, someone might be saying. But let’s look at the annual cycles (modeled and observed) in the sea surface temperatures there, based on the averages for the period of 1986 to 2015, the last 30 years…because climate is typically defined as 30 years of data. See the top graph in Figure 3.
You’ll also note that I’ve added a horizontal line at 26 deg C. That’s the sea surface temperature commonly referenced as the threshold required for the development and maintenance of hurricanes. The data indicate, for the period of 1986 to 2015, the sea surface temperatures were above the 26-deg C threshold for hurricane development from late-April to mid-to-late December. On the other hand, the average model has a much shorter period above that 26-deg C threshold…from mid-June to mid-November. In other words, in addition to the sea surface temperatures being too cool, the sea surface temperature-based hurricane season in the average climate model is too short.

Figure 3
Now consider the bottom graph in Figure 3. It compares, for the Main Development Region, the annual cycles in the observed sea surface temperatures for the past 30-year period (1986-2015) and the consensus of the climate model simulations of them for the period of 2021-2050. (I worked forward in time in 5-year increments until the annual difference was zero deg C.) For the Main Development Region, the climate model simulations of sea surface temperatures for the period of 2021-2050 align with the observations for the past 30 years. In other words, the model-simulated climate for the Main Development Region is out of sync with reality by about 35 years.
CLOSING
[Note: The following paragraphs have been updated for clarification purposes. The simulations of tropical cyclones in the CMIP-archived climate models are still trouble filled, except in specialized models and when forced with sea surface temperature data. See the IPCC’s discussion of tropical cyclones in climate models in Chapter 9 – Evaluation of Climate Models of the IPCC’s 5th Assessment Report (my boldface).
9.5.4.3 Tropical Cyclones
It was concluded in the AR4 that high-resolution AGCMs generally reproduced the frequency and distribution, but underestimated intensity of tropical cyclones (Randall et al., 2007). Since then, Mizuta et al. (2012) have shown that a newer version of the MRI-AGCM with improved parameterizations (at 20 km horizontal resolution) simulates tropical cyclones as intense as those observed with improved distribution as well. Another remarkable finding since the AR4 is that the observed year-to-year count variability of Atlantic hurricanes can be well simulated by modestly high resolution (100 km or finer) AGCMs forced by observed SST, though with less skill in other basins (Larow et al., 2008; Zhao et al., 2009; Strachan et al., 2013). Vortices that have some characteristics of tropical cyclones can also be detected and tracked in AOGCMs in CMIP3 and 5, but their intensities are generally too weak (Yokoi et al., 2009a; Yokoi et al., 2012; Tory et al., 2013; Walsh et al., 2013).
End note.]
How can researchers hope to use the non-specialized climate models stored in the CMIP archives for the study of North Atlantic hurricanes when (1) the average of the modeled sea surface temperatures for the Main Development Region are too cool…and when (2) the average model has a sea surface temperature-based hurricane season that’s too short as a result of being too cool…and (3) when the consensus of the simulations of main development region climate is out of synch with reality by about 35 years?
One approach is to “bias correct” the sea surface temperatures in climate model outputs to account for “model drift” before estimating hurricane activity. This was the approach taken by Caron et al. (2013) Multi-year prediction skill of Atlantic hurricane activity in CMIP5 decadal hindcasts.
In other words, the climate science community uses actual (not simulated) sea surface temperature data to force the models or they adjust the sea surface temperature outputs of the models to then estimate the tropical cyclone activity. Basically, the simulated sea surface temperature outputs from the average climate model are of no value in the study of hurricanes.
All the climate science community has ever provided is speculations of past, present and future climate…and all of that speculation is based on multimillion-dollar simulations of fantasy worlds, not the real world.
Do taxpayers around the globe know policymakers are creating global warming policies that are based on climate model simulations of fantasy worlds…fantasy worlds that bear little relationship to the planet on which we live?
SERIES OF POSTS
This is the second post in which we compared the annual cycles of modeled and observed surface temperatures in a region critical to climate change. The first post was about Greenland Surface Air Temperatures.
Bob,
“How can climate modelers hope to properly simulate the number and strength of North Atlantic hurricanes”
What modelling are you referring to here? I don’t think GCM’s themselves claim to model the number and strength of hurricanes. There are people who do that modelling, but I would expect that they would assimilate observed temperatures.
I’m no expert but I think the point is that hurricanes cause cooling and “you” have left it out of your models.
But Bob is saying that the models are overcooling the tropical Atlantic.
The models over-cool the area where hurricanes form. The models would show less hurricane,so there is less hurricane in the model. Hurricane causes cooling so if the model has less of it then the model would run too hot in the other areas where hurricanes don’t form.
Or something.
GCMs are Global Climate Models. These things are supposed to simulate the global climate. Yet qualitatively they describe worlds that are very different from our own. This issue with hurricanes is just one of many serious problems with these models.
Climate scientists tend to brush aside the fact that each individual model is qualitatively seriously broken and simply average the global temperatures from an assemblage of GCMs to obtain an oracular black box for making temperature predictions. But as the models are broken this is just garbage in garbage out. We have no reason to expect that the numbers resulting from this exercise will be meaningful.
GCMs are ‘General Circulation Models’, not ‘Global Climate Models’. They try to simulate atmospheric ‘circulation’, not climate.
…Then perhaps the IPCC should be renamed as the Intergovernmental Panel on Circulation Change, because they certainly rely on these models.
They follow cyclic pattern — Typhoons follow opposite to hurricanes. If we create this based on the observed data,we can create high and low frequency periods. The cyclonic activity in Bay of Bengal presented 56 year cycle similar to northeast monsoon precipitation.
Dr. S. Jeevananda Reddy
Nick, I’ll add a clarification. Thanks.
It still believe it will be a minor miracle if the decade+ hiatus from a major hurricane strike the lower 48 has enjoyed continues through this year. Though conditions in the equatorial region off the African coast are not conducive for formation the conditions in the Gulf and Caribbean sure are looking like they have the potential. Two tropical waves down that way right now. Weatherbell’s Hurricane forecast for 2016 says that close in development is the most likely scenario this season.
http://www.weatherbell.com/final-2016-hurricane-forecast
One economist predicted an annual growth rate of 1%. His colleague predicted a
growth rate of 0%. The economy grew at a .5% rate.
They congratulated themselves and went out and had a beer, because on average,
they were correct.
Why do we average climate models?
A very good question. In my field, (nuclear engineering) one would NEVER do such a thing. The results would be considered to be absolutely useless. And anomolies might be interesting or occasionally useful, but in engineering you need to know the absolute values of the variables that you compute – averaging a very high temperature with a very low temperature to get one in the middle that you use for an engineering calculation is a recipe for absolute disaster. It you use the wrong temperature, the materials will punish you.
An IPCC model tht runs too cool? What is this world coming to?/sarc
Here we are, almost to July and little or no typhoon activity in the Pacific and Indian Oceans. Seems cool all over.
FYI in the Atlantic the average date of the first hurricane is Aug. 10, and the first “major” storm of Category 3 or higher is Sept. 4.
Some CMIP5 models – maybe not all – neglect a temperature dependence of a latent heat of water vaporization. That leads to an overestimation of a heat loss by evaporation from warm seas, thus rendering a modeled surface temperature too cool.
https://judithcurry.com/2013/06/28/open-thread-weekend-23/
Careful fellows, Circulation patterns and a change in jet stream flow and direction will likely be the dominate factors. Over the past few years I have been watching the flow of dry air from the sahara desert. This has produced an extreme dry line right through Hurricane alley. Is this moves north or begins to diminish, we will get improved conditions for tropical storms. I believe it is good to remember that the nutrients for the amazon forests are greatly needed from the Sahara. “Potassium”
These detailed posts should have an abstract.
In fact, all posts should have one.
Boy howdy, I have asked Bob for these many times. What do you say Mr. Tisdale?
GCMs have never been very good at simulating tropical cyclones. The grids are too coarse and the physics represented poorly. Of course, none of that have stopped people from saying that hurricanes will be worse with a warmer globe. And what they don’t mention is that in the fantasy world of GCMs a warmer wold will have FEWER hurricanes. That doesn’t bring in the grant money. That these models also don’t get the SSTs right is not surprising. They’ve got nothing to do with the real world.
The current theory that ocean water temperature is a predominat key driver is error prone a and unreliable. Hurricane Alex in January told us that.
The predominant driver is the annual reduction in height of the tropopause at the end of the NH summer and the mass transport of atmosphere, hence the timing of late July onwards. If the temperature reduction as indicated currently on Dr Roy Spencers’s website eventuates, this year will be very interesting, especially as the previous nine months have been record temperature setters providing plenty of atmospheric volume. Heres hoping I am wrong