Yesterday, WUWT covered the sharp drop in global temperatures that followed the peak of the 2015/16 El Niño. That caught the interest of John B from Toronto, and he writes in with a graph he has rendered that illustrates correlation of many climate metrics. While it is true that “correlation is not causation” it can also be said that correlation is well worth investigating further.
He writes:
Thought you might be interested in this plot I made. I’m not a climate scientist, but I have more than 15 years experience in signal analysis.
Coding is done by me using .NET with GDI graphics.
PS. I have done this in my spare time out of curiosity and to facilitate a personal understanding of whats going on. I have no interest in fame, fortune, politics or activism.
 Click for a much larger image at 1920×1080 pixels. An even larger 3840×2160 (HD 4k) image is also available here. You really need to look at this graph in magnified form to get the details.
Note that the intensity of the red and green colors used to depict ENSO events (El Niño in red and La Niña in green) varies with the strength of the event. Note also that the Average Absolution Deviation of El Niño is +0.41 while La Niña is -0.27. This indicates warming events due to El Niño and in greater magnitude than cooling events due to La Niña, hence we have a cumulative heat growth from El Niño events during the period in the graph.
Links to data sources used in the graph:
Water Vapor: ftp://ftp.remss.com/vapor/
Temperature Lower Tropasphere: http://vortex.nsstc.uah.edu/public/msu/t2lt
ENSO: http://www.cpc.noaa.gov/products/analysis_monitoring/ensostuff/ensoyears.shtml
ENSO: http://www.cpc.noaa.gov/products/analysis_monitoring/ensostuff/detrend.nino34.ascii.txt
Solar: http://www.sidc.be/silso/datafiles
CO2: ftp://aftp.cmdl.noaa.gov/products/trends/co2/co2_mm_gl.txt
Wind: ftp://ftp.cpc.ncep.noaa.gov/wd52dg/data/indices/zwnd200
Aerosol: http://data.giss.nasa.gov/modelforce/strataer/tau.line_2012.12.txt
Global Carbon Budget: http://cdiac.ornl.gov/GCP/
CO2ppm to CO2Gtonnes https://www.skepticalscience.com/print.php?r=45
Hi John B,
Can you please explain in words what you are plotting?
I can’t magnify the graph enough to read the text.
(I have just installed a new video card 10 mins ago so the problem might be mine).
Thanks Geoff.
I can only read the white text, not the coloured text. Purple text is especially difficult to decipher. White background with black text may help; also use of a coloured line / bar / square alongside the text for each plot to identify them, as has been suggested. Excel 2013 does this by default. Also red and green may not be the best choice, as some people are red-green colour blind. At the moment, people who have little knowledge of the subject will not take the trouble to decipher it, which is a shame.
On my tablet, it is essentially a black blob. VERY thin dark colors on black background doesnt work. Maybe later I’ll find a big monitor…
To me, it shows (2 somethings) wobbling up together, with El Ninos at tops and La Ninas following at bottoms. Then some skinny squiggles…
Maybe a great graph, but lacking explanation for those of us without 30 inch monitors….
It’s cryptic…too funny
Use Ctrl + to magnify within your browser. On an Android tablet ‘triple tap’ to zoom in. Although I’m not sure this will be much help, even with a 10.1 inch screen.
Ha, ha, still using an old Sony 20″ CRT and it looks great. Looks like there’s still some use for those after all!
and Super Smash Bros. Melee 🙂
Use Photoshop to reverse the colors and a lot of the hidden stuff will be visible. You just need to remember the colors for La Niña and El Niño have been reversed.
I reversed the colours with Irfan View but some of the printing is still very faint, and it is still not clear to me (for example) what the top line graph (with points marked at each year, and ending before the final year on the x-axis) is meant to represent. I do hope that the author comes on here and gives us a step by step (or curve by curve, or line by line) explanation.
For the last 13 months the media have been spinning land temperatures as new record high for this or for that, I am curious how the media will spin a 0.5 degree C. drop in temp in the next few month? Will they simply not report it or will they invent another “Mammal Extinction” due to CO2 or perhaps they will get even more creative and proclaim Donald Trump’s airplane as the new source and leave Clinton’s gluttony completely out of the picture? Any guesses any one?
What an absolutely fascinating piece of work! I really hope that those more knowledgeable about these matters than I, think it has real validity. From an amateur perspective, it seems that the only variable that appears unconnected to the others is the CO2 concentration. Quelle horreur!! Surely some mistake??
If it’s the unadulterated data, then it is valid. Interpretations may differ …
Richard, I am on the same boat with the same conclusion. Fascinating!
err no.
understand that the effect of c02 and other GHG ( he really needs to chart all forcing )
is.
1. Lagged by up to 30 years,
2. on the order of .1c to 2c per decade.
Here is the clue. If you want to try to isolate the co2 effect from looking at data you need to pick a long enough time series
I will refer you all to the best skeptic on this: nic Lewis
If you are not building your skepticism on Nics work, then you are wasting your time.
“pick a long enough time series”
The best time series are long enough so that the authors have passed (after using all the grant money) so they don’t have to explain their prediction failures.
“If you want to try to isolate the co2 effect from looking at data you need to pick a long enough time series”*
*Just don’t use data derived from the Greenland or antarctic ice cores. They are clearly misleading.
The radiative effects of CO2 are instantaneous in the atmosphere (well understood physics), but Mr Mosher pulls the claim out of his backside that there must be a 30 year lag. Evidence provided for this claim: none.
GreenLand is not the planet
And ice cores are proxies.
Read nic lewis.
Follow his lead.
Or lose the debate.
Steven Mosher
There is the past and then there is the present, the two are completely different when it comes to CO2
If we need a longer time frame, here is a much longer one:
(Note the “Note” in the chart.)
Next, changes in CO2 do not match global warming:
http://jonova.s3.amazonaws.com/guest/de/temp-emissions-1850-web.jpg
And as usual, the alarmist crowd gets causation backward. Changes in CO2 do not cause measurable global warming. Rather, changes in temperature cause changes in CO2:
I am reliably informed that the effect of c02 and other GHG
is .
“1. Lagged by up to 30 years,
2. on the order of .1c to 2c per decade.”
–
Missing seems to be the amount of CO2 increase needed to do this.
the amount of other GHG increase.
How many decades the increase is expected to go on for.
An explanation of why if the effect is lagged for 30 years why any increase would be expected in the first 3 decades at all? [only joking].
Water Vapour Convection Cooling. Negative feedback.
You would have thought that with 15 years of signal analysis, he would have been able to produce a graph that people can read. Like, errr, a white background? And perhaps some explanation of what the lines represent (if you can see them).
This posting is a waste of time in its current format.
Why be so rude? Good manners cost nothing. For the record I have no problem understanding it at all, but then I am a genius.
What are the odds that there are two of us right here! ☺
When I click on the graph it looks fine.
Richard G June 22, 2016 at 3:10 am
When I click on the graph it looks fine.
ditto, on my lil’ ole iPad 1.
Well, why not ask rather than abusing him? Is that how you conduct all your social activity?
As a computer scientist who spends a lot of time on usabilty and information presentation the legibility of this truly interesting and intriguing graph could be dramatically improved. A version with a white background would certainly help, as would a better choice of colors for the different data sets, even on my 4K screen zoomed in I can barely read the purple legend colors… typically in a legend you make the legend text white or black and have a color square beside it… this dramatically improves readability.
This is an outstanding achievement of putting relevant data together in a very illuminating visualization. Great work!
I’m struck by the amount of cooling going on, even when viewing a thumbnail version of it.
There are purple legends? Who knew….
@ PWL even in bright daylight with my laptop screen at not even half of the full brightness i can read this graph perfectly
if i may give one little nitpicking feedback: some more contrasting colors for the graphs would help to remember which is which more easyly apart from that: perfectly readable and very interesting piece of work
it shows very clearly that el nino and la nina is driving the climate just like Bob Tisdale explains so well
Exactly.
Btw, Joe Bastardi has been saying this repeatedly during his Saturday summaries (weatherbell.com) for over two years. He has not said that the current el Nino will create a drop equal to its rise–he’s saying wait and let’s see–but he shows that the past is exactly as this graph shows.
It works fine on my IPad, zooming in where necessary.
Thanks for a fascinating post-I look forward to comments by those that are better able to draw conclusions from it.
For many browsers using ctl+ will enlarge the object being viewed. If you are having trouble reading the graph that should help.
“For many browsers using ctl+ will enlarge the object being viewed.”
Thanks for the tip. On my browser that technique can be used repeatedly.
Or instead of using ‘+’ simply use your mouse wheel+ctrl to zoom in or out.
You can always use the poor man’s CSS (ie ^A) to highlight the graph and enhance some of the colors…
get a better video card and monitor, and while you’re at it take a Dale Carnegie course
ralfellis, I suggest you get off your butt and make your own then if this one offered in the spirit of discovery and kindness isn’t suitable to your highly refined visual palette. I for one am grateful.
There’s an important reason the background is black…so that the shades of red and green intensity for ENSO events can visually have amplitude. It would not work the in same way with white.
-Anthony
I second that emotion! I would request that this graph work be archived for easier ongoing access. I am having the same issues with the scale so will need to look at it on a different machine. Lots to look at and analyze.
Perhaps if the legend was posted next to the graph. That’s really what’s hard to make out.
@John Harmsworth,
Joe Bastardi discusses it now almost every Saturday: weatherbell.com. Has for two years, using real observed temps. Sometimes it take Joe a day to get the “Saturday” summary up. Grrrr.
I would agree with you that his choice of a black background makes reading the graph problematic.
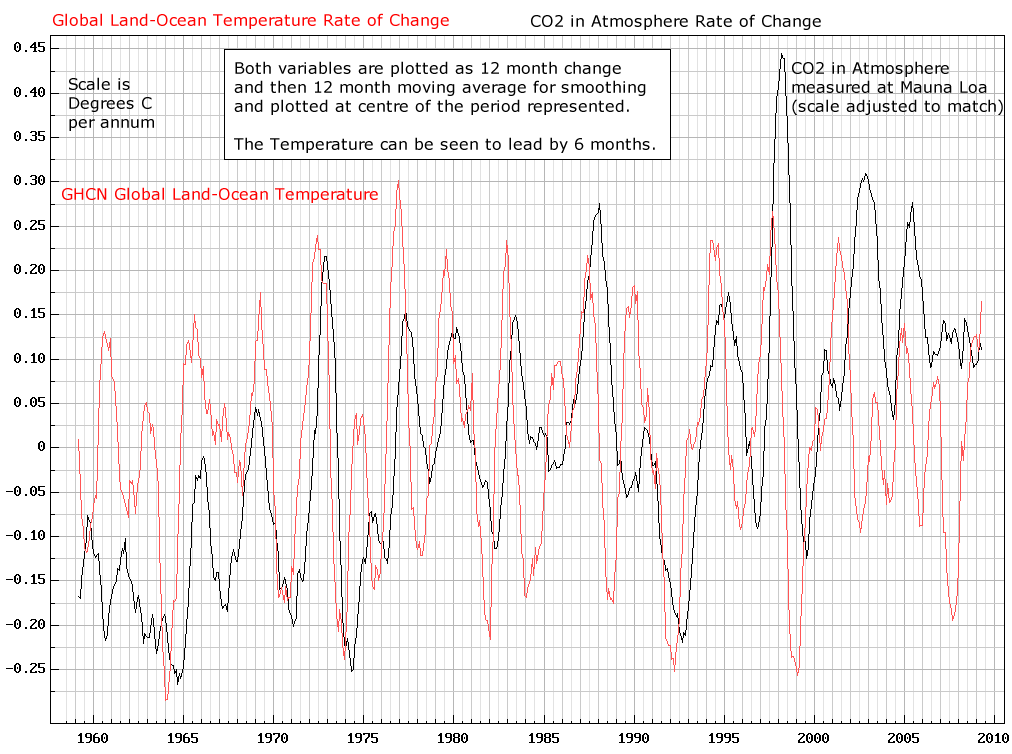
I’m struggling to understand the difference between CO2 anomaly and yearly increase CO2 anomaly, why one is a straight line and the other seems to track temperature and water vapour, and what’s the significance of this. Can anyone help me out?
Phil,
No doubt you are familiar with the more typical sawtooth pattern of CO2 rise? The overall trend is monotonically upward, but the depths and valleys of the “teeth” are highly correlated with temperature, though with a lag (in which changes in CO2 lag changes in temperature, showing CO2 to be dependent on temperature, and not the other way around, at least for many time frames). The lag is clear seen in plotting annual first differences of temperature and CO2 changes:
http://i.imgur.com/BiqjxvH.jpg
Hope this helps explain what you are seeing.
Basil
Basil,
What is your source of CO2 data?
I did a scatter plot of UAH temp and CO2 from NOAA (ftp://aftp.cmdl.noaa.gov/products/trends/co2/co2_mm_gl.txt) and found no correlation of dT and dCO2 (R2 = 0.00) with time lags of one month to 12 months or more.
It looks like there is something wrong with John B’s UAH data, If I’m reading it correctly. The graph shows a temp anomaly of 0.7 °C in 1997 and about 1.0 °C in 2016 but UAH shows about 0.75 °C and 0.85 °C, respectively. John’s graph shows 0.3 °C of warming but the UAH data show only 0.1 °C. See http://www.drroyspencer.com/latest-global-temperatures/.
I immediately spotted this as well, and the same goes for RSS. RSS 97′ peak was about +0.85 and 16′ peak at about +0.97, yet he has data showing 97′ at about +0.45 and 16′ at about +1.15. It’s almost as if this is Karlized satellite data; it looks very similar to the surface datasets.
Thomas,
Without checking, I’m pretty sure it is Mauna Lao data. I think you are trying to do something a bit different than what I’m depicting. These are seasonal differences, where the “season” is annual. For instance “dT” would be temperature in (say) May 1994 compared to May 1993, and the same for “dCO2,” CO2 in May 1994 compared to May 1993. Do note that I use the natural log of CO2, but you’ll see the same pattern without the log transformation. The log transformation is justified since CO2 seems to be changing at a fairly constant rate over time. The trend in temperature seems more arithmetic, than log natural. I’m not trying to depict specific lags, but am just plotting annual seasonal differences. But the lags are there, in the annual seasonal differences. It is the annual variations that are reflected in the “teeth” of the sawtooth pattern of CO2 rise. Variation in the seasonal variations — differences in the amplitudes of the “teeth” — from year to year are not very noticeable to the naked eye, but are there, and are highly correlated with short term temperature changes.
What is depicted in my graph is similar to what is depicted sometimes with ice core data, where CO2 changes lag temperature changes on the order of centuries. Here the lag is intraannual, on the order of months. I suspect that the lag exists on all orders of time.
Basil
Thomas – It’s T, not dT.
This realy interesting although I admit to being lost in a couple of places.
O/T but related: The BBC announced a few days ago on its mainstream news programmes that a new study of oceans currents is to be undertaken over the next few years, to gain a better understanding of how they affect the Earth, &……….drive our climate! (dots my dramatic effect!)
Is this signifying the back tracking “oh we never actually signed up to the manmade global warming hypothesis” cop out? Have othe news agencies around the world been coming out with similar articles?
You would have thought hat with the billions available since the scare started, this could have been undertaken 25 years ago!
Every week we get a new announcement of some effort being made to “better understand” some part of the science connected with climate. Every time I hear that I think two things…The first is that it is probably worth the effort to study and understand…The second is, of course, that I thought we understood all of this stuff already and the science is settled. I mean, if the science is settled, why blow all of this money on stuff we already understand?
I think number three: they have worked themselves into a corner with their ‘science is settled’ and see the gravy train leaving the station without them.
From my own observation of following published articles on climate science lately, there seems to be a back tracking afoot. To the real scientists, the science has never been settled. The concept of settled science is left to the politicians, environmentalists and other shysters to bark about.
When the scientist finishes with the proverbial “More research is needed” I’d like to hear the reporter ask “So Doctor, is your team saying President Obama is wrong when he says the science is settled or are you just looking to steal grant money from the taxpayers?
Science has a habit of overshooting the mark with false findings. This is not confined to climate science. There is a great announcement, lots of publicity, instant fame and fortune. Then slowly each new paper claws back the mistake. This may take years, or in some cases it has taken centuries.
In reality science has its own internal politics, as much as scientists pretend that it does not. There is a hierarchy, a ranking among scientists, and those at the top have a greater control of the narrative than those at the bottom, regardless of how correct their positions might be scientifically.
For in the end, the person at the top will seek to protect their position. And in large part this involves promoting what they believe to be true ahead of what those below them believe to be true. Because in large part, science is not simply based on truths, it is also based on faith. Faith that what we believe to be true is actually true.
Yet if history teaches us anything, it is that most of what we believe to be true will in the future be shown to be false. And 500 or 1000 years from now, science will look up our current events, and wonder in amazement that we could have been so foolish and backward. Just as we look upon the scientific beliefs of those people 500 and 1000 years ago.
Just like ENSO. Obvious research targets for climate evolution, but their little funding seeking hearts beat a blinding, deafening drumbeat; CO2, CO2, CO2 CO2!
Thank you, John . . good to see some forest with the trees . .
El nino means warming of a significant part of the Pacific ocean. Which is always going to push up global temperatures. So there is an element of tautology here.
The chart shows a correlation between precipitable water and atmospheric temperature over time, with the strongest increases in both occurring during El Niño. Is this not what we’d expect to see?
I am reminded of R. A. Heinlein’s ‘The Year of The Jackpot’.
15 intervals separate the first large El Nino from the second large one and 18 intervals separate the second large El Nino from the third large one. (The print is too small for me to read the actual dates). Possible pattern?
I figured out how to read the numbers. Interesting graph.
Nice visualization. Thanks.
A step change is evident. Will last years El Nino start another step change? A PDO/NAO oscillation on top of 300 years of warming in a 600 year cycle?
We have been on the road of cyclomania for so long.. sun driven? Planetary cycle driven?
Brighter minds than me..
Everyone has already said most of what I’d say except what is the software you used to do that graph?
I fail to see anything new in this graph. The correlation between ENSO, temperature increase, and humidity has been beaten to boredom. We also know that strong El Niños usually cause an increase in atmospheric CO2 probably due to oceanic out gassing. Am I leaving anything?
One thing I found interesting was the rather cold couple of years after the 1998 El Nino. I wonder if that same pattern will show up after the 2016 El Nino?
Those cold years accompanied the quite deep La Nina that followed the 1998 el Nino.
It seems the El Niño will be followed by multiple La Niñas. Possibly 3 or 4.
If the solar activity level is important with respect to the number, then maybe there will be 4 or 5.
I agree with the observation that the rise in CO2 may be outgassing from the rising warm water in the E Pacific. If so the pH of the water should be rising during the event. Any evidence?
nope…it’s buffered
And/or maybe Los Nadas?
“This indicates warming events due to El Niño and in greater magnitude than cooling events due to La Niña, hence we have a cumulative heat growth from El Niño events during the period in the graph.”
Surely La Nina charges upper ocean heat content, and El Nino depletes it.
Since relative temperature changes also change CO2 absorption in the ocean (warmer water absorbs less than cooler), the short term relative CO2 change in the atmosphere would be directly modified by any short term change in temperature. However, this would not be due to the CO2 driving the temperature, but the temperature driving the relative CO2 on a short time scale. This explains the short term CO2 variations.
Precipitable water (NCEP Reanalysis) 60N – 60S:
http://www.esrl.noaa.gov/psd/tmp/climindex.2.27.110.127.173.5.52.36.png
Excuse me.. 60N – 60S…
http://www.esrl.noaa.gov/psd/tmp/climindex.2.27.110.127.173.5.56.56.png
So there’s greater precipitable water during a warm AMO, which is negative NAO driven, and hence the wrong sign to associate with increased GHG forcing.
http://www.ipcc.ch/publications_and_data/ar4/wg1/en/ch10s10-3-5-6.html
What I gather from this from a solar forcing frame of reference, is that there is a increase in the water vapour component of the greenhouse effect resulting from a decrease in forcing of the climate. And it’s not just total precipitable water, there are altitude changes as well. Since the mid 1990’s, lower stratosphere and upper troposphere water vapour has decreased, while mid-lower troposphere WV has increased. That allows deeper penetration of solar near infrared in the atmosphere, and increases the mid-lower atmospheric greenhouse effect.
New link..
I found the “Carbon Budget” that seems to be a metric produced by models. Takes you from the past and into the future about 110 years. It does make me question whether the CO2 readings can be duplicated from other locations on earth. Is it true that all the entire GW/CAGW theories are based upon 1 island and 1 tree?
Informative graph, IMO. Shows how the volcanic eruptions seemed to delay or mediate El Nino’s effects. Looks like major El Ninos occur about every dozen years or so (unless mediated by other factors?) It also speaks volumes to me about how mighty the little CO2 molecule is to overcome such phenomena. Meanwhile, one little volcano fartz and throws the whole system out of whack for a few years and it is totally ignored by the 97% consensus, blind as bat, “scientists” of the political kind, The fixes are in. Only Brexit and Trump might be able to save us from the powers-that-wanna-be.
After taking out the effect of ENSO and eruptions, it is apparent that temperatures have been flat since the early 1990’s; indeed they have arguably been falling since.
This is significant. We are often told that the 17-year pause, with which we are all familiar, is solely dependent on cherry picking the big El Nino year of 1998 as a starting point.
What Santer’s study shows is that there has been no underlying upward trend in global temperatures for more than 20 years.
From Paul Homewood,
https://notalotofpeopleknowthat.wordpress.com/2015/04/18/no-underlying-global-temperature-increase-for-20-years/
Furthermore, since Solanki said that solar activity cannot account for warming beyond 1980 (& Lockwood & Frohlich later extended that to 1985) then we are talking about a scant 7 to 12 years of ‘unnatural’ warming which seems to take the form of a step change that coincides with the PDO shift from cooling to warming.
John of Cloverdale, WA, Australia.
June 22, 2016 at 5:11 am:
Except that it starts not then, but now, and goes back as far as it can, Tthey confabulate again.
Interesting that water vapor leads temp.
That seems to be the point of the graph: water vapor leads temperature by a few weeks to a few months.
The question that arises from this observation: what causes changes in the amount of precipitable water if it is not temperature?
Generation of water vapour would be affected by starting water temperatures among other factors. El Ninos start out as a body of warm water in the Western Pacific. Major ones seem to run about 15-18 years apart. When the trade winds reverse and push this warm water Eastward, some water must move into the Western Pacific surface as replacement. Where does this water come from and how does its temp vary year to year? I believe that is the next important question.
Looks to me like the kind of information Willis will find useful.
It’s also true that there is no global temperature, so these graphs are pretty meaningless.
You found “that the Average Absolution Deviation of El Niño is +0.41 while La Niña is -0.27”. That is probably true. I think that the deviation between El Nino and La Nina would be smaller, if the areas of the peaks are calculated. El Nino / La Nina is not a climate change phenomenon and nobody has been able to show that El Nino can increase any energy into the ocean or into the atmosphere.
IIRR, Bob Tisdale shows a net step-up in temperature after El Ninos. ( And here’s a tilde for grammar Nodzys: ~ )
Beautiful. Perhaps it could be regularly updated as the datasets are updated?
Interesting, but some caution is in order. The graph maker had control over scale and offset so don’t put too much weight when you see graphs loosely correlate, your eye is ‘trying’ to find patterns, its just what it does.
For example the delta-CO2 to temperature looks loosely correlated, but perhaps not significantly so (statistically speaking).
Also warmer are can carry more moisture so perhaps it’s not surprising seeing the tight relationship between moisture and temperature, only by looking at the scale of the effect is it possible to find out if this is significant.
Great effort. I had no trouble, but a white background would help. My main hope is that John B from Toronto will update it at least every 6 months. The next two years may be fascinating.
I had some difficulty reading it until I copied the image into GIMP2(free photoediting software) and inverted the colours , giving a white background, then used the Levels in the Colour Tool to increase the readability .
No doubt the various Windows programs would do the same , I just wanted an excuse to play with the recently downloaded software.
It did appear however that the only occasions when large La Ninas follow El Ninos is when there is a near equatorial volcanic eruption coincidental with the El Nino as with El Chichon and Mt Pintaubo (17N and 15N respectively). It might suggest that the coming La Nina will be modest in global temperature amplitude.
This just leaves the question of the La Nina of 2008 . Previously when I have seen the global temperature graphs here , they have had a smoothing filter applied which gives the impression that the La Nina appeared from a flat background. However this author , as did others earlier this week , has supplied the monthly unfiltered data on his chart from which you can see that there was , to my untutored eye, a very short lived but quite strong preceeding El Nino.- too short lived perhaps to affect the smoothed result.
Hi Mike
Can you post it please, thanks
What is the point of the graph?
The text is nearly unreadable. It seems there are a large number of lines. Without some explanation, how is the viewer supposed to decipher the graph?
All we are told is:
“This indicates warming events due to El Niño …”
Well known to anyone paying attention to climate science.
“… cooling events due to La Niña …”
Well known to anyone paying attention to climate science.
” … cumulative heat growth …”
Well known to anyone not living in a cave.
So what is the point?
I’d ignore it and just not say another word if I felt like that.
Pretty presentation, but mostly unreadable on my elderly monitor.
Such is the progress of technology that I was able to look at it on my Win 8 Nokia phone – and expand it as I saw the need.
John B: I can buy into your hypothesis that the accumulated extra heat from all the El Ninos can show a net gain in time if the losses from La Ninas cannot cancel it out. It looks to me, from the chart that the next La Nina could well bring temps back to whatever is considered the norm. Which raises the question in my mind: whatever will the greenies make of a change in temp of 2 Deg C – down? Will they tell us how dangerous that is?
They did during the 70s.
skepticism of AGW requires that energy be created ex nihilo….
[No, it doesn’t, that’s just your distorted viewpoint – Anthony]
Mosh, with all due respect, you must learn to quit when you’re ahead. Snark ill becomes you.
All AGW requires is a variation in cloud cover (for one thing).
As I drive on the left, I guess I managed to miss your drive-by, Mosh. Not that it matters, it wouyldn’t have done much damage as it was typically cryptic – and worth the ‘nihilo’ – nothing.
Mosh
“skepticism of AGW requires that energy be created ex nihilo….”
“When the planet warms it will still exhibit patterns of warming and cooling”
Contradict your self much.
If it can have warming and cooling patterns when it warmers it can do so when it cools as well. Energy doesn’t have to be created either it can be stored and released as well. By the way your precious AGW forcing is essentially just a storing of energy as well not a magical forcing and it is minuscule in comparison to other natural storage phenomena.
AGW is an argument of post hoc ergo propter hoc! A logical fallacy and more Latin to boot!
Mosher, skepticism of the skepticism of AGW requires that the earth be in a stable equilibrium.
Your move.
So, Mosh, this is the next propaganda fib from the warmunistas, eh. Well good, because it leads you all into interesting territory…..
If temperature indeed follows water vapour content as the graph seems to show (look at the blue and yellow points in the graph, when the blue line goes up, a bit later the yellow line goes up), then the question remains: what is the cause of the quantity of water vapour in the atmosphere?
If CO2 should make sea temperatures rise, this initial rise of temperature is followed by extra evaporation (all other factors remaining the same) and this graph shows that in case of extra water content automatically COOLING will follow.
So the initial warming will not will be followed by an EXTRA rise of temperature, as assumed by IPCC and the model makers. But, the initial CO2 warming effect is DIMINISHED by water vapour.
And not enlarged.
A transmogrified version of John B’s graph is at the link below. This was a result of ‘messing about’ with an image editor and is more “different’ than ‘better’ but may be useful. Some notations have been expanded.
This is still fairly garish and hard to follow but some lines are easier to see and some will be harder. Depending what you want to see this one may work better.
The original graph appears to be of significant value, but ‘needs work’ in the presentation area to make it easier for people with eyes like mine [ 🙂 ] to follow it all easily.
Graph is at -> http://bit.ly/johnbensograph
Russell McMahon
Thanks 🙂
Here’s a thought…
* back in the 1970’s the “Ice-Age-Is-Coming” scare was fed in part by models showing that increasing aerosols in the atmosphere would reflect away more sunlight, causing a temperature drop
* El Chichon and Pinatubo dumped large amounts of aerosols into the atmosphere
* I remember Toronto regularly getting smog alerts during summers in the 1980’s and 1990’s
Then “stuff happened”…
* The EPA did its real job, and cut down particulate emission limits for cars and industries
* The US (and southwestern Ontario, too) “rust belt” happend as North American industrial production was outsourced to China, etc. This was not merely a transfer of pollution sources. Old more polluting factories in North America were replaced by newer factories in China. Yes, they still pollute, but not as much as the 50-year-old factories they replaced.
* With the downfall of the USSR, a lot of older, badly polluting factories were shut down. Crafty EU politicians ensured that the Kyoto Accord timing straddled that period. Thus the EU “greatly reduced it’s pollution” (both aerosols and CO2) by merely sitting on its hands while old polluting factories in the former East Germany were shut down.
* The economy cratered in 2008, and hasn’t fully recovered yet. More declines in manufacturing, industial activity, air and road travel, etc, etc. This was accompanied by a corresponding decline in aerosol emissions.
* Speaking of air travel, todays jets are much more fuel-efficient, and carry more passengers. Net result; much less emmisions per passenger-mile.
* No big equatorial volcanoes shooting off into the stratosphere recently.
Simple logic…
* more atmospheric aerosols == higher albedo == lower temperatures
* fewer atmospheric aerosols == lower albedo == higher temperatures
One vital thing I discovered from my GIS (Geographic Information Systems) classes and making maps, legends, charts, graphs, etc.
You must view your work in different media and on multiple computers/monitors.
Something can look great printed on paper, or on a computer monitor, or displayed through a projector, but it rarely looks good or is legible on all three.
I had some great looking work that ended up looking horrible when presented as a PowerPoint to a group of people using a projector.
John B,
I think that signal analysis types are best suited to rummage through the data. The don’t have any biases.
1) Temp and Precip correlate. OK Well understood.
2) [CO2} is rising with seasonal variation. OK
3) {CO2} increase anomaly seems to look like temp anomaly. Warmer temps evolve more CO2 from oceans so, OK.
4) El Nino rate > |La nina rate| so, Overall temp increase is cumulative due to El nino onset. Interesting.
Comments
1) Great work. (you must have no young children)
2) The predominance of the background red/green color imparts a cognitive bias in my mind.
3) Is there a lag between precip and temp?
4) Good on Anthony Watts for enabling this kind of contribution.
Nice work, but I think I see some potential problems: (1) Variables that autocorrelate (e.g., have similar time trends)? (2) Use of a derivative for one variable? (3) Possibly less than ideal data filters? This may be well-disguised wiggle-matching. I sure hope not. I appreciate the huge amount of work involved. The graphic legibility is not as bad as some allege here. Yes, it takes an effort to grasp it all, but it accomplishes its intended purpose.
“This indicates warming events due to El Niño and in greater magnitude than cooling events due to La Niña, hence we have a cumulative heat growth from El Niño events during the period in the graph.”
El Nino is a pattern of warming. It is not the cause of warming.
The planet does not warm on its own. Energy is not created out of nothing. The planet warms when there is an energy imbalance. The cause of the imbalance is forcing from GHGs. When the planet warms it will still exhibit patterns of warming and cooling. We name the patterns. They are the warming not the cause of the warming.
=========================================
[Gosh, this is what happens when Mr. Mosher tries to speak from authority.
NOAA’s Climate Prediction Center defines it as:
The California government website defines it as:
No mention of CO2 forcing there. It’s simply change in the wind pattern, and it’s been going on for millenia, well before CO2 forcing became an issue. it seems this paleo study of old piles of shells reveal ancient El Niño patterns: http://science.sciencemag.org/content/345/6200/1045.abstract?sid=3a410601-4f01-470b-b7ac-72d61ccfe5a0
Mosh, as they say on Mythbusters: BUSTED -Anthony]
Stephen Kosher
You’re talking through your hat! The measure of warming you are using is limited to near earth atmospheric temperatures. If you can’t imagine the quantity of heat held in atmospheric water vapour, the land masses and the oceans, then there is no point in your being here. Acting smug in the process just calls into question your motives and intellect..
Sometimes I actually like Mosh’s comments and contributions but we all have confirmation baises. On this day, he has clearly indicated his belief in the effects of GHG. That is good. We know which corner he is in and still I sometimes find gems in his comments and others of his belief. I am biased too. I studied engineering, geology, weather, history, astronomy, fluid dynamics and the water cycle along with a few other things like biology and microbiology (even one course under Suzuki no less) that made me skeptical from the start. That is my bias.
On another thread there was discussion of warming and cooling – perhaps Patrick Moore’s – that caused me to look this up on long term cycles:
http://www.ncdc.noaa.gov/paleo/abrupt/data2.html
Now I have to follow this: http://co2coalition.org/
Thanks A and WUWT. There is almost too much information here to digest, especially if you go read the links. Don’t know how some people do it. I try to keep and open mind but my guess is this issue won’t be resolved in my lifetime or even those of the youngest of readers here.
Nice graph from the perspective of there being many, many inputs to climate.
On a fine scale gifted by direct observation and unperturbed by ice core smoothing, we may be seeing the peak of the current interstadial. But what we don’t see if we could pan out is this:
http://nas-sites.org/americasclimatechoices/files/2012/10/Figure-14.png
https://nas-sites.org/americasclimatechoices/more-resources-on-climate-change/climate-change-lines-of-evidence-booklet/evidence-impacts-and-choices-figure-gallery/figure-14/
Even then, when panned out, we need to be aware of issues with the ice core data at the top:
http://digitalcommons.library.umaine.edu/cgi/viewcontent.cgi?article=1023&context=ers_facpub
At the middle:
https://www.researchgate.net/publication/268687179_A_review_of_the_brittle_ice_zone_in_polar_ice_cores
And at the bottom:
https://nsidc.org/data/docs/agdc/nsidc0202_wahlen/
Looking at the ice core data, I think it reasonable to suggest two conjectures: 1) That over the long term, increasing temperature is a prelude to decreasing temperature, and 2) The source of this long term increasing air temperature beyond the noise of weather must be coming from an entity that has hoarded it sometime in the past chilling the air, and is now releasing it warming the air, and does so an a long term pendulum scale.
My flight of fancy: That last conjecture leads me to peg the oceans as that entity, being large enough to hoard a whole lot of heat incrementally, and having the known capacity to release heat incrementally, warming the air and land near it.
I was thinking of something earlier today that is related. Isn’t any warming most likely a simple matter of having a greater level of positive ENSO region conditions versus negative ENSO regions over a 30 year cyclic pattern? That is what I see when viewing the MEI long term graph.
The positive ENSO conditions move masses of moist warmth air that are then carried to other parts of the globe. Any region which gets covered by the moving warm mass builds up heat during the day, as the blanket above limits the ability to shed the daily incoming solar energy. This is how heat builds up in the system. An example of what I am seeing would be the current extra warmth being experienced in a heat wave in the Southwest over the last week or two, and still ongoing. Although the current wind pattern is shifting slightly as compared to the last several weeks. Look at the surface wind patterns which are moving from warmer regions northward into the Southwest. Those surface winds are moist and warm, and a heat wave forms…https://earth.nullschool.net/#current/wind/surface/level/overlay=temp/orthographic=-105.39,42.10,819/loc=-122.896,40.434
It looks like the high pressure system responsible for the Arizona heat wave has moved a little west into the pacific, instead of moving east as the forecast predicted.
Now the jet stream is running along the U.S./Canadian border and bringing strong thunderstorms to the Great Lakes area. The center of the U.S. is starting to heat up and dry up.
https://earth.nullschool.net/#current/wind/isobaric/500hPa/orthographic=267.02,28.84,224
NOAA forecast that the central U.S. would be cooler than both the east and west coasts of the U.S. for the entire summer. I hope they are correct, but I don’t see it happening yet. Would love to see it. It was 105 heat index today while I was out mowing the lawn. I would prefer it a little cooler. 🙂
May and June have been very nice here in No California. Temps have held mainly average to below average. Plus there have been some decent rains. The surface winds off of the coast have been pushing south down the coastline for over a month. That leads to the night time temps dropping into the high 40s or low 50s. A hot day is easier to take when the night cools down like that…https://earth.nullschool.net/#current/wind/surface/level/orthographic=-107.15,42.03,819
Why is a chart like this inconsistent with the AGW theory? I am not an expert in this area. And I am not on one side or another — if anything I am a “skeptic”. But I am wondering what the rational response is to a hypothetical statement from an AGW advocate like this: “all this chart shows is generally rising temperatures, and generally intensifying El Ninos — in other words, a warming world, both in the air and in the oceans. Just what we’re talking about. And if the ‘deniers’ want to say that the bigger El Ninos are causing the warmer air, well, what is causing the bigger El Ninos?”
Dave,
“… I am wondering what the rational response is to a hypothetical statement from an AGW advocate like this: “all this chart shows is generally rising temperatures, and generally intensifying El Ninos …”
The chart is displaying a rather small temporal span during a generally warming period, for which there is information available to produce a chart like this. A similar chart depicting similar things during a cooling period, could render the same question in reverse, hypothetically, and there was a brief “global cooling” scare after such a spell . . right before the “global warming” scare began to heat up, so to speak ; )
This chart is displaying some details regarding the “process” of warming, and ought not be seen, I feel, as explanatory regarding “what is causing” the . . oceanic percolation if you will, to rise or fall over a relatively short span of time.
In broad terms, it’s the heat (light) from the sun of course, causing turbulence in the earths hydro/atmosphere (with some geological influences, like those two prominent volcanic events that seem (to me) to dampen the atmospheric temperature response to the concurrent El Nino . . “bubbles” . .
Good question. However, previous long term temperature reconstructions (that can be seen in the chart I displayed) do not indicate anything is amiss with the current warm period. And certainly cars cannot be blamed for previous epics.
The case for AGW is somewhat magical. Here is their case: Whatever caused the rise and fall of previous epics has been disrupted by the current mix of natural and anthropogenic CO2, which only the human-sourced CO2 is the culprit of that disruption. That seems implausible. To cause such a rise and fall over repeated epics seems to me to be something quite big. The small percentage of CO2 attributed to cars just seems, well, tiny in comparison to the graph.
+ many. Nice summary.
Neat! Thank you very much, John B.
2002 to 2009 is an interesting slice where the lack of correlation among pretty much all the the plots is fun to ponder. How many other slices (and how long would the slices be) that resemble 2002-2009 could we find with 1,000 years of data? Hard to say what even 100 years would show.
P.S. Yes, the image must be enlarged to start seeing all the goodies, but we were warned up front, so pony up and find a bigger screen, even if you have to beg, borrow, or steal. I’m going to see if I can get it on my HD TV screen. I have poor eyesight and I know I’ve missed stuff even on my decent-sized work monitor with my nose 3 inches (75mm) away.
I find myself using two sets of reading glasses for when I want to view fine detail. I suppose that I should get a nice magnifier on a head band to make life easier.
Another signal for John – ENSO appears to have a ~60 year periodicity. The same ~60 year cycle also appears in the AMO, PDO and HadCRUT 3v. I mention it because your of interest in ENSO signal processing, because in the shorter time frame of your data the ~60 year periodicity won’t show up.
The ~60 year cycle is of course well known, but despite being responsible for about 40% of temperature rise last century (because of the choice of start year and end year) it isn’t included in the IPCC ensemble models. Which is curious.
Something seems a bit off with the temperature which looks Karlised as others have noted. But I do like the way of plotting Ninos and Ninas using color bands which I think is the main point of this graph. It is also the reason for choosing a black background.
What I found interesting is that the El Ninos seem to lag temperature rises not lead them. And the nature of the temperature fall after an El Nino seems unrelated to whether or not there is a subsequent La Nina. To me the graph does not illustrate El Nino driven warming.
There is an obvious relationship between ENSO and temperature, but since ENSO is defined in terms of temperatures this is somewhat unsurprising. What it shows beyond that is unclear.
For those having trouble viewing this graph, I have posted a somewhat toned down version on my blog here: http://wp.me/p4MyHW-eo
Caution, it is a large file. I have changed nothing other than the brightness / contrast and the Hue / Saturation. It might be a little helpful for some to be able to view it a little easier.
John B, I hope you are not offended by my taking it on myself to do this. My eyes are more fuzzy than they used to be and adjusting it made it better on my monitor.
Thank you wyo, that’s much better.
That’s too short arecord to tell us anything about multidecadal, let alone millenial co-variation. For what it’s worth, cross-spectral analtyis of (UHI-uncorrupted)global temperature average and Maina Loa CO2 concentrations shows that CO2 variations either log those of emperature or are incoherent.
So much for the moshed-up notion that GHGs are the driver!
I agree that it is too short a record – anythnig shorter than about 100 years is too short, yer the alarmists seem fixated on temperatures since the 1970s. I was interested in your statement that :-
“cross-spectral analtyis of (UHI-uncorrupted) global temperature average and Ma[u]na Loa CO2 concentrations shows that CO2 variations either l[a]g those of [t]emperature or are incoherent. ”
Could you please tell me where I can find details of that ? Of course, Mauna Loa CO2 only goes back to 1959, but I find that Berkeley Earth global land & ocean temperatures (which are of course affected by UHI) and Mauna Loa CO2 from 1959-2015 are correlated (correlation coefficient = 0.924)
I did the cross-spectrum analysis for a client several years ago on a privileged basis. The results are not in the public domain.
Inasmuch as BEST’s temperature projections show a strong trend since 1959, they will exhibit strong correlation with any variable strongly trending at the same time (e.g., California real estate prices). Unlike frequency-dependent cross-spectral coherence and phase, such correlation can provide no unequivocal indication of physical relationship between the two variables.
Brilliant graph, John B from Toronto! Great work.
Another nail in the AGW coffin.
Kudos
ps_ White backgrounds are lame. Very nice graph.
I find white backgrounds with black text and black or coloured lines make the text and lines stand out more. They are also easier to print out without getting a lot of ink on the paper.