I covered a similar study back in 2008 which you can read about here. This study takes it to a national level, suggesting once again that surface temperature records are not really measuring a “climate change” signal in entirety. The author of the study says that “correlation of temperature above background levels and national energy consumption is very high”. Seems like a no-brainer to me. This has far reaching consequences for the validity of the surface temperature record and its ability to discern a real CO2 induced climatic signal. – Anthony
Larry O’Hanlon writes on the AGU blog:
The greenhouse effect isn’t the only thing warming things up. There is also the waste heat released when we generate and use energy – even clean energy. Yet the regional impact of that heat – which moves from warm buildings, engines and power plants into the world around us – has not been well accounted for. A new study now shows waste heat may explain some temperature variations at a national scale better than do global climate change models.
“This is a major source of climate change that has not been looked at,” said John Murray of The Open University in Milton Keynes, England and lead author of the new study accepted for publication in Earth’s Future, a journal of the American Geophysical Union. “Any kind of energy consumption generates heat” Murray said.

To tease apart the waste heat signal, Murray and co-author Douglas Heggie of the University of Edinburgh compared national temperatures in Japan and the United Kingdom with global temperature trends and with energy consumption from 1965 to 2013. They focused on Japan and the U.K. because as island nations, they are more isolated than mainland countries and more likely to stew in their own waste heat.
The researchers found that for both countries, waste heat explains national climate variations: national temperatures track better with energy use than with global temperature trends. The data showed a correlation between a temperature drop in the U.K. and the current economic recession, which has caused a reduction in energy use there, Murray said. The study also found Japan’s steadily growing energy consumption parallels the worldwide increase in carbon dioxide levels.
The scientists caution that both countries are rather extreme cases: Japan has the 8th highest mean energy consumption in the world and the U.K. has the 13th. Of the two nations, Japan has a warmer climate and therefore less need to heat buildings.
Britain, on the other hand, shows a more pronounced local temperature variation, being a cold enough place to require indoor heating for about six months each year. There is also more cloud cover in the U.K. than in Japan, and those clouds hold waste heat closer to the ground, where it can raise the temperature.
“The correlation of temperature above background levels and national energy consumption is very high,” concluded Murray. This suggests that energy consumption should be factored into the national climate change projections of any densely populated country, he said.
The study:
From Urban to National Heat Island: the effect of anthropogenic heat output on climate change in high population industrial countries
John Murray, Douglas Heggie
Key Points:
• Annual heat output for the U.K. and Japan is determined from national energy consumption 1965-2013
• Strong correlations are found between energy consumption and temperatures above or below global background levels
• Heat output may affect climate change in countries of high population density
Abstract
The project presented here sought to determine whether changes in anthropogenic thermal emission can have a measurable effect on temperature at the national level, taking Japan & Great Britain as type examples. Using energy consumption as a proxy for thermal emission, strong correlations (mean r2 = 0.90 & 0.89 respectively) are found between national equivalent heat output HO and temperature above background levels ∆t averaged over 5 to 8 year periods between 1965 and 2013, as opposed to weaker correlations for CMIP5 model temperatures above background levels ∆mt (mean r2 = 0.52 & 0.10). It is clear that the fluctuations in ∆t are better explained by energy consumption than by present climate models, and that energy consumption can contribute to climate change at the national level on these timescales.
Introduction:
It has long been known that within large cities, thermal emission from heated buildings, industry and transport can contribute to a microclimate up to 12°C warmer than background levels in the surrounding area, a phenomenon known as the Urban Heat Island (UHI) effect (Howard, 1833, Arakawa, 1937, Oke, 1973, Knight et al., 2010).
However, some of this heat difference is attributed to contrasts in evaporative cooling and albedo (Taha, 1997), absorbed and re-emitted solar radiation (Rizwan et al., 2008), and convection (Zhao et al., 2014). Here we consider thermal emission alone, but our study is not restricted to cities, but extends the concept to encompass heat generated by entire nations, thus including heat from smaller urban areas, rural districts and transport networks.
Weather systems do not respect political boundaries, so heat generated in one country could affect nations downwind. Japan and Britain are particularly suited to such a study, both being high population-density island nations largely isolated from the heat output of neighbouring countries by the surrounding ocean
…

 …
…

 …
…
Discussion and conclusions
Both countries are rather extreme cases, Japan having a mean annual energy consumption per unit area 1965-2013 of 1114 toe km-2, the 8th highest in the world 1965-2013, and the UK 870 toe km-2, the 13th highest (Statistical Review of World Energy 2014). Of the two nations, Japan has a warmer climate and consequently lower
heating requirements, and 60-65% cloud cover (Norris and Wild, 2009). However, Japan’s more consistently increasing energy consumption parallels world CO2 levels, meaning that the correlations with ∆mt are consistently higher than the UK, so the distinction between the two models is not so pronounced. Britain is better suited to this study, being cold enough to require ndoor heating for about 6 months per year, and with 75% cloud co er (Kontoes & Stakenborg, 1990), meaning that less surface-generated heat is lost by radiation. Most importantly, Britain is a country where annual energy consumption has fallen significantly as well as risen during the time period considered, so that the greater effect of heat output than other causes on UK temperature can be more clearly distinguished (Fig. 4, left).
The reliability and importance of our conclusions does not rest on the probabilities returned by our statistical tests, significant though these are by conventional standards:
- First, our hypo hesis was not suggested by the data, but by its qualitative reasonableness.
- Secondly, our results are reproducible, in that our statistical study of the UK data was completed, and the results noted, before testing our conclusions by consideration of the Japan data.
- Third, we carried out no other statistical study of these or any other data sets.
- Fourth, the effect seems large, in that variations of heat output correlate (Fig.2, bottom row) with temperature changes of a few tenths of a degree.
It may seem that, reasonable though it is, our hypothesis is harder to justify quantitatively, in the sense that heat output (of order 1 J m-2 s-1 ) is much smaller than insolation, by two orders of magnitude. On the other hand, what is at issue is the relative importance of fluctuations in these quantities.
The fact that the statistically significant results require averaging over several years is due to the small area of the Earth’s surface being sampled in both locations. At this scale, temperatures vary widely from one year to the next compared to world values (Figure 1, left).
Our results are strong evidence that changes in energy consumption contribute to temperature change over sub-decadal timescales in the two nations considered. Britain has experienced a drop in temperature of about 0°.5 C since the early years of the millennium (Fig.2, lower left) at a time when world temperatures have remained virtually stable, whereas Japan experienced a rise in ∆t of 1°.0 C between the early 1980s and 2000 (Fig.2, upper left), double the world rise in temperature over the same period.
Both these changes reflect changes in energy consumption in each country.
These conclusions might be perceived to be in contrast to recent studies of the UHI effect that relate to large cities, where warming of only ~0°.1 per decade or less is detected compared to nearby rural districts (Jones, 2010, McCarthy et al., 2011).
However, such studies are designed to detect urban/rural contrasts, not the effects of overall increases or decreases in heat emission in entire nations. UHIs are most pronounced in calm weather (Oke, 1973, Wilby, 2003), and are best measured at such times (Knight et al., 2010). Under average conditions, generated heat will drift downwind and may affect rural weather stations (Parker 2010). In addition, the problem of nearby road and urban development at long-lived rural control stations, which may have affected recorded temperatures, is discussed by Hansen et al. (2001). Certainly in Japan, Fujibe (2009) detected temperature anomalies from towns of population less than 1000.
Because anthropogenic heat is generated close to where temperatures are measured in both countries, we have not used a climate model to investigate the transport of such released heat further afield. Early attempts to do this globally found temperature variations of a similar order to the model’s natural fluctuations (Washington 1972), and Flanner (2009) found no significant effect for the present day. Oleson (2012) used CMIP5 simulations to model future changes in urban minus rural temperatures in response to changing climate over the 21st century, rather than the effects of changing energy consumption. More recently however, Zhang et al. (2013) despite including only 42% of world energy consumption in their model, found significant winter and autumn temperature changes up to 1° C in mid- and high- latitudes, far from heat sources, that correspond well to areas of previously unexplained differences between observed and modelled temperatures. Chen et al. (2014), entering anthropogenic heat flux into a refined model that included long wave radiation, found higher and more widespread increases over standard models: 1°-2° C in mid- to high-latitude areas of Eurasia, North America and parts of the southern hemisphere, and concluded that anthropogenic heating is an important factor in global warming that should not be ignored. Our study is the first of its kind that provides direct observational evidence of this.
If projections of energy consumption prove to be true, then future contributions of anthropogenic heat to climate change in Japan and the U.K. will have fallen by 2040. Japan is predicted to have an 18% fall (U.S. Energy Information Administration 2016), corresponding to a temperature drop of about 0°.3 C, and the U.K. a 3% fall (U.K. Dept. of Energy & Climate Change 2015), producing a negligible drop in temperature.
Read the entire open source study here: http://onlinelibrary.wiley.com/doi/10.1002/2016EF000352/epdf
Wot?!!! Millions upon millions of heaters being used in Winter, same with ACs in Summer, – millions upon millions of machines all giving off waste heat as they transport us/feed us/manufacture things for us etc etc.
I mean how could that possibly have an effect on anything?
Wot on earth is “waste heat”?
Don’t know if you’re being serious there Sparks…but just in case…
You know how your car is a machine for getting around in? And you know how it burns gasoline for power, yea? Well not all of that gasoline is turned into motive force, so you know the ‘radiator’ bit at the front?…well that’s where the car’s motor expels ‘waste heat’ from. See?
If heat is used and there is excess, what happens to the rest? is there some sort of crazy land where all this “waste heat” meets up and forms some sort of mob? (oh noes their coming to get us) or are you just talking balls again?
That’s very insulting Charles, there is no such thing as “waste heat”
Canadian here. Waste heat is what escapes the house when we go in and out. Capital offense when I was a kid!
And so it should be in that sense. good point.
@Sparks:
https://en.wikipedia.org/wiki/Waste_heat
Are you next going to tell us there’s no such thing as Wikipedia?
Are you going to tell us something so boring like How they defined “waste heat”? seriously…
Did they use the term “leaky heat”, “useless heat” or “smelly heat” I’m bored and too busy.
Uh…Sparks. If you burn oil say to heat your home, and your home is well insulated, you could say that you weren’t ‘wasting’ much ‘heat’. Did that help any?
The point of insulating your home is to better conserve energy by preventing excess heat from escaping from that environment.
Sparks,
waste heat comes from air conditioning.
or rather the energy used.
Energy in -> work done -> Excess heat out ->
Excess heat will always be warmer than its environment. “waste” and “heat” are not compatible and is an ignorant term.
Sparks:
All use of energy by mankind involves conversions. The sheer effect of converting a substance into usable energy involves reactions that are only partially efficient.
Virtually all if not all energy conversion inefficiencies much of the inefficiency is lost as waste heat. Whether as friction, condensation, expansion, contraction, vibration, sound or even just heat emission, anywhere from 5% to 95% of the energy generated from a fuel is lost to waste heat.
While working at the steel mill, the mill used a process called ‘waste heat’ to utilize the heat losses from processing iron melt into refined steel.
Fans pulled exhaust fumes and air from the tops of the furnaces, through an underground maze of flues to trap dust and particles; then through final phase steam pipes called the superheat tubes, through a large boiler converting water into steam and finally out the exhaust filtration stacks.
This process uses the superheated steam, i.e. steam converted fully into a very hot gaseous form, through turbines generating the electricity powering the ‘Open Hearth’ portion of the plant; including the scrubbers cleaning the final exhaust from the open hearth.
Sounds efficient? Well, it is reasonably efficient for a blast furnace operation; but there is substantial losses through energy conversion, H&8322;O, mineral and metal phase transformations, vibration, sound, and other loss processes.
I believe there is a misnomer regarding use of the term waste heat. From an engineering viewpoint waste heat is the heat energy dumped into the atmosphere because there is no usable energy left to to economically make something happen with the heat. When energy prices go up companies invest in hardware to extract and use more of the heat. Stacks emit heat into the atmosphere, they would not work if the gas temperature is the same as the surroundings unless the gas is a lower density for reasons other than temperature.
Charles is correct in that the engine exhaust is an example of waste heat.
In actuality the energy that is used to propel the auto also ends up as heat dumped into the air. Virtually all energy usage ends up as heat. Exceptions would be something like energy used to make a chemical change where the final composition is storing more energy. All light in your house is turned into heat even for the more efficient bulbs. If we install solar collection devices on our rooftops or in the atmosphere excess heat is being trapped initially as electricity, but it all ends up as heat on the planet which ultimately gets radiated into space.
Virtually all the energy we burn or use will add heat the planet, not just waste heat. The question is whether or not it is significant relative to other heat sources such as the sun and how much gets radiated into space.
Waste heat is a by product of Thermodynamics.
You keep saying the word “Thermodynamics” and “waste heat” in the same sentence as if you have a point.
There is in fact, no such thing as “wast heat”
Perhaps you are confusing waste heat with heat loss. Condensing power plant efficiency can be as low as 30%; ie the overall coal to kilowatts efficiency. For a regenerative cycle the cycle efficiency is 44%, the turbine efficiency ratio is 81%, the net turbine efficiency is 36%. If the generator efficiency is 98%, the turbo-generator efficiency will be 35%. A boiler house efficiency of 85% gives an overall efficiency of 30%.
If 4% of the current generated is used to drive the auxiliaries, lighting,fans, pumps etc., the net overall efficiency will be 28.7%.
Finally after transmission losses the power is used and becomes low grade heat.
High grade heat in fuel becomes low grade heat in the environment.
In the CPI waste heat is high grade heat that is recovered in a waste heat boiler. The steam raised is expanded through a pass out turbine generating power but primarily it provides steam at 30psig for process heating. I don’t know what your background is but you do not seem very well informed or know anything about anything.
Excess heat which was used to power a turbine kinda refutes your assertion of “waste heat” but then again you have also claimed that I’m not very well informed to know anything about anything, so in conclusion, it appears your comment is self evident. 😉
The terminology in the CPI is – ‘waste heat boiler’. In the past, large amounts of heat generated in processes (heat of reaction, combustion etc.) would be discharged to the environment via cooling water and cooling towers. As energy costs increased a case could be made for heat recovery and re use as I described in the previous post.
‘ In the CPI waste heat is high grade heat that is recovered in a waste heat boiler. The steam raised is expanded through a pass out turbine generating power but primarily it provides steam at 30psig for process heating. I don’t know what your background is but you do not seem very well informed or know anything about anything
“Waste Heat”
Forgot to tick the ‘notify’ box.
Heat that serves no human purpose
There’s already a word for that, it’s called cold, maybe we could use the term “waste cold” too lol
there is no such thing as “waste heat”
=============
take the time to educate yourself:
https://en.wikipedia.org/wiki/Waste_heat
Waste heat is by necessity produced both by machines that do work and in other processes that use energy, for example in a refrigerator warming the room air or a combustion engine releasing heat into the environment. The need for many systems to reject heat as a by-product of their operation is fundamental to the laws of thermodynamics.
I enjoy keeping you guys on your toes, I particularly liked how ATheoK gave the analogy where his steel mill used excess heat to produce energy while arguing for the misnomer “waste heat” term, correctly pointed out by ‘catcracking’
The fact is, there is no such thing as waste heat, throw all your wikki links away, there is however ‘excess heat’ or ‘transient heat’ moving from one state or system to another. maybe our good friend fredberple should educate himself on what a temporary aperture actually is lol
Waste heat is a combination or all the energy that:
1. Does not make it into the use intended, such as heat from a power plant and distribution power lines, and
2. All the energy used for something after that use, such as heat from a toaster or electric arc furnace.
In other words, all the energy produced!
BTW, I’d be interested in knowing whether North Korea has shown any lower temperature rise than the rest of the world. I expect that the satellite record could tell us if their tiny use of energy has made a temperature difference compared, for example, to South Korea.
Excess heat, there is no such thing as “waste heat” 😉
“Well not all of that gasoline is turned into motive force,” Just add that all of that “motive force” (mechanical energy) also ends up as heat.
This is a very interesting article for those who are contemplating the purchase of a Tesla car.
Imagine, this car with emit waste energy from its tires, just like any other car of the same weight.
I like this article.
A Tesla car gets its electricity from a power station. The internal combustion engine as apower source is much more efficient than a power station.
Sparks, please stop recommending the term “excess heat.” As you know, in English, the term “excess” implies that some heat was desired but too much was delivered. In many applications, no heat is desired but some is delivered anyway because of the laws of thermodynamics. So you can’t call that “excess heat.”
Waste heat is a reasonable term to describe the inefficiency in power systems. If a 100W lightbulb is 7% efficient then 93W go straight to “waste heat.” I think you know that.
No, your terminology of “waste heat” is incorrect in context, we are dealing with energy conservation, so when too much energy is introduced into an environment it is called “excess heat”
Your own explanation in plain English says “the term “excess” implies that some heat was desired but too much was delivered” which is correct.
Heat that isn’t being used for what he silly humans think is useful.
The lack of knowledge of heat engines, thermodynamics and physics on a leading science blog is quite concerning. As some contributors have pointed out a little basic reading wouldn’t go amiss.
Subscribed 🙂
You have to also remember, some people think air conditioners COOL the environment, not realizing it simply moves the heat outside, while adding some of its own to do so.
I kid you not, I had a conversation about this a week or so ago.
You are correct sir! Also, the hotter it is the more heat your a/c produces trying to move it!
I was telling a friend about when I was asked to install an electric shower for someone, I told them that they needed a plumber to install a water mains to the fixture and I will wire it up for them, and they actually said why do you need water going to it if it’s an electric shower… honestly I thought this was a blatant display of stupidity, well, until the friend I was telling this to said “really? do you need water pipes for an electric shower?, I never thought about that”.
the long term drop in north eastern US temperatures can be best explained by the reduction in industrial manufacturing and the migration of people to the south west.
Looks like Sparks has managed to de-rail another conversation.
Well the warmistas will spin this as man-made global warming/climate change, even if it isn’t due to GHGs.
Mosh and others aren’t going to like it, though.
Gcm don’t have regional skill so nothing much of interest there. If they want to compare to models they should have used ecmwf. Since we have good waste heat gridded data I don’t know why they used energy consumption. In any case they used hadcrut which is rarely a good choice for islands because of the 5 degree grids. U end up with tons of SST data . The 1 degree hadcru ts or Berkelegy is better.
“Gcm don’t have regional skill”
Well, that’s generous Steve 🙂 What sort of skill are you proposing they have? I mean, can’t we just cut to the chase and say “GCM don’t have any skill at all”, we couldn’t even find it under a rock”?
I didn’t feel being more humorous than “under a rock” would be appreciated by our moderators.
Since that went to moderation anyway, it should be “didn’t have any [s]kill at all”.
Feel free to correct it before publication?
Thanks,
Bartleby
The models operate on smallish cells in small time slices. In other words, they work on lots and lots of bits of local weather. Those bits of local weather are aggregated into regional climate, before finally being aggregated into global climate. We know the climate models have no local skill. Obviously, as Steven Mosher has confirmed, aggregation of skill-free local results into regions will have no skill. What blundering nincompoop ever thought that aggregating skill-free regional results at the global level could possibly have some skill? Climate models have no regional skill, therefore they have no global skill.
“Well, that’s generous Steve 🙂 What sort of skill are you proposing they have? I mean, can’t we just cut to the chase and say “GCM don’t have any skill at all”, we couldn’t even find it under a rock”?
I didn’t feel being more humorous than “under a rock” would be appreciated by our moderators.”
They have continental skill and global skill.
remember skill doesnt imply perfection.
The use of “energy consumption” is appropriate. As all of that energy ends up as heat. I would have expected that you would have had at least a reasonable grasp of high school physics.
“What blundering nincompoop ever thought that aggregating skill-free regional results at the global level could possibly have some skill? Climate models have no regional skill, therefore they have no global skill.
Too funny.
You can have zero skill at the regional and perfect skill at the global.
Example: A model predicts the NH will warm by 5 degrees and the SH will cool by 5 degrees.
Observations show Cooling in the NH by 3 degree and warming in the south by 3 degrees
The hemipsheric predictions are wrong, but the global has skill.
Zero skill at the hemispheric level, perfect skill at the global level. since the global warming is
0 in the model and 0 in the observations.
“Gcm don’t have regional skill”
Translation: If we average together enough wrong answers, we will get a right answer.
Mosh will come up with some crap about models and “gridded waste heat”
Hush. Let’s hear what Mosh has to say BEFORE we tear it to ribbons.
Or “regional expectation” 😉
huh,
I note they use primary energy production as a proxy of waste heat.
I’m happy to go with that metric.. if it will please you
Are you sure you want to follow it to the conclusion.
For example… there is temperature data and primary energy for
Ireland, the phillipines, Taiwan, New Zeeland, Australia, Trinada and Tobago, and a few more..
So, place your bets…. do you really want to commit to using that metric and live with the results?
For example: take the densly populated island of Taiwan… compare its deviation from the global average
with the primary energy consumption curve..
place your bet… do you think the correlation will hold up?
And if you see that it doesnt will you change your mind?
Here’s a clue.. when you look at the annual numbers you get a mess.. when you start to average
time periods ( 5 6 7 8 9 10 years) as they do… do you think correlations will increase or decrease?
Just remember that the warmer the location is, the more absolute water in the atm, the more energy it takes to raise the temp, so tiawan isn’t going to warm as much as either Japan or the uk for an equivalent energy consumption.
There’s no such thing as “waste heat” how is there a proxy of “waste heat”? Energy production obviously is not determinant to how the supply is used, how can you be happy with that metric?
You have no idea what the “primary consumption curve” is based on relating a production figure to a population estimate. honestly that’s just silly.
I’ve personally promoted this view for many years. It’s a “well duh!” moment. Nobody ever took me seriously. Good to see the concept gaining traction.
Yes, you have. Or somebody has who comments here regularly. Vindication.
On this board it was probably “somebody” 🙂 I almost made a comment last week on another article that had the same topic but fell asleep and forgot about it.
It probably wasn’t me if you read it here, but it was me in spirit so we can all celebrate the event. The important part, in my opinion, is someone went the distance and did the math, which is something I just don’t do anymore. Nowadays I garden and play with my dog. 🙂
Bart, We’ll hold you personally accountable for your optimistic failure…
Even after I said it was probably “somebody”? I’m honored, but it wasn’t all that difficult. You know radio was discovered independently? I still think Tesla got hosed.
Standing on the shoulders of giants has a long history. some people appear not to be selfish, while others have lots of money.
Standing on the shoulders of giants has a long history
I wouldn’t normally reply to that because, on the surface, it appears facile. But it isn’t, is it? There is something underneath that beckons; “You didn’t build it!” I think that would be the phrase that attracts criticism like pollen for the bee. The idea that you, personally, haven’t made the contribution you believe you have.
I have a little difficulty with this concept. You might as why? The answer is very simple for me anyway; the distance between a proven theory and a proven hypothesis is infinite.
“I’m just a coaster but my wheels won’t go,
My legs are weak my heels are low.”
— Yusuf Islam, “Fill My Eyes”, Mona Bone Jakon, 1970.
I’ve said likewise as well. Regardless, maybe this provides a segue to a partial solution. Better insulation, Hi-E furnaces and a/c units. Of course, people will go overboard with efficiencies that have zero payback.
That presupposes that we *want* the countryside to be colder. Do we?
i think that in the study of temperature trends we could be chasing our shadow. it is known that surface temperature contains dependence and persistence that can create patterns out of randomness. since these patterns do not have an external cause, the debate about the external cause of random patterns will never be settled. only patterns in excess of what the Hurst phenomenon can create requires an explanation and these can be detected with robust tests that are not subject to the independence assumption of OLS regression.
http://papers.ssrn.com/sol3/papers.cfm?abstract_id=2763358
http://papers.ssrn.com/sol3/papers.cfm?abstract_id=2776867
there is more at
http://papers.ssrn.com/sol3/cf_dev/AbsByAuth.cfm?per_id=2220942
For a typical Rankine cycle, steam electric generating station, about half the energy that enters as fuel ends up in the cooling system, out of those wet cooling towers or dry ACHEs. Of course the end use of that electricity ends up as heat as well. Even NG CCPP send 1/3rd of the fuel energy out the steam condensing cooling system. EIA has nice Sankey diagrams that show this distribution. If you calculate the temperature rise of the atmosphere based on the 100 + Quadrillion of Btu’s of energy used by the earth’s population, it’s not an insignificant number.
Q, Btu/eng h / (lbs air *0.24 Btu/lb-F) = F
Nicholas,
Don’t forget that the water returned to the river, ocean, reservoir , etc by a fossil fuel or nuclear plant even after going through the cooling towers or what ever system is used is still generally significantly above ambient temperature for that body of water. The Manatees and various other marine life love it down at Crystal River. FL.
And in those plants a considerable amount of heat is lost through the various piping and ducting systems despite the fact many are insulated. Even the heavy coal mills, exhauster fans, and large diameter pipes that carry the pre-heated pulverized coal to the injectors radiate considerable heat to the atmosphere.
Nicholas,
You are correct, it does not matter if is waste heat or electricity (including solar), the energy is put into the atmosphere as heat in the end. Waste heat has nothing to do with the earth eating more except reducing waste heat would improve efficiency and overall heating.
Nick, half of the input energy is overly generous. Fully two thirds of the energy entered into a Rankine steam cycle, be it nuclear or fossil, is put into the environment as wasted heat. The only thing that beats that are modern combined cycle units that can have conversion efficiencies as a high as 60%, at optimum conditions. And if you have cooling towers instead of once through water cooling, almost all of the heat goes into the atmosphere.
The heat in a Rankine cycle producing electric power for distribution from an adiabatic expansion eventually ends up as heat. In a combined heat and power cycle with area heating the input fuel energy ends as heat with an increase in entropy. Entropy is time’s arrow and is heading for a maximum.
Perfect 😉
For a typical Rankine cycle, steam electric generating station, about half the energy that enters as fuel ends up in the cooling system,…………”
Now there’s a man who knows the difference between Thermodynamics and Thermodramatics!
An increasingly rare distinction!
” Now there’s a man who knows the difference between Thermodynamics and Thermodramatics!
An increasingly rare distinction!”
While very true, almost all of the energy produced turns to heat when used.
I’ve wondered how efficient my computer is as a heater, best guess is it is 100 %, that the internal organization resolves as heat in the end as well.
When combined with area heating a Rankine steam cycle power station is 100% efficient as a heater.
“… even clean energy.” Exactly what is that supposed to be?
http://www.dailymail.co.uk/home/moslive/article-1350811/In-China-true-cost-Britains-clean-green-wind-power-experiment-Pollution-disastrous-scale.html
At least it’s real heat as opposed to hypothetical heat.
Hard to believe nobody did the math on this before. 90m barrels of oil a day burned, thousands of tons of coal, millions of cu. ft. of gas, wood, grain ethanol. It adds up to an awful lot of heat. At the very least it should be showing up! If it’s not in the models then the CO2 influence is EVEN LESS than what the failure of the models would indicate. I think that’s the big news. And, Oh yeah, there’s some big negative feedback lurking out there!
Well if you want to reach back to 1972 there is a tiny bit of math available… on page 73 of the MIT/Club of Rome report ‘Limits to Growth’ you’ll find a brief discussion of waste heat, sandwiched between the ‘CO2 is evil’ and the ‘nuclear waste is evil’ sections. Their Help! Our own cities will BBQ us argument imagines the Earth as some sort of inside-out Dyson Sphere. It’s a wonder we have not boiled off into space by now.
So in 1972 it was suggested that regional urban temperature variation was cause for concern… but now decades later we have this one-size-fits all ‘CO2 lobster pot theory’ — so as long as we refrain from emitting CO2 all will be well and the lobsters can gallivant in the pot and blow water-rings at one another, or what ever lobsters do for fun.
If I did the math correctly, the Sun’s energy absorbed at the surface of the Earth every day is about 13000 times as much as the heat of the 90m barrels of oil burned every day.
When we’re calculating the Earth’s energy balance, we can ignore the heat we generate by burning oil. It’s less 0.01%.
Ah, commieB, you are ignoring that fact that the heat is put into the atmosphere at places where temperatures are measured and put into the global record. Like urban areas, from air conditioning, cars, industry and power plants, and heat absorbing areas like buildings and parking lots. Oh, oil? Only a fraction of the heat input. Shall I mention coal plants, natural gas plants and residential heating and coal power plants? Who should care if you average the heat input into the oceans, deserts, mountains, etc. to make your statistics come out supporting your position?
Why don’t you put a sharp pencil to paper and come up with some numbers of your own.
John posed the question:
I tried to answer that question. If you have a different answer, show us your numbers otherwise I will come to the conclusion that you can’t.
The obvious answer is that, if anthropogenic heat mattered, it would routinely be included in planetary heat budgets. Of course, obvious answere aren’t always correct, which is why I bothered to do the calculation.
yes. and the heat rises.
although they seem to think it may advect
McKittrick published a paper on this in 2004.
http://www.uoguelph.ca/~rmckitri/research/McKitrick-Michaels-CR04.pdf
and so did De Laat and Maurellis
http://ruby.fgcu.edu/courses/twimberley/EnviroPhilo/Industrial.pdf
Industrializaiton may condtrbute only 0.028 watts/ square meter worldwide, but only 3% of the earth’s land surfiace is covered by urban areas, 30% of earth’s surface is land, so that results in an average increase
of 3 + watts over urban areas, comparable to the 3.7 increase in wattage from a doubling of CO2 in the atmosphere.
Bob, you started your post with, “If I did the math correctly,…” I was merely pointing out that no matter what your math skills are, you did not set up the problem correctly. Anthony has spend considerable time and effort showing how the urban heat islands influence the measurement of temperatures. Averaging the heat over the entire planet ignores this factor. And focusing on the heat from oil ignores the 2/3 of heat from other sources. And every bit of fossil and nuclear energy we use ends up as heat into the environment, waste heat or not.
I was replying to John Harmsworth and precisely answered the question he posed.
In terms of the GCMs, anthropogenic heat is irrelevant.
John Harmsworth – I did a little research and math back in 2010 & updated in 2015 for New York City.
Back in 2010, I posted the following analysis on New York City power usage as it related to UHI.
DD More February 26, 2010 at 7:22 am
I could never understand how UHI was minimized. If you look at New York City as an example.
Area, including water 468.9 sq mi ( 2,590,000 sq m)
Power used (2008) 54,869 GW-hr
(http://www.nyc.gov/html/planyc2030/downloads/pdf/progress_2008_energy.pdf)
Watts/sq m = 2,416 total. The Mayor says 80 percent is used by buildings and therefore 100 percent ends up as heat loss. So the forcing is 1,933 W/Sq M
The file also remarks that the city has seen a 23 percent increase in the last 10 years, which is close to the increase showing up in the charts.
http://wattsupwiththat.com/2010/02/26/a-new-paper-comparing-ncdc-rural-and-urban-us-surface-temperature-data/#comment-329553
Well it should be updated a little. Clarifying the 80 percent used by buildings was for lighting and heat, so by next day at the same temperature it was all turned to waste heat. I heard later that Reliability concerns require that 80% of the City’s peak load be met with in-City resources under a mandate from the New York State Reliability Council and the New York Independent System Operator.
The original calculation would now be 54,869 GW-hr / year * 1.0 x 1.00E+09 W/GW x 8760 hr/yr = 6,263,600,000 W-hr / hr. that divided by 2,590,000 m^2 = 2418 W / m^2 each hour. But if you take at least 60 percent of power generated in the city generates 40 percent excess waste heat to convert to electrical power = 2418 x (1+ .24) = 3000 W / m^2 of extra energy being dumped each hour in the air of New York City. And that is from electrical power alone, doesn’t include all the vehicle waste heat.
So does 3,000 w / m^2 raise the temperature more than 100 ppm CO2?
https://wattsupwiththat.com/2015/01/29/claim-global-warming-has-been-amplified-in-cities-ignores-infrastructure-increase/#comment-1848319
UHI studies have for years shown this. Roy Spencer did a nice study showing high correlation with population of cities. Anthony’s study showed the effect on the temperature record. I think this is just too obvious a factor unworthy of the hype and surprise. Perhaps the warming establishment sees this a new because they don’t recognize Spencer and Watts as legitimate colleagues.
They find the results inconvenient and claim they are accounted for and insignificant.
Exactly.
So, over a hundred years, the temperature difference between the city and country would be about a degree, according to them. If I understand correctly, the commonly accepted value is much larger.
England has a population density of 400/km^2.
Japan – 340
whole planet – 14
Canada – 4
Mongolia – 2
Even 400/km^2 isn’t particularly dense; suburban at best. The idea that the whole island is measurably warmed, and that this effect is greater than UHI, doesn’t pass the smell test. For sure, we can ignore the effect as far as the planet’s overall temperature is concerned.
It’s not the population density. It’s how close the thermometers are to people. Even if you’re all alone in Antarctica and the thermometer is close to your body, it will measure your body heat. Where people are, that’s where the waste heat is concentrated.
That’s what I thought. These folks seem to be saying that there’s enough heat to affect warming on a regional basis. For instance they say it can spill across boundaries into other countries,
and spill into the neighboring countryside,
not only that but they talk about temperature increases far from heat sources,
and they’re calculating energy per square kilometer.
They do seem to be talking about warming an entire country … pretty astounding.
It’s not warming the entire country. It’s warming the thermometers which gives a warming bias in the temperature data. An illusion that the entire country is warming faster than reality. I think that is the issue.
Waste heat? All energy is “wasted” as all forms of energy converge to the lowest form – heat. Power stations make 100 % “waste” heat: 2/3 of it on the spot and the 1/3 that leaves as electricity converts to heat eventually. As is the electricity from the sun, the energy in gasoline, …..
24 carat truth. Thanks for reminding us.
Yes so you agree with the study because it used energy consumption as proxy for waste heat, meaning all energy is waste heat. It should be amount of coal and natural gas burned, not electricity produced.
Good one, Doctor S.
Not quite 100% if you take into account things like visible light and RF.
True; not many EVER consider this aspect. There is also the direct radiation-into-space at IR wavelengths from ‘hot’ apparatus, but, that is a small figure compared to convectively heated (by direct contact) air …
Some light and radio waves make it into space but most are absorbed and become waste heat. Most objects have color and absorb all the light spectra except the object’s color. Only a white body reflects all the light spectra. Shortwave radio is reflected by the ionosphere back to earth. Higher frequency radio waves are mostly absorbed by metallic conductors producing a tiny electric current that becomes waste heat via Joule heating. Longwave IR is absorbed by greenhouse gases in the atmosphere.
In the Engineering world, the waste heat is that which did not produce electricity. Otherwise you are correct all energy converges to it’s lowest form, heat, so making only waste heat the culprit is incorrect.
There is no such thing as “waste heat” what about all that waste cold?
Quit already, And take a thermo class for Pete’s sake… Jeez.
Why should I? there actually is no such thing as “waste heat” Jeez…
Urban heat is shown very well here in a suburb of Perth. Those with air conditioners are easily picked out:
” Strong correlations are found between energy consumption and temperatures above or below global background levels.”
Somebody is going to say it “correlation does not imply causation”.
Sort of like mathematical induction…you can show the heat effects at the smallest scales, then larger, then work up to the correlation at very large scales.
Ya.. what exactly is the background level global temperature.
Mosh, enlighten us all with your sales pitch….
What exactly is the background global temperature MEANT to be?
Ya…What is the back ground CO2 levels from 350 ppm to 400 ppm? and how does 50 parts per million change global temperature?
what exactly is the background level global temperature[?]
Exactly.
What is the correct global CO2 level?
“What is the correct global CO2 level?”
Plants say 800ppm +
Ah… I found it, they subtracted the Global average from the country average.
Except they defined the country average for the UK as CET
and they defined the country average for japan by taking 14 stations.
Changing surface characteristics also contributes to UHI and temperature records, much more than the addition of carbon dioxide from burning of carbon based fuels.
Well, yes, temperatures in England and Japan have been rising, and so has energy consumption there. But so have temperatures all over the world. Arctic temperatures rising even faster. Is that waste heat?
Total human energy use is about 15 terawatts. That is about 0.03 W/m2 over Earth. GHG forcing is about 2 W/m2.
Nick you use about 10 terawatts yourself just spinning your BS.
I think Nick has a point here with regard to influence on global T, but not on regional, not at night when the wind dies, not regarding UHI. UHI area must compose a very small percentage of the surface.
https://wattsupwiththat.com/about-wuwt/policy/
That is over the ENTIRE earth. Human heat is not spread out over the entire earth, just over localized areas where humans live and where temperatures are measured. There is a reason why NASA once said that we shouldn’t trust ground measurements and should only trust satellite data.
Nick doesn’t recognize the issue, for him everything but CO2 is insignificant.
” NASA once said”
No, that 1990 newspaper report says “The report’s authors said”. And who were those authors? Yes, Spencer and Christy.
And the majority of land based temperature measurements are taken just where man produces his localised waste heat and changes in urban land use. This distorts the data record.
it follows that the point raised by NS above takes no account of the manner in which temperature data is collected not from the entire surface of the Earth but rather just from a few localised points where man’s impact is at its highest (we have no proper handle on Arctic and Antarctic interior measurements, and GISS extrapolations are unscientific).
Any affect of “wast heat”, if it’s even measurable, is two orders of magnitude smaller than the radiative forcing from extra greenhouse gas emitted as a result.
Total red herring.
“rather just from a few localised points where man’s impact is at its highest”
The temperature averages are area-weighted. Two-thirds of the area is ocean. A very small fraction is UK and Japan.
“Human heat is not spread out over the entire earth, just over localized areas where humans live and where temperatures are measured”
Yes but we could model heat transfer in a gas. It would be absurdly difficult and computationally intractable to actually use the model, but we do have one. We just can’t use it.
Nick Stokes June 18, 2016 at 6:55 pm
Was Spencer working for NASA at the time Nick and was the report part of his responsibilities?
michael
“……. should only trust satellite data.”
But that’s not Carl Mears of RSS says….
http://www.remss.com/blog/recent-slowing-rise-global-temperatures
” A similar, but stronger case can be made using surface temperature datasets, which I consider to be more reliable than satellite datasets (they certainly agree with each other better than the various satellite datasets do!). So I don’t think the problem can be explained fully by measurement errors.”
Get back when both RSS and UAH stop making alteration to their “algorithms”
( the way they calculate the temp equiivalent of the brightness signal the sat sensors receive from the various layers of the atmosphere they scan).
I mean we would want to compare apples with apples now wouldn’t we? (sarc)
too funny. sadly the 1990 article says no such thing.
Goddard is so funny.
I only need 1.21 gigawatt of power to go back in time to slap you before you ever make that comment and save you from embarrassing yourself, I’ll just be a minute.
I fell off my chair. 1.21 Gigawatts? that extra .01 gigawatts is going to cost you a lot…
The .01 is well observed. but the naught point twenty one Gigawatt is fun to say. It costs me nothing to be nice and accurate and sweet and honest and caring and awesome… If all you do is fall off your chair, good luck with that! lol only joking
And if we can’t at least joke with each other, what do we have?
I don’t know, I was thinking about other things.
“Japan have been rising”

BS !!
NO warming since 1998
NO WARMING from 1950-1990
Just two step like shifts just before 1950 and around 1990
(Data from Jap Met. see link further down thread)
“BS !!”
So you don’t think much of the correlation with waste heat?
Obviously there isn’t much waste heat in Japan
Keep spinning Nick , you’ll wear out your ballet shoes. !
What I suggest/suspect is that the Japanese, being fastidious people, have not allowed their weather stations to become corrupted by local tar, concrete and air conditioners as much as the US and other countries have.
That means that the reality are very stable temperatures that don’t have the pseudo warming that has been introduced by bad siting of weather stations.
They have also probably managed to avoid the wholesale corruption of their temperature data by other human means.
I do not understand going to island nations, heavily influenced by marine T patterns to find aspects of UHI.
yeah was wondering on Japans figures..cos the pop is lowering and while oldies might stay in more n use power to warm/cool I dont see how that makes up for lost industry and more people who used to move around more, not using fuel etc
http://berkeleyearth.lbl.gov/auto/Regional/TAVG/Figures/japan-TAVG-Trend.pdf
Best = WORST.. You are a HORRENDOUSLY BAD salesman Mosh.
Nick, that depends on the exact locations of the very few thermometers used to decide what the temperature is in the Arctic. If they were well away from, & upwind of, the heat sources in Arctic communities, we could maybe rely on the purported temperature anomalies up there, but that is not the case. Homgenisation of temperatures from hundreds of kilometres away is the norm in determining Arctic averages.
too funny.
Long ago there was a theory of UHI that proposed advection as the cause.
Then along came Oke.
Also read their article more carefully about the importance of density and the boundary layer
Then
See Oke’s book on boundary layer climates.. table 8.1
advection –
“the transfer of heat or matter by the flow of a fluid, especially horizontally in the atmosphere or the sea”
This worked how in said UHI theory?
Nick: I was hoping someone would talk actual numbers. I recall them as being minuscule relative to other energy flows, I guess snarking at Mosh has a higher priority here today.
Yes but it is not divided over earth Nick, we are talking two examples and the correlation is much better than the models.
Now while I dont call correlation proof of anything, lets home some alarmists realise that too re AGW. Still waiting for any shred of evidence atmospheric CO2 growth is human driven
This is, I think, the first quantitative (and thus pertinent) contribution to the discussion. The rest seem to be rather airy. I was thinking of trying to write something on the same lines – but I’m naturally lazy :-((
Thank you, Nick.
“Arctic temperatures rising even faster. Is that waste heat?”
Yes if the thermometers are in Nuuk, Greenland (pop. 16,500) There are no weather stations on sea ice of the Arctic ocean.
“Total human energy use is about 15 terawatts. That is about 0.03 W/m2 over Earth. GHG forcing is about 2 W/m2”
The study does not claim there is waste heat in the ocean. You just made it up. Divide total energy by 3% of land area representing urban centers where most waste heat and thermometers are located. You get 3.357 W/m^2
“There are no weather stations on sea ice of the Arctic ocean.”
wrong
[Mosher, instead of being a prick, and just saying WRONG, why not point out the handful of floating weather stations that are deployed in the spring? Sheesh. -Anthony]
If the weather station is on sea ice, that’s ocean temperature. The effect of waste heat is on land temperature like UHI. So whether or not there is a weather station on sea ice is irrelevant to the issue of waste heat.
“[Mosher, instead of being a prick, and just saying WRONG, why not point out the handful of floating weather stations that are deployed in the spring? Sheesh. -Anthony]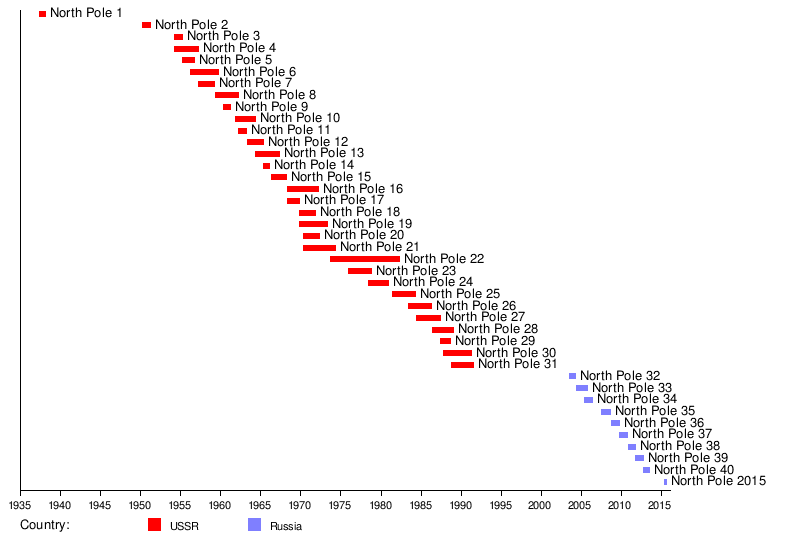
why not demand that the commenter VERIFY his claim that there are none.
and why would I mislead him and say there was only a handful deployed in the spring? Why would I ignore the Russian North Pole Drift stations? …. we are talking the history of warming in the arctic
I’d much rather say “wrong” and then get to say “wrong again”
https://en.wikipedia.org/wiki/Drifting_ice_station
http://nsidc.org/data/nsidc-0060
[Mosher. Why should this commenter be treated any different than you? You don’t verify every claim you post here. Let’s start with this one WRONG, which you didn’t verify, but just assumed a position of authority. Your attitude is becoming increasingly tiresome. If you want to get along here, an attitude adjustment is needed. Also, it is important to note that these floating stations don’t maintain position, nor are they year-round data gatherers. See pic below. Anthony]
Irrelevant and strawman. The study never claimed waste heat is an issue in ocean temperature. As I said we can only talk of waste heat in the Arctic for thermometers located in populated areas on land. But he keeps talking about sea ice stations and Arctic ocean temperature.
What pole? Oh, only 1 of the poles is warming, that’s right. The important one with the ice on land is not…in fact it is cooling and ice is expanding, but who cares about the Antarctic when you have the Arctic, right?
Energy usage is actual, the other is unproven theory in the real world with lack of correlation to CO-2 rise.
GHG forcing is a meaningless concept.
Stokes, Stokes, Stokes,
Show us your calculation of “GHG forcing,” and please do not forget to mention that 95% is water vapor.
That small star in our sky known as Father Sol has a “forcing” of 1370 Watts/square meter, which is four orders of magnitude larger than Total Human Energy Use. As Stephen Wright said, “It’s a small world, but I wouldn’t want to paint it…”
Pfft… how could puny humans possibly be affecting the global weather. More hubristic BS from the spin merchants. Oh wait…No, this IS the cause of the observed warming. Uh oh, wait on….Oh now I’m all confused.
This article is clutching wildly at straws. Pathetic.
No, it’s not THE cause of all of the warming in the entire world, but it is a contribution that needs to be accounted for and which contaminates the temperature record. Don’t be so obtuse.
The problem is that the temperature record is distorted. The entire world is not warming in accordance with the land based record because the land based record has insufficient coverage, lacks adequate spatial coverage, and is unduly corrupted by man’s local impacts,
The land based thermometer record should be thrown out. It has become too horribly bastardised to be of scientific use.
This issue exposes the hypocrisy of those who on the one hand claim humans can’t be changing the atmosphere but on the other use this type of argument to explain away the changes. Lol.
“The land based thermometer record should be thrown out. It has become too horribly bastardised to be of scientific use.” – agreed Richard.
The temperature data tortured to create an “average Earth temperature” is only intended for, & useful in, the LOCAL area.
tony mcleod
June 18, 2016 at 8:19 pm
This issue exposes the hypocrisy of those who on the one hand claim humans can’t be changing the atmosphere but on the other use this type of argument to explain away the changes. Lol.
—————————————
You were doing so well, up to this- do you really need to use a logical fallacy to give yourself a public pat on the back?
Tony, land temperatures are used to claim humans are warming the environment, by X amount per decade. Some point out that the numbers used to make this claim are biased, partly due to human “waste heat.” Stop for a moment, breathe deeply, then think. This is not that difficult a concept (even if one disagrees with the particular numbers of either side) and I’m afraid you’re not grasping the general idea, causing frustration.
I’m also reading it as it may or may not be affecting the overall temperature of the atmosphere but it may be affecting the surface measurements of the temperature.
Who claims humans can’t be changing the atmosphere? Pretty much everyone who visits here accepts THAT. The question is what measurable effect, if any, that change has on temperatures, and this is just one of many that show different reasons why our measurements are less reliable than generally thought. This article doesn’t clutch at straws, and it certainly doesn’t deny human-caused warming. If you were to WANT the UK to be cooler, and having lived there I do not, the article shows the way to measures that could seriously be taken.
– Nobody is claiming humans can’t change the atmosphere.
– The paper says we are changing the temperature, albeit in Britain and Japan
– Hypocrisy not observed, more data required.
The hypocrisy is evident in those who simultaneously hold that puny, insignificant humans can’t possibly change the climate on one hand and on the other that well, if there is any affect then its because of “waste” and not CO2. There are perhaps two camps but there is plenty of overlap.
Its hypocrisy and it’s clutching at straws: blame anything but burning fossils fuels.
We’re well into stage 3 of D…….: Deny it’s a problem; “it makes good plant food”.
When I first got interested in this topic a few years ago, my first thought was that waste heat was being left out of the analysis. However, after some ‘back of the envelope’ calculations I concluded that, compared to the sun, the waste heat produced by humans was minuscule. Now, that’s not to say that under some circumstances it can’t influence the microclimate. Also, as Anthony Watts has demonstrated, waste heat can bias the ‘official’ temperature readings. But, the correlations cited in this article are probably spurious. The drivers are all things anthropogenic, not just CO2 or waste heat. As I demonstrated in an article on this blog, there are high correlations with population and many other things like CO2. However, that doesn’t establish cause and effect. The whole issue is a can of worm’s consisting of natural variations in TSI and spectral distributions, aerosols, biased temperatures and unwarranted post-adjustments to temperature readings, unaccounted for and unrecognized natural sources of CO2 along with anthropogenic CO2, land use changes, natural and human-induced albedo changes, and a host of secondary effects, not all of which have been identified. Anthropogenic CO2 is blamed for the increase in the atmosphere. However, the very few maps released to the public from the OCO-2 mission don’t demonstrate the source areas to be where they are predicted. What is interesting is the large regions in the oceans, particularly the SH, that show anomalously high CO2. Similarly, the Amazon Basin shows high CO2 values, which may be anthropogenic, but aren’t the result of burning fossil fuels. There is so much we don’t know and those who claim that the “science is settled,” are inhibiting research because they are convinced virtually all the warming can be blamed on the burning of fossil fuels. This article tends to reinforce the idea that fossil fuels are the culprit.
+1
We don’t burn enough fuel to impact global temps by anythig measurable, so the correlation is to secondary efffects. Population increases, land use changes, urban sprawl, population density in urban centres, proximity of weather stations to human activity… these are all factors that correlate in the exact same way. Blaming it on waste heat alone defies physics and ignores much more plausible explanations.
+2. It’s typical. This:
Important study: Waste heat is a MAJOR SOURCE of national warming, significantly pollutes climatic record
Is arrant nonsense and the author knows it.
Typical “crusher crew” nonsense. UHI significantly distorts the temperature record, not the temperature. See the difference?
Globally that is true, but I did the calculations for the UK, once, and it came out at about 1% of the total insolation. It’s not a hard calculation to do.
And its is VERY noticeable as a local effect. London is around 2 degrees warmer than where I live, and the nearest town, a degree.
You can even see it on weather stations. US and RAF airfields in the country versus Heathrow.
And that is of course the point. The vast majority of ground weather stations are sited near conurbations. Not out in the boondocks somewhere.
Which would mean that one would expect ground station temperatures to rise with total energy consumption, but satellite measurements to be largely unaffected.
These ‘unwarranted’ post-adjustments to temperature readings are in fact essential to demonstrate the existence of a phenomenon of increasing global temperature (whatever that might mean) that would otherwise be indetectable.
In other related news, John Murray and Douglas Heggie from the University of Edinburgh have also written a parallel study. In it, they prove that water is indeed wet, that the sun is bright, and that 1+1=2.
You forgot to credit Captain O.B. Vious. 😀
… When using small values of 3.
It’s a good thing I don’t cut wood like you guys.
Or when a man and a woman produce a child.
Good thing they don’t put the official temperature stations anywhere near those heat sources. 😉
Your sarcasm is spot on.
Therein lies the problem.
The real issue must always be: to what extent is human activity causing harmful climate change? The fact that we have had several ice ages proves that climate can naturally change drastically. Our natural climate may still be on the upswing in temperature. But how can we know when people who appear to be putting ideology above science seem hell-bent on finding that humans are in fact harming the climate?
When I look at the city pair comparison graphs produced by the late Jon Daly [1], I don’t see any trend for stations that are clearly located outside of UHI effects. Yet climate scientists seem to willingly ignore how much UHI distorts their aggregate results, which in turn distorts the backtesting of their models. Of course their models are all shown a few years later to gloriously deviate from the subsequent real-world results. But that does not stop a single one of them from blazing forward, announcing every new model with assurance and confidence that this model shows that humanity is doomed unless we adopt the socialistic and liberty-destroying solutions being proposed.
[1]
see for example: http://www.john-daly.com/stations/jeff-tru.gif
and: http://www.john-daly.com/stations/stations.htm
It seems that if one is looking for a signal for the effects of CO2 caused global warming, and you find a much stronger signal for UHI effects, the signal for CO2 just might not really be there at all. A R-value of .9 v. .3 something makes it look very much like the effect from CO2 is just noise.
And yet the Japanese Met data found here..

http://www.data.jma.go.jp/cpdinfo/temp/list/mon_jpn.html
Shows NO WARMING since 1998..
And NO WARMING from 1950-1990
If you actually extract the data there are 3 essentially zero trend periods from 1898 – 1945, then 1950-1990, then 1998-now.
The very slight rise in Japanese temperatures is from two steps around 1947ish and 1997ish
So that slight warming cannot be from CO2 or Urban heat effects
error correction
The very slight rise in Japanese temperatures is from two steps around 1947ish and just before 1990.
I’m guessing the poor guys doing this study used GISS manipulated data for their Japanese temperatures.
DOH !!!!!
Nice graphs Andy.
The 1998 step was a step in the effective climate sensitivity in the N20 to N30 latitude band.
https://micro6500blog.wordpress.com/2016/05/18/measuring-surface-climate-sensitivity/
You wouldn’t happen to have a Japanese graph beginning in 1898, would you?
Here you go, TA.
http://www.data.jma.go.jp/cpdinfo/temp/fig/an_jpn.png
http://www.data.jma.go.jp/cpdinfo/temp/an_jpn.html
Here is the period from 1898 to 1946
As I said, two distinct STEP type changes (which are clearly evident on barry’s yearly data graph)
barry’s graph indicates there may also be a step change around 1910, but it doesn’t show up in the monthly data.
The question barry needs to answer is WHY there were 40 year periods of ZERO WARMING when CO2 is this all powerful global forcing.
Except of course that CO2 has nothing to do with step changes 40-50 years apart, does it barry.
Thanks for the graphs, Andy and Barry.
AndyG55 said: “Poor barry,
Flapping around like a fish out of water.
40 year ZERO trend.. get over it, bozo !!”
This is an acceptable way to treat someone who has conducted himself as reasonably as Barry has?
there are 3 essentially zero trend periods
Each warmer than the last. And the supposed steps have gaps of a few years between them:
1898 – 1945, then 1950-1990, then 1998-now
🙂 That really is cherry-picking – you’ve had to omit a few years to get the answer you like.
Temps at a small geographical location are more variable then global, so it’s easier to find statistically flat periods. You can find that sort of thing in any variable time series. Without a physical basis, however, it’s just mathstrology.
Here’s the Japanese temp record – anyone can pick a period and stake their claim.
http://www.data.jma.go.jp/cpdinfo/temp/fig/an_jpn.png
If that doesn’t show up, here’s the link.
http://www.data.jma.go.jp/cpdinfo/temp/an_jpn.html
It is patently obvious looking at the graph that there are 3 visible periods of intense temperature increases,
1912
1947
1989
in each case the temp jumps about 1.5 degrees over a very short period of time.
The 3 flatish periods actually look more like slight downward trends rather than zero trends.
So I can’t agree with you Barry
“That really is cherry-picking – you’ve had to omit a few years to get the answer you like.”
Explain the step changes.
And like ALL CAGW trollops you HAVE to use step changes to form any trends, don’t you barry.
Now explain how step changes 40-50 years apart can be anything to do with CO2, when they are the ONLY WARMING in the whole record.
Oh, and thanks barry, for posting the yearly graph.
It makes it so much easier for people to see the STEP type changes between the 40-50 year ZERO TREND periods..
…and for illustrating so convincingly that the whole warming in the Japanese record rests solely on those two 4-5 year warming periods.
Well done 🙂
A C – I did a regression (OLS) on the periods nominated by Andy. They all have a small positive slope. But there’s plenty of opportunity to find a cooling slope – from 1959 or ’61 to the late 80s. 1913-1945 would also get you one.
“Step change.” It’s a buzzword, like “adjustments.” Any time series with variable data will have what looks like them, but unless they are justified a) physically and b) statistically, it’s hot air.
Obviously the concept is attractive to skeptics because CO2 rise is linear, so non-linear temp profiles are ‘proof’ it’s ABC. But with the amount of variance in Japanese data you’re going to be able to spot all sorts of nice shapes, like clouds.
To me, it looks like a general warming trend with lots of noise, and a mid-century part that somewhat mirrors the flat or cooling period globally. But that’s just another shape in the clouds. There’s a lot more variance than the global average, and local changes in weather systems, aerosol loadings, smog etc are going to have more impact than globally.
The biggest jump in temp from one year to another was 1913-14, a leap of 1.39C. Speaking of intense temperature increase. But that isn’t the beginning of one of Andy’s “steps.” It is an indication of the volatility of Japan’s annual temperature changes generally. That’s about 3 times larger a temp change than for any year in the surface records.
Are we agreed, then, that JMA is a good source for surface temperature data? I’m assuming that we wouldn’t be making claims about temp trends and such if we didn’t trust the source. Right?
So can we use JMA for the temp record going forward?
Will you commit to that? It would be good to have a data set all agree is honestly made.
You look at different countries and you see their temperature evolution isn’t the same. Alleged ‘step changes’ occur at different times for different countries. Then you’re left wondering how it is that virtually all large countries in the world had step-changes at different times, ending up with higher temps at the end of the record than the beginning.
Then you start thinking that this coincidence in overall trend but lack of correlation in ‘step change’ timing, might not represent actual step changes, but are visual artefacts of local temperature variability.
http://www.bom.gov.au/tmp/cc/tmean.aus.0112.40311.png
For example.
(Hey mods – seems my posts aren’t being admitted. Have I transgressed in some way? If not, could you admit them, please?)
[No, just short staffed today, and I was involved in a home project and offline. -Anthony]
You’re using a yearly anomaly to call a monthly anomaly “cherry picking” hilarious!! the fact is, you’re lumping a lot of readings together for statistical significance when there is none.
You’re using a yearly anomaly to call a monthly anomaly “cherry picking” hilarious!! the fact is, you’re lumping a lot of readings together for statistical significance when there is none.
Annual averages reduce autocorrelation when analysing trends.
The periods Andy nominated all fail statistical significance testing, whether using monthly or annual. Monthly anomalies can swing by 3C, annual by 1.5C. That’s much larger than global, therefore much larger uncertainty interval.
What I see is a general warming to 1960, then a cooling to 1990, then warming again (based on 5-year averages). But it’s like looking at clouds for patterns. There’s too much variability to get a statistically significant result even on 30-year periods. Only thing you could safely say is that there has been a warming trend for over a century with a lot of variability.
” Only thing you could safely say is that there has been a warming trend for over a century with a lot of variability.”
No, well if you turn all the data into puree maybe, but when you look at the derivative regionally you see its nothing like this.
https://micro6500blog.wordpress.com/2015/11/18/evidence-against-warming-from-carbon-dioxide/
Or
https://micro6500blog.wordpress.com/2016/05/18/measuring-surface-climate-sensitivity/
“Now explain how step changes 40-50 years apart can be anything to do with CO2, when they are the ONLY WARMING in the whole record.”
Skipped the question I notice, barry ..
sort of oozed right passed it to avoid the 40-50 year periods of ZERO TREND.
” sort of oozed right passed it to avoid the 40-50 year periods of ZERO TREND.”
Andy, bingo.
Plus the steps do not occur at the same time at different places.
Sort of like how one might imagine changes in ocean surface temps as they reorganize as the decadal cycles progress.
Skipped the question I notice, barry
I answered it several times. The ‘step-changes’ are not statistically or physically justified.
You see them in the temp records for every country, but they’re all at different periods and of different lengths. They’re an artifact of the variability in the data. If there was something to it, they’d all line up from country to country. They don’t. So what we’re seeing is local variability superimposed on a long-term trend and things that look like step-changes (at very different times for different countries) but have no statistical validity as such.
While pretty much all countries have these ‘step changes’ at different times, the last ‘step’ is warmer than the rest. The odds that 99% of countries all have a warming trend due simply to local factors is pretty astronomical. And if they are reflecting global ‘step-changes,’ then you’d expect them to be aligned. they are not.
If you are able to generate random data with the same variance and long-term trend as Japan (or global), you will see flat periods for most iterations, but they will be at different times. Data with parameters (variance/trend) like Japan’s and global usually have this ‘feature’. So while you’ll spot flat periods, you’ll know that they’re just artefacts of the data because you programmed only a trend, not steps.
You can do this in Excel.
You ask how I “explain” flat periods in Japan’s temp record. I think it is simply an artefact of the variability. The variability is 10 times greater than the underlying trend, so I expect to see flat periods and periods that have a high warming/cooling trend depending on where I slide the window and how wide it is.
In short, I don’t agree with your premise. You’ll have to do better than picking two points and doing a linear regression between them. That’s the first step of many to establishing an actual step change. Change point analysis and comparing uncertainty intervals would help to establish your opinion. A physical basis explaining the stats would be the next step.
Here is a positive trend with random values. All that is set is the curve upwards (exponential), the number of values (100) and the degree of variance in the data. Data values were randomly generated within those parameters.
http://i1006.photobucket.com/albums/af185/barryschwarz/random%20positive%20trend_zpsovyzbfvt.png
From 1929 – 1959 there is a flat ‘trend’. Same for 1960 – 1992. They look like steps. But we know they aren’t real, just the result of randomness. Because all that was set was the trend, number of data points and variance.
Randomly generating within these parameters will usually present long flat periods, but not every time. What look like ‘steps’ are merely an accident of the variance.
This is one test you can do to see if the step change thesis is a strong one. If randomly generated data of the same long-term trend and variance as Japan also produces flat periods, then the theory is shaky. If you do not get flat periods, then your step change theory looks more solid.
Then there’s the physics.
(Caveat – the online generator I used can’t emulate Japanese temp parameters exactly (trend+varability from beginning to end of record). Someone with better skill might be able to gin up some better tests to analyse the likelihood of these purported step changes being more than an artefact of the data. This was just a quick example)
Another test would be to generate a random variable time series but force the ‘step changes’ at given dates. Emulate the variance in the Japanese data and the size of the steps. Then see how often the results match your expectations. That’s actually pretty easy to do in Excel. If I’ve time and there’s interest, I could give it a go.
Poor barry..
slipping and sliding, digging himself deeper and deeper
“Now explain how step changes 40-50 years apart can be anything to do with CO2, when they are the ONLY WARMING in the whole record.”
Skipped the question I notice, barry ..
sort of oozed right passed it to avoid the 40-50 year periods of ZERO TREND.
I repeat that,..
3 lots of 20-50 years of ZERO TREND.
That doesn’t happen by accident.
“Then there’s the physics.”
Which seem to have only the vaguest grasp of. !!!
You’re oozing past my answer.
I think you’re assumption (step change) is unjustified and detailed why. I showed that long flat periods are found in randomly generated data with a positive trend and no step changes. You’ve made no attempt to respond that, just repeated what you said earlier.
Here’s a randomly generated positive trend that displays 41 years of no change (1933 – 1973)
http://i1006.photobucket.com/albums/af185/barryschwarz/40%20year%20flat%20on%20positive%20slope_zps0rpw8gsl.png
The positive slope to 1933 – 1988 is negligible – on par with the periods you nominated in the Japan temp record. So that’s 55 years ‘step’.
Here’s another that produced a flat period for 60 years (1900 – 1959)
http://i1006.photobucket.com/albums/af185/barryschwarz/random%20data%20positive%20trend%20long%20slope_zps2moywauy.png
All 3 generated plots above (one in the prior post) had the same trend and variance parameters.
All 3 show long flat periods that you would call “step changes.”
If someone presented you these graphs as data for 3 different countries, you would claim that the flat pauses and ‘step changes’ are meaningful, even though the data is generated only with a long-term trend + randomised variability. The ‘step-changes’ are the pattern you’re conditioned to look for, so you’ll see them even when they are not real. As in these examples. They were designed NOT to include step changes.
This is my answer – again. No statistical basis for an assumption of step-changes.The flat periods are just as likely to be an artefact of stochastic variation. Even with a long-term forcing (trend) running underneath.
IE, that is how you can have flat trends for long periods even when there is an underlying forcing. Monotonic annual or even decadal warming with GHG increase (or any other increasing forcing) is not expected if the variability is an order of magnitude larger than the trend, which is the case for Japanese annual data.
A heck of a lot of pointless going around in circles could be avoided if some people really took in and understood what Barry is explaining here.
Poor barry,
Flapping around like a fish out of water.
40 year ZERO trend.. get over it, bozo !!
Climate is not random.. it is real.
One day you modelling dorks will realise that. 🙂
I’m pretty sure that if I wanted to I could easily generate a graph that appeared to have a rising trend, but used an underlying zero trend.
That’s what monte carlo monkeys do.
In this case we have a underlying ZERO trend with two quite small steps in ti.
A large proportion of the data has a ZERO TREND,……
….. and there is NOTHING you can do about it…
….
…unless, of course, you work for GISS, HadCrut or BEST. !
From a glance at the graphic, this study really seems to show three things: global average temperature is an utterly meaningless metric; the similarity between model hindcasts of global and regional temperature variations, while utterly failing to reflect observations on a regional scale proves models have been tuned through arbitrary parameterization to reproduce a predetermined result with which they are inflexibly imprinted on every scale. Thirdly, that surface stations have been contaminated with UHI which has never properly been accounted for. I looked at GISS records for the UK a while back and found both a marching and bottlenecking of thermometers used from a combination of rural, urban and green airfield sites to not more than a dozen large, paved airports, coinciding perfectly with the mid ’80s to 2000 warming. The regional trends shown in this study are as likely to follow the expansion of air travel as anything else.
‘Heat output may affect climate change in countries of high population density’
He says “climate change” over and over. Like a parrot. I submit that in his usage, it is absolutely meaningless.
Each utterance manifests cash.
When there is sun spot activity like the very week, we suddenly get hot temperatures. When this ceases, it gets rapidly colder than usual. The sun controls all of this, big time. All Ice Ages were caused by lower solar activity. The sudden warming that ends Ice Ages is caused by the sun heating things up again.
We had significant sun spot activity and the sun spot just moved over the face of the sun and I know that we had below normal weather up here in NY during last week with no sun spots and this week has warmed considerably.
It’s a polar field induction. The suns poles strike earth when it reverses, the Earths oceans are conductive.
Take a look at the Milankovicth cycles ems.
Yep…just another name for the urban heat island. Explains why sea levels have barely moved in 100 years. Cut the bloodsuckers off the taxpayers teat. Time for them to get a real job or study a real problem. I’ve got one for you…solve the Middle East peace riddle. LOL Good luck!
Sea level rise? Last year we had a flood in part of the city, allegedly because the council forgot to tell the contractors to clean out the mud tanks. Now the mayor is talking about sea level rise and having to abandon that part of the city because of it. Their own figures show a rate of 1.9mm/year over the last ~60 years but they’re planning for 1.6m by 2090 (that’s TEN TIMES higher than historic rates) because “scientists say”. The council web site still says “Most climate scientists agree that average global temperatures are likely to rise by 3–4°C by 2100” as though the IPCC hadn’t written any recent reports. Even just the mayor talking about abandoning part of the city is going to do bad things to people living there who want to sell their houses. (Did I mention that it’s not the richest part of the city?)
The city council and the rich are looking for a new gulf course.
I’ve read the paper now, and I think they have just bungled their statistics. The key quote from the conclusion is this:
“The fact that the statistically significant results require averaging over several years is due to the small area of the Earth’s surface being sampled in both locations.”
They are just correlating time series, so the small area is a red herring. But they do make a big thing of the smoothing, showing how r² increases as you smooth the series over periods over several years. They settle on about 7 years.
But you can’t turn an insignificant result into a significant one by smoothing. You reduce the sum of squares, but the number of degrees of freedom reduces too. There should be an allowance due to autocorrelation, and I see no evidence that they have used one.
In fact, the correlations look poor, and would be dismissed without the claimed p values. I think the p values are just wrong.
Very good point Nick. They should have line on the graph indicating what level of correlation coeff would be significant for each point w.r.t. the number of degree of freedom. There is a very widespread misconception that R is some kind of universal test and that there is some fixed magic value above which things become significant.
To be clear this is not smoothing ( low pass fitleriing ) it is decimation. They are doing averaging not running average.
The general rise is due to what say so the high last point simply due to the lack of data points. This does not necessarily invalidate what they have done but it does require qualification by indicating where ‘significance’ lies on they graph to assess whether there is a meaningful effect.
Also the dips may be interesting. This may indicate the periodicities where natural cycle decorrelate the relationship. Though at 13 or 15 y they are probably working with 3 dots !!
Could you suggest what formula you think should be applied to this data to get significance against random data? They have 7 points for 7 year aveages, what R^2 would be significant?
Greg,
“what formula you think should be applied to this data to get significance against random data?”
Independence, as with trends, is an issue. I’m not sure how well it works at the high r end, but you can derive a t parameter as r*sqrt((N-2)/(1-r^2)), where N is number of (decimated) points.
“But you can’t turn an insignificant result into a significant one by smoothing”
They WHY do all the alarmist try to do so ????????????
“In fact, the correlations look poor”
The correlation between CO2 and real temperatures is basically ZERO
Yet still, you spin the CAGW line
WHAT THE **** is WRONG WITH YOU
no smoothing
http://static.berkeleyearth.org/pdf/annual-with-forcing.pdf
great fit.
sorry you are wrong.
LEMON !!!
Well, that’s great Anthony. You can criticize me, but not allow my response. That’s basically putting your hands up and saying, “I don’t care about open and transparent communication, I place more value on being able to portray you as I wish with no right of reply.”
Why is there a general sense of vitriol to Nick – he always seem polite (or did I miss something) – if its just because someone strongly holds a different point of view then as skeptics we’re no better than some on the “other” side.
Its not vitriol.. Its wondering what the **** he is thinking.
I know his job relies on him taking the CAGW line..
… but at some stage he really needs to think of his own integrity.
He opens his mouth to change foot sometimes. As we all do, but some do so more than others.
because the blog policy is not enforced.
there will of course be special pleading about why Nick deserves to be abused. about why there isnt enough time to correct people who abuse him, but there is time for mods to comment on my comments?
Funny. too funny.
I tell someone they are wrong and that gets attention? while someone else abuses Nick and well thats ok…
seriously the comments here should be reserved for skeptics only.
[So says the man who hands out abuse and vitriol here daily. Mosher is an equal opportunity offender – Anthony]
And the WORST salesman returns for another blather.
Observe the way Nick conducts himself here, and observe his technical skill. Observe the way he is treated here. I’m sure you can draw your own conclusions.
Nick tends to be wooden and obtuse in his viewpoints, defending even the indefensible, even raising the ire of the normally exceptionally mild-mannered Steve McIntyre, who finally had enough and labeled him “racehorse Stokes” according to Steve McIntyre, Nick has never, ever once been caught admitting he was wrong in even the tiniest of details.
Willis notes: For this sterling quality and high achievement, he’s been christened “Racehorse” Nick Stokes, in honor of of the Texas lawyer Racehorse Haynes, who was famous for never admitting a fault and obfuscation:
See: https://climateaudit.org/2013/04/29/more-kaufman-contamination/#comment-416680
McIntyre also points out that Nick Stokes “slimed” him, by making claims not in evidence:
https://climateaudit.org/2014/10/01/sliming-by-stokes/
People in the know, know that Nick comes with a lot of baggage and time-wasting. Much Like Mr. Schaefer, who went weapons grade pedantic over a wood fired pizza oven and pollution press release I carried.
Note: edit made, the word press was in the wrong place, replaced it with oven, and moved to correct location in final sentence.
Anthony, if you wish to continue that argument you can go for it, and let me post in that thread again, but it has nothing to do with this.
Too funny. Yes anthony I answer fire with fire.
Nick is polite.
Which raises the question.
Why do you let people abuse him.?
[Nick might be polite, you are not. Nick hasn’t complained to me, if he feels he’s been abused, I’ll certainly take note. Your opinion about “abuse” doesn’t seem consistent with your own behavior.- Anthony]
Anthony said: “Nick hasn’t complained to me, if he feels he’s been abused, I’ll certainly take note.”
You’re the boss here aren’t you? Do you think Nick has been abused? Have you done anything about it?
I guess big islands don’t count but in the red centre they’re all inside looking around for some waste heat-
http://www.msn.com/en-au/news/australia/alice-springs-hail-red-centre-turns-white-as-storm-damages-buildings-powerlines/ar-AAhfS6E?ocid=spartanntp
Continental sized islands with minimal population density won’t show anything.
I’m a little curious about the idea of using island nations since their climate is dominated by surrounding ocean. Pop. density may be the key.
Their 7 pt graph has two rises and two drops. There is a good visual similarity but this is where stats are important. It may be quite easy for this degree of similarity to happen by accident on just 7 dots of random data.
Yup
Look at Ireland next door.
To their credit: at least they are looking. This is where climatology should have been 30 years ago !!
Except that they aren’t looking with the eyes of scientists. They are still stuck on stupid – the idea that the warming last century is manmade.
Silly The phenomena has been studied to death over decades.
google Oke energy balance methods
Dubious that heat generated is sufficient to change the temperature of a region.
More probable that local waste heat has biased the temperature measurements.
The reported result is probably a misinterpretation of the urban heat
That’s what I was thinking. On a global scale, people are microscopic.
It depends. In some citys it matters
Yep, UHI really DOES matter.
No matter how much your employers want to discount it.
And yes.. of course it feeds through to the surface temperature data..
Your employers do manage a PROPER and REAL discounting of UHI effect, don’t they Moosh 😉
Upwards in the present, downwards in the past..
Lets call it “regional expectations” shall we.
Summer’s here in the UK and its effing freezing – anything that ups the temperature is ok in my books
Oh dear. What a tragically muddled mess the authors of this “study” have made. First of all though, no mention is ever made of the fact that man’s “waste heat” has polluted the climatic record. That would negate the primary thrust, and apparently the motivation of the study which is that “changes in energy consumption contribute to temperature change over sub-decadal timescales in the two nations considered.” They looked for, and found a correlation and in classic CAGW form, jumped to the causation – man’s energy use.
Sadly for them, the biggest effect of both waste heat and UHI is on the temperature record, not the actual temperature of the planet (if such a thing can even be measured). In other words, sure, there is a very small overall effect but, like the conjectured effect of the additional CO2, it is too small to measure, and of no real consequence on climate.
But Leif Svalgaard said the energy we release as heat is the same as the energy we receive from moonlight, and therefore insignificant.
I am sure he will corect me if I misunderstood that statement.
Yes, it is insignificant in terms of climate. The effect is purely localized. The effect on the “planet’s temperature” would be too small to measure, just like the CO2 we’ve added. It is an absurdity that we are even worried about it, and an insanity for us to think we need to change our forms of energy use because of it.
The moon’s albedo is 0.12, meaning the moon reflects 12% of the energy it receives from the sun. The size of the moon in the sky is about the same as the sun, and the phases of the moon are such that 1/2 the time it is shaded.
As such, moonlight should deliver about 6% the energy to the earth that the sun does. Hardly an insignificant amount.
or you may need to correct for the angle from the moon to earth, vs the moon reflecting into a much larger arc of the sky, which would reduce the effect of moonlight on the earth significantly. in effect, the moon is not a flat mirror pointed directly at the earth, but it seems strange that the edges of the moon to the eye appear as bright as the center at full moon.
That might be true if the entire amount of energy emitted by the moon were to go only to the earth… But it does not. The angle subtended by the earth from the perspective of the moon is small.
While out for a drive look for some of those cooling towers typical at most new power plants. Then look above them at the “cloud” generated by the increased water vapor pumped up into the atmosphere. There seems to b e a constant cloud above the one near me. They also create fog, several of the multi car pile ups on interstate 10 in Texas have been attributed to this man made “fog”. Look at the tops of any high rise, hotel, business office building, again more industrial, water-evaporation, coolers.The wast heat does more than just warm the air, it also affects the atmosphere.
I highly doubt that they “create fog”, though they certainly could contribute to it. Under most circumstances, it would dissipate fairly rapidly, the exception being certain atmospheric conditions in addition to geographic ones causing it to sit in place and therefore build up.
Don’t tell the greens about it. Their answer will be to demand an end to all energy production! That solves the carbon dioxide problem and the waste heat problem. Of course millions of people will die as the world’s economy shuts down but what the heck. What’s a few million lives lost if it will reduce the earth’s temp by a few tenths of a degree.
Last week I flew from Florida to Connecticut. The morning was so clear I was able to take this picture of New York City from the aircraft. The first thing I noticed was how much development there was and almost not green areas. It is obvious that there must be heat retention in all these buildings that dominate the landscape.
http://oi65.tinypic.com/iel1kg.jpg
http://oi65.tinypic.com/iel1kg.jpg
Ah, I see – heat rises and is trapped by all that land in the sky.
/grin
Tiny pics downloaded this upside down of course, Help, anyone?
download this and upload it to the tinypic site
Oops. that didn’t work
http://vps.templar.co.uk/Odds%20and%20Ends/iel1kg.jpg
Thank You
The real problem is the mechanics put the wing back on upside down.
michael 😀
Looks like a fine picture of Queens, to me, with Manhattan in the Distance, and the beaches in the foreground. Did you land at JFK ( on the right hand side of the window.)?
I thought it was a temperature inversion, Tom. Nothing you can do about that.
There are no inductive inferences.
Karl Popper.
All knowledge is provisional, even scientific ‘laws’. Read more on Popper.
http://plato.stanford.edu/entries/popper/
Your statement is hardly the end of his analysis of science/non-science. Nor is Popper’s the last word.
Third, we carried out no other statistical study of these or any other data sets.
==================
this is very important. it establishes that the study was not contaminated by “methods shopping”
all too often climate scientists try various statistical methods until they finally find one the returns the results they expected (wanted) to find. Which completely invalidates the conclusions. However, no one sees this, because the climate scientists do not report what other methods they tried. This (methods shopping) leads to the crisis of false positives currently found in many areas of science.
Third, we carried out no other statistical study of these or any other data sets.
==================
this is very important. it establishes that the study was not contaminated by “methods shopping”
I blinked at that sentence. Did they deliberately avoid trying to break their theory with different tests, or did they not have enough time/money?
“Don’t tell the greens about it. Their answer will be to demand an end to all energy production”
Exactly, I’ve felt for some time that the reason CO2 was being demonized was because it is a proxy for energy production. This gives a rational for attacking any energy production that is not renewable regardless of whether it produces CO2 or not. So no fission or fusion guys. Back to wind and solar.
Their answer will be to demand an end to all energy production
===================
Clearly it was the domestication of fire that got Adam and Eve kicked out of the Garden of Eden. It wasn’t sex after all. The Church has got it all wrong. Fire was the forbidden knowledge.
No, an end to all cities. Pol Pot was ahead of his time!
The implications of this study are huge because it means that shifting to “green” energy sources will not stop the rise in temperatures. Rather, we have to stop using energy, which means that industrial civilization itself is the problem.
We must either do away with fire, which is the basis for human existence outside the tropical jungles, or we must learn to live with higher temperatures.
Either we return to the jungle or learn to enjoy the extra warmth, because we have run smack dab into the laws of thermodynamics.
The heat release from fossil fuels is recycled solar heat absorbed in the carboniferous period.
“Japan has a warmer climate and therefore less need to heat buildings”
Nonsense. Most of Japan has colder winters than Britain.
The average January temperature in Tokyo is about 0,5 degrees lower than in London. It is really only the southernmost island Kyushu that has milder winters than the UK (but not milder than SW Ireland). Northern Japan has much colder winters than anywhere in the British Isles (the tops of the Cairngorms possibly excepted). January temperatures in Sapporo are actually lower than in Oslo or Stockholm and northern Hokkaido is even colder (about equal to St Petersburg).
Annual averages are higher in Japan because summers are warmer, not because winters are milder. Japan is an island nation, true, but the island is situated on the western side of an ocean, so the climate is actually much more similar to the eastern US than to Britain.
The surface station record(s). (They’ve been changed quite a bit over the years.)
Why does “it” make me think of the kid who wants to stay home from school holding the thermometer over a light bulb so it looks like he has a fever?
The results of this study are not to be believed. Dividing total UK energy use (2250 TWh per year) by land area (2.4e15 m^2) gives about 1 W/m^2. With a transient climate response of about 1.3 K for 3.7 W/m^2, that would give warming of 0.3 to 0.4 K. Heat does not stay in one place, so any local heating must be *much* less than this. And any short term variation in temperature must be due to variations in energy use, which is a small fraction of total energy use. With annual average T covering a range of 2 K (Figure 1) any signal must be lost in the noise.
The result must be a coincidence. There was a drop in UK energy use that happens to coincide with a drop in T. The odds of that being a coincidence are high, even if you don’t consider the numbers that show that it must be a coincidence.
And the data are fishy. Figure 1 shows a 20% drop in UK energy use. How is that possible? The only thing I can think of is that it is due to reduced North Sea oil production. That only reduces UK energy production if you assign the energy from oil to the place where it is produced rather than the place where it is burned. But the heat is released where it is burned. So it looks like they are using the wrong data.
Compared to this study, Michael Mann does good work. And Michael Mann produces junk.
Looking at their data source.. well.. Go figure the link gven in their paper is dead.
http://www.bp.com/en/global/corporate/about-bp/energy-economics/statistical-review-of-world-energy.htm
but I found the current data.
http://www.bp.com/content/dam/bp/excel/energy-economics/statistical-review-2016/bp-statistical-review-of-world-energy-2016-workbook.xlsx
For the UK
First data point is 1965
The drop from 220 to 200 to 193 is the period you are talking about
197.6 198.3 198.1 205.0 212.4 217.0 213.0 216.0 226.7 215.3 203.0 207.0 210.8 211.7 221.2 201.6 195.9 193.2 193.7 193.6 201.7 207.2 206.9 209.4 209.5 211.3 215.8 214.4 216.7 214.0 214.8 225.3 221.1 223.3 222.0 224.2 226.8 221.9 225.1 226.6 228.9 226.3 219.7 216.4 205.2 210.5 198.8 201.9 201.4 188.9 191.2
Steven Mosher,
And your point is?
From your numbers, it looks like the drop is from 226.8 to 188.9. OK, so 16% compared to the rough 20% I estimated from the figure. That is still suspicious.
My point was to help you Mike.
sorry.
You said the data looked fishy
Yes. so is it a chart probem? or processing problem? or underlying data problem.?
who knows?
Silly me I thought you wanted to find the answer so I gave you a link to the data.
My sense is your answer will be found in the document I linked to… if at all.
But if all you want to do is comment on blogs then ignore the data and carry on.
You sounded science minded to me… so I pointed you at the data
Steven Mosher,
Yes, I am a science minded person. As such, I do not believe in mind reading.
You sent an Excel file consisting of a few dozen links. I still don’t see much point to that. And I don’t see much point in tracking down the exact source of the study’s error; it will still be meaningless. And unfixable.
I realize that just because it is stated multiple times doesn’t make it the least bit true but were the claims based on something real?
At various climate sites, in discussions of possible warming sources, it has been stated that estimates of total annual human energy usage, from all energy sources, equals only a few hours of TSI. Thus heat from human activity (it all becomes heat, “waste” or not) cannot possibly influence temperature on the global scale.
There are plenty of figures on TSI floating around. Are there any reasonably reliable numbers on total human energy usage?
I have to say that although it is raining outside and the temperature outside is 16 degrees centigrade I am not freezing here in Lincoln UK it is now nearly seven degrees warmer inside my flat than outside with no heating on and the difference is getting larger each week with longer days and shorter nights keeping the temperature inside warmer. I admit that if we had seen the sun more than once every six days it would be a bit warmer but we saw even less of the sun during the formation of the last la nina .
One more time this is the engineering definition of waste heat
Waste heat
Waste heat is by necessity produced both by machines that do work and in other processes that use energy, for example in a refrigerator warming the room air or a combustion engine releasing heat into the environment. The need for many systems to reject heat as a by-product of their operation is fundamental to the laws of thermodynamics.
Waste heat – Wikipedia, the free encyclopedia
https://en.wikipedia.org/wiki/Waste_heat
Any skeptics wanna make a bet?
I have a really dense Island… Taiwan.. more densely populated than the UK
And we calculate the difference between Taiwan temps and the global temps after 1965
And the Primary energy consumption has gone up 10X
Given the authors thesis this should result in an increasing divergence between Taiwan temps and the global temps..
Any takers on falsifying?
And then Ireland…
Lets see what the Thesis is.
1. Look at the UK difference from Global Delta T
2. Look at the UK energy Consumption And see that dip around 1980.
3. Note that the Delta T goes Up and down like the energy consumption does,
So, Lets check Ireland..
Any bets? come on…
Mosher,
Not sure what you are saying, but I think you raise the right point. To make the claim the study makes you need to look at a lot of cases, not just one or two.
It’s pretty simple.
.. There is an easy check just to the west of the UK, namely Ireland, and also the Isle of Man
The authors look at the difference between UK temp and Global temp and define this as a residual.
They then argue that this residual ( after you average 7 years of it) is correlated with energy use or waste heat.
I’ll bet that the temperature record for Ireland and the Isle of Man have the same residuals as the UK..
not because of waste heat, but rather because the climate of those places is dominated by SST.
dont get me started on Island data…
Mosh must be being paid overtime. !
Just being funny here, but is Man made global warming hitting Japan and Ireland??
I expect will to come along and explain some things.
How did they decide to average over 7 years?
When you smooth data over 7 years and then look for correlations what will happen?
Waiting for William Briggs to show up and admonish people about looking for correlations after smoothing…
na… wont happpen
In the local environment in the developed world, the 20 to 40F higher temperature of asphalt is much larger than 3.7Wm2 forcing, plus the time constant for cooling at night is far far longer than the atm. This could easily explain warmer summer temps in the more developed northern hemisphere and the lack of a positive anomaly by the end of the year.
https://micro6500blog.wordpress.com/2015/11/18/evidence-against-warming-from-carbon-dioxide/
The warmists have claimed the fastest warming from GHG based heating would/will be near the center of the troposphere by altitude. The alleged heating has been pointed out in the “boundary layer” Alchohol and mercury thermometers are located and observed there too..
The heat energy discussed in this paper is put into the boundary layer. Might be something here. At least this “practical heat” is in the right place when released. We are also raising the near surface humidity in areas and ol’ water vapor really does slow the loss of energy.
Some increase in temps is the fault of “ikky” humans. Land use, UHI effects of roofs and walls and streets, released energy. Just not warmists targeted GHGs.
The warmists have claimed the fastest warming from GHG based heating would/will be near the center of the troposphere by altitude.
Tropical tropospheric ‘hotspot’? That’s a prediction of heat transfer in the atmosphere regardless of the cause of warming (solar, volcanic, GHG, cloud cover changes). It’s not solely a GHG signature.
…anything but GHG. Anything, otherwise it’s a conspiracy.
ABC – Anything But Carbon. 🙂
Sigh, I’ve been saying this as a naive observer for decades. I can remember late nights watching satelite weather channel in Switzerland in the early ’90s showing cold fronts from the Arctic dissappating when they hit the ‘urban high pressure system’ caused by all the central heating in Europe. Everyone always dissed my view… It always seemed to me that the vast cooling towers of power plants of both coal and nuclear were pumping vast amounts of sensible heat directly into the atmosphere but this has always been ignored as trvial in all modelling.
note that cooling towers do [not] release excess heat at 2meters above the surface
And so it is.
Note that evaporative cooling in cooling towers is latent heat. Warming occurs when the water vapor condenses releasing latent heat that surrounding air absorbs becoming sensible heat. Note also that differences in land elevation can be higher than the cooling tower.
I’m interested in the phrase “There is also the waste heat released when we generate and use energy – even clean energy.” In some cases maybe not. For example when water “falls” through a hydro generator it heats up less that it would have heated up had it flowed down the open river. The hydro generator turns that heat differential into electrical energy.
Solar panels may sometimes do the opposite. For example if you put a solar panel on a steel roof, the panel will absorb visible light that might otherwise have been reflected back out to space, and heat up as a result. Has anyone done that calculation?
The hydro generator turns kinetic energy differential into electrical energy. By passing the water turbine, the water speed slows down. Heat enters the equation via Joule heating.from the electric current. Same is true with solar panel. Joule heating is P = dV I
where P is power converted from electricity to heat, dV is drop in voltage across the conductor and I is electric current moving in the conductor
In a Pelton wheel kinetic energy is converted into electrical energy; the electrical energy eventually ends up as heat into the environment.
All heat ends up in the environment. Work is performed in the process by some.
More work is desired and done when temperatures fluctuate. So which is cause, which effect?
They are cause and effect. Work and heat are interchangeable. Heat engine turns heat into work. Heat pump turns work into heat. But kinetic energy eventually turns into waste heat due to friction.
It seems to me that “waste heat’ is irrelevant. Unless energy “used” is just converted to a different form and stored, it all ends up as heat in the environment. Even if human use process were 99% efficient, the heat eventually released from energy consumption would be essentially the same as if everything were only 1% efficient (i.e. 99% waste) — assuming the same total energy use.
Isn’t the real question about how much energy humans use vs how much the sun supplies to the earth (plus geothermal, radioactive decay, and such, which may total too little to be relevant)? If total human energy use is very small compared to total extra-earth energy input, it can’t have much effect on whether the earth environment as a whole heats or cools.
The question is how much waste heat is affecting our urban thermometers. My body heat is negligible compared to solar heat but if I put a thermometer in my armpit, it would measure 36 C even if ambient temperature is 10 C.
The total solar energy absorbed by Earth’s atmosphere, oceans and land masses is approximately 3,850,000 exajoules (EJ) per year.[10] In 2002, this was more energy in one hour than the world used in one year. https://en.wikipedia.org/wiki/Solar_energy
Why is this red herring even being discussed here?
Oh wait…
The crux is that although power from renewables including solar end up as heat in the environment they do not generate CO2. This is the red herring as CO2 does not cause cagw or climate and neither does water vapour.
The same enormous solar energy exits the Earth’s atmosphere. Only a tiny radiation imbalance at the TOA changes earth’s temperature. No change in temperature at thermal equilibrium. So it matters if the thermometer is in my armpit or not. It disturbs the thermal equilibrium of the thermometer.
“Only a tiny radiation imbalance at the TOA changes earth’s temperature.”
As measured by satellite, right? In other words, the outgoing is less than the incoming.
If so, how could human generated heat cause a net retention of energy? An increase in human generated heat should cause an increase in net out-going radiation shouldn’t it?
” As measured by satellite, right? ”
And if memory serves those satellites have about 17 W/m2 , and have to detect 3.7Wm2, how to they accomplish this miracle? They just recalibrate it for an imbalance of 3.7Wm2, because that’s just what is has to be because that’s the imbalance co2 would cause.
Morons.
When the cooling kicks in over the next several years, I just want to remind the likes of Mosh and Nick…
YOU went along with this scam.
YOU took the money !
When the cooling kicks in over the next several years..
I just want to remind the likes of Mosh and Nick and barry..
YOU went along with this scam…
YOU accepted the money.
So you see the entire thing here as simply a question of the validity of urban thermometer readings being projected on global temperature calculations, not any question as to whether or not there is any real effect or urban energy usage on climate, global or regional?
I think waste heat is perceptible in cities and near power plants. Hot exhaust gas and thermal radiation from cars and power plants could make air temperature warmer. I don’t think it will affect the oceans and uninhabited places. Since most people live in cities, it is not a small thing.
That was my point. There has long been a controversy as to whether the temperature readings from many stations are strongly biased towards warming because they are in or near urban areas. The consensus position, as expressed in the official temperature records is: very little. The article suggests otherwise. Good so far, valid questions.
But, a lot of the discuss in this thread seems to be suggestion that heat from human activity may directly heats the general environment enough to raise the global average — rather than simply biasing temperature calculations. That is a completely different matter and seems very unlikely.
There is no doubt at all that urban heat feeds through to the calculated global temperature, quite significantly.
Does it cause “global warming”… almost certainly not.
Actual global warming, and the calculated surface temperature, are two TOTALLY separate entities with barely any correlation between them.
Unfortunately actual global warming exists only in the mind of the purists. Global warming as we know it is calculated surface temperatures. Maybe the ultimate solution is to get rid of this phantom concept of global temperature. Let’s only deal with local temperature that people can actually feel. Most of earth’s heat resides in the solid interior and the ocean deeps but who cares? People don’t live there.
By the way, waste heat can also affect SST measurements because the intake port of ships is warmed by waste heat from the engine room.
The greenhouse effect isn’t the only thing warming things up. There is also the waste heat released when we generate and use energy – even clean energy. Yet the regional impact of that heat – which moves from warm buildings, engines and power plants into the world around us – has not been well accounted for. A new study now shows waste heat may explain some temperature variations at a national scale better than do global climate change models.
Seems pretty clear to me what this article is trying to do. To accuse the author of attempting to muddy the water is being especially lenient.
The lesson here is, don’t waste another mans heat! or “waste heat”
” a cold enough place to require indoor heating for about six months each year”
In amongst all the bickering about “waste heat”, you all let slip the fact that he thinks the British heat their homes for only 6 months a year.
Don’t know about the rest of you, but mine is still needed.
RS
Middlesbrough
Almost all energy consumed ends up as heat in the atmosphere.
Even energy that is converted to motion will become heat as friction slows down the thing that is moving.
About the only energy that doesn’t end up as heat is light energy that manages to escape to space.
Um no…
lol Light at all frequencies change when it arrives and leaves earth, therefore its energy does change, for example UV that enters the atmosphere and reaches the surface strikes your skin and leaves an afterglow of infrared.