
From the UNIVERSITY OF EXETER
The human-caused rise in atmospheric concentration of carbon dioxide is being given an extra boost this year by the natural climate phenomena of El Niño, say climate scientists in a paper published in today’s edition of the journal Nature Climate Change. As a result, 2016 will be the first year with concentrations above 400 parts per million all year round in the iconic Mauna Loa carbon dioxide record.
Lead author Professor Richard Betts, of the Met Office Hadley Centre and University of Exeter, said: “The atmospheric carbon dioxide concentration is rising year-on-year due to human emissions, but this year it is getting an extra boost due to the recent El Niño event – changes in the sea-surface temperature of the tropical Pacific Ocean. This warms and dries tropical ecosystems, reducing their uptake of carbon, and exacerbating forest fires. Since human emissions are now 25 per cent greater than in the last big El Niño in 1997/98, this all adds up to a record CO2 rise this year.”
The rising trend in CO2 was seen by Charles David Keeling when he began recording CO2 at Mauna Loa, Hawaii, in 1958. His early measurements were around 315 parts per million of carbon dioxide, 60 years later this has been rising at an average rate of 2.1 parts per million, but using a seasonal climate forecast model and statistical relationship with sea temperatures, Professor Betts and colleagues forecast the rise this year to be a record 3.15 + – 0.53 parts per million. The average concentration in 2016 is forecast to be 404.45 +-0.53 parts per million, dropping to 401.48 +- 0.53 in September before resuming their ongoing rise next year. The scientists already successfully predicted this year’s maximum concentration of 407 parts per million last month.
Carbon dioxide concentrations also show modest ups-and-downs with the seasons. Plants draw down CO2 in the summer and release it again in the autumn and winter. Professor Betts said: “Carbon dioxide at Mauna Loa is currently above 400 parts per million, but would have been expected to drop back down below this level in September. However, we predict that this will not happen now, because the recent El Niño has warmed and dried tropical ecosystems and driven forest fires, adding to the CO2 rise”.
Since natural processes only remove carbon dioxide from the atmosphere gradually, levels will remain high even if human emissions began to decline. Scientists expect the concentrations to now remain above 400 parts per million for at least a human lifetime.
Prof Ralph Keeling of the Scripps Institution of Oceanography, who is a co-author on the paper, said: “Back in September last year, we suspected that we were measuring CO2 concentrations below 400 parts per million for the last time. Now it is looking like this was indeed the case.” The ongoing CO2 measurements at Mauna Loa used in this study are made by the Scripps Institution of Oceanography, and an independent set of measurements are made by the US National Oceanographic and Atmospheric Administration, which runs the Mauna Loa Observatory.
Chris Jones, also of the Met Office Hadley Centre and another co-author, said: “Studying how these natural cycles interact with human influences is an important part of climate science. Making and testing predictions like this helps us build our understanding and further develop climate models.”
###
They are still trying to defend a long residency time for CO2?
Yes, they prefer what makes their models “work” to what empirical results.
Might be my English and the wording, but how can El Niño boots anthropogenic emissions? It can boost natural, but not anthropogenic.
Does this mean that our measly 0.12% attribution to the atmosphere is now even smaller? Go figure
I caught that, too. It implies that somehow there’s a connection between increasing El Nino CO2 and increasing human CO2. In fact, an argument could be made that El Nino may have actually REDUCED the amount of human CO2 released by reducing the need for heating of homes/offices, etc.
Good catch. The reduced heating requirement was pronounced in dollars, percent, and probably CO2.
Even in the UK the design load of a commercial A/C installation has higher energy demand than the Heating load and so El Nino could well have anthropological help in elevating Co2 levels methinks.
Think your answer was here where they say that dryer air changes the uptake of carbon.
Fransisco
El Niño did not boost emissions, it boosted the rise in concentrations which was already happening due to anthropogenc emissions.
Would there be a spike in CO2 following the temperature spike after the relevant lag time?
Well done El Nino,
Well done humans.
The atmosphere and the world’s plant life needs as much extra CO2 as it can get.
Towards 800ppm ! 🙂
Richard: If El Nino ‘boosted the rise in concentrations’ (but MM CO2 emissions stayed the same), that’s like saying the ratio of MM CO2 to natural CO2 (or whatever makes up the rest of the atmosphere) has changed because something else reduced. What was reduced?
Fancy that!
Got any OCO-2 satellite measurements proving that?
[youtube https://www.youtube.com/watch?v=_UEZqyGU5RU&w=560&h=315%5D
Isn’t it odd, that with accurate satellite measurements NOAA prefers their CO₂ models; i.e. imaginary CO₂?
Richard Betts — the 60-year cycle in global temperature, the Sine curve reached to its peak in 2016 [+ 0.3 oC] and now it is in descending mode and in 30 years it will reach to its negative peak [- 0.3 oC]. In addition, the positive urban-heat-island effect is contributing to global warming is steadily increasing while the negative rural-cold-effect is though steadily increasing its contribution is not added to global temperature trend. Unless such factors are taken in to account, it is unethical to attribute the increase to global warming. If somebody show the scientific community the quantitative relationship to global warming with CO2 and then quantify the contribution of global warming to global temperature. Without that simply qualitative statements have no meaning. My indirect deduction shows the global warming component is less than 0.15 oC so far.
Dr. S. Jeevananda Reddy
Richard, you are right, I re-read it and can be interpreted as you say. Thus it just goes to prove how measly and irrelevant anthropogenic emissions really are.
bah, humbug.
the warming oceans since the little ice age have been releasing dissolved gases at a rate commensurate with their warming.
remember,, al gore got a nobel prize for showing the graph.
so no, the nino didn’t boost human emissions.
humans added a little bit to the ocean’s releases.
gore was not even stupid enough to attribute oceanic co2 release to humans.
and brother, he’s pretty darn stupid.
but he didn’t go to berzerkeley which has graduate programs in it.
Many of us caught this. However, the increase in CO2 will be great for agriculture around the world. We need to count our blessings.
Francisco,
Human emissions are about twice the measured increase in the atmosphere and the increase in the atmosphere depends of the net sink rate in nature (land + oceans). Based on the 13C/12C variations, it is clear that tropical forests are very sensitive to (ocean) temperatures (El Niño) and following rain patterns. Higher temperatures dry out the forests which result in less uptake and thus more CO2 remaining in the atmosphere. That can be seen in the 1998 El Niño period and reverse for the 1992 Pinatubo eruption:
http://www.ferdinand-engelbeen.be/klimaat/klim_img/dco2_em6.jpg
The red line is the theoretical CO2 increase as result of human emissions at one side and the linear response of the oceans to the increased pressure of CO2 in the atmosphere above the steady state equilibrium at the ocean surface temperature per Henry’s law.
The 0.12% is a bad argument: even if it was only 0.001%, it is additional and as long as nature can’t remove it fast enough, part of it remains in the atmosphere…
The reason for dCO2/dt variations is not the forest drying; it’s the ocean CO2 solubility – the Henry’s law directly.
Francisco, this is interesting, but the explanatory note is a little terse.
I take it that you are making the point that Henry’s Law produces a curve that is consistent with observations, because one can see that the red line would coincide with a running mean of the observations.
I assume that the key aspect of Henry’s law is that more CO2 dissolves in seawater as its partial pressure increases. A rise in ocean temperature would have the inverse effect of making CO2 less soluble.
But what is most striking to my eyes is the divergence after 1980 between the emissions and the observations.
Could you please comment on that. Would it be correct to say that the two effects on CO2 acting in opposite directions has the net effect of producing this divergence?
That’s the part that needs further comment.
Francisco, sorry. I should have addressed my request to Ferdinand Engelbeen.
Your hand-waving comments are reading what you want to see into what is there.
Measured dCO2 is seen to fall from around 1988, how on earth do you manage to attribute that to an eruption is 1991? Like most volcanic attributions, you ignores the pre-existing downward trend and falsely attribute what follows to Mt P. This is the foundation of exaggerated volcanic cooling which is the bedrock of exaggerated CO2 warming.
Where is the data to support your assertions about the 1998 spike being due to tropical forests? Blind speculation IMHO.
Mak, the effect on CO2 caused by ocean temperatures is of course present too, but the effect on vegetation in this case is quite dominant.
How do we know? If CO2 is released or taken away by the oceans, its effect on the 13C/12C ratio of CO2 in the atmosphere is rather modest and the ratio change parallels the CO2 level change. If CO2 is moved thanks to vegetation, its effect on the 13C/12C ratio is huge and opposite the CO2 changes. In this case it is shown that an El Niño increases CO2 remaining in the atmosphere and at the same time 13C/12C levels get firmly down. Thus vegetation is the dominant cause:
http://www.ferdinand-engelbeen.be/klimaat/klim_img/temp_dco2_d13C_mlo.jpg
Frederick Colbourne,
The 1991/92 Pinatubo had a huge effect on the CO2 uptake by plants: there were enormous amounts of aerosols spread in the stratosphere, which scattered sunlight in all directions. While that decreased direct sunlight and has some lower temperatures – more uptake by the oceans – its effect on vegetation was remarkable: photosynthesis increased a lot because lots of leaves normally part of the day hided after other leaves for direct sunlight were receiving more sunlight over longer periods…
There was a nice overview of that event (based on satellite observations of chlorophyl reflection), but my reference got lost in cyberspace…
As my calculation is for oceans only, such events are out of the “normal” temperature – CO2 response…
Ferdinand Engelbeen. Thanks for both further explanations.
I am puzzled by the fact that the Mt. Pinatubo eruption occurred in June 1991, but most of the decline in observed CO2, from about 3.0 to about 0.2, occurred before the eruption. (There may have been a lot of CO2 ejected which might account for at least for part of the rise back to 2.5.)
The divergence between the blue and red lines started about ten years before Pinatubo and seems to have continued to the present. That’s what I find most interesting.
I don’t know what to make of this. Any suggestions?
Frederick,
One should take into account that the net sink rate is independent of the momentary (yearly) human emissions, as the former only depends of the extra CO2 pressure in the atmosphere above steady state for the momentary ocean surface temperature.
Thus there is no real reason that the “airborne fraction”, the amount of CO2 remaining in the atmosphere, would be fixed at a certain percentage of human emissions. The only reason that it still is around 50-55% is that human emissions increased quasi-quadratic over time and so did the increase in the atmosphere and the net sink rate. That gives a rather constant ratio between increase in the atmosphere and human emissions. Despite that, temperature (and other natural variations) plays a role: from year to year the increase is 10%-90% of human emissions, over decades it varies with 40%-60%. The remarkable point is that in between the huge variability, the response of the main natural sink: the oceans still is quite linear. Compare the calculated (red) line with the (green) observations: in general it is in the middle of the noise. Only after the Pinatubo there is a huge offset downward.
Also look at the last period: no increase in human emissions, due to the economical crisis, still the emissions are larger than the increase in the atmosphere, which makes that the net sink rate increases due to increased CO2 pressure, thus the “airborne fraction” is reducing.
If human emissions remained the same for a long period, the CO2 levels would go asymptotically towards a new equilibrium where emissions and sinks ultimately get equal. If we should reduce our emissions (if necessary at all) to half what they are today, no increase in atmospheric CO2 anymore…
What can be inferred from OCO-2 and GOSAT data, I’d like to know. Measuring CO2 on Mauna Loa is useless, as it tells us nothing about where the CO2 is coming from and where it’s going.
The term ‘well-mixed gas’ is a misnomer. The values at Mauna Loa are from the pacific Northern Hemisphere, which right now has little variation. However, at earth.nullschool, you can see that there are NH land locations with quite lower values, and that is true for SH African, Australian and Southern ocean locations.
https://earth.nullschool.net/#current/chem/surface/level/overlay=co2sc/orthographic=-165.28,13.56,403/loc=142.513,-23.215
At the moment, Hawaii is downwind of Southern California. On the western Pacific, Are major population centers as well.
Actually it does tell us where it has come from and where it is going. It is one the most revealing sites in the Pacific corrodor. The only problem is no one has correctly interpreted what it Mauna Loa actually records – yet. Stick around.
It is also consistent with the assertion that temperature drives CO2 levels, not the reverse.
Yes
It’s both.
Que?
And that knowledge was vouched safe to you by whom, pray tell.
Only in the fairy tale world of Warmland.
Not only in Warmland, but here in reality too. Basic chemistry.
http://www.ausetute.com.au/henryslaw.html
Haven’t we had this conversation?
Just because temps and CO2 levels appear to rise and fall together doesn’t mean that either drives the other.
However, it does make more sense that the one that changes first could be the driver, rather than the other way around, does it not?
Yes, both. Obviously.
Dr. Betts is correct.
betts is trivially correct in about the same sense that humans contributed to ocean rise by watering the porcelain bowl.
but nobody got that feverish over the prospect of taxing people to discourage their hydrogen pollution.
yet.
Dr. Betts not only is right, but some figures may help to rest this case:
Influence of temperature on CO2 levels:
– Seasonal:
~5 ppmv/K globally, mainly due to NH extra-tropical forests. T up, CO2 down and 13C/12C ratio firmly up
– Year by year variability (1-3 year periods):
– 4-5 ppmv/K globally, mainly due to tropical forests, T up, CO2 up and 13C/12C ratio firmly down.
– Multi-decadal to multi-millennial:
– 16 ppmv/K globally, mainly due to (deep) ocean changes. T up, CO2 up, little change in 13C/12C ratio.
On short periods vegetation is dominant, but that practically levels of to (near) zero in a few years, even slighlty negative: the earth is greening… Over longer periods (MWP-LIA, glacial-interglacial) the oceans are dominant but limited to Henry’s law for its influence: about 16 ppmv/K or maximum 13 ppmv of the 110 ppmv increase since the LIA. The rest comes from the 200 ppmv human emissions since that period…
Dr. Betts is correct because CO2 does cause some amount of warming and warming does result in a certain amount of oceanic outgassing.
The amount of outgassing, however, is relatively small (~100ppm from glacial to interglacial for a >10C shift), so it is only a small positive feedback, on the scale of perhaps 10ppm since 1980, which is a mere roundoff error in terms of warming going forward.
Henry’s law and all that. I opened a bottle of warm soda they other day, and it sprayed itself all over the counter.
Note to self: warm water holds less CO2 than cold water.
So ocean “acidification” is over?
Yep Phillip, The El Nino has driven all that CO2 back into the atmosphere, where it is actually useful.
Phillip –
don’t you mean ocean “CO2-ification”?
Photosyntheis in the top 100 meters by phytoplankton take their CO2 from the dissolved CO2. Despite, the ridiculous acidification alarmism (there is too much buffering for that to occur) on carbonate shell formers, phytoplankton are also strongly reponding to the CO2 where their are sufficient levels of other micronutrients like iron, reduced nitrogen, phosphate, and magnesium.
So ocean “acidification” is over?
Just overestimated.
“Lead author Professor Richard Betts, of the Met Office Hadley Centre and University of Exeter”,
From Bishop Hill
quote :First up is Richard Betts, responding in the comments thread to a preposterous article in the Independent, entitled “Official prophecy of doom: Global warming will cause widespread conflict, displace millions of people and devastate the global economy:
“I’m one of the authors of the IPCC WG2 report, and I think this article by the Independent is highly irresponsible, especially the headline.”/quote
http://bishophill.squarespace.com/blog/2014/3/19/academic-takedown.html
The conclusions of the article, that the CO2 has risen this year because of biosphere release adding to human emissions is not correct.
It is the troposphere atmospheric capacity increase in the mid to high NH latitudes, created by the El Nino heat transport northward that allowed the conditions for tropospheric retention of CO2. It is the atmospheric temperature during winter and spring in the NH mid to high latitudes that is the only controlling factor.
Has this pile of poop been covered:
http://www.climatesignals.org/
Rockefeller Philanthropy sponsored Climate Nexus (Jeff Nesbit) put it out.
Its fairytale stuff.
Excellent news – we need as much CO2 as we can possibly generate. However, I question the opening sentence. How can a “human-caused” rise in CO2 be given a boost by a “natural climate phenomenon”? Poor wording which demonstrates the bias of these “scientists”.
Is there an officially accepted level of CO2 that humans release into the atmosphere or is it entirely dependent upon which scientist happens to be talking?
You mean a consensus?
Consensus always starts with “con”.
it’s a pretty easy calculation. You take all the oil, gas and coal produced in year X, and you assume that all that is consumed in the same year, which is a relatively safe assumption to get to a ballpark figure, and then use basic high school chemistry to calculate the amount of CO2 produced by burning all that stuff.
There are other sources of course but they tend to be negligible compared to what comes from burning fossil fuels.
Cheers,
Ben
Pretty strong argument that some of the increase in CO2 since 1850 has been due to post Little Age Age recovery/warming and nothing to do with humans.
Benben, I agree with you on this narrow point given one rather significant restatement.
The natural CO2 fluxes are enormous. Much larger than AFF. But they happen to about cancel out to net plus minus zero, which is why the ice cores show a relatively stable ~280ppm for many Holocene centuries before the industrial revolution. So the net gain is likely anthropogenic FF consumption to a first order magnitude (anthropogenic land use is probably second order–Chicago was once prairie). The reason delta atmospheric CO2 is less than delta AFF is simple; the planet is greening; simply meaning biological sinks are increasing from previous sink rates. C3 plants were ‘starving’ for CO2. A reason C4 plants recently evolved.
I also looked carefully at Salby’s counter claims based on all three of his available videoed presentations; they are wrong in several respects.
hey hey, no need to argue all the time. I responded to the question ‘Is there an officially accepted level of CO2 that HUMANS release into the atmosphere’
Rivstan
Your conclusions regarding the balancing nature of the carbon cycle are all pure speculation. It does not balance and never has. There is not one shred of evidence to support this theory. Please supply evidence if you have it, and please no, IPCC carbon budgets.
http://www.drroyspencer.com/wp-content/uploads/simple-co2-model-fig01.jpg
http://www.drroyspencer.com/wp-content/uploads/UAH_LT_1979_thru_Jan_2011.gif
http://tamino.files.wordpress.com/2011/04/dco2.jpg
ristvan, don’t know what it is why the graph won’t show… If greening is causing more uptake of co2, then why was the uptake greater in the 90s percentage wise when it was cooler (with less greening) than later on after the temps rose circa 2000?
http://www.woodfortrees.org/graph/plot/esrl-co2/from:1958/mean:24/derivative/plot/hadcrut4sh/from:1958/scale:0.31/offset:0.09
Kwikikid, study the ice cores. Then get back. I was specific and clear about empirical evidence. Not my to do to educate you. Your to do to educate yourself. Then get back with credible counterfacts. You cannot, since there are none.
Afonzarelli (Happy Days?) I never said CO2 was not rising. Your graph points out it is. I agree. What I said was it is rising significantly less than Benbens simplistic AFF calculation would suggest, and the diffrence is greening of CO2 starved biosinks. Thanks for the evidentiary support.
The carbon growth rate has been tracking with temperature since the inception of the MLO data set over half a century ago. If we see cooling in the upcoming years, hopefully that will destroy the myth that plants are taking up extra co2 as the planet greens. Cooler temps mean greater uptake, while warmer temps mean lesser uptake. Hopefully, too, a nice prolonged cooling spell will send ferdinand out to pasture as well… (☺)
ristvan, we seem to be playing “computer tag”. I think my comment after yours sums it up. If it were warmer (and greener), there would be less co2 uptake and visa versa (that is, cooler/less green greater uptake). And, yes… aaaaaaay!
Ben
Actually no. The level this year only increased by 0.17 ppm/v over 1998. Since 1998 the output of co2 is close to 10 billion metric tons more a year than in 1998. That doesn’t include all the co2 that has been added along the way. Nobody knows what the other sources are or how big. And nobody knows how large the sinks were, are, or could be. If anything the rise should be at least over 4 ppm. And if the carbon cycle was near stable with only man made co2 being added, the ppm/v should be much higher each and every year by calculation. Each and every year after 1998 should have been at least 3 ppm or higher.
Did the production of co2 fall off the charts in 1999? After the el nino in 1998, the rate of rise in co2 was less than 1965 by a full 0.10 ppm. You should trot out the tried and true IPCC statement that co2 last hundreds if not thousands of years in the atmosphere or that they can tell man made from naturally produced….. both statements are wrong. Even in this article the half life of co2 is 35 to 50 years and there are a whole bunch of problems with isotope ratios. Which is related to the half life.
You don’t understand the full depth of what’s going on. It shows in your simplistic answers.
Simply put, the sinks are enormous and there are no negative numbers in the increase since Anthropogenic began. 12 billion metric tons was produced in 1965 . 6 billion made its way to a 0.98 ppm/v increase. In 2015, 19 billion disappeared. Why wasn’t there a negative number in 1965? What’s that saying is that in 1965 the entire 12 billion plus another 7 billion, with no increase in co2.
Fonzie,
As usual, you are looking at the natural “noise” around the trend, which is near entirely caused by the transient response of (tropical) vegetation on El Niño (and Pinatubo). That completely cancels out within 1-3 years to (below) zero, as vegetation as a whole is a small, but increasing sink for CO2. The earth is greening.
The year by year variability in the CO2 rate of change (+/- 1.5 ppmv around the trend) says next to nothing about the cause of the slope, which is entirely not from vegetation. As vegetation is a net sink for any period longer than 3 years and the oceans only a small source and humans emit twice the observed increase, you need to invent quite remarkable causes to avoid the human cause…
BTW, the 1990’s show a huge dip in CO2 increase due to the Pinatubo eruption: not only by cooler ocean temperatures, but the huge aerosol load in the stratosphere caused light scattering which made that leaves normally part of the day under the shadow of other leaves for direct sunlight where producing more than their normal share of photosynthesis. That was measured by satellites…
rishrac,
There is no need at all to know any of the natural CO2 fluxes in or out, as we know the net result at the end of the year quite well. The net result is that the remaining natural variability is not more than +/- 1 ppmv around the trend with the extremes (1992 Pinatubo, 1998 El Niño), not more than +/- 1.5 ppmv, while the trend is currently average around 2 ppmv/year with human emissions over 4 ppmv/year.
Thus all natural variability is less than half the human contribution, whatever the total natural ins and outs might be every year.
Looking at the noise of the year-by-year increase is blinding yourself of what really happens in the atmosphere, here the small influence of temperature of the extremes over the period 1985-2000 (assuming 4 ppmv/K temp. influence):
http://www.ferdinand-engelbeen.be/klimaat/klim_img/wft_trends_rss_1985-2000.jpg
The response of the natural sinks (mainly the -deep- oceans) is quite linear to the pCO2 difference between what is in the atmosphere and what would be there if there was a dynamic equilibrium (“steady state”) between atmosphere and oceans per Henry’s law. That gives an e-fold decay rate of slightly over 50 years over the full 55+ period of Mauna Loa, or a half-life time for the extra CO2 of 30-35 years. Much shorter than the IPCC’s Bern model shows, but much longer than the 5 years residence time that many skeptics mistakenly use as decay rate.
Well, interesting discussion, but really, I think the question was something along the lines of ‘do we even know how much CO2 is put into the atmosphere by human means?’, and the answer really is quite simple. How that translates into CO2 levels, somewhat less so 🙂
AS IS USUAL, you are ignoring the fact that all the trend features of both data sets are a near perfect match for well over half a century. (and no amount of curve fitting is going to make that happen)…
Fonzie,
It is quite impossible to match the temperature variability with the CO2 rate of change variability if that was not really linked with each other: everybody in the scientific world (skeptics as well as warmistas) agree that the CO2 variability is caused by the influence of temperature (on vegetation). No problem with that.
It is extremely easy to match two straight slopes with an arbitrary offset and factor. If these slopes are not too far from each other, the same factor can match the amplitudes of the variabilities too. But that says absolutely nothing about cause and effect, as in this case the cause of the variability is temperature on vegetation, but while temperature has a small positive slope, vegetation is a net, growing sink for CO2: it has a small negative slope for CO2!
That is your problem: variability and slope have nothing to do with each other as are caused by different processes. Thus your common factor is pure coincidence (and doesn’t really fit that well).
Take the above graph for the period 1985-2000: the amplitudes are matched for about 4 ppmv/K. While the slope of temperature is only 0.35 K, CO2 increased with 22 ppmv or 63 ppmv/K over the same period. You may believe that temperature did cause that increase, but I don’t think the late Dr. Henry would have agreed with you…
So, I’m forecasting NOAA neic and the MetOffice will add half a degree to their land and sea records over the next couple of years or maybe more if the cooling of the last decade intensifies. Sarc? It’s getting harder to decide.
Adjustments will made assuming the political regimes that enables the scam remain inplace. Even Stalin’s Lysenkoism came to an end when his handpicked predecessor fell from power.
Eventually the scam will collapse. The big guys at these government-run climate centres will simply retire and sail away in their pension lifeboats to be forgotten. The carnage will be the young and mid-career scientists left holding the shit bags they filled.
Successor, not predecessor.
Anyone know when the CO2 that is out gassing originally would have entered the Ocean?
It would be doing so at all times, just as CO2 is constantly entering the oceans it is also constantly leaving. If the climate system has a net energy balance and no major changes in minerals derived from the ocean floor, then the CO2 entering and leaving would be in balance.
The delta is roughly 800 years lag, T before CO2, same as estimated thermohaline circulation round trip time. This is shown from the ice cores at both poles. Makes intuitive sense. Atmospheric CO2 is absorbed at the sea surface. Thermohaline circulation is the main vertical ocean mixing mechanism below the surface mixed layer (wind and wave). QED.
So, during the MWP, then…
That’s just one theory ristvan. There are schools of thought out there the lag is an artifact of the deeper cores. It’s very difficult to look at the shallow cores and think otherwise. The MWP and LIA are well represented in shallow cores. Matching the time line fairly well, stomata data and (my favorite) changes in TSI, particularly of note the jump in TSI with carbon growth circa 1840. There also is a study from a couple years ago that shows that the lag is due to the differences of temperature at the poles verses the global temperature record. (recall the poles warm first only to be followed by global temps later) Since global temps lag, CO2 lags…
SF, the data say MWP and LIA are something other than thermohaline circulation. What, dunno. Do know simple observation says that science IS NOT settled. Another simple political sound bite.
Use it often.
Afonzarelli, read essay Cause and Effect in ebook Blowing Smoke. Concerns Henry’s Law and observational lead/lag T delta CO2 proxies. Then get back to me with plausible counterfactuals. Doubt you will, cause there aren’t any.
I know of no physical oceanographer who believes that “estimated thermohaline circulation round trip time.”
ristvan, do you doubt that shallow cores are showing us something different (as in no lag…) than deeper cores?
Fonzie,
Even the shallow core of Law Dome shows a lag of ~50 years between the cold snap from the MWP to the LIA and the small drop in CO2. In that case not from the deep oceans, but probably the response of the ocean surface temperatures.
Still a lot of questions waiting for an answer. Not only the lag of ~800 years during deglaciations, but the much longer (thousands of years) CO2 lag at the onset of a new glacial period…
In other words, ferdinand, there’s no “QED” about it… (☺)
Uh oh. Crank up the doom machine. This will result in a bazillion hiroshimas worth of heat to instantaneously teleport to the deep oceans, to come back and bite us later, when it feels like it. Because that’s how CO2 heat rolls.
Religious dogma has never, in the recorded history of mankind’s belief in the supernatural, not invoked mystical claims to be taken on faith The CO2 principle control knob hypothesis embedded in Climate Change dogma is no different.
( note: the control knob theory is frequently and purposefully conflated with the scientific evidence that the 3-atom CO2 molecule is a GHG agent.)
joelobryan,
“Religious dogma has never, in the recorded history of mankind’s belief in the supernatural, not invoked mystical claims to be taken on faith”
I don’t see how one could know something like that never didn’t happened . . are you some sort of seer of all time and space? . . Or are you just taking that on faith? ; )
Did anyone ask La Nina, AMO, and the solar cycle?
I thought I read somewhere that the northern and southern hemisphere air does not mix much. I would think the northern C02 would be higher if it were true.
Not so true. Mixing where the Hadley cells originate near the equator. Roughly the ITCZ.
About 10% per year of NH and SH air mixes at the ITCZ. As the latter also includes a lot of rain, most NH aerosols and a lot of soluble pollutants like SOx and NOx are rained out and don’t reach the SH. For CO2 which is very limited soluble in fresh water, that only delays the mixing, so that the levels increase at ground level in the NH first and reach the same level at height (Mauna Loa) 6 months later, one year later at Samoa and up to 2 years at the South Pole. Global levels anyway are within +/- 2% of full scale, despite the huge (20%) CO2 exchanges in and out the atmosphere over the seasons. Thus rather well mixed…
Ferdi,
The atmospheric rise of co2 from 1979 to 1988 inclusive was 16.51 ppm/v. The rise in atmospheric from 1989 to 1998 inclusive was 15.37 ppm/v. Now you could say I cherry picked those dates, and you’d be right. I picked them because 1998 ended as being the highest on record. So for the 1990’s there was no increase in world wide co2 production? In fact, during the 1990’s there would have to be a decrease of 1.2 billion metric tons a year for each year. That’s per the math. It takes about 12 BMT to increase co2 1 ppm/v with about half being sunk. No matter how you do it, not only did co2 production rate have to remain the same, but there had to be a decrease as well. We know neither of those things happened.
rishrac:
So for the 1990’s there was no increase in world wide co2 production?
The CO2 sink rate is completely independent of human production: it depends only of the increased CO2 pressure of CO2 in the atmosphere above the steady state level of the oceans at current surface temperatures per Henry’s law. That is for the average sink rate. The sink rate is modified by temperature and probable other processes like the greening of the world’s semi-deserts due to increased CO2 levels in the atmosphere.
Thus while human emissions steadily increased over time, the net sink rate shows a lot of variability. The latter is mainly the effect of temperature on (tropical) vegetation, but the 1992 Pinatubo eruption had a special effect too: not only a temperature drop, but also the effect of scattered light by the stratospheric aerosols on increased photosynthesis worldwide, which did give an extra drop in CO2 rate of change.
Vegetation was quite neutral until ~1990: maybe a small source of CO2. Since 1990 it is a small but growing sink for CO2, rivaling the sink capacity of the (deep) oceans. That may play a role in the decreased ratio between increase in the atmosphere and human emissions.
But that all doesn’t minimize the role of humans: they are responsible for the bulk of the increase since 1850…
Perhaps you’re missing the point. A drop in the 10 years of 1 ppm/v is equal to all of the increase currently of 1 BMT. It is too large of a drop. If anything the eruption in 1992 should have decreased vegetation growth as it blocked sunlight. There is another reason that co2 levels dropped that year independent of the volcano.
From 1959 to 1968 the amount of rise in co2 was 8.09 ppm/v and from 1969 to 1978 the rise was 12.28. What do those numbers mean? It means that the world would have had to produce in that time period 48 BMT more. Even supposing I’m wrong by half thats still 2.4 BMT a year. The world only recently started producing 1 BMT more each year only in the last 10 years.
The sink rates varied directly with sunspot activity AND cosmic ray levels. 1962/1963 back forecasting fit. It’s in the record.
The observed co2 levels and the amount produced do not equal. You mentioned sink rates varied, that’s why I used 10 years increments.
Yes we did produce more co2 in the 1990’s than in the 1980’s. The record indicates that if we had produced the same amount as in 1980’s it should have been an increase of 16.51 not 15.37. And it should have been similar to the huge jumps from time period 1959 to 1968 to time period 1969 to 1978. And a corresponding jump from time period 1979 to 1988 from 1969 to 1978 of another 4 ppm/v. Again we didn’t come close to producing 1 BMT until the last 10 years. And yet in those years the record increased substantially. And even though we produced more co2 each and every year from 1999 to 2009 the growth was only 2 ppm/v increase from 16.51 to 18.61. Compare that to the 60’s and 70s. We are producing more and the sinks are increasing faster.
rishrac,
If anything the eruption in 1992 should have decreased vegetation growth as it blocked sunlight.
The scattering of sunlight increased total photosynthesis, as could be measured by satellites. Had a reference, but that is gone from the net…
The observed co2 levels and the amount produced do not equal.
There is no reason at all that emissions and observed CO2 level increase should be related: the sinks are completely independent of the momentary emissions, they only depend of the height of the CO2 level in the atmosphere above steady state. See the red line in the graph above. That is the theoretical residual in the atmosphere from human emissions at one side and the theoretical sink rate based on the extra CO2 in the atmosphere. Around the average increase, one has a lot of variability, mainly from the temperature influence on vegetation.
The sink rates varied directly with sunspot activity AND cosmic ray levels.
Possible, as sun activity influences the position of the jet streams and thus rain patterns and thus vegetation uptake. Together with El Niño / La Niña…
We are producing more and the sinks are increasing faster.
That the sinks are increasing faster is partly a matter of increased CO2 pressure in the atmosphere, partly of an increase in uptake by vegetation, the earth is greening…
An increasing sink nullifies equilibrium. The sink has either always been there or it hasnt. The sink doesn’t care. It will consume whatever co2 there is. It’s a trace gas to start with. The jumps during the 60’s and 70s can not be explained by anthropogenic forcings. Nor can the subsequent slowing of the rate of growth by sink rate alone in direct opposition to the ever increasing amount produced. It is not linear.
One should not be decreasing and the other increasing. The sink is variable, the natural co2 is variable and the relationship between anthropogenic co2 and natural is essentially unknown. There is simply no way during the 60’s to have added ( assuming I’m 50% wrong) 2.4 BMT a years.
rishrac:
An increasing sink nullifies equilibrium.
An increasing sink proves that the current atmosphere is increasingly above (dynamic) equilibrium. The ratio in sink rate vs. CO2 pressure above steady state is even surprisingly linear, see the calculations here.
The sink has either always been there or it hasnt. The sink doesn’t care. It will consume whatever co2 there is.
The oceans were always there and are both a sink and a source: a source where cold deep ocean waters are upwelling near the equator and putting a lot of CO2 into the atmosphere when they warm up and a sink where the THC and other water movements sink in the deep with a lot of CO2 dissolved, to get back to the surface some 1,000 years later near the equator.
It can’t consume whatever CO2 there is, it consumes or releases CO2 in ratio to the pCO2 difference between the water surface and the atmosphere. That is Henry’s law. If the pCO2 of the oceans is higher, CO2 levels in the atmosphere go up and reverse. The dynamic equilibrium is reached when (equatorial) inputs are equal the (polar) outputs. That is around 40 GtC/year as CO2. That is a dynamic equilibrium, or “steady state”.
The strady state for the current area weighted average ocean surface temperature is about 290 ppmv.
As the current pCO2 in the atmosphere is over 400 μatm (=~ppmv: ppmv is in dry air, μatm in wet air near the ocean surface), more CO2 is pressed into the ocean surface than is released. Currently a difference of ~0.5 GtC into the ocean surface and ~3 GtC into the deep oceans.
relationship between anthropogenic co2 and natural is essentially unknown.
As said before, there is no relationship between anthro and natural CO2: humans emit CO2 one-way at will and the natural cycle is essentially stable, as can be seen in all observations. The small natural variability in sink rate is mostly a matter of temperature and other known and unknown factors, but in average directly proportional to the extra CO2 pressure in the atmosphere above equilibrium.
There is simply no way during the 60’s to have added ( assuming I’m 50% wrong) 2.4 BMT a years.
In every year of the years since Mauna Loa and the South Pole, human emissions were higher than the increase in the atmosphere. In every year nature was a net sink for CO2, not a source…
The average concentration in 2016 is forecast to be 404.45 +-0.53 parts per million, dropping to 401.48 +- 0.53 in September before resuming their ongoing rise next year. The scientists already successfully predicted this year’s maximum concentration of 407 parts per million last month.
While their prediction is in the realm of reason their conclusion needs work.
Using the 1998 El Nino as a guide there are going to be 3 low CO2 growth years after this one.
Given the differing conductions this year should be slightly less of an increase than last year, about on par with the 2.92 PPM 1998 increase. That wouldn’t good for global warming theory because emissions are 50% higher.
They are predicting a 3-4 PPM year. We’ll see.
Although I appreciate Prof. Betts’ study, I have to go with Jack Dee on this:
So what?
What will ‘they’ say when La Nina means cooling global temps against a record high in CO2 levels? I’m still waiting for global warming to kick in. It’s mid June and it was 14c here in southern England this morning. When will global warming actually start – I’m looking forward to it?
I see the Met Office is predicting just 11c on Saturday evening for my region…11c?!? Mid-June! What say you, Professor Betts?
And, snow is expected in the Cascades for the next two nights.
Any informed person would call that “weather”.
I suspect so would Richard Betts.
A correct statement by you (for a change!). But what’s your point?
Climate forecasting pays Better than weather forecasting.
Has everyone missed the “it’s worse than we thought scenario”? As global temperatures rise, natural sinks for CO2 like the ocean, will absorb less CO2, and this will cause more atmospheric CO2 and this will turn into a vicious cycle that will escalate global warming to such an extent… well, that it may become so hot that the oceans could boil. Be afraid; be very afraid.
Has everyone missed the “it’s worse than we thought scenario”?
Well, there is something called the Reveile (Drivel?) factor. The Revelle factor is supposed to go up as more CO2 is absorbed. Since the ocean can absorb less CO2 the CO2 level will soar upward. The ocean is supposed to become hypercapnic when the atmospheric CO2 level hits 650 PPM..
http://onlinelibrary.wiley.com/doi/10.1029/2006GL027028/full#references
Now, this makes a great story but ignores some things:
1. The ocean is outgassing at the equator (even though it has a low Revelle factor) and the CO2 is absorbed mostly in the Arctic (which also has a low Revelle factor)..
2. There are plants in the ocean.
3. About half the absorption is by plants on land.
4. The atmospheric CO2 isn’t going to get much over 460 PPM (from industry production estimates).
5. Fish lived in the ocean when the CO2 level was over 1000 PPM.
7. The Arctic has low Revelle factors (half or less of the North Pacific and North Atlantic)
8. Less sea ice means more gas exchange.
The bottom line is the global warmers claim that ocean CO2 absorption should be plateauing and instead it is steadily increasing.
That makes the CO2 rate of increase look like a betting opportunity. The current hiatus in emissions increase has historically led to a decrease in the annual rate of increase. The global warmers claim it should accelerate as sinks saturate. Place your bet now.
The emissions are at RCP8.5 level, the CO2 level is in the RCP4.5 range.
The forming and melting of sea ice is also supposed to pump co2 into the arctic waters. If we see warm northern pacific fuel Arctic with humid air, big increases in sea ice could keep co2 down this fall and winter.
I’m not sure about the scoop of the content of the paper. The impact of the SST of the tropics on the annual grow rate of the CO2-level is well known for years:
http://www.dh7fb.de/ninos/co2gr.gif
What’s the new message of the paper?
PS: The SST lead by 7 month, this is considered in the figure above.
Well this is good news for plants, but extra work for my lawnmower.
Finally some official recognition of the effect of SST on atm CO2. Amazing stuff.
Richard Betts is certainly one of the more credible members of the climatology establishment.
Natural cycles , testable predictions. A welcome re-emergence of true science?
Observation has already falsified modelled CO2-climate theory. But they still attempt gross, dubious adjustments to observation to avoid the crushing loss of reputation, funding, and political support blowback.
I am not as optomistic as you Greg.
“Plants draw down CO2 in the summer and release it again in the autumn and winter.”
What plants “release” CO2 in the autumn and winter?
What plants “release” CO2 in the autumn and winter? Dead ones
Good point. What happens in winter is that AFF inceases atmospheric CO2 while plants are dormant. And the Cycle is synced to NH seasonality. This empirically shows two things. 1. There is more land in the NH. 2. Land based plants are an important sink ( questimate is 50-50 land/ ocean despite oceans being 79% of surface. Much ocean surface is relatively barren (lacking micronutrients, especially iron).
How much of a seasonal factor is the Arctic Ocean? it is hard to exchange CO2 through ice.
There was a paper popular not to long ago that claims ice formation and melt somehow pumps co2 into the Arctic waters.
Here is a comparison of CO2 and Arctic sea ice :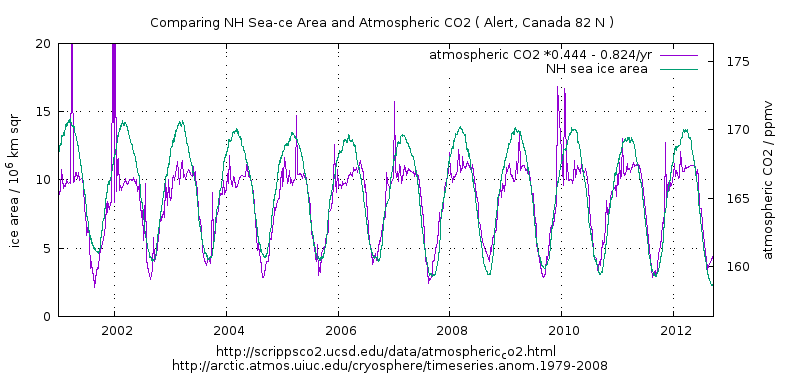
https://climategrog.wordpress.com/co2_nh_ice_area_2001/
It would be interesting to see what they predict for Sept 2017. Once La Nina knocks SST back down to a more normal level. This will to a large extent depend on where they estimate SST will be next year, but this would be in interesting check of the new realism that seems to be taking root at Hadley Centre.
CO2, being in the hands of a more or less independent group, is one of the few records which has not been rigged by zealots yets.
About 9ppm/year/kelvin change around the 1998 El Nino.
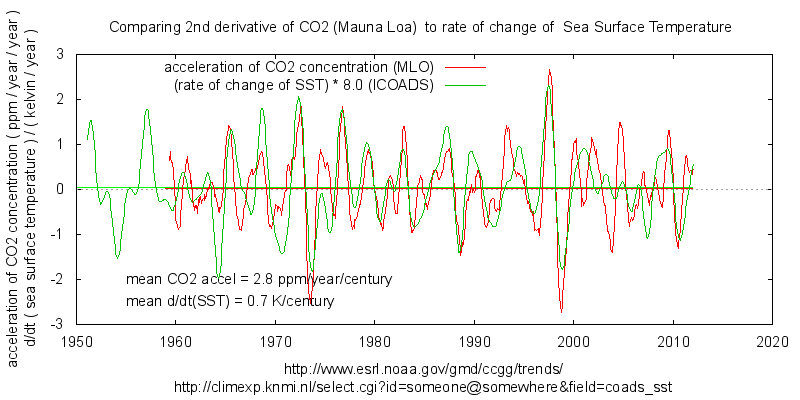
https://climategrog.wordpress.com/co2_sst_regression_nino98/
This is what the annual cycle looks like at MLO.
https://climategrog.wordpress.com/co2_daily_2009_fit/
What the steeper negative slope of the NH growing season (relative to the Oct-April increase) suggests is that it will only require about a 22-28 day increase in the growing to completely zero-out the 2.3 +/-0.5 ppm/yr overall average increase.
According to the anchovies, La Nina could be on the way
https://www.undercurrentnews.com/2016/06/07/exalmar-says-peru-survey-finds-good-biomass-in-southern-areas/
According to Bob Tisdale Nino 3.4 is already negative. Looks like La Nina starts next month.
Its all so ar$e about t1t its just unbelievable..
So, Richard Betts, explain these things..
Why are stomata on the underside of plant’s leaves – are the plants not perhaps expecting their food to be coming up from under them?
What plants exhale CO2, its beyond crazy for them to do so after they’ve gone to so much trouble collecting it. We’ve seen it written that they ‘need energy’ What! So they can go out chasing woolly mammoths to bring home for the BBQ?
Why did the generally accepted CO2 curve start ramping up at the end of WW2 – what ‘fossil fuel’ event occurred around then – apart from the overnight conversion of munitions factories to agricultural fertilizer factories. What does nitrogen fertilizer actually do – have you any idea
3 questions about why CO2 ramps up in the NH autumn.
1. Is it not because a lot of man-made plants (corn, wheat, rice etc) effectively die and stop taking it up?
2. Is it not because the soil temperature in the NH reaches its annual peak in the autumn and the things creating the CO2, dwelling in the soil and being very temperature sensitive are at their most active?
3. Why do grassland farmers notice a massive surge in grass growth in the autumn, the so-called autumn flush even when they have not spread any fertilizer
If any or all these things are actually happening, does it not explain your El Nino = high temps = high CO2 rise
Peta,
Most of the extra CO2 in the natural cycle comes from dead plants, which peak in fall as leaves are falling down and deteriorate, but that process goes on all year (even under a layer of snow in mid-winter). The main uptake is in spring when new leaves are formed and that goes on all summer and part of fall, until the cold comes in. That is what is seen both in CO2 levels as in 13C/12C ratio, as taking up CO2 by plants in spring/summer is preferentially 12CO2, thus changing the 13C/12C ratio in the atmosphere.
Which one – uptake or decay – wins the battle is a matter of temperature and growth/decay rates. Over the past decades there is little change visible in the regular seasonal ups and downs, thus the seasonal cycle shows little variablity…
The above is what happens mainly in extra-tropical forest and mainly in the NH, where most of these forests are situated (the agricultural cycle is quite parallel with that). El Niño has its effect mostly in the tropical forests and is opposite to what happens with the seasons: temperatures get too high, the forest is drying out and reduces its uptake or even is a net source of CO2. That is reversed what a La NIña gets in…
Human emissions increased very slowly until WWII, after that the industrialization of the Western world increased enormously and currently SE Asia and Brazil are leading the dance…
Peta
“Why are stomata on the underside of plant’s leaves…?”
Could it be an aspect of evapotranspiration? The location of stomata in the shade might reduce water loss.
Imagine how ineffective the exhaust fan in the bathroom would be at venting water vapor if it was placed in the floor. Stomata located on upper leaf surface would greatly increase water loss from plants via natural convection.
SR
Mr. Betts,
I am having a very hard time understanding how any competent scientist (who looks into these matters in some depth) can avoid at least being somewhat skeptical of the proposition that human induced CO2 emissions are major threat to . . well, anyone, really. And, I feel that maintaining the “institutional” stance that it is unscientific to be significantly skeptical, is a serious threat to scientific thinking/inquiry among humans in general (and possibly in turn, a major threat to “freedom of the mind” itself.
Do you consider my attitude/concerns ridiculous? Understandable? Justified?
but since humans have been manufacturing things instead of picking everything off trees, the CO2 concentration in our precious has increased 0.01%
doesn’t that make you want the trauma medic?
Well, I did come kinda close to having a tree limb I recently cut crash into the twenty foot ladder I was on, and I figure the trees might be growing faster because they are getting extra CO2 . . but I managed to get over it and finish the tree trimming . . for now . .
What a let down. Nature wot did it. Thought we were the major cause of CO2 rise.
Kinda liked the all- powerful planet wrecker sense of belonging thing.
I may disagree with Dr. Betts regarding future temperature projections and historical adjustment. But I do think it will warm and I do think the historical raw data needs adjustment (upward, net).
In the main, I agree with him on the “how”. Where I depart is on the how much”. But at least we are playing the same game in the same ballpark.
The upwards adjustments flies in the face of UHIE and the diminish ent of rural ground stations in the more modern records. Downwards adjustments or at least net zero adjustments would be the expectation.
But Karl 2015 had to adjust the more accurate buoy sst data with the less accurate ship intake data, and then use the confidence statistics of the buoy data to pull off the rushed publication of the Pause Buster demanded of his political handlers heading into COP21. Pseudoscience crap from the government agency scientists, whilst academic scientists are too coward to call out the BS flag without risking funding.
Re. UHI, don’t confuse offsets with trends. USHCN ungridded data for well sited stations is lower than non-urban (when gridded, it is higher). But in any event, urban stations are in a distinct minority (though over-representative of surface area.
As for surface, one must account for TOBS flips, equipment bias/conversion, and microsite. This is not currently done correctly. Equipment is misapplied and only partially applied. Microsite is entirely ignored. And homogenization, as currently applied, bombs, making the systematic bias even worse rather than better. But even if done correctly, the adjustment is still a bit of an upward trend bump.
As for K-15, however, it appears to be crap. (Even so, it shows a mere 0.12C/decade trend since 1950.)
Still the hustle continues in trying to link the 80’s-98 global temp rise to the M-L CO2 record, while with the 99-2015 lower Tropospheric Temp Pause the M-L recorded annual average pCO2 rise continued unbated. The (raw – adjustments) plot vs pCO2 though exposes the climate record fraud underway at NCEI, GISS, and the UKMO.
But no matter what, the Progressive imperative remains for them and their pseudoscientist enablers….. CO2 must be made the demon molecule as the means to the real intended “ends” of the Climate Change hustle. Western governments are in dire need of new tax revenue schemes to prop up the crumbling welfare entitlement pyramids.
But the end is nigh for the climate hustle. Multiple factors are about to converge to end the most massive fraud ever perpetuted on the public.
– a likely strong multiyear La Nina to erase the El Nino, maybe even a down-step in global temp after all is said an done.
– a closing weak SC 24 UV and magnetic activity during the clear tropical Pacific Ocean skies of a La Nina..
– a political regime change in Washington to throw out the political bums corrupting US government agencies. Computer hard drives will be crashing by the thousands nect January.
A 25% rise in the production of co2 and only a 6% rise from 1998? What will they say next year? Or will it be worth reporting since it doesn’t add to the scare factor.
What hearsay, what heretical thing are they saying… co2 lasts half a human life span…. ?
[mods Help! I have a post lost in spam filter? It doesn’t even show as (in moderation), yet WP gives me duplicate detected error if I try to repost.]
You may have used a word (beginning with “s” and ending with “m”?).
Speaking personally, I do not find any willful dishonesty in how they do these things. I do find loads of systematic error. But these are easy errors to make, ones I have made, myself. Being flat-out wrong does not make one dishonest.
The tropical pacific is a much bigger source of natural CO2 emissions than all anthropogenic emissions (a rate at least ten times that of anthro). Check it out. The year to year rate of increase in atmospheric CO2 correlates a lot better with UAH tropical tropisphere temperatures than with anthro emissions. This paper is just evidence that the long term rise in atmospheric CO2 is not all caused by anthropogenic emissions. Natural emission rates have been rising and varying with UAH temperatures since they were first measured. Anthropogenic emission rates are almost lost in the error band of temperature related natural emission rates.
Your last statement rings true from the little bit of OCO2 level 3 data plots that have been published.
Man’s CO2 emissions are in the climate natural emission noise. The steady upward record (increasing rate) while decadal Anthro CO2 emissions fluctuate tells us mans emission, while rhey have some smaller component in the rise, most of the rise is natural.
Sorry Joel and Fred,
While natural emissions are huge: in the case of the tropic upwelling, some 40 GtC/year is emitted and about the same amount absorbed near the poles, that doesn’t add or subtract any CO2 to/from the atmosphere, as long as what is added is removed. The balance at this moment gives an average 3 GtC/year more CO2 sinking into the deep oceans near the poles than emitted by the upwelling near the equator.
Overall natural variability is less than half human emissions. Thus far from being noise, human emissions are dominant in the increase rate and natural variability is the noise around the trend…
There is indeed a huge correlation between temperature and the CO2 rate of change, as temperature directly influences the plant uptake of CO2, but that is the variability in sink rate, not source rate… The correlation in this case is only between temperature and the noise around the trend, not with the trend itself…
Your “mass balance” is in error because you assume natural source and sink rates balance out from year to year. This paper is strong evidence that is not true. As little as a 3% change in the natural net flux is about the same magnitude as natural emission rates.
Fred,
I didn’t “assume” anything, the mass balance simply shows that nature was a net sink for every year in the past 55+ years since accurate measurements at Mauna Loa and the South Pole were established…
Thus while a 3% change in natural fluxes could dwarf human emissions, it didn’t in the past 55+ years…
Of course there could be a 4-fold increase in the natural carbon cycle, mimicking the 4-fold increase in human emissions, increase in the atmosphere and net sink rate over the past 55 years. That is Bart’s theory, but there is not the slightest indication that the natural carbon cycle increased in speed, to the contrary…
Your mass balance only works if you assume nature is a net sink. Nature is a sink for both natural emissions and anthropogenic emissions and does not partition between the two. If nature was a net sink for natural emissions, it definitely would be a net sink for the small amount of anthropogenic as well and atmospheric CO2 levels would be decreasing. Rising natural emissions associated with tropical tropospheric temperatures (such as results with el-Nino) is causing the long term rise in atmospheric CO2. I think that thunder clouds are pumping CO2 containing air into the upper atmoshere where it is carried toward the poles The temperature of unfrozen water near the tops of those clouds is controlling the concentration that is emmited into the upper atmosphere. This is where Henry’s law may be applicable. Any moisture in the upper atmosphere is frozen and does not absorb CO2. How fast is this process? What is the terminal velocity of quater-sized hail?
@ferdinand meeus
Sorry, but you absolutely did assume something: you assumed you knew the feedback gain (and feedback lag) for the carbon cycle. Both Le Châtelier’s principle and the fact that the yearly increase in atmospheric CO2 is only half that emitted from fossil fuels strongly indicate that the carbon cycle is governed at a minimum by a first order control system. For your argument to work, the feedback gain has to be ‘2’. I don’t believe there is any way to ascertain this with confidence.
willb01,
I didn’t assume that the many sinks and sources would react as if its sum was acting as a simple first order system to disturbances, but the empirical evidence shows it:
general rule for a linear process:
extra pressure in the atmosphere / net sink rate per year = e-fold decay rate in years
In 2012:
110 ppmv / 2.15 ppmv/year = 51.2 years.
The figures for 1988 (from Peter Dietze):
60 ppmv, 1.13 ppmv/year, 53 years.
In 1959:
25 ppmv, 0.5 ppmv/year, 50 years.
Or a half life time of around 35 years.
Looks very linear to me with no sign of increasing decay rates due to saturation of the deep oceans as assumed by the Bern model / IPCC…
As said somewhere else, there is not the slightest “must” for a 1:2 retention of CO2 from human emissions in the atmosphere. All what is needed is a relative slow decay rate for extra CO2 in the atmosphere and a quasi-steady increase of human emissions over time.
If human emissions stopped today, next year the CO2 levels would drop with 2.15 ppmv and so on with decreasing sink rates until the old steady state of ~290 ppmv for the current ocean surface temperature is reached again…
@ Ferdinand, You seem to have assumed your conclusion. You acknowledge that very small changes in natural CO2 fluxes could easily produce the same net effect. You also acknowledge that those natural fluxes are not known with any precision. So how can you possibly rationalize believing as you do?
Dave,
It is really that simple: in every year of the past 55+ years, the natural cycle was more sink than source. That is what the evidence says.
increase in the atmosphere = human emissions + natural emissions – natural sinks
For the past year:
4.5 GtC = 9 GtC + X – Y
X – Y = -4.5 GtC
Or nature shows 4.5 GtC/year more sink than source. No matter what X and Y were:
100 GtC in and 104,5 GtC out or
200 GtC in and 204.5 GtC out or
1000 GtC in and 1004.5 GtC out.
No matter if some in or out flux doubled or halved from one year to the next.
No matter if some net source turned into a net sink or reverse.
That is not of the slightest interest for the net result: nature was 55 years long a net sink for CO2, not a source. That is all that counts…
Thus even if some small changes in natural fluxes could have the same effect as human emissions, they didn’t over the past 55 years and the observed natural variability is not more than half the human contribution.
@ferdinand meeus
The increase in CO2 partial pressure will depend on what the current level is. Are you using Mauna Loa measurements? What about the pre-industrial level? Are you using ice core records? Are you calibrating these two different measurement techniques against each other or are you assuming they measure exactly the same thing??
Ice cores seem to indicate pre-industrial levels were somewhere between 260 and 280 ppm. What value are you using to calculate the increase in partial pressure?
Where are you getting your sink rates from? Are you assuming only CO2 from fossil fuels? Are you also using Mauna Loa data? Are you averaging the ML data over one year or are you using the delta for just one month (i.e.June to June or January to January)?
I think it would be very easy to cherry-pick data to get the result you’re looking for.
Ferdinand, I understand the net result and as far as it goes I agree. That said, looking only at the net and disregarding the huge uncertainties can really miss the boat. Clearly it is possible natural emissions have increased more than total human emissions and natural sinks are absorbing more than total human emissions. Maybe significantly more, we just don’t know. If that is the case your simplistic analysis just misses what’s really happening and exaggerates the significance of human emissions.
@ferdinand meeus: “As said somewhere else, there is not the slightest “must” for a 1:2 retention of CO2 from human emissions in the atmosphere. All what is needed is a relative slow decay rate for extra CO2 in the atmosphere and a quasi-steady increase of human emissions over time.”
I could just as easily say: There is not the slightest “must” for a 1:10 retention of CO2 from natural emissions in the atmosphere. All that is needed is a relative fast decay rate for extra CO2 in the atmosphere and a quasi-steady increase of natural emissions over time such that the natural emissions exceed the human emissions by an order of magnitude.
Dave, you are being conned by what’s known as the “mass balance argument” which is the worst piece of junk science that you’ll ever come across. What it amounts to is a simple accounting gimmick which designates the entire rise in CO2 as anthropogenic. Ferdinand has literally wasted (what seems like) years of his life arguing this one point. The mass balance argument does not preclude the possibility that the entire rise is being caused by a natural imbalance and anthro emissions are equilibrium sinking at a rate of 100%. Were that the case, the rise would be caused by nature and yet nature would still be a “net sink” for carbon…
Fonz, I’m not being conned by anything.
The underlying assumption was fully revealed when Ferdinand said “If human emissions stopped today, next year the CO2 levels would drop with 2.15 ppmv and so on with decreasing sink rates until the old steady state of ~290 ppmv for the current ocean surface temperature is reached again…”
There is simply no justification for that assumption with the huge uncertainties and unknowns. Well, except for confirmation bias.
Willb01,
Of course I am using the ice core records, as that are direct measurements of ancient air, except that these are an average of several (10-600) years, depending of the local snow accumulation rate and thus the speed at what the air bubbles were closed.
The measurements of CO2 in the enclosed air from the ice cores is exactly the same as for CO2 in open air as for Mauna Loa: NDIR, GC or nowadays more and more mass spectrometry, as that needs very little air and also gives the 13C/12C and other isotopic ratios of the past (and present).
Etheridge e.a. measured CO2 top down from the atmosphere until bubble closing depth (at 72 m) and in the already closed ice: no differences in the transition zone where CO2 levels were ~10 ppmv lower than in the atmosphere. Both were measured with GC and the figures as obtained from the ice had an overlap of ~20 years (1960-1980) with direct measurements at the South Pole:
http://www.ferdinand-engelbeen.be/klimaat/klim_img/law_dome_sp_co2.jpg
Thus ice core results and South Pole results are comparable, at least for the period 1960-1980.
The base for my calculations was 280 ppmv in 1850 + 16 ppmv/K difference with the average seawater temperature in 1850. The 16 ppmv/K is the average result over the past 800,000 years variability as seen in ice cores. That is 8 ppmv/K directly at polar amplification, which is about double the global average.
16 ppmv/K is also in the ballpark of Henry’s law, which in the literature is between 4-17 ppmv/K for seawater. Confirmed with over 3 million of seawater sample measurements since 1803, when Henry established his law…
Sink rates are simply the difference between human emissions and increase in the atmosphere. No matter how the natural fluxes varied, the mass balance must be obeyed as long as no CO2 escapes to space. One can shuffle the natural fluxes like one want, but that doesn’t change the net balance and the net sink rate in nature.
Indeed I am using yearly data from MLO for the calculations, as emissions are published as yearly data too. Sometimes I use monthly data, which are a linear interpolation of the yearly data centered in the middle of the year, to make nicer graphs, but in fact that doesn’t matter much as the average result is still the same…
Dave,
There is more background than I already wrote this time, which makes that there is no different interpretation possible…
Human emissions increased a 4-fold over the past 55+ years and so did the increase in the atmosphere and thus the net sink rate.
As the sinks react on any extra pressure in the atmosphere, whatever the source, if human emissions increased a 4-fold and the net sink rate increased a 4-fold, that is only possible if the natural cycle also increased a 4-fold over the same time span – or not at all – or you violate the equality for CO2, whatever the source, for the sinks.
The height of the natural carbon cycle can be calculated by looking at the residence time for any CO2 in the atmosphere. There are several methods to measure the residence time, which mostly gives figures around 5 years. For 800 GtC in the atmosphere that gives a (mostly seasonal) exchange of ~150 GtC in and out over a year.
If you sort the different residence time estimates in two bloks over time, the newer estimates are slightly slower than the older ones. That points to a rather stable throughput in an increasing mass of CO2 in the atmosphere and certainly not to an increasing natural carbon cycle, let it be a 4-fold.
That is one way of looking at the natural carbon cycle, but similar results can be seen in the isotopic changes: if the ocean carbon cycle increased substantially over time, the 13C/12C ratio in the atmosphere would go up, not down and there is very little change in the seasonal cycle over time, neither in CO2 uptake/release amplitude as in the opposite 13C/12C changes.
That the natural carbon cycle is surprisingly stable may be a result of the opposite contributions of oceans and vegetation on temperature changes, which is the largest cause of the carbon cycle.
Besides that, the human contribution is fully compatible with all known observations:
http://www.ferdinand-engelbeen.be/klimaat/co2_origin.html
While all alternatives I have heard of are violating on or more observations…
The current 9 GtC/year human emissions are already 6% of the natural carbon cycle. The observed variability in the net natural cycle is not more than +/- 4 GtC/year, thus less than human emissions, whatever the underlying individual flux variability may be.
The current CO2 level in the atmosphere is 110 ppmv above the pCO2 of the oceans for a steady state at the current ocean surface temperature, according to Henry’s law. Thus the net sink rate of currently 2.15 ppmv/year is the result of that extra pressure. That is independent of the momentary human input and goes on in direct ratio to the pCO2 difference between atmosphere and oceans, until steady state is reached again…
Fred:
Your mass balance only works if you assume nature is a net sink.
Sorry Fred, but that is as clear as 4.5 – 9 = -4.5. Humans emit 9 GtC/year one-way. The atmosphere increases with 4.5 GtC/year. The difference doesn’t escape to space, thus must be absorbed somewhere in natural sinks…
Nature is a sink for both natural emissions and anthropogenic emissions and does not partition between the two.
Agreed, but that doesn’t make any difference. In my opinion, most increase in the atmosphere is caused by humans, thus all extra sinks are caused by humans.
One need to make a differentiation between the different source/sink processes involved: the largest natural cycles are seasonal (plant growth and decay), heavily dependent of temperature, hardly by pressure. The removal of any extra CO2 in the atmosphere is hardly influenced by temperature and is heavily dependent of pressure…
Thus as long as there are no extreme changes in seasonal temperatures, the seasonal cycle will be rather stable, while the increasing pressure in the atmosphere will increase the net sink rate, quasi independent of the temperature dependent natural emissions.
Temperature can’t be the cause of most of the recent CO2 increase: vegetation is a net, growing sink and Henry’s law doesn’t allow more that 16 ppmv/K increase…
Your opinion is wrong because you must assume natural emission rates have not increase more than sink rates have increased for your “mass balance” to work. Again, Sinks absorb natural and anthropogenic emissions at the same rate. Natural emission rates are as much as 20 times higher than anthropogenic emission rates. If sinks only absorb 95% of all emissions resulting in a rise in concentration,, they are absorbing only 95% of both anthropogenic and natural. The UAH lower troposphere temperature data clearly indicates that natural emission rates from the tropical Pacific have been rising from year to year since 1979. Do the math. Do your regressions on those temperatures, which clearly show el-Ninos, and on anthropigenic emission rates. The temperature data produces a much better fit when comparing R^2s.
Fonzie:
“the entire rise is being caused by a natural imbalance and anthro emissions are equilibrium sinking at a rate of 100%”.
That is the interpretation of Bart too. The problem is that you violate the equality of CO2, whatever the source, for the sinks: the sinks don’t discriminate between CO2 of human and natural origin. Thus whatever the cause of the increase, any extra CO2 is removed at the same speed, whatever its source (except for small changes in isotopic ratios).
Human emissions increased a 4-fold over time. If a natural imbalance was the cause of the increase in the atmosphere, the natural cycle MUST have increased a 4-fold in exact ratio with human emissions, or you violate that equality principle.
For which is not the slightest indication: not in residence time, not in isotopic ratios…
Dave: “Fonz, I’m not being conned by anything.”
I stand corrected; should have said something like “don’t be conned by the mass balance argument”…
ferdinand, as is usual, you’re misrepresenting what i’ve said just like you did at at the top of the page regarding “curve fitting”. You’re just a sophisticated version of a TROLL…
Haynie, very good comment here… Let’s just ingnore F.E. and his junk (mass balance) science for a second and make the assumption that you are right. How do you reconcile what you’re saying with the ice core data which rarely shows concentrations greater than 300 ppm? Ice cores corroborate each other rather nicely. Regardless of differing accumulation rates, they all come up with the same numbers. It would seem that you ARE correct, but that ice cores are correct as well. How do we reconcile the two?
The ice core data is a long-term proxie for actual atmospheric concentrations. The time resolution does not capture decade or even century changes depending on the age of the ice. Also, diffusing and flow in solids as well as chemical and other changes are not considered.
Fred:
Your opinion is wrong because you must assume natural emission rates have not increase more than sink rates have increased for your “mass balance” to work.
The largest natural carbon cycle is the seasonal cycle, where temperature is the primary driver. The estimates are 60 GtC out (spring/summer) and in (fall/winter) for vegetation and reverse 50 GtC for the ocean surface, the net result is hemispheric ~10 GtC more CO2 sink than source in the NH spring, which results in ~5 ppmv global change, repeated each year.
Over the past decades (1973-2013), CO2 levels increased some 70 ppmv or some 20% globally. In the NH seasonal cycle (averaged at the height of Mauna Loa) that had near zero effect:
http://www.ferdinand-engelbeen.be/klimaat/klim_img/seasonal_CO2_MLO_BRW.jpg
Thus while the net sink rate increased linearly with the increased CO2 pressure in the atmosphere, there is no sign that the main (temperature driven) natural emissions and sinks substantially increased over the seasons.
The same for the continuous stream of CO2 from equatorial upwelling to polar sinks: There is no known evidence that the ocean surface temperatures at the upwelling zones substantially increased or that the upwelling itself substantially increased (it even stops during an El Niño). Neither such huge changes at the polar sinks. If there were huge changes, that would be visible in the 13C/12C ratio and in the 14C bomb spike decay rates. There is not the slightest indication that the ~40 GtC continuous flux between equator and poles did substantially change over time.
I do await any observation which proves that any of the main natural cycles substantially changed over the past 55+ years…
You admit that temperature is driving the annual cycle, so why don’t you accept that a long term rise in temperature can drive CO2 levels upward. The evidence is there. You just don’t want to believe it.
@ferdinand meeus
The only reason you are calculating a 4-fold increase in atmospheric CO2 is because you have chosen a baseline of 296 ppm. Since you trust the ice core record, it seems to me you could more easily justify selecting a baseline of 270 ppm, which was the level during the Holocene optimum and also the average level during the Eemian inter-glacial. With these time periods you can be much more confident of being below bubble closing depth. In both these time periods the surface temperature and ocean temperature were estimated to be greater than at present. With a 270 ppm baseline, the atmospheric increase since 1959 is less than 3-fold: not a good match to the 4-fold increase in anthropogenic CO2.
@ferdinand meeus: “Sink rates are simply the difference between human emissions and increase in the atmosphere.”
Except you have no idea whether natural emissions have been increasing over the last 60 years. And as you say, since no CO2 is escaping to space, the sink rate would have to accommodate any increase in natural emissions. Which of course means, if they ARE increasing, then you are underestimating the sink rate.
http://www.ferdinand-engelbeen.be/klimaat/klim_ing/antarctic_cores_150kyr.jpg
fhhaynie:
You admit that temperature is driving the annual cycle, so why don’t you accept that a long term rise in temperature can drive CO2 levels upward.
The annual cycle is ~5 ppmv/K.
The long term temperature rise over glacial and interglacial periods was ~16 ppmv/K.
Henry’s law gives 4-17 ppmv/K for seawater in the literature.
The ~0.8 K increase in temperature since the LIA is thus good for maximum 13 ppmv increase.
So why don’t you accept that the long term rise in temperature can’t be responsible for the 110 ppmv rise since ~1850?
willb01
The only reason you are calculating a 4-fold increase in atmospheric CO2 is because you have chosen a baseline of 296 ppm. Since you trust the ice core record, it seems to me you could more easily justify selecting a baseline of 270 ppm
It doesn’t make sense to use another baseline than starting in 1850, as in that year human civilization may have already had an influence on CO2 levels, not so much from industry, but from agriculture. CO2 (and CH4) levels already increased over these of the Holocene Optimum (and the Eemian).
Except you have no idea whether natural emissions have been increasing over the last 60 years.
Should have said “NET sink rates are the difference between human emissions and increase in the atmosphere”. That indeed doesn’t say anything about total source and sink fluxes. But we have a pretty good idea that the natural carbon cycle didn’t substantially increase over the past 60 years: slightly decreasing residence time, stable 13C/12C decline in direct ratio to human emissions, stable drop in 14C bomb spike, little change in seasonal CO2 and 13C/12C ratio amplitude,…
There is no link between ENSO and Carbon Dioxide. There is no discernible difference between the CO2 produced by a Millionaires family and a poor family.
Another example of temperature driving CO2 levels due to the enhancement of biological processes which produce CO2 as metabolic waste.
Earth’s oceans are conductive, “El Nino” is produced on average every 22 years by the suns polarities striking our planets oceans. Weaker solar polar reversals produce less sunspots, the solar poles reverse slower around the sun and take less time passing the earth. When the the suns polar field strikes the earths oceans for a longer time we get stronger positive readings from our oceans. Weather patterns shift. (and vice versa)
When the solar polarities strike Earth every 11 years on average their configuration changes in two ways, (1) The speed and duration (2) configuration e.g negative – followed by positive + (and vice versa) poles from the sun striking earths oceans.
Wow!
So much hype about forest fires. Building on the Canada tar sands tragedy?
Err, how many tenths or hundredths of a degree rise did that take?
And just how much of that miniscule warming predicted by forecast model and statistical relationship with sea temperatures will remain through the 2016-2017 winter?
About those fires:
http://dailycaller.com/wp-content/uploads/2016/01/southgraph-e1452274304130.png
They’re a few years behind, so 2016 data will not show up till approximately 2019 or 2020; but the latest includes 2013:
http://cdiac.ornl.gov/ftp/ndp030/global.1751_2013.ems
That’s a “pseudo line” where two unrelated components appear to interact.
@ATheoK
I was talking about the fires in Indonesia last July to October http://www.globalfiredata.org/updates.html which were ignited by humans but burnt out of control due to the drought associated with the El Nino. It was estimated that the total greenhouse gas emissions from this fires was equivalent to about 1.75 billion metric tonnes of CO2 (with large uncertainty). Assuming that it was all CO2 (it wasn’t – some was methane and N2O, but most was CO2 so lets keep this calculation easy) then this would be about 0.4 gigatonnes of carbon, which equates to an increase in atmospheric CO2 concentration of about 0.2 parts per million. We forecast that the additional CO2 rise due to the El Nino over 2016 will be about 1 part per million, so as a very rough estimate, the Indonesian fires contributed about 20% of the additional CO2 rise associated with the El Nino.
I live in the shadow of Mauna Loa. My garden is doing great this year! The daytime temperatures are a little lower than last summer, but one or two degrees don’t make much difference. The extra CO2 sure does help though. 🙂
Oh! I forgot to say, y’all just keep on sending more of that stuff this way please.
It will be very interesting to see if his prediction is correct. At least it is on a realistic time scale for a change.
@Keitho
Yes, that was one reason why I was keen to write this paper – I got a bit fed up of working on projections for decades ahead that cannot be tested! Much more interesting to do something that will be tested soon – we might even learn something new!
Dr Betts,
Nowhere near as fed up as the taxpayer shelling out for stuff that cannot be tested.
Don’t worry. You won’t find out anything new. You’re a trougher, not a scientist.
“The human-caused rise in atmospheric concentration of carbon dioxide is being given an extra boost this year by the natural climate phenomena of El Niño”
in other words we don’t know that it is human caused.
http://papers.ssrn.com/sol3/papers.cfm?abstract_id=2642639
We can be certain that the long-term rise in CO2 concentration is human-caused, because the total CO2 emissions from human activities are more than twice the increase in the atmosphere. The other half is being taken up by the oceans and land biosphere (hence the global greening discussed recently). This net uptake (which is actually a balance of uptake by photosynthesis etc and release by respiration and fire) varies from year to year with climate variability such as El Nino, so although human emissions don’t change much from year to year, the actual increase in the atmosphere does vary more, due to the variations in net uptake in the oceans and land biosphere.
Looking at the long-term trend, there is more than enough CO2 being released by human activities to account for the observed increase in concentration in the atmosphere.
@ “Looking at the long-term trend, there is more than enough CO2 being released by human activities to account for the observed increase in concentration in the atmosphere.”
Yes, but the uncertainties in estimates of natural CO2 fluxes are also more than enough to account for the observed increase, so why exactly can we be certain that the long-term rise in CO2 concentration is human-caused?
Yes, Dave, if nature is known to take out 50% of anthropogenic CO2, then there is no reason why that number couldn’t be closer to 100% (with an imbalance in nature making up the difference)…
Dave and Fonzie,
Why is it so difficult to see what every housewife with a limited budget knows?
You start the day with 100 euro in you shop’s cash register. During the day you have a lot of sales and expenses and you end the day with 50 euro in the register. Next day you add 100 euro from your own wallet to the register and end the day at 100 euro, and so on. After 55 days you have added a lot of money from your own, but the cash register shows that your shop is doing well: about half of what you added remains there.
Now you can fool yourself by assuming that the increase is not from your own money, but may be from the variability in unknown sales and expenses during the day. Or that the shop could have done worse by eating away all your daily money addition.
In my opinion, better close your shop, as it makes a loss every day since the start…
Ferdinand, you assume I don’t understand because I disagree? I totally understand what you are saying – it is extremely simplistic. It is also totally arbitrary.
There are many factors influencing atmospheric CO2 levels, only one of which we can quantify better than a rough estimate. You have chosen to attribute the entire net result to that one thing when it is just as valid to attribute it to any of the many other possible factors. But you choose just that one, also making the implicit (and questionable) assumption that without human emissions everything else would be exactly the same. The only reason I can think of for your arbitrary attribution choice is confirmation bias
At best your analysis glosses over a great deal of complexity and simply pretends the unknowns don’t matter. How do you know they don’t matter when they are unknown? You don’t, you’re just assuming. Again, looks like confirmation bias. Beyond that it almost certainly distorts the significance of human emissions. Consider the possibility that natural emissions have increased by much more than human emissions and sinks have also increased, but just slightly less due to time lag. In that scenario human emissions are trivial yet your arbitrary attribution makes them look like the dominant factor.
Is this so difficult for you to understand?
Dave,
As I said before, I always wonder why intelligent people don’t understand what every housewife with a limited budget understands: if you spent more money than you earn, you are getting into trouble…
– Over the past 800,000 years CO2 levels were quite stable, simply following temperature at a rather fixed rate. Although the resulution gets worse with the longer past, even the worst resolution ice core would show a similar CO2 excursion as seen in the past 160 years.
– Both the oceans and vegetation are proven net sinks for CO2. Vegetation due to the oxygen balance and oceans due to the 13C/12C ratio changes (and over 3 million surface samples).
– There is zero evidence for any substantial change in the natural carbon cycle. As human emissions increased a fourfold in the past 55+ years, dwarfing the human influence needs a fourfold increase in natural cycle in lockstep with human emissions. There is no evidence for such an increase at all. None. Not in residence time estimates, not in isotope ratio’s or any other observation.
My opinion is based on all available evidence and many years of discussions with others, by far not based on confirmation bias, as all available evidence points to humans as cause of the increase…
ferdinand, add to your analogy the dishonest employee who daily snatches the 100 euros out of the register ONLY BECAUSE HE KNOWS IT WAS PUT IN THERE…
(anthropogenic equilibrium sink…)
Ferdinand,
Again with the condescending ‘don’t understand’ meme! Your analysis is exceptionally simplistic so please drop the pretense that somehow it could possibly be beyond me. I expect the average third grader would fully grasp it, (and possibly be as convinced as you are). You have neglected to address what I’ve actually said, though.
“Over the past 800,000 years CO2 levels were quite stable, simply following temperature at a rather fixed rate.”
Which could be what’s happening now since we’ve been warming since the end of the LIA.
“There is zero evidence for any substantial change in the natural carbon cycle.”
Still ignoring those pesky unknowns…
“As human emissions increased a fourfold in the past 55+ years, dwarfing the human influence needs a fourfold increase in natural cycle in lockstep with human emissions.”
No it doesn’t – that is ludicrous! Small changes in natural fluxes could dwarf the entirety of human emissions and not be seen in the net result (like in the scenario I described).
“My opinion is based on all available evidence and many years of discussions with others, by far not based on confirmation bias, as all available evidence points to humans as cause of the increase…”
I’ll happily accept that you believe this, but I’m disinclined to ignore what jumps out of your comments and just take your word for it. The enormous uncertainties and substantial unknowns at the very least should, but don’t, temper your confidence.
Dave,
I am sure that you are more than smart enough to understand what I mean, but what I fear is that you and many other skeptics simply accept any reason to not (want to) understand that humans are the cause of the increase, only because that is one of the cornerstones of (C)AGW, to say it bluntly.
Take e.g.:
Which could be what’s happening now since we’ve been warming since the end of the LIA.
The CO2 levels for the current ocean temperatures should be around 290 ppmv. Not 400 ppmv. According to 800,000 years of ice core T-CO2 ratios. And according to Henry’s law. The warming since the LIA is good for 13 ppmv CO2 increase, not 110 ppmv.
Just a matter of doing some research before blaming the small temperature increase for most of the increase.
Still ignoring those pesky unknowns…
You simply don’t know (or ignore) all what is already known and that is much more than what you assume…
No it doesn’t – that is ludicrous!
Dave, human emissions increased a fourfold and so did the increase in the atmosphere and so did the net sink rate. The latter is the important point. If you want to dwarf that with natural emissions, you need a fourfold increase in natural cycle – or none at all – or you violate the equality of every molecule of CO2 for the sinks, no matter the source. Only with a fourfold increase in natural cycle you can have a fourfold increase in the atmosphere and a fourfold increase in net sink rate, if that was the cause. Not a doubling or fivefold increase…
Thus that is not a matter of a small increase here or there, but a fourfold increase of the full natural carbon cycle over the past 55 years. Such an increase would certainly be detected in many observations (like a fourfold decrease in residence time), but it is not. Thus don’t come here with those “pesky unknowns” if you have zero indication that the natural carbon cycle substantially increased over the past decades and only observations that show that the natural carbon cycle didn’t increase…
It is quite simple to invent 101 reasons why humans are not to blame for the increase, simply by ignoring all what is known, while simple logic and every single observation points into one direction…
Ferdinand, I’m not saying what you believe is impossible. I’m saying we don’t know enough to be certain and you’re ignoring lots of unknowns.
Ice cores show average levels over decades or more – the increases we’re seeing could be part of a cycle not revealed in them. It is plausible that warming releases more CO2 than you think it does because natural sinks gobble up the increase more than you think they do, and what we’re observing results from the time delay between them. Again, we just don’t know.
I’m not sure I follow what you mean by “you need a fourfold increase in natural cycle.” As you know, natural sources and sinks are many times larger than human emissions such that very small changes in each could themselves be much larger than human emissions. How would a slight imbalance of changes in CO2 fluxes be described as fourfold increase? And since we cannot measure either natural sources or sinks independently how can you claim they are not changing? Looking only at the net CO2 change won’t get you there.
So, since you’re so convinced, please elaborate how you know a small imbalance in changes of things we cannot measure is not the cause of increased CO2.
http://s90.photobucket.com/user/dhm1353/media/Law17501875.png.html
High resolution shallow cores seem to show a lot more movement of CO2 than the deeper cores. In the above graphic we see an 8 ppm increase over a 40 year span from 1770 to 1810 (almost exactly 300 years ago). That would equal .5C of warming given the 16 ppm/ 1C ratio (taken from deeper cores). So are we willing to admit that it warmed just as much 300 years ago as it did in the last 50 years?! OR is the henry’s law value underrepresented in the deeper cores?
Dave,
The net sink rate is the result of all sinks and sources, human as well as natural. If you see a fourfold increase in net sink rate in the same period that human emissions increased a fourfold, that is only possible if also the natural emissions increased a fourfold or not at all. You can’t have a fourfold increase in the atmosphere – and a resulting fourfold increase in net sink rate – with a threefold or fivefold increase in natural cycle.
Let’s try an example:
The natural cycle is like a continuous flux of cold water in a washbasin with a small opening in the bottom. The height of the water in the basin depends of the inflow of cold water and the opening in the bottom and adjusts itself to where the pressure is high enough to make that influx and outflux are equal. Small changes in influx and/or outflux are reflected in small changes of the height in the basin. You have no measurements of influx or outflux, only height in the basin is measured and its temperature.
Now you start to add a measured quantity of warm water to the same basin. Slightly increasing over time. When you start registering, you find an increase of X mm, compared to the start. The moment that you end the registering the warm waterflow increased 4 times compared to the start and so did the increase in height, resulting in 4*X mm compared to the situation before adding warm water.
Now either the cold water flux didn’t change at all – except for the small variability seen in the past – or if that was the main cause of the measured increase and not the warm water flux, it must have increased a fourfold too. There is no way in between these two: either the cold water flow didn’t increase or it increased a fourfold or you can’t have a fourfold increase in level (and net sink rate).
Add to that that one can measure the temperature of the water in the basin, which shows that the temperature increased a fourfold too, thus confirming that the warm water flux was the only source of the increase.
Back to the CO2 situation: you really need a fourfold increase in natural flux to dwarf the fourfold increase in human emissions over the past 55 years. The drop in 13C/12C ratio confirms that humans are the sole cause of the increase (besides a small contribution from temperature). The evolution of the residence time confirms that there was no substatial change in natural cycle.
Don’t underestimate the resolution of the ice cores: over the past 150 years, the resolution is better than a decade, over the past 1,000 years better than 20 years and over the past 75,000 years better than 40 years. That gives that a one-year peak of 40 ppmv would be detected in ice cores over the past 1,000 years or a continuous offset of 2 ppmv over 20 years, as the repeatability of the measurements is better than 1.2 ppmv (1 sigma). Here for the past 1,000 years:
http://www.ferdinand-engelbeen.be/klimaat/klim_img/antarctic_cores_001kyr_large.jpg
You see, the recent excursion since ~1850 would be detected in every ice core over the past 800,000 years, be it with a lower amplitude…
Fonzie:
So are we willing to admit that it warmed just as much 300 years ago as it did in the last 50 years?
The periods 1910-1945 and 1975-2000 both show ~0.6°C warming, thus I don’t see any reason to doubt that 1770-1810 may have warmed at such a similar speed. And cooled again, as was the case in the period 1945-1975…
Still the whole 0.8°C increase since the depth of the LIA can’t be responsible for the 110 ppmv increase since ~1850, while humans emitted over 200 ppmv in the same period…
There has been no negative numbers in co2 increase. Natural inputs of co2 could be highly variable. The sink rate of co2 has been shown to be highly variable. While some counter that the difference can be seen in the isotope ratio, I disagree. There is nothing that is known at the current time as to how much natural co2 is being released or digested. It appears that the stable co2 cycle before the advent of anthropogenic co2 is doubtful. There could be a tipping point in the sinks of co2 where we release huge amounts of co2 and a resulting no increase in overall levels and/or a decrease in natural co2 that leads to an overall decline in co2.
rishrac:
Natural inputs of co2 could be highly variable. The sink rate of co2 has been shown to be highly variable.
Depends of what you call “highly”. The variability around the trend of 70+ ppmv since 1960 is not more than +/- 1 ppmv to maximum 1.5 ppmv for the extremes (Pinatubo, El Niño) that is the only variability seen, as direct result of temperature variability (about 4-5 ppmv/K). Not really high compared to the total increase and peanuts compared to the in total twice as high total human emissions in the same period.
There is nothing that is known at the current time as to how much natural co2 is being released or digested.
It is not because you don’t know that “nothing” is known… Ocean pCO2 is measured and results in seasonal exchanges which are known to +/- 25%, including the net result over a year: a net uptake of 2.2 ± 0.4 PgC/yr (1 PgC = 1 GtC or ~0.5 ppmv) in the reference year 1995. See:
http://www.pmel.noaa.gov/pubs/outstand/feel2331/maps.shtml
Oxygen and 13C/12C changes are measured and show how vegetation takes CO2 in (in spring) and releases it in all seasons, including the net result over a year: 1.0 ± 0.6 GtC/yr more uptake than release. See:
http://science.sciencemag.org/content/287/5462/2467
and more recent:
http://www.bowdoin.edu/~mbattle/papers_posters_and_talks/BenderGBC2005.pdf
There could be a tipping point in the sinks of co2
The two main natural sources and sinks for CO2 are oceans and vegetation. The seasonal vegetation cycle seems to be quite stable over the past decades, besides a small year by year variability which zeroes out in 1-3 years. Longer term it shows a small but growing uptake, the earth is greening. Only in the exceptional event of extreme huge forest fires and regrowth, I don’t see any reason for a sudden increase in uptake by vegetation.
The oceans simply follow Henry’s law and except for a sudden cold snap of all ocean surfaces at the same time, I don’t see any reason for a sudden increase in uptake…
My comment is a conundrum for proponents of agw… (they can’t have their cake and eat it to) Either the henry’s law value is wrong OR temps were rising just as fast 300 YEARS AGO !!!
Ferdinand, it seems you cannot divert yourself from looking only at the net effect. I’m guessing by “fourfold increase in natural flux” you mean fourfold increase in net flux due to natural fluxes, which is totally beside the point I’m getting at.
I’m bringing up the uncertainties in actual CO2 fluxes and the effect of those uncertainties on how to properly interpret the data we have. You’re totally disregarding those uncertainties and just repeating your fixation on the net. I’ll try just one more time to have you address what I’ve actually said – if you don’t I’ll conclude that you either cannot or will not and leave it there.
Your example is flawed because it does not include the possibility that the opening in the bottom also changes. In your example there could be large changes in the flow rate of both warm and cold water inlets as well as water exiting. The net imbalance of them does determine the water level in the tank, but there could be large changes in flow rates with only small changes in water level. You have not even attempted to address the questions of how you know those flow rates are not changing when they cannot be measured.
Consider this variant on your example. You have a large tank with 2 water inlets and 1 water outlet (inlet 1 = natural CO2 emissions; inlet 2 = human CO2 emissions; outlet 1 = CO2 sinks). Let’s say the initial flow rate conditions are inlet 1 = 200 l/min; inlet 2 = 6 l/min; outlet 1 = 203 l/min.
If inlet 1 changes to 260 l/min and outlet 1 changes to 263 l/min the water level does not change even though the natural flow rates changed by 10 times the human flow rate. In that case the human flow rate is a minor component of the system.
If inlet 1 changes to 202 l/min and outlet 1 changes to 205 l/min the net result is identical, but in this case the human flow rate is a more significant component of the system.
Note that in either case we can attribute the net change to the human flow rate but in the first that clearly exaggerates the significance of the human flow rate.
So, given the fact that we cannot measure the flow rate of either inlet 1 or outlet 1, how do you know how significant the human flow rate is?
Obviously you cannot know. You say it doesn’t matter and confidently form a conclusion anyway. That looks like confirmation bias to me. Continuing to not address that point reinforces my conclusion.
Dave,
If the net difference in ins and outs quadrupled over time, that is either the result of the quadrupling of human emissions in that period and a stable natural carbon cycle, or the result of a quadrupling of both the human contribution and a quadrupling in the total natural carbon cycle. Thus not only a quadrupling of the net (which is measured) but also the quadrupling of the total natural influx and outflux (which is not observed), or you violate the equality of CO2 for the sinks, no matter its origin.
What you forget in your example is that while we don’t have exact measurements of the main (natural) in/out fluxes (although there are pretty good estimates), there are other measurements present which show what really happens. In the case of the atmosphere, we have the 13C/12C ratio and other measurements, in the case of the example we have a thermometer in the tank…
Take your example again:
If the cold water inlet changed from 200 to 260 l/min and the outlet at the same moment changed from 203 to 263 l/min, that would not be noticed in the rate of change of the level, but it would certainly be noticed in a substantial temperature drop, as the warm water influx reduced from 2.9% to 2.2% of the total influx.
What you don’t see is that any substantial change in natural fluxes does have measurable impacts on a lot of variables, which accuracy is more than sufficient to show that there was very little change in the main natural in/out fluxes over the past 55+ years…
Take an increase in oceanic carbon circulation: ocean CO2 has a 13C/12C level higher than of the atmosphere. Human emissions have a very low 13C/12C ratio compared to the atmosphere. The current ~40 GtC/year circulating between deep oceans and atmosphere makes that the human “fingerprint” (the drop of the 13C/12C ratio in the atmosphere) is only 1/3 of what it would be if all human CO2 remained in the atmosphere. If the ocean carbon circulation doubled over time, that would be reflected in a “fingerprint” of only 1/6 of the original…
You don’t need a fourfold increase in both natural emissions and sink rates. All you need is a fourfold increas in the difference between the two. The tropical oceans will always be a source and the uncovered frigid, bio productive waters of the Arctic and Antarctic will always be great sinks. The rate of air flow between sources and sinks is controling the flux, not the thermodynamics at the surfaces..
Fred,
Human emissions increased a fourfold. The increase rate in the atmosphere increased a fourfold and the net sink rate increased a fourfold in the past 57 years.
That gives that the sinks expanded in ratio to either human emissions alone or to human emissions + a fourfold increase in natural emissions, as the sinks don’t discriminate between human and natural CO2.
It is not sufficient to have the difference between natural sources and sinks increased a fourfold…
As you keep saying natural emissions never exceed natural sinks in the long run and I keep saying natural emissions are exceeding natural sinks by much more than the small contribution of anthropogenics. Time will tell who is right. I expect if we have a strong la-nina, the rate of rise in atmospheric CO2 will decrease and may even go negative. Place you bets everybody.
“FerdiEgb???”
I haven’t been commenting much, but, I do check the recent posts side bar regularly, and whenever I have seen “FerdiEgb” I always smile and think of this little guy:
http://www.truetop10.com/wp-content/uploads/2011/12/Cute-small-brown-dog.jpg
Dear Mr. Engelbeen,
(cough) Your viewed-with-a-bemused-head shake arguments about mass balance (or whatever you have been talking about here — have no idea, I just dropped in!) would have a MUCH greater chance of being taken seriously if you called yourself something more dignified…. something …. more….. “serious scientist”-like….. something like…. “Ferdinand Engelbeen.”
#(:))
Best wishes to a fine Belgian (somedayyouaregoingtoseethetruth 🙂 ),
Janice
P.S. Please note: I never thought of that little dog (or the like) in connection with you until I saw “FerdiEgb,” nothing to do with you, just your cute diminuitive.
hopefullysomedaywillbesoon… (☺)
Yes, indeed, Arthur. I like your “smiley” — a VERY fat man looking up at me from 10 stories down — and smiling…. because……… because he just ate two pepperoni pizzas, drank 4 pitchers of Pepsi, and stopped off at Gino’s for a tub (“Yes, sir, I want that whole tub, the one you’ve only scooped about two scoops out of, so far.”) of mocha chocolate almond ice cream.
Okay, okay! I am leaving.
Boy, do I love to eat……
No, I am not fat….. yet.
“mocha almond fudge” (been so long (sniff) I forgot the name!)
@ferdinand meeus
My interpretation of your “fourfold” analysis is that you are saying there is a linear relationship between human emissions and atmospheric CO2 levels. Is that correct? In other words, you are saying that, if natural net fluxes stay constant and human emissions are increasing over time at a constant rate, then this forces atmospheric CO2 levels to increase at a constant rate also. And if human emissions increase from year to year at an ever-increasing rate, say with a 1% yearly rate increase, then atmospheric CO2 levels will follow that same 1% per year rate increase. Is this a correct interpretation of what your “fourfold” analysis means?
From 1958 to the present, Mauna Loa seasonally adjusted measurements show a CO2 growth rate that is steadily increasing by 1.8% each year on average. And from 1958 to the present, CDIAC data show a global human CO2 emissions growth rate that is steadily increasing by 1.2% each year on average. This is a substantial difference in their year-over-year rate increases. Not only that, but atmospheric CO2 levels seem to be growing more quickly than human emissions (at least over the ‘Mauna Loa’ time period).
Fred Haynie:
I keep saying natural emissions are exceeding natural sinks by much more than the small contribution of anthropogenics.
Would be difficult, as the net result of the extra natural sinks + human emissions would be larger than human emissions alone… What we see until now is that over yearly averages the net increase in the atmosphere is between 10-90% of human emissions, thus no matter the height of the natural cycle, the natural sinks were always larger than the natural sources over the past 55+ years… Human emissions are not removed preferentially compared to natural emissions…
Hello Janice,
Some time ago… Used my WordPress account, because my Facebook account was expired and didn’t bother to log in there after a three weeks trip to China… So that is FerdiEgb, short for my name…
BTW, what I have seen in China is a country so fast developing from the Middle Ages to a hypermodern nation, that they will surpass the rest of the world in may be 1-2 decades… Incredible what they are doing in building roads, high speed train tracks, tunnels, bridges,…
willb01,
My interpretation of your “fourfold” analysis is that you are saying there is a linear relationship between human emissions and atmospheric CO2 levels. Is that correct?
There is a linear relationship between the two by coincidence: because human emissions increased with a rather constant increase over time and there is a linear ratio between net sink rate and the extra CO2 in the atmosphere, the residual CO2 of each year also increased linearly. That gives a quite constant ratio between total human emissions, increase in the atmosphere and net sink rate, each increased a fourfold since 1958. Visible in the total increase over time:
http://www.ferdinand-engelbeen.be/klimaat/klim_img/temp_emiss_increase.jpg
Or as accumulated values:
http://www.ferdinand-engelbeen.be/klimaat/klim_img/acc_co2_1900_cur.jpg
As the average increase in the atmosphere is about 53% of human emissions, I suppose that the growth rate of CO2 in the atmosphere is also 53% of the growth rate of human emissions (but could be wrong!), thus 1.8%/year * 0.53 = 0.95%/year, In practice somewhat faster, but I didn’t take into account the (very uncertain) extra emissions due to land use changes…
Temperature influence is hardly visible at total level and partly reverse, but if you take the derivatives (the CO2 rate of change), you remove most of the trends and only have left a linear increase of the emissions and atmospheric CO2 rate of change and the fortified noise caused by small temperature changes:
http://www.ferdinand-engelbeen.be/klimaat/klim_img/dco2_em2.jpg
The coincidence thus is in the fact that human emissions increased quite constantly over time and that the net sink rate of CO2 in (mainly) oceans and vegetation is relative slow, anyway not fast enough to remove all human emissions in the same year as emitted and the behavior of the sinks is quite linear in ratio with the height of the CO2 pressure in the atmosphere above steady state per Henry’s law…
These three factors together make that there is a rather constant ratio between emissions, increase in the atmosphere and net sink rate…
If the rate of change of human emissions changed substantially, that would reflect in the end of the linear relationship between emissions and increase in the atmosphere.
It doesn’t address the size of the sinks. How are the sinks so large when according to climate science they should be shrinking? Have the sinks always been there, and if so how is it that any increase in co2 could possibly increase? What causes the sink to grow? What declines at the expense of co2 uptake? Have you done the math on how much co2 is being produced and how much makes its way into the atmosphere. If you do that, the uptake is not linear. The amount of co2 ppm/v uptake is greater and continues to increase. In every year since 1998 the ppm/v should have been over 3, and for the last few years should have been 4 to 6. This indicates that the ratio of how much is released between anthropogenic and natural co2 is essentially unknown. It is possible and has been done to calculate the size of the sinks. I don’t think anyone will argue that tropical rainforest have disappeared at an alarming rate, and if you look at what is suppose to be a warming ocean less co2 uptake. The current year increase in co2 from el nino is at the low end of what the increase in co2 should be. How do you explain the dramatic falloff in co2 increase from 1998 to 1999? And the next year? At least 50% of the years from 1998 onward were below 2 ppm/v. That’s not a statistical mistake. Except for slight increases, in the tenths and hundredth range, it looks a lot like the 1980’s. I do think anthropogenic co2 increased quite a bit during the 2000’s.
http://www.drroyspencer.com/wp-content/uploads/simple-co2-model-fig01.jpg
And yet… the above graph is the raw data that is used to make the cumulative emissions graph. While they do trend a like on the whole, they don’t look anywhere near alike. You can see that from the 70s to the late 90s the carbon growth rate actually trended flat while human emissions rose 33%. The growthrate didn’t increase again until 1998 and the few years following. (Gee, i wonder what happened in those years to cause that?!) The cumulative emissions graphs may look sexy, but further review finds that they’re perhaps not worth the paper that they’re written on…
Fonzie,
By looking at the derivative, you do overblow the effect of the noise on the trend. In reality, the noise is only +/- 1-1.5 ppmv around the trend of over 70 ppmv, caused by transient response of (tropical) vegetation on temperature changes. But vegetation is a net sink for CO2… See the graph here.
Further using Henry’s law as base and the observed increase in CO2 pressure in the atmosphere, one can calculate the net sink rate and as result the residual increase of CO2 in the atmosphere, which is midst of the temperature caused noise…
rishrac:
It doesn’t address the size of the sinks. How are the sinks so large when according to climate science they should be shrinking?
I am not responsible for what climate science thinks… The IPCC uses the Bern model, which includes saturating for the different sinks. That is certainly true for the ocean surface, which is saturating at 10% of any change in the atmosphere (due to ocean chemistry), but very questionable for the deep ocean exchanges and non-existing for vegetation.
The behavior of the sinks until now is surprisingly linear in ratio with the increase of CO2 in the atmosphere. Not the slightest sign of saturation in sight…
Have the sinks always been there, and if so how is it that any increase in co2 could possibly increase? What causes the sink to grow?
Per Henry’s law the oceans act as a CO2 source if the partial pressure (pCO2 in μatm) of the waters is above the pCO2 (=~ppmv) of the atmosphere and as a CO2 sink if the pCO2 is below that of the atmosphere.
The oceans are both sink and source, as the equatorial upwelling releases a lot (~40 GtC) of CO2 while warming up while the cold sinks near the poles take about the same quantity of CO2 with them into the deep. The net is thus a matter of (area weighted) average pCO2 difference of all ocean areas with the atmosphere. Currently there is 7 μatm (=~ppmv) more CO2 pressure in the atmosphere than in the oceans. See Feely e.a.:
http://www.pmel.noaa.gov/pubs/outstand/feel2331/exchange.shtml
Thus the oceans are a net sink for CO2.
As the CO2 levels in the atmosphere increase faster than the effect of (if any) ocean temperature increase, the extra CO2 pressure caused more uptake by the oceans, which is quite linear in ratio to the pCO2 difference.
This indicates that the ratio of how much is released between anthropogenic and natural co2 is essentially unknown.
It indicates only that you are overfocused on the year by year variability, which is hardly of interest, as that zeroes out within a few years. The theoretical calculation based on the pCO2 difference between atmosphere and oceans is in the middle of the noise (except after the Pinatubo eruption).
There are several ways to know how the natural carbon cycle evolved over time: quite stable with about 150 +/- 3 GtC in and out within a year, mainly over the seasons. Residual CO2 increase 50-55% of human emissions, year by year variability 10-90%, decadal variability 40-70%…
BTW, 1999 was a firm La Niña year with colder temperatures and firm regrowth of tropical forests after the drying out by the 1998 El Niño. Can be seen in the changes of temperature and 13C/12C ratio.
I’m not overblowing anything… it’s a fact that the carbon growthrate trended flat from the late 70s to the late 90s and that human emissions increased by a third. All that changed with the ’98 el nino and the ensuing rise in temperature…
I might add that PA has a similar graph further on down the comment page which shows yet another flat trend after ’98 (coinciding of course with “the pause” in global warming)…
http://m.imgur.com/YwZ111q?r
afonzarelli:
it’s a fact that the carbon growthrate trended flat from the late 70s to the late 90s and that human emissions increased by a third.
So what? It is not of the slightest interest for the cause of the increase in the atmosphere: as long as the increase is within 10-90% of human emissions (that is including the error bars), humans are responsible for (near) all the increase and nature was a net sink for the difference. It is of not the slightest interest that one year it is 10% and next year 90%, 40% in one decade and 70% in another decade: that is what the (small!) natural variability in sink rate does. A sink rate which in all observations is quite stable and only shows a year by year net variability of +/- 1 ppmv up to +/- 1.5 ppmv at the extremes around the trend of 70 ppmv over the past 55+ years.
You can’t make a positive from a negative: nature was a net sink for all of the past 55+ years, its contribution to the increase was zero, nada, nothing (besides a small increase due to increased seawater temperatures).
The only possible theoretical alternative is a fourfold increase in total carbon cycle in lockstep with the fourfold increase in human emissions, which doesn’t exist in any of the many observations. To the contrary: all observations point to a rather stable natural carbon cycle.
“So what?”
It simply means that your cumulative emissions graphs are bogus. They look like a big deal, but upon further scrutiny they come up woefully short. The parameters in those graphs are such that they don’t pick up what the raw data tells us…
As for your mass balance argument, can’t we expect a little more than grade school analysis from the man with the 200 i.q.? There are times when you claim that 10-15 ppm has been added by nature since the little ice age. 10-15 ppm is more than 0. So which is it? Your ineptitude really came shining through with your analogy of the shopkeeper. (for starters, you had the business losing money on it’s own and then it was all down hill from there)…
Feel free to respond to my comment if you wish (it’s your prerogative), though i won’t be reading it as this is now a “dead thread”. So it looks like the fonz has the last (de facto) word… ☺
afonzarelli
It simply means that your cumulative emissions graphs are bogus.
Cumulative emissions only show that human emissions are about twice the increase in the atmosphere. That is all, but quite important: it shows that the natural sinks don’t remove human emissions at the same speed as released.
they don’t pick up what the raw data tells us…
What do the raw data tell us? The same story as for the accumulated values: that in every year the increase in the atmosphere was less than human emissions, thus the natural carbon cycle was a net sink for CO2 in every year of the past 55+ years. Sometimes high, sometimes low but always negative.
It tells us that the variability in natural cycle is very modest and levels out in 1-3 years to (below) zero, as near all variability is from the reaction of vegetation on temperature and vegetation is a net, growing sink for CO2.
There are times when you claim that 10-15 ppm has been added by nature since the little ice age. 10-15 ppm is more than 0.
10-15 ppmv is what the warming oceans released in the atmosphere since the LIA, no problem with that. But 10-15 ppmv is far less than the 110 ppmv we are today above the steady state level of the oceans at current ocean surface temperatures…
Your ineptitude really came shining through with your analogy of the shopkeeper
I can only repeat that I am every time surprised that intelligent people like you don’t (want to?) understand what most housewives with a limited budget understand all too well…
I am on vacation, if anyone has missed me. But, it is very clear from the rate of change of atmospheric CO2 to temperature that the former is directly related to the latter, and human inputs have very little impact. Keep watching as the ~65 year temperature cycle shifts into its downward phase, and CO2 levels markedly decelerate, while human inputs keep rising.
This dynamic is to be expected with temperature modulation of THC transport, and static models of the oceans using Henry’s law are naive.
It’s not even a close call. Keep watching as temperatures decline.
Bart, i miss you… (☺)
Bart,
Indeed missed your reactions, but Fonzie is a good stand-in…
Still I am pretty sure that any temperature reduction will have little effect on the overall CO2 increase in the atmosphere… But we weill see…
“But we will see…”
Amen
So sayeth: Lead author Professor Richard Betts
Modest ups-&-downs, HUH? ….. Shur nuff seasonally modest with an average 8 ppm “up” in the NH Fall & Winter ….. and a 6 ppm “down” during the NH Spring & Summer. A bi-yearly seasonal cycle that has been “steady & consistent” for the past 58 years as denoted by the Keeling Curve graph.
So sayeth: Lead author Professor Richard Betts
Professor Richard Betts should damn well know that what he stated in the above is a biological impossibility.
The majority of all microbial decomposition of dead biomass (plants) resulting in the outgassing of CO2 occurs in NH Springtime and Summer when there is sufficient moisture (water) and surface temperatures are 60F or higher.
Whereas, a minimum of microbial decomposition of dead biomass (plants) occurs during the NH Autumn and Winter months simply because of the lack of moisture and the cool temperatures of Autumn ….. and the cool, cold, wet, freezing temperatures of Winter.
Thus, minimal microbial decomposition of dead biomass = minimal outgassing of CO.
So sayeth: Lead author Professor Richard Betts
HA, of course “it won’t happen now” …… simply because it would have been utterly foolish to expect the Sept 2016 minimum CO2 ppm to drop below 400 ppm ….. given the fact that the aforesaid El Niño has resulted in unusually warm SH ocean water during the Sept15/May16 SH Summertime cycle which severely retarded the ingassing of atmospheric CO2 resulting in a +9.67 ppm increase.
To wit:
May 2014 maximum CO2 ppm = 401.88
Sept 2014 minimum CO2 ppm = 395.35 -6.53 ppm
May 2015 maximum CO2 ppm = 403.94 +8.59
Sept 2015 minimum CO2 ppm = 397.63 -6.31
May 2016 maximum CO2 ppm = 407.70 +9.67
Sept 2016 minimum CO2 ppm = (my predicted decrease – 401.30 -6.40 ppm)
http://www.iea.org/media/news/2016/pressrelease/EnergyRelatedCO2_TimeSeriesData.xlsx
Well, 1998 to this point is a ONI statistical dead heat.with 2016.
In 1998 the CO2 level rose 2.92 PPM (according to ESRL). The emissions were (courtesy IEA) 22.38 GT.
In 2016 the emissions (assuming they match 2015) will be 32.14 GT.
Via the magic of math 2.92*32.14/22.38 = 2.92*32.14/22.38 = 4.19 PPM.
So … What we should expect in 2016 is a 4.19 PPM increase. A 2.92 increase is a global warming failure. Less than a 2.92 increase is simply embarrassing, and would call into question the relationship between emissions and the CO2 level.
It’s already BEEN called into question!
So sayith: PA
Sorry PA, but the yearly GT estimates for human emitted CO2 are not guesstimated until they know how much the atmospheric CO2 has increased for that particular year …… and ….. the actual facts for 1998 are, to wit
Maximum to Minimum yearly CO2 ppm data – 1979 thru 2013
Source: NOAA’s Mauna Loa Monthly Mean CO2 data base
@ ftp://aftp.cmdl.noaa.gov/products/trends/co2/co2_mm_mlo.txt
CO2 “Max” ppm Fiscal Year – mid-May to mid-May
year mth “Max” _ yearly increase ____ mth “Min” ppm ___ Bi-yearly ppm cycle
1979 _ 6 _ 339.20 …. + …… __________ 9 … 333.93 _____ 79/80 = -5.27 — +7.54
1980 _ 5 _ 341.47 …. +2.27 _________ 10 … 336.05 _____ 80/81 = -5.42 — +6.96
1981 _ 5 _ 343.01 …. +1.54 __________ 9 … 336.92 _____ 81/82 = -6.09 — +7.75
1982 _ 5 _ 344.67 …. +1.66 __________ 9 … 338.32
1983 _ 5 _ 345.96 …. +1.29 __________ 9 … 340.17
1984 _ 5 _ 347.55 …. +1.59 __________ 9 … 341.35
1985 _ 5 _ 348.92 …. +1.37 _________ 10 … 343.08
1986 _ 5 _ 350.53 …. +1.61 _________ 10 … 344.47
1987 _ 5 _ 352.14 …. +1.61 __________ 9 … 346.52
1988 _ 5 _ 354.18 …. +2.04 __________ 9 … 349.03
1989 _ 5 _ 355.89 …. +1.71 __________ 9 … 350.02
1990 _ 5 _ 357.29 …. +1.40 __________ 9 … 351.28
1991 _ 5 _ 359.09 …. +1.80 __________ 9 … 352.30
1992 _ 5 _ 359.55 …. +0.46 Pinatubo _ 9 … 352.93
1993 _ 5 _ 360.19 …. +0.64 __________ 9 … 354.10
1994 _ 5 _ 361.68 …. +1.49 __________ 9 … 355.63
1995 _ 5 _ 363.77 …. +2.09 _________ 10 … 357.97
1996 _ 5 _ 365.16 …. +1.39 _________ 10 … 359.54
1997 _ 5 _ 366.69 …. +1.53 __________ 9 … 360.31
1998 _ 5 _ 369.49 …. +2.80 El Niño __ 9 … 364.01
1999 _ 4 _ 370.96 …. +1.47 __________ 9 … 364.94
2000 _ 4 _ 371.82 …. +0.86 __________ 9 … 366.91
2001 _ 5 _ 373.82 …. +2.00 __________ 9 … 368.16
2002 _ 5 _ 375.65 …. +1.83 _________ 10 … 370.51
2003 _ 5 _ 378.50 …. +2.85 _________ 10 … 373.10
2004 _ 5 _ 380.63 …. +2.13 __________ 9 … 374.11
2005 _ 5 _ 382.47 …. +1.84 __________ 9 … 376.66
2006 _ 5 _ 384.98 …. +2.51 __________ 9 … 378.92
2007 _ 5 _ 386.58 …. +1.60 __________ 9 … 380.90
2008 _ 5 _ 388.50 …. +1.92 _________ 10 … 382.99
2009 _ 5 _ 390.19 …. +1.65 _________ 10 … 384.39
2010 _ 5 _ 393.04 …. +2.85 __________ 9 … 386.83
2011 _ 5 _ 394.21 …. +1.17 _________ 10 … 388.96
2012 _ 5 _ 396.78 …. +2.58 _________ 10 … 391.01
2013 _ 5 _ 399.76 …. +2.98 __________ 9 … 393.51
The “Max” CO2 occurred at mid-May (5) of each year … with the exception of three (3) outliers, one (1) being in June 79’ and the other two (2) being in April 99’ and 2000.
The “Min” CO2 occurred at the very end of September (9) of each year … with the exception of eleven (11) outliers, all of which occurred within the first 7 days of October.
The following graph depicts the 1979-2013 UAH satellite global lower atmosphere temperatures …. on which someone has included the “Max” mid-May CO2 ppm data as noted in the above “yearly CO2 ppm data” list.
http://i1019.photobucket.com/albums/af315/SamC_40/1979-2013UAHsatelliteglobalaveragetemperatures.png
And PS, you should note, via the above graph, that those 35 years of steady increase in atmospheric CO2 ppm ……. DOES NOT CORRELATE, ….. even remotely, ….. with the randomly “up n’ down” swings in the 35 years of measured air temperatures.
Huh?
I’m not sure what your point is.
http://www.esrl.noaa.gov/gmd/ccgg/trends/gr.html
And 1998 was 2.93 not 2.92 so I guess I did make an error.
2.93*32.14/22.38 = 4.21 PPM expected value for this year.
The CO2 rise rate has increased 29% the emissions about 44% since 1998. 60% of the old 1998 emissions stayed in the atmosphere. Only 40% of post 1998 increase has. Emissions are only about 2/3rds as effective as they used to be.
http://www.esrl.noaa.gov/gmd/ccgg/trends/global.html#global
IPCC uses midyear concentrations which turns out to be the mean averaged marine surface CO2 level. Which increased 2.80 PPM in 1998.
By that standard the increase should be 4.02 PPM this year.
What you are doing is something deviant. If you wanted to average June and July and call that midyear concentration I guess that would be ok.
As far as the guesstimates, they are mostly derived from fossil fuel consumption figures and since coal is a commodity sold by grade they aren’t that far off. Emissions figures are much more accurate than the temperature anomalies which have evolved (change to historic data) over 30% in the last ten years .
http://i.imgur.com/YwZ111q.png
Further: if you plot the 13 month change it shows strong temperature influence.
So sayith: PA – June 16, 2016 at 8:08 am
Did I post far too much factual data in one posting for you to mentally digest, ….. or what?
So sayith: PA
Increased 29%, HUH????
The total atmospheric CO2 ppm increase from 1998 to 2016 …. was 38.21 ppm.
Thus the CO2 rise rate since 1998 was a 10.3% increase in atmospheric CO2
So sayith: PA
So PA, that sounded quite amazing to me, ….. and thus I am begging you to please explain what sort of “magical” science occurred to get that 20% difference in CO2 post-1998?
And by the way, just how many GT of human emitted CO2 was released into the atmosphere between 1880 and 1998? I need to know that GT amount so that I can calculate what 60% of it is.
So sayith: PA
There ya go again, PA, ….. with that amazing “magical” science claim.
PA, really now, …. tell me, ….. just what did ya’ll global warminists do to those pos-1998 emitted CO2 molecules that has rendered them only about 2/3rds as effective as the pre-1998 CO2 molecules?
Anyway, PA, here is the factual CO2 data and the yearly ppm increases from 1998 to 2016
year mth max CO2 _ yearly increase
1998 _ 5 _ 369.49 …. +2.80 El Niño
1999 _ 4 _ 370.96 …. +1.47
2000 _ 4 _ 371.82 …. +0.86
2001 _ 5 _ 373.82 …. +2.00
2002 _ 5 _ 375.65 …. +1.83
2003 _ 5 _ 378.50 …. +2.85
2004 _ 5 _ 380.63 …. +2.13
2005 _ 5 _ 382.47 …. +1.84
2006 _ 5 _ 384.98 …. +2.51
2007 _ 5 _ 386.58 …. +1.60
2008 _ 5 _ 388.50 …. +1.92
2009 _ 5 _ 390.19 …. +1.65
2010 _ 5 _ 393.04 …. +2.85
2011 _ 5 _ 394.21 …. +1.17
2012 _ 5 _ 396.78 …. +2.58
2013 _ 5 _ 399.76 …. +2.98
2014 _ 5 _ 401.88 …. +2.12
2015 _ 5 _ 403.94 …. +2.06
2016 _ 5 _ 407.70 …. +3.76
Resulting in a total CO2 increase of 38.21 ppm during the past 19 years.
Actual Mauna Loa CO2 data excerpted from:
ftp://aftp.cmdl.noaa.gov/products/trends/co2/co2_mm_mlo.txt
You keep pointing to the monthly Mauna Loa data as though it is magic. IPCC uses a global mid-year average.
Doesn’t matter, I can use your data to make my point.
http://cdiac.ornl.gov/ftp/Global_Carbon_Project/Global_Carbon_Budget_2015_v1.0.xlsx
1960 2569 MT CO2 level (January) 316.43 PPM
1998 6610 MT CO2 level (December) 367.08 PPM (difference 50.65)
2014 9795 MT CO2 level (December) 398.84 PPM (difference 31.76)
1960-1998 189394 MT
1999-2014 132575 MT
132575/189394 = 0.7 or 70%.
31.76/50.65 = 0.63 or 63%.
189394/(2.13*1000) = 88.9 PPM so… 57% of the carbon was staying in the atmosphere through 1998.
132575/(2.13*1000) = 62.2 PPM so… 51% of the carbon was staying in the atmosphere 1999 to 2014.
And for 2014 (from 396.81 in December 2013) 2.03 PPM for 9795 MT is 44%.
So there is some ‘splaining to due about why CO2 emissions are getting less effective.
The absorption rate wasn’t down to 40% by 2014, but I will have fun with the 2017 numbers. Pre-1990 the rate was 58% so the decrease in effectiveness is recent and accelerating.
My original point was “new” carbon is less effective than “old” carbon.
If you assume 6610 MT per year (1998) is “old” carbon and 57% effective the post 1998 excess “new” carbon is only about 27.5% effective. So instead of 60/40 it is 57/27.5.
PA said:
PA, what are these MT figures (megatons, gigatons, what?) and how did you determine their amounts/quantities?
2569 MT ….. 6610 MT ….. 9795 MT ….. 189394 MT ….. 132575 MT
Me thinks you have selectively chosen the quantities you need for your “fuzzy math” calculations to insure you get the correct results that prove your claims.
And PA, iffen you are going to calculate the total weight (tons) of the atmospheric CO2 via use of its measured ppm # …… then you have to use the following “conversion” amounts, to wit:
PS, PA, did you know that rainfall “strips” a lot of CO2 out of he atmosphere?
Did you account for that “loss” in your “fuzzy math” calculating?
PA also said:
PA, is that “new” and ”old” carbon in the atmosphere …… similar to …… that “new” and ”old” rainwater in the swimming pool?
Why I betcha that “new” rainwater in the pool isn’t as “wet” as that ”old” rainwater, ….. is it?
Samuel C Cogar June 19, 2016 at 6:45 am
…
PA, is that “new” and ”old” carbon in the atmosphere …… similar to …… that “new” and ”old” rainwater in the swimming pool?
Why I betcha that “new” rainwater in the pool isn’t as “wet” as that ”old” rainwater, ….. is it?
I’m not sure if you have a learning disability or simply aren’t reading my posts carefully.
The way to compute the marginal effect of an increase in emissions (“new emissions”) is to assume effect of the existing emissions is unchanged.
The emissions in 1998 of 6610 MT were as previously computed about 57% effective.
6610 MT emitted from 1999 to 2014 is 6610 x 16 or 105760 MT that is 57% effective or equal to 49.7 PPM if 100% effective but only 28.3 PPM at 57% effectiveness. This is amount of the atmospheric increase due to the “old” or baseline emissions level.
The actual increase was 31.76 PPM. 31.76-28.3 = 3.46 PPM. 3.46 PPM is the remaining effect from the increase in emissions.
The total emissions 1999-2014 were 132575.27 MT. 132575.27-105760= 26815.27 MT of “new” emissions that represent an increase in the emissions level.
26815.27 MT = 12.59 PPM change in atmospheric CO2. The actual was 3.46. 3.46/12.59 = .275 or 27.5% effective.
So only 27.5% of the post-1998 increase in emissions stayed in the atmosphere. The marginal addition to global warming of increases in emission is low and getting lower.
From the atmospheric CO2 concentration data for the Mauna Loa Observatory provided by the Scripps Institute, the average seasonal variation over the period May 1958 to May 1968 is estimated to be 5.9 ppm. For the period May 2005 to May 2015, the estimated variation is estimated to be 6.9 ppm, an increase of 1 ppm. That would appear to imply greater photosynthesis with time as temperature rises, the well known greening of the planet not “This warms and dries tropical ecosystems, reducing their uptake of carbon and exacerbating forest fires”.
Further, why does the study involve sea-surface temperature when comparison of CO2 annual rate of change with 12 month moving average temperature from UAH satellite lower tropospheric data shows a higher correlation between the Tropics-Land component than the Tropics-Ocean component?
Also, how can this research not have noticed that the annual rate of change in atmospheric CO2 concentration lags the rate of change in temperature by an estimated 5 months proving beyond reasonable doubt that CO2 change does not cause temperature change? This negates the commonly applied climate models rendering any conclusion based thereon meaningless. Is this incompetence or lack of integrity due to such a conclusion jeopardising research funding?
We are talking here about Dr Betts, so it is both incompetence and lack of integrity.
Beneficial or not El Nino will have increased the rate of increase of atmospheric Co2 and any slight reduction of fossil fuel consumption caused by a lowering effect on the demand upon any generally down-stream heating systems will have been more than offset by the increased demand upon air conditioning systems of greater output anyway. In short, it is the Tropics that is making itself more tropical by both trapping and creating heat from population and industrial/commercial expansions and then expelling it into the atmosphere.
Lots of talk about Henry’s law, which states that the solubility of a gas in a liquid is directly proportional to its partial pressure in the gas mixture (=atmosphere) with which it is in equilibrium (other things, i.e. temperature et al. being equal).
Henry’s law does not say anything about changes in solubility of a gas in a liquid with temperature, although it is well known that gas-in-liquid solubilities always decrease with increasing temperature.
What seems to be lacking from the whole ocean-atmosphere CO2 exchange discussion is actual experimental measurements of solubility of CO2 in sea water at different temperatures. Sea water is a complex chemical system dominated by two cations (Na and Mg) and two anions (Cl and SO4). From what little I’ve been able to deduce from my limited reading, almost all the CO2 in sea water (fresh water too) is actually in the form of the bicarbonate anion, not dissolved CO2.
So you’re not looking at a simple gas-in-liquid solubility, but the relation between concentration (partial pressure) of CO2 in air and the concentration of HCO3 in a complex buffered aqueous solution, which may well show a quasi-linear relationship that mimics Henry’s law. Or it might not. And you want to know how that relationship (which you might call effective solubility) changes with temperature. If that data exists, I haven’t been able to find it, or even a reference to it. All I see are general statements about decreasing solubility with increasing temperature – no actual numbers.
One would think that a study like that, which could be done in any well-equipped chemistry lab, would form an integral part of the whole climate-science/global-warming/ocean-acidification complex. Perhaps it’s been done and the results don’t match the expected results? Good studies would also look at the kinetics of CO2 exchange between sea water and air and how those vary with temperature too.
Considering that CO2 is the demon and considering that the oceans contain approximately 60 to 70 times more CO2 than the atmosphere, there seems to be a lack of basic science here. What am I missing?
When you wrote ….. “concentration of HCO3”, …… were you referring to carbonic acid (H2CO3)?
And ps, Henry’s law is highly dependent upon the temperature difference between the ocean water and the near-surface air.
And don’t forget, the ocean waters have been slowly warming up from their decrease during the LIA. And it is that “warm-up” of the ocean waters that is driving the “steady n’ consistent” yearly increase in atmospheric CO2 ppm as denoted by the Keeling Curve graph.
Smart Rock,
What you are missing is a lot of literature about the solubility of CO2 in seawater at different temperatures, pH, salt content, bio-life,… and over 3 million direct measurements of seawater samples…
A good starting point is the compilation of Feely e.a. of the first million seawater samples:
http://www.pmel.noaa.gov/pubs/outstand/feel2331/introduction.shtml
The formula that shows the relationship between temperature and pCO2 is:
(pCO2)sw @ Tin situ = (pCO2)sw @ Teq x EXP[0.0423 x (Tin-situ – Teq)]
used to calculate the in-situ pCO2 at the water inlet from the temperature at the measuring device. See further:
http://www.ldeo.columbia.edu/res/pi/CO2/carbondioxide/text/LMG06_8_data_report.doc
Several sulubility graphs of CO2 vs T in seawater:
http://www-naweb.iaea.org/napc/ih/documents/global_cycle/vol%20I/cht_i_09.pdf
The human-caused rise in atmospheric concentration of carbon dioxide is being given an extra boost this year by the natural climate phenomena of El Niño, say climate scientists in a paper published in today’s edition of the journal Nature Climate Change.
Lets assume there were no human-caused CO2, then the El Nino would have have caused an extra boost in CO2 independent of what existed. Just like now where the El Nino has caused an extra boost to what existed regardless of what made it exist. So to attempt to introduce the supposed human-caused effect is cheap journalistic sensationalism and deserves the most opprobrious disdain one can administer.
Right you are in accusing their actions as being nothing more than ….. “a cheap journalistic sensationalism and deserves the most opprobrious disdain one can administer”.
An El Niño event, regardless of what caused it, results in an extremely large swath of Pacific Ocean water becoming “warmer” than its normal seasonal temperature.
And whenever that extremely large swath of Pacific Ocean water is “warmer” …. it will (take your pick), …. outgasses more CO2 into the atmosphere …… or …… ingasses less CO2 from the atmosphere …….. with the result being a “spike” in atmospheric CO2 ppm quantity per Mauna Loa measurements, …. to wit:
1998 _ 5 _ 369.49 …. +2.80 ….. El Niño year
1999 _ 4 _ 370.96 …. +1.47
2000 _ 4 _ 371.82 …. +0.86
2001 _ 5 _ 373.82 …. +2.00
2002 _ 5 _ 375.65 …. +1.83
2003 _ 5 _ 378.50 …. +2.85— El Niño year
2004 _ 5 _ 380.63 …. +2.13
2005 _ 5 _ 382.47 …. +1.84
2006 _ 5 _ 384.98 …. +2.51
2007 _ 5 _ 386.58 …. +1.60
2008 _ 5 _ 388.50 …. +1.92
2009 _ 5 _ 390.19 …. +1.65
2010 _ 5 _ 393.04 …. +2.85 — El Niño year
2011 _ 5 _ 394.21 …. +1.17
2012 _ 5 _ 396.78 …. +2.58
2013 _ 5 _ 399.76 …. +2.98— El Niño year
2014 _ 5 _ 401.88 …. +2.12
2015 _ 5 _ 403.94 …. +2.06
2016 _ 5 _ 407.70 …. +3.76 — El Niño year
Source – Oceanic El Nino index: http://ggweather.com/enso/oni.htm
Good relation tend!
Not proof. But it does pass the “circumstantial evidence” requirement to find a person guilty: Method (warm water releases more outgassing CO2), motive (warmer tropical waters), and opportunity (repeat offender sequence).
Now, look again at the CO2 trend, and show the years when the La Nina (cooler tropical waters) are found.
@ RACookPE1978
YUP, to wit:
1998 _ 5 _ 369.49 …. +2.80 ….. El Niño year
1999 _ 4 _ 370.96 …. +1.47 .. La Nina
2000 _ 4 _ 371.82 …. +0.86.. La Nina
2001 _ 5 _ 373.82 …. +2.00
2002 _ 5 _ 375.65 …. +1.83
2003 _ 5 _ 378.50 …. +2.85— El Niño year
2004 _ 5 _ 380.63 …. +2.13
2005 _ 5 _ 382.47 …. +1.84.. La Nina
2006 _ 5 _ 384.98 …. +2.51
2007 _ 5 _ 386.58 …. +1.60.. La Nina
2008 _ 5 _ 388.50 …. +1.92
2009 _ 5 _ 390.19 …. +1.65
2010 _ 5 _ 393.04 …. +2.85 — El Niño year
2011 _ 5 _ 394.21 …. +1.17.. La Nina
2012 _ 5 _ 396.78 …. +2.58
2013 _ 5 _ 399.76 …. +2.98— El Niño year
2014 _ 5 _ 401.88 …. +2.12
2015 _ 5 _ 403.94 …. +2.06
2016 _ 5 _ 407.70 …. +3.76 — El Niño year
Of course, I already knew that. Figured it out 15+ years ago when I determined that it was the “TEMPERATURE” of the Southern Hemisphere ocean waters that were the “driver” of the Keeling Curve Graph ….. the bi-yearly (seasonal) cycling and the yearly increase.
“DUH”, I knew it was a biological impossibility for the NH land mass to “outgas” copious amounts of CO2 during the fall and winter months (Sept to March).
SamC, …… ABPhysical&BiologicalScience1963