A single devastating graph shows official climate predictions were wild
By Christopher Monckton of Brenchley
The new global warming speedometer shows in a single telling graph just how badly the model-based predictions made by the Intergovernmental Panel on Climate Change have over-predicted global warming.

The speedometer for the 15 years 4 months January 2001 to April 2016 shows the [1.1, 4.2] C°/century-equivalent interval of global warming rates (red/orange) that IPCC’s 1990, 1995 and 2001 reports predicted should be occurring by now, compared with real-world, observed warming (green) equivalent to less than 0.5 C°/century over the period.
Observed reality
RSS and UAH monthly near-global satellite lower-troposphere temperature anomaly values for each month from January 2001 to April 2016 were assumed to be broadly accurate and were averaged. The least-squares linear-regression trend on their mean was determined and found equivalent to 0.47 C°/century.
Predictions in IPCC’s Assessment Reports
IPCC (2007, 2013) are too recent to allow reliable comparison of their predictions against reality.
IPCC (2001), on page 8, predicted that in the 36 years 1990-2025 the world would warm by 0.75 [0.4, 1.1] C°, equivalent to 2.1 [1.1, 3.1] C°/century. This predicted interval is 4.5 [2.3, 6.6] times observed warming since January 2001.
IPCC (1995), at fig. 6.13, assuming the subsequently-observed 0.5%-per-year increase in atmospheric CO2 concentration, predicted a medium-term warming rate a little below 0.4 C° over 21 years, equivalent to 1.8 C°/century, or 3.8 times observed warming since January 2001.
IPCC (1990), at page xxiv, predicted near-linear global warming of 1.0 [0.7, 1.5] C° over the 36 years to 2025, a rate equivalent to 2.8 [1.9, 4.2] C°/century. This predicted interval is 6.0 [4.0, 8.9] times observed warming since January 2001.
Conclusion
Fifteen years is long enough to verify the predictions from IPCC’s first three Assessment Reports against real-world temperature change measured by the most sophisticated method available – satellites.
The visible discrepancy between wild predictions and harmless reality since January 2001 demonstrates that the major climate models on which governments have relied in setting their mitigation policies are unfit for their purpose. Removing the exaggerations inbuilt into the models eradicates the supposed climate problem.
The real-world evidence shows that global warming mitigation policies are based on predictions now exposed as having been flagrantly and baselessly exaggerated.
All global-warming mitigation policies should be forthwith abandoned and their heavy cost returned at once to taxpayers by way of cuts in energy taxes and charges.
Industries such as coal mining and generation should be fully compensated for the needless loss and damage that ill-considered government policies inflicted on them.
Subsidies for global warming research should be ended and IPCC dissolved.
in a sane world…they would have been laughed out of town years ago
or put in jail for lying and faking data
The flat-earthers who cry about global warming don’t care about actual science. They just want you to submit to their globalist agenda. Pay your carbon tax, plebian!
Iggy –
Pay – and pay, and pay; and pay. And PAY . . . .
Does this help?
I think it clarifies.
Auto
[PS – & Payyyy . . . you plebs.
Me and mine will be fine!]
[PS – Auto is no poet.]
That would be prole, not plebian. Remember, prole, we can always make it worse.
A beautiful theory destroyed by an ugly little fact.:-)
I see one litte problem. Here is original 1990 IPCC prediction:
http://jonova.s3.amazonaws.com/source/ipcc/far/ipcc-far-spm-p-xxii-crop-prediction-graph.gif
Predicted 2001-2016 warming was few times smaller then “spedometer” claims.
By the same token, the high estimate was over 6 degrees Celsius by this graph by 2100 – the graph only shows 4.2. It’s because Lord Monckton derived his values from a source in the text and extrapolated outward.
You’re looking at a 250 year change. From 2000 to 2100 the high estimate looks like its from 1.7 to 6.2, or 4.5 C°. That’s pretty close to the new speedometer graphic.
But 2001-2016 predicted warming rate in 1990 IPCC was 1-2.5°C/century equivalent (i.e. 0.16-0.5°C from 2001 to 2016) – see again IPCC graphs:
And real 2001-2016 warming rate was ~1.5°C/century not 0.4 (as speedometer claims):
http://www.woodfortrees.org/plot/gistemp/from:2001/plot/gistemp/from:2001/trend
Numbers on the speedometer seem to be simply made up.
High estimate due to El Nino
If you look at this: http://www.woodfortrees.org/plot/gistemp/from:2001/plot/gistemp/from:2001/to:2015/trend/plot/gistemp/from:2015/trend
Which splits 2015-2016 into a separate trend, you see that the warming has been gentle.
All that graph says is that the IPCC was not as alarmist in 1990 as they were in 1995…
“Why, sometimes I’ve believed as many as six impossible things before breakfast.” (Alice in Wonderland)
They’ve cut back to 5 impossible things. I guess that’s progress…
And real surface temperature trends (opposite to made up 0.4°C/century ternd) show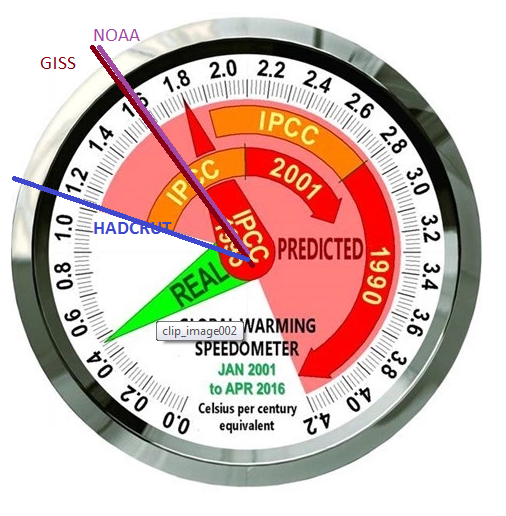
… that warming rate is inside IPCC predicted range.
Hasn’t CO2 risen faster than business as usual?
Short answer: No.
Long answer: The business as usual (BaU) scenario in IPCC AR5 is the RCP 8.5 (w/sm forcing) pathway. IIRC, This level of forcing by their own formulae demands a CO2 growth rate in the 5-8ppm/yr between 2050 and 2100. There is no way at present to realistically start the fuel mineral extraction growth rates to achieve the burning of fossils fuels to get there, assuming we understand the carbon cycle, i.e. the source of the current +2.3 ppm.yr growth rate is correctly understood.
This is why the RCP 8.5 BaU pathway is completely unrealistic, as the fossil fuel growth to get there simply is not attainable under any reasonable set of assumptions.
But the real understanding is connecting adjusted GAST anomalies to human carbon fuel burning as the climate “control knob” is all hocus-pocus, mumbo jumbo pseudo-science anyway.
joelobryan
May 25, 2016 at 3:36 pm
That doesn’t reconcile with NOAA claiming the oceans are eating half of all emissions of CO2.
Nature also eats about half, both cant be true of growth of CO2 in the atmosphere is “human driven”
So someone needs to get their story straight for a start
*half of all man made emissions
Well, oceans are net eating less than half the amount emitted by humans. Atmospheric CO2 grows at speed which is more than half the amount emitted from fossils.
It looks like the ‘Best Estimate’ was chosen for the Speed Trap
Des,
The “speedometer” is showing increases from Jan 2001- April 2016, and determining how “on track” the predicted temperature increases are…if at all. The “speedometer” shows actual temp measurements vs temperature predictions between 2001 and 2016 in “per century equivalents”.
The graph you posted, does indeed show a predicted rise in temps from 1990-2016 of “near-linear global warming of 1.0 [0.7, 1.5] C° over the 36 years to 2025, a rate equivalent to 2.8 [1.9, 4.2] C°/century. This predicted interval is 6.0 [4.0, 8.9] times observed warming since January 2001.” Which is exactly what the “observed reality” portion of Monckton’s statement claims.
So what “one little problem” do you see that I don’t?
@Aphan
The first problem is 2001-2016 predicted warming wasn’t 2.8-4.2°C/century equivalent, as speedometer claims, but more or less 1-2.5°C/century equivalent (i.e. 0.16-0.5°C from 2001 to 2016),
The second problem is 2001-2100 predicted warming wasn’t 2.8-4.2°C but more or less 2-4.5°C
The third prolem is that as of 2016 we are about 1.1°C above XX century average, which is INSIDE the predicted warming range.
http://www.ncdc.noaa.gov/sotc/service/global/glob/201601-201604.gif
So DES according to your thesis, the more wild the predicted claim is (2-4.5) the more accurate it is. (not 2.8-4.2).
So 1.0-10 would be an even better prediction.
Now I get it.
G
Des,
Do you believe NCEI? If you do, then have not critically examined their on-going methodology for GSMT anomaly adjustments. The alternative is you are believer based on faith alone, no examination needed..
According to my thesis numbers on “speedometer” are made up.
1990 IPCC predited 2001-2016 warming rate was was 1-2.5°C/century equivalent (i.e. 0.16-0.5°C from 2001 to 2016) – see again IPCC graphs:
http://jonova.s3.amazonaws.com/source/ipcc/far/ipcc-far-spm-p-xxii-crop-prediction-graph.gif
And 2001-2016 warming rate was ~1.5°C/century not 0.4 (as speedometer claims):
http://www.woodfortrees.org/plot/gistemp/from:2001/plot/gistemp/from:2001/trend
That’s apples to oranges. You need to calculate the “deg C per century equivalent” to compare to the speedometer.
@Andrew D Burnette
“problem is 2001-2016 predicted warming wasn’t 2.8-4.2°C/century equivalent, as speedometer claims, but more or less 1-2.5°C/century equivalent (i.e. 0.16-0.5°C from 2001 to 2016)”
Predictions on the speedometer seem to be made up.
Des is a trip. He goes around spewing made up numbers and thinks he sounds authoritative.
Des, You have your units confused.
Your own graph shows about 1°C in 2000 and about 3°C in 2100 (lowest estimate).
Look again.
3 – 1 = 2°C, about 1.8°C as the speedometer shows.
Your own evidence shows that the speedometer is reasonable and yet still generous to the IPCC.
The lowest estimate is ludicrously pessimistic but still more realistic than the doom laden best estimate.
And let’s not talk of the science fiction comedy of the highest estimate.
@MCourtney
First:
Spedometer shows 2.8-4.2°C in IPCC 1990 which seems to be made up, as graph form 1990 IPCC claims it wiil be 1.8-4.5°C from 2001-2100
Second, more important:
Real warming from 2001-2016 should be compared with predicted 2001-2016 warming, which was 1-2.5°C/century equivalent (i.e. 0.16-0.5°C from 2001 to 2016).
Third:
As of 2016 we are about 1.1°C above XX century average, which is INSIDE the 1990 IPCC predicted warming range.
the “Speedometer” is a rate in degrees per century. Your plot actually looks a little higher than the Speedometer. Your plot looks more like 2.0 to 4.8 degrees per century from the low estimate to the high estimate. The Speedometer says 1.9 to 4.2 degrees per century for the 1990 IPCC report.
The predicted warming in that chart goes from about 2 deg/century to about 4.5 deg/century. Christopher Monckton’s chafrt shows 1.9 to 4.2 deg/century. There is no problem.
Yep Des, after all that, no problem. 🙂 Right?
@Aphan
The problem is 2001-2016 predicted warming wasn’t 2.8-4.2°C/century equivalent, as speedometer claims, but more or less 1-2.5°C/century equivalent (i.e. 0.16-0.5°C from 2001 to 2016),
The prolem is also that as of 2016 we are about 1.1°C above XX century average, which is INSIDE the IPCC 1990 predicted warming range.
@Aphan
And one more problem: 2001-2016 warming rate was ~1.5°C/century not 0.4
http://www.woodfortrees.org/plot/gistemp/from:2001/plot/gistemp/from:2001/trend
So, when you drive a car; the speed limits, e.g. 35kph are incorrect because during your first seconds of driving you were only went a few tenths of a kilometer?
Must be interesting in your car, when you’re driving.
Simply numbers on “speedometer” seem to be made up.
1990 IPCC predited 2001-2016 warming rate was was 1-2.5°C/century equivalent (i.e. 0.16-0.5°C from 2001 to 2016) see again IPCC graph.
And real 2001-2016 warming rate was ~1.5°C/century not 0.4 (as speedometer claims):
http://www.woodfortrees.org/plot/gistemp/from:2001/plot/gistemp/from:2001/trend
A warming trend for highly modified, ergo false, short term temperature series can not be extrapolated into a century warming trend!
Not only are you cherry picking odd points of time, but you are misinterpreting what constitutes a century trend.
The only valid global temperature series are the satellite measurements. The entire thermistor and thermometer network is seriously compromised by extreme untracked error rates, poor handling, bad records management and willful misuse of adjustments.
WTF? Its not I, who picked Jan 2001-Apr 2016 period. “Spedometer’s” author has choosen that period, and made up warming in that period. I’ve only shown that the real warming rate in that period was ~1.5°C/century, which means 0.4 shown on “spedometer” is made up number.
Cursing now Desmond?
You present the numbers and claim it is a ‘warming’ rate per century as that is what the speedometer shows.
You also gloat over your claimed rate when you end the period chosen on an El Nino peak. You are not discussing or presenting a warming trend. You are stating the weather between two periods. And you are using notoriously inaccurate ground temperatures to claim it.
All of the predictions by the IPCC and their devotees, based on overheated models programmed to fail have been falsified.
Get over it dizzy.
@ATheoK
@wallensworth
WTF again? I didn’t choose anything. Spedometer’s author has chosen Jan 2001-Apr 2016 period and made up warming in that period, the real surface warming rate in that period per century equivalent was:
… INSIDE warming rates predicted by IPCC
Des and Desmond don’t appear to understand the difference between temperature, and the rate of change of temperature.
Ghads.
Wake up and smell the coffee gents.
I love the graphic, why is the 1995 marker different? That one confused me. Thanks!
What the difference? Numbers on the “speedometer” are made up anyway.
1990 IPCC predited 2001-2016 warming rate was was 1-2.5°C/century equivalent (i.e. 0.16-0.5°C from 2001 to 2016) – see again IPCC graphs:
http://jonova.s3.amazonaws.com/source/ipcc/far/ipcc-far-spm-p-xxii-crop-prediction-graph.gif
And 2001-2016 warming rate was ~1.5°C/century not 0.4 (as speedometer claims):
http://www.woodfortrees.org/plot/gistemp/from:2001/plot/gistemp/from:2001/trend
All the numbers are made up…period. Quit
Desmond,
As has been pointed out politely but perhaps not clearly by several commenters, you appear to be confusing temperature differences with rates. Your graph is for actual temperature rises, not rates. Several people have already shown your (repeated) claim is incorrect but you appear to be ignoring them. Your credibility is not good if you keep repeating the claim in the face of direct evidence from your own posted graph.
Secondly, your claimed warming rate by reference to woodfortrees is for gistemp. Satellite data RSS and UAH have better coverage and are more reliable and hence are shown in the speedometer. They also agree with balloon sondes. But even if you want to present the gistemp result as the upper limit of actual observations and plotted your 1.5 degC on the speedometer, it would be clear that this highest observation result is still pretty much falling out of the lower limit of all the IPC forecasts. It really doesn’t change the story – IPCC forecasts are much to high and observations clearly show this to the case.
TS
@ThinkingScientist
“Secondly, your claimed warming rate by reference to woodfortrees is for gistemp. Satellite data RSS and UAH have better coverage and are more reliable and hence are shown in the speedometer. ”
1.
Buhahaha. Satelites don’t measure surface temperatures – they measure lower troposphere temperatures (temperature at 5000 meters above sealevel on average)
IPCC predictions presented are surface temperatures peredictions.
2.
UAH warming trend is from 2001 is currently ~1.35°C/century
http://www.woodfortrees.org/plot/uah/from:2001/plot/uah/from:2001/trend
3. Someone has already presented surface temperatures trends:
…which are obviously INSIDE IPCC predicted ranges.
desmond says:
Satelites don’t measure surface temperatures…
…but then he posts satellite temperatures.
And desmond picked UAH, which was changed in v6.0.
Here is the RSS satellite data.
It’s a fact that all the alarming predictions of runaway global warming have been falsified. Global temperatures stopped rising for almost twenty years. Nobody predicted that.
The “dangerous man-made global warming” hoax is busted. There are no measurements of AGW. And not one scary prediction by the alarmist side has ever come true.
Money is the only reason that the global warming scare is still being discussed. There’s no other reason. Take away the money, and the whole bogus scare would disappear overnight.
@dbstealey
And desmond picked UAH, which was changed in v6.0
You are lying. I’ve chosen HADCRUT, GISS and NOAA series, only they are on speedometer presented by me (as there is no use in comparing surface warming rate predicted by IPCC with real warming somewhere else than on the surface)
I’ve just corrected false information from ThinkingScientist, that “RSS and UAH” are shown on “Speedometer”, they aren’t as UAH warming trend from Jan 2001 to Apr 2016 is ~1.35°C/century equivalent
desmond says:
You are lying.
I don’t lie. I just pointed out your cherry-picking.
The graph I linked to above is just as legitimate, but it shows no scary warming.
The “dangerous man-made global warming” hoax is busted.
…And desmond still doesn’t understand the difference between the rate of temperature change and temperature differences!
Could ‘desmond’ be another screen name for ‘benben’? ☺
It’s a lie. I’ve picked HADCRUT, NOAA & GISS, and you lied I’ve picked UAH which I didn’t. I’ve only corrected false info from ThinkingScientist that speedometer shows UAH.
And the spedometer below shows warming rates, not temperature differences:
… so we have your anothre lie.
Actually the models from the surface to the top are simply wrong all the way…
Des, since GISS broke in the month of april the record by adding a whopping +2°C in their chart for belgium (they colored it as +0.5 +1.0 above normal while april 2016 was 1.5°C BELOW normal, i don’t believe GISS anymore.
sorry you have to come with facts. I also see a lot of cold months for station Uccle labeled with “999” which means “no data” while when i look at our Belgian royal Institute of Meteorology i find values for those “missing months”.
sorry since then i don’t believe the GISS data anymore or in short, in that way of data tampering i can make global warming look scary as hell.
so yes GISS broke a heat record in april: they managed to reach the +2°C too hot benchmark which i never expected.
oh yes Des i can imagine your reply: at the royal meteorologic WHO certified institution they can’t read thermometers i suppose?
@David A
The topic is “Speedometer”, whose autor apparently made up real surface warming numbers, and also made up IPCC 1990 warming rate predictions.
The dog ate the warming. But it will all come out in the end.
No dog would ever eat anything that smelled so bad.
Elegant!
All religions have at their core a “submit to our authority or face eternal fires of damnation” dogma.
The Church of Climate Change, with its IPCC Assessment scriptures, is no different in that regard. And the tweaked, hot running temperature response outputs of climate model ensembles to CO2 are taken as Gospel by the believers.
We know Christianity, Islam, Judaism, Hinduism, Buddhism, Wiccan-ism are religions because they call themselves religions. Climatism just doesn’t yet call itself a religion, but by all other measures it is.
Thanks be to Gaia. We must slay the carbon demons.
Now submit and pay-up, lest ye face the wrath of the climate police.
Real science is a philosophic religion, it seems rather obvious to me, but “Climate Changism” is a cult.
Spot on, John! You seem to have a way of “nailing it” with as few syllables as possible. Kudos to you…
Science is no kind of religion. It is the antithesis of religion. Its is based upon doubt, while religion is based upon faith.
Science is a method of investigating reality. Religion is made up stories about the world.
Gabro, drop the anti-theist narrative, if you want to spew anti-religion or religion go somewhere else.
Sun Spot,
Creationists need to go somewhere else. Your anti-scientific fantasies give skeptics a bad name. I’m surprised that our host permits you to comment here. Every anti-scientific comment of yours reinforces the Alarmist argument, which regrettably is true, that skeptics are anti-scientific.
Religion should have no place in discussions of science. You’re free to believe in made up stories about the supernatural, but real science is applying the scientific method to the natural world.
No gods, demons, devils, spirits, genies, giants or intervening saints need apply. If you want to comment on religion, go to a mythology blog.
I should say some skeptics. Obviously not all are, but the Alarmists make hay with those who are creationists.
“Its is based upon doubt, while religion is based upon faith.”
Without faith in all sorts of things, from instruments and records, to the ethics of it’s practitioners and “natural laws”, there is no way to conduct science . . And no reason, if it does not facilitate faith in what is discovered/observed.
“Creationists need to go somewhere else”
Be sure and tell that to Dr Spencer the next time he posts a comment here…
@JohnKnight May 25, 2016 at 6:29 pm: True in a sense, but ‘faith’ is a misleading word. ‘Confidence in the assumption’ that there is a reality that is discoverable with the scientific method, might be a better choice. But longer-winded, to be sure.
/Mr Lynn
@afonzarelli:
Have you ever seen Dr. Spencer post any comments or articles here about creationism? I didn’t think so. I don’t care what someone believes so long as the arguments they make to sway my opinion on any specific subject are backed up with solid reasoning and evidence. As an atheist I have complete respect for Dr. Spencer and find your comment the epitome of spiteful ad hominem.
L. E. Joiner,
Faith means confidence, particularly in things that cannot be directly or immediately observed. Same in theistic religions, as in the “experimental philosophy”, as Mr. Newton called what we here call “science”. His ” ‘Confidence in the assumption’ that there is a reality that is discoverable with the scientific method”, seems to me to stem from his acceptance/belief that we live in a universe that is consistent and orderly, owing to its Creators expressed intent. So far, so good, so to speak ; )
Sorry, I now see you were taking a shot at Gabro and not Dr. Spencer.. my bad.. Still, my point still stands – a sound argument is sound, an unsound one unsound, regardless of who it comes from. I would happily listen to anything Rajendra Pachauri had to say on erotic literature..
Creationists
=========
Is this truly the argument you want to make? That you don’t agree with someone over questions of religion, therefore their scientific views must be incorrect?
Good advice, Joel, they should enlist as the church of climate defenders to get sacrosanct.
Joel: ‘Climatism just doesn’t yet call itself a religion, but by all other measures it is.’
Well…
“For me the protection of Planet Earth, the survival of all species and sustainability of our ecosystems is more than a mission. It is my religion and my dharma.” – RK Pachauri, IPCC Chairman 2002 to 2015.
’nuff said.
There’s a definite shift in Lord M’s position. Previously his articles were superb but in-depth and detail-heavy, but this one is minimalistically surgical in its precision. He’s won the argument and he knows it.
Since warmunists have largely lost the science debate (with their losses ever more apparent as they become more shrill scientifically), the discussion has become almost purely political. In that arena, sound bites and simple images prevail, not long technical exposes. This is just a pretty good simple image. There are others. Geostationary tide gauges showing no SLR acceleration; the discrepancy between sat alt and tide gauges, the closure problem with the latter. Christy’s models versus measured troposphere chart that sent Gavin Schmidt into a tailspin. Tony Heller’s comparisons of published NCEI and GISS changes over time. IPCC disingenuity/ dishonesty on multiple fronts. My personal favorite being AR4 WG2 on species extinctions comparing figure 4.1 and 4.2. A deliberate lie.
What has not been done is to pull together a compendium of robust, simple soundbites and images and then broadly deploy them. The skepitcal movement is simply too scattered, too diverse, and too underfunded for that. Many of my comments and posts here and elsewhere are intended simply to nudge everybody in that direction. My ebooks are intended to give much more detailed underlying firepower to those nudges.
This is just a pretty good simple image.
——————————————-
Indeed – excellent communication tool.
ristvan, and they are excellent, and thank you for your efforts…
“If I were a rich man…”
Mr Istvan is quite right that we should be producing a monthly roundup of the principal lines of scientific evidence to the effect that the usual suspects are wrong about just about everything. I’m very busy for the next couple of weeks, but hope to work with Jo Nova on something suitable thereafter. She has a great gift for making the truth instantly understandable by visual means that are academically defensible.
ha, maybe it seems that way when you only read climate change skeptic websites, but I assure you that in the wider society the ‘warmunists’ most certainly have not yet lost the science debate 🙂
I for one am for instance not at all convinced by this graph. You can’t use what scientists said 15+ years ago to undermine current research. Remake the graph with current data and it might be more interesting. This is merely preaching to the choir 🙂
Keep up the fight good sir!
Ben we can use predictions from the IPCC from 15 years ago because they use the same phoney assumptions today .
“In that arena, sound bites and simple images prevail,”
ben, with the above quote ristvan concurs with the point that you’ve made in your first paragraph… key is his use of the word “prevail” (which means “win”)
too bad that two fatal flaws immediately disqualify this graph for anyone other than the already converted crowd here at WUWT: 1) comparing surface temperature predictions with data for troposphere temperature, and 2) using very out of data predictions.
And the worst here is that there is absolutely no reason why this was done, as all data is available and often discussed here at WUWT. Not helping the skeptic case !
Benben, read my past two ebooks. Then get back. You are entitled to you opinions, but not to your own facts. Those just are. And on facts, you lose. AR4 black box 8.1. AR5 on cloud feedback. The pause. The tropical troposphere hotspot in both AR4 and AR5. And so on.
ristvan,
benben has lots of evidence-free opinions. But his mind is closed to real world facts.
For example, the IPCC’s predictions have always been wrong. That’s one fact. And they aren’t wrong by guessing too high or too low; they’re always guessing that temps will be much higher. But that’s their unspoken remit: to sell AGW. And benben’s buying it.
Since benben is a True Believer, facts don’t matter to him. They just get in the way.
And benben has never answered my oft-repeated question: what would it take to convince him he’s wrong about his belief in CAGW? There’s certainly no evidence for it. So, what would it take to convince benben that the man-made global warming scare is simply a money-driven hoax?
Personally, I don’t think anything can convince benben. His belief is no different than any other religious dogma. It’s faith-based, so facts just confuse him. He is certainly no scientific skeptic.
That’s the difference between skeptics and climate alarmists like benben: alarmists cannot be skeptics. None of them are, for the simple reason that the cognitive dissonance created by skepticism would make their heads explode. So benben is playing it safe…
benben doesn’t believe the satellite data, except for SST.
“using very out of data predictions“. What a delightful Freudian slip!!
The graphic uses satellite measurements up to 2016 – how current do you want to get? The purpose is to compare reality with model predictions. Recent models cannot be tested in this way for obvious reasons.
Mike Jonas, glad to entertain 😉
So lets just break this up:
1) comparing surface temperature predictions with data for troposphere temperature. This is just what Lord M. is doing. I do not understand why you guys can’t just say, ‘oh yeah, he does that, and they are not the same thing so he shouldn’t have done that’.
2) using out of date predictions. I have a feeling people here think that models made today start predicting today. That is not the way this works. You run the model against historical data to see how well it predicts past data, and then use that model to predict possible future trajectories.
Honestly, if you are interested in why the rest of the world has no problem using these models as a guide, just follow a couple of MOOCs and then play around with some of the published models. It’ll be very enlightening.
benben says:
1) comparing surface temperature predictions with data for troposphere temperature.
benben still doesn’t understand that the troposphere starts at the surface.
Benben below is about to complain about C, Monckton’s chart, objecting that it compares tropospheric T. observations to surface warming projections.
Although informed more than once that the models predict more overall warming for the troposphere, and therefore if we use the models tropospheric T vs tropospheric observations, the models are EVEN worse, and for CO2 to be the cause of warming, the troposphere MUST perform according to the models or the CAGW theory regarding global warming and climate sensitivity is simply wrong.
As shown in Peter Thorne 2011 (from the UK Met Office), the lower troposphere temperatures at the level 2LT measured by UAH and RSS is supposed to be increasing at 1.27 times the surface rate.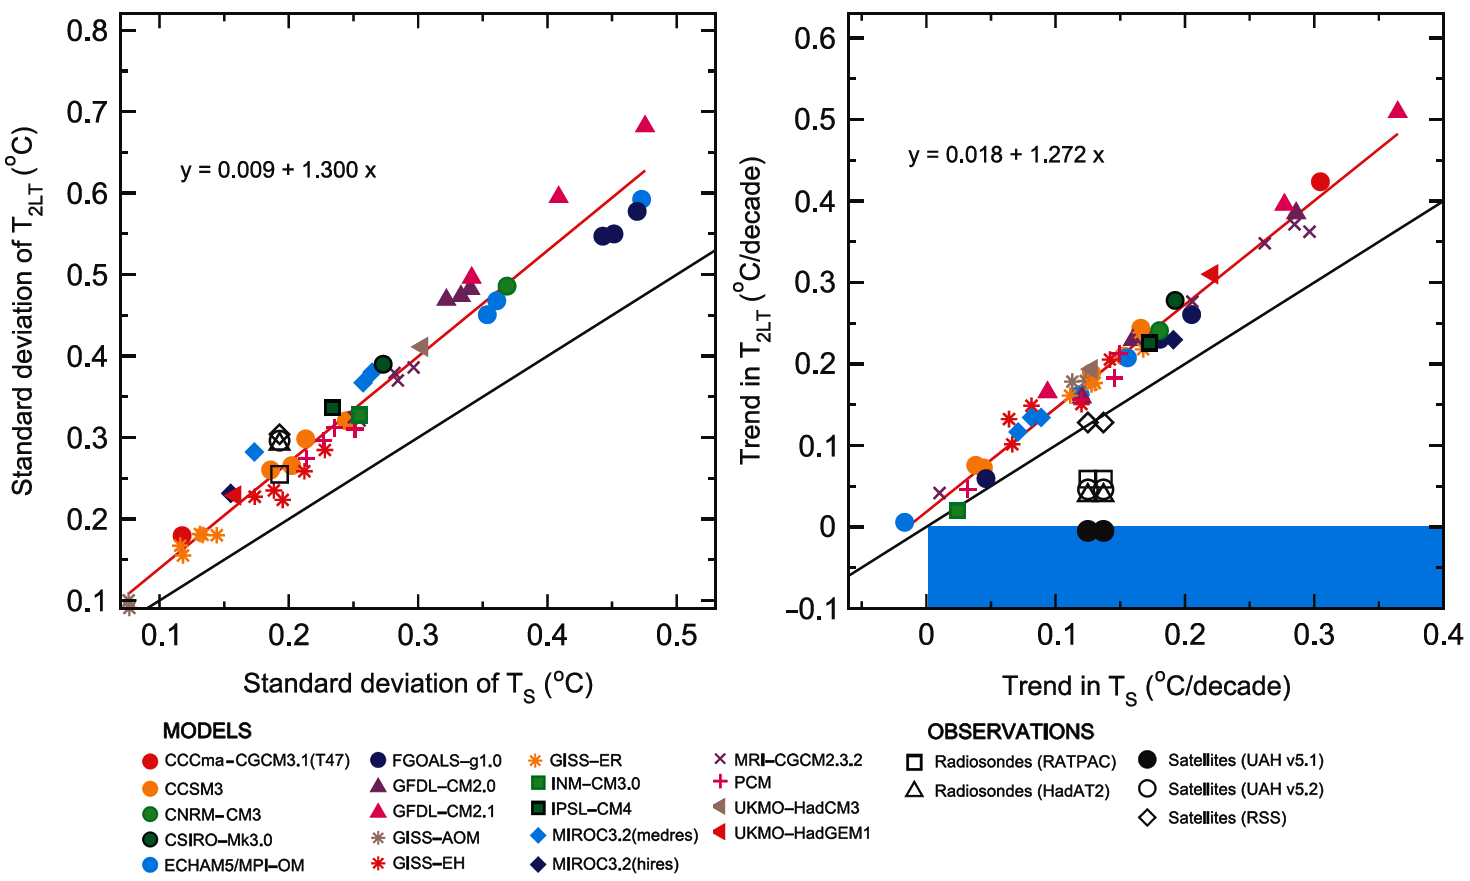
The lower troposphere is supposed to be warming 27.2% “faster” than the surface.
The right chart here.
Paper at:
http://digitalcommons.unl.edu/cgi/viewcontent.cgi?article=1318&context=usdeptcommercepub
so, sure, you COULD discuss about the value of troposphere, which I don’t want to do, and have not done. What I don’t understand about all of this is the following: that picture compares troposphere numbers with surface predictions. It’s just not correct. They’re not the same. You might prefer troposphere figures. So go find troposphere predictions from the models. It’s really that easy. No need to start into a flamewar on who’s right or wrong. Just match the appropriate figures and everyone wins?
And DB’s assertion that the troposphere starts at the surface is just… bizarre? Why doesn’t anyone call him out on his bullshit? I guess facts are only relevant to you guys when they support your political inclinations!
not so much Ben, it’s the certainty with which you loons make claims that draws ire.
Hansen should be committed to a mental institution for the claims he makes, or do you put any stock in the claims of a scientist who chains himself to fences? Or believe that his ideology does not infect his science?
“You can’t use what scientists said 15+ years ago to undermine current research.” is a dishonest way of saying observations have shown the science to be repeatedly lacking
How dare we use the claims of scientists to validate their work, how dare us.
Obviously you let non science things cloud your scientific outlook
Ben your silence in the face of the most ludicrous claims by “warmunists” speaks volumes yet you get all moist over the speedometer.
It’s the lack of integrity in you lot that breeds mistrust, and your silence when junk science is trolled out to support your view.
Hansen 2015 was and is junk yet.. silent you are
Yet any paper that challenges what you “believe” is as attacked purely because of it’s position.
A logical conclusion of repeatedly wrong projections is the science is wrong, you use the “new science” argument to gloss over being repeatably wrong wrong wrong
Your faux logic is transparent. Your attempted linguistic obfuscation transparent.
Wasted your life you have, re learn you must
Moreover in any long running theory of a highly theoretical nature, there is a vested interest in protecting a theory.
Enter patching.
When scientists who have a vested interest (years of career invested) in a theory, when it doesn’t add up, they just make stuff up
Case in point, Dark Matter, and Strange matter, two entirely fictional solutions to problems that challenged theory.
Aerosols were “made up” for years. Even today the issue is highly uncertain, yet well, the aerosols defence was used as if it was an empirical finding.
Heidi Cullen’s oceans eating the pause heat was also just made up to save CAGW
karl’s pause buster, fabricated from massaging data and excluding data
it seems theoretical astrophysics and climate science suffer the same unhealthy conditions, complete dishonesty, attacking anything that may sew doubt and self preservation.
Benben,
Your responses here are like Mr Mosher’s, quite primitive.
If you dont understand what I mean, you might want to read up on that. My ego does not drive “me”, going on what you say and more importantly “how” you say it, there is more than a little primitive response mechanism at work here. :p
Poor benben has been reading too much SkS.
Reference; http://scied.ucar.edu/shortcontent/troposphere-overview
“so, sure, you COULD discuss about the value of troposphere, which I don’t want to do, and have not done. What I don’t understand about all of this is the following: that picture compares troposphere numbers with surface predictions. It’s just not correct. They’re not the same. You might prefer troposphere figures. So go find troposphere predictions from the models. It’s really that easy. No need to start into a flamewar on who’s right or wrong. Just match the appropriate figures and everyone wins?”
^^ is how a human snake sheds it’s skin to avoid being pinned down baahahaha
Everyone is being dragged away from the point here, the overall important factor, thanks to the little coterie of distractors, is that models are wrong, consistently wrong, even after being forced to fudge them closer inline with observations, they are STILL wrong
AGW is only supported by models, and they are wrong.
Some think being wrong for 3 decades is not evidence because “well yeah the science we did yesterday should not be judged by our 3 decades of nonsense” oh yes it should
dbstealey said:
“benben still doesn’t understand that the troposphere starts at the surface.”
Oh, I suspect that he knows that. Either way, that ignores his main point that the satellites measuring the troposphere are at 3.5km altitude. So, once again, why use temperature data gathered at the surface and compare it to data gathered at 3.5km?
Chris says:
Oh, I suspect that he knows that.
But he didn’t.
If you re-read the half dozen comments right above yours, they say it better than I could.
Eventually, benben grudgingly admitted he was wrong:
Ya’ll are right, the troposphere is defined as going from the ground up. Which doesn’t change the fact… &etc.
It’s obvious that benben doesn’t possess an understanding of basic science. That’s what’s so frustrating: he’s just another know-nothing eco-alarmist who constantly parrots the repeatedly deconstructed “dangerous AGW” narrative and talking points. So skeptics feel the need to set the record straight, in case new readers might think that all commenters know what they’re talking about on this “Best Science” site.
Some do, some don’t. Benben doesn’t.
benben
‘2) using very out of data predictions.’
That ‘data’ did it’s shrill alarmistery to you a good 15 years before;
now everybody has to forget about and leave decarbonizers as good ones.
Got it!
Ya’ll are right, the troposphere is defined as going from the ground up. Which doesn’t change the fact that the measurements made by satellites are certainly NOT at ground level.
Benben, you have not done enough to correct this statement or define where it is YOU believed the Troposhpere to be.
“And DB’s assertion that the troposphere starts at the surface is just… bizarre? Why doesn’t anyone call him out on his bullshit? I guess facts are only relevant to you guys when they support your political inclinations!”
What is indeed bizarre is the notion that the troposphere “starts” at the surface is relevant. When UAH used to publish their actual average LT temperatures, they were about -30°C. The surface is different. You can’t use the whole troposphere average for the surface, just because it “starts” there.
benben says:
DB’s assertion that the troposphere starts at the surface is just… bizarre? Why doesn’t anyone call him out on his bullshit? I guess facts are only relevant to you guys when they support your political inclinations!
From The Science Dictionary:
http://thesciencedictionary.org/troposphere
As I keep pointing out, benben is wrong about numerous science facts.
dbstealey-
Chris’s comment was even more hilarious than benben’s insistence that the troposphere doesn’t start at the surface of the planet.
Chris-” Oh, I suspect that he knows that. Either way, that ignores his main point that the satellites measuring the troposphere are at 3.5km altitude. So, once again, why use temperature data gathered at the surface and compare it to data gathered at 3.5km?”
Chris doesn’t seem to be aware that satellites don’t measure temperature gathered at the surface OR at 3.5km! Satellites do not measure temperature. Period.
As far as the height of the troposphere vs where satellites orbit the earth-neither Chris nor benben seem to know the following:
“The troposphere extends upward to about 10 km (6.2 miles or about 33,000 feet) above sea level. The height of the top of the troposphere varies with latitude (it is lowest over the poles and highest at the equator) and by season (it is lower in winter and higher in summer). It can be as high as 20 km (12 miles or 65,000 feet) near the equator, and as low as 7 km (4 miles or 23,000 feet) over the poles in winter.”
http://scied.ucar.edu/shortcontent/troposphere-overview
As anyone who has cruised in a commercial airplane knows, it’s a darn good thing that satellites do not share the same airspace as airplanes do. That would truly suck.
Satellites orbit the Earth in either the exosphere or the thermosphere, which are WAY higher than 3.5km.
http://science.opposingviews.com/layer-earths-atmosphere-artificial-satellites-orbit-earth-2287.html
The thermosphere starts at around 85 km above Earth’s surface and extends to 640 km, and the exosphere starts there and goes on for another 10,000 kms.
Aphan,
True, they’re both in over their heads here.
You certainly cannot be accused of cherry picking your dates! The first three months of 2001 had La Nina numbers which began all the way back to July 1998. As well, up to April 2016, we were still into high El Nino numbers. Had you ended four months earlier in December 2015, the actual slope would have been negative.
From:
http://moyhu.blogspot.ca/p/temperature-trend-viewer.html
RSS
Temperature Anomaly trend
Jan 2001 to Dec 2015
Rate: -0.116°C/Century;
UAH
Temperature Anomaly trend
Jan 2001 to Dec 2015
Rate: 0.112°C/Century;
Werner, it should be very interesting to see where the conversation goes from here given that la nina and the solar min are both on there way. Will this agw thing be over in a few years or will agw see renewed life in due time? This is perhaps the most excitement that we’ve seen in the climate change debate in a quite some time (so get your popcorn ready…)
It might be over in November if Trump gets in. See:
http://www.reuters.com/article/us-usa-election-idUSKCN0Y41PM
“Among those he has asked for help is U.S. Republican Representative Kevin Cramer of North Dakota, one of the country’s most ardent oil and gas drilling advocates and climate change skeptics.”
Not to mention AMO also turning negative.
Yes, Werner, i should have said that la nina and the solar min and “THE DONALD” are all on their way(!)
If President Trump does nothing else but stop and dismantle the global warming scam I will consider his Presidency a success.
ristvan, yes the AMO, although it is having a little pause in its downturn at the moment, and historically it is due for that as well.
I would register and vote for Trump just to see CAGW go down in flames, which would be an appropriate way for it to go.
Those leading the charge on CAGW should be in jail. Their manipulation, lies and damage was and is willful. They have caused deliberate harm to economies everywhere, to people everywhere, and the deaths of many thousands by making electricity and heating too expensive for the poor. They knew what they were doing at the onset. It’s mass manslaughter at the very least. It’s also treason to plan the destruction of your own country and civilization.
We must not let them go free with a mere slap on the wrist. Civilization cannot afford to let them walk away laughing. We either deal with this, or they will be back again and again until we do. What they have done is intended.
A.D. Everard.
+1
Modern progressism is a drive toward accumulation of political power in a small ruling class. That ruling class sees itself as knowing what is best for everyone and everything be it man, beast, or environment. It is willing to employ whatever means necessary to acquire the power to rule without question the world’s advanced technological societies, that is its end, But to call it an i”end” is also like an trying to measure an asymptote to infinity, i.e. there is no limiting principle, no “enough” the Progressivism movement.
Modern technological societies run and live on carbon. There is no viable transportation energy source for modern jets, ocean transport, or long haul surface freight and raw materials from fields to plants to grocery stores. Control carbon, and you control the society. That is the basis of today’s Climatism.
Progressive politicians have seized upon the idea that making the depleted output of carbon energy a demon that will destroy the earth as their path, their means, to ever more power. They employ terms like “carbon pollution” and INDC’s, and propose selling and trading carbon indulgences for themselves, putting together climate welfare payments to the 3rd World to go along with the scheme. Climatism is the means to the Progressive’s end.
Can I copy your entire comment and repost it for my friends to read? It seems like a pretty cogent summary to me. Thanks.
Yes, and demonization is the classic leftist technique for enlisting armies of ‘activists’ (Lenin’s ‘useful idiots’) to wave the flag and burn the infidel ‘demons’ at the stake. So now we have ‘activists’ for ‘climate justice’ marching with the aging Young Socialists and the new ‘Black Lives Matter’ kids shouting ‘social justice’ slogans. Meanwhile, George Soros is busy pouring money into these phony ‘movements’ and secretly buying up coal stocks, ruined by ideologues in the Obama administration.
/Mr Lynn
The abuse of the language pains me almost as much as the abuse of science. The one thing that “Progressive”s absolutely are not is … progressive. Regressive, yes. Repressive, yes. Even digressive. But progressive? No.
I don’t think they intend to stop at controlling carbon. It is about controlling energy and the financial structures that will be erected to make that possible. There is nothing like being able to tax a vast stream of money with a handling fee.
Consider who would be be against the elimination of separate currencies in the world save one so that there was no reason for banks to charge a conversion fee or speculate on forward cover and against central banks. Separate currencies are an enormous tax on the global economy and everyone pays the banks. Think of them being able to tax every energy transfer and it’s ‘penalties’.
Tax the movement of wealth and energy. Who would be most in favour? Banks. So watch that space, and vote for a single gold-backed currency. Take the economy back.
Jim A.,
Sure. It is just a summary of thoughts about Progressivism I have learned and studied over the last 6 years. But there are some glaring typos in what I wrote that cannot fix.
The “no limiting principle” of Progressivism is an old realization and written about by several economists and social philosophers way smarter on the subject than me.
William Voefeli is probably the most cogent US author on this subject.
http://www.americanthinker.com/articles/2010/08/never_enough.html
Crispin in wherever the hell you are today,
Like I said, “no limiting principle” means no limits. of course they stop at carbon. Tey stop ever, as there will always some more wealth and power to extract, some basic human freedom to squelch, some free thought somewhere to re-program.
Crap, too many typos. Of course they (progressives) will never stop at just carbon energy sources.
joelobryan – your post sums up the European Union perfectly so much kudos to you for that. Their ruling class doesn’t want to bother with tedious things like elections and mandates, the just KNOW BEST. It is a profoundly depressing thought that the UK is likely to vote to remain in it, thus condemning us to complete integration into a bureaucratic whose rules we cannot change and which can (and will) be implemented using lethal force to back them up.
Crispin
A single currency can only work when you have a single economy. Otherwise currency fluctuations are a measure of the relative performance of one economy against another. Imposing a single currency on multiple economies is what broke Greece (for example). I wonder if they feel they’ve progressed under “progressive” policies?
A.D.
Again, thanks.
I agree.
Difficult, though; so many of the malefactors are ‘Connected’.
How can we stop friends giving them shelter and food – which I would limit to the summer months.
Still, I will dream on.
Consider suitable retribution, marginally short of the death penalty, a punishment that is ‘Cruel’ (possibly) but not ‘Unusual’ [Given the many deaths you, A.D., rightly highlight, past and present and future, due to paying huge amounts for intermittent bird-chopper and bird-fryer ‘power’].
Dreaming on – Auto
All meant – of course – with minimum harm to even a hair on their delightful heads and so forth.
Mods – where do I put the /SARC tag?
I keep saying fraudulent publicly funded science should carry a legal penalty.
Nice! The pause is real and the models have failed.
This speedometer needs space for negative warming rates!
There is that exaggerated top speed reading of “maker’s name”.
Doesn’t look like there is a zero stop, so “negative maker’s name” looks possible
Well done sir, the speedometer is about to break. They have a full court press going on and we are pushing back even harder in the name of real science and integrity.
Here’s my latest at The Daily Bail.
http://dailybail.com/home/climate-alarmist-admits-the-real-motive-behind-global-warmin.html
If we’re not speeding, why are we still being ticketed?
Is there any valid reason why we should use 2001 as the start point?
“IPCC (2001), on page 8, predicted that in the 36 years 1990-2025 the world would warm by 0.75 [0.4, 1.1] C° equivalent to 2.1 [1.1, 3.1] C°/century. ”
It would seem far more sensible to use 1990 as the start date. We would then have a good part of the predicted range covered.
Data here http://vortex.nsstc.uah.edu/data/msu/v6.0beta/tlt/uahncdc_lt_6.0beta5.txt
UAH for 1990 was about 0C anomaly. 2016 so far is about 0.65C So a rise of about 0.65C in 26 years, or 2.5C per century. Looks like the IPCC slightly underestimated.
“So a rise of about 0.65C in 26 years, or 2.5C per century …”.
==============================
The average of UAH & RSS from 1990 is less than half that ~1.1 /cent, which happens to be about the rate since ~1950.
well seaice, since all cherries are open let us start at the peak of 1998 warming and end say one year from now.
Actually I will take 1979 at the end of the ice age scare, and generously go back to 1945 with an assumed no change in troposphere from there. Now we have .4 degrees warming in 70 years, at the peak of a El Nino.
Likely to drop a bit from here.
Come on Chris, add their farcical very latest rubbish for “business as usual” :
2.6°C to 4.8°C (RCP8.5)
I am aware that the post used the trend for 2001 to 2016 whereas I have used the end points. Nevertheless the point remains that using 2001 as a start date is arbitrary. It would be interesting to see the speedometers for 1990-2016 and 1995-2016 to see how robust this analysis is. As well as an update on the pause, which we do not seem to have seen recently.
I was just about to make a similar point.
IPCC 2001 states warming of between 0.4 and 1.1 C between 1990 and 2025. Using Monckton’s preferred temperature records of RSS 3.3 and UAH beta 6, we have a warming rate of 1.17 C / Century from 1990 to present. That’s equivalent to 0.41C over a 35 year period, just within the IPCC projection.
Using any other data set, terrestrial or satellite would show more warming.
“The temperature rises over the former Imperial Russia/Soviet Union form one of the most puzzling features of the entire temperature record. Figure 2 shows that the major sources of temperature increase over the period 1901 to 1996 was the whole of the records for Russia/Siberia. Figure 3, shows that the major source of temperature rise from 1976 to 1998 was Northern and Central Siberia.”
http://www.john-daly.com/graytemp/surftemp.htm
Seems to be a question over their reliability too– Due to the erraticness of the numbers, the fact the record may have been kept sometimes by prisoners. Also the difficult conditions of the Soviet breakup, etc
Penelope: from what I have read, all the Siberia temperature records created under the USSR regime should be eliminated from the data. It is well-known that the allocation of coal for heating was based on the temperature reports. Those in Siberia reported lower temperatures than actual simply to get a larger coal allocation. When the USSR went away, and coal was freely traded, the temperatures were reported accurately, producing ‘instant warming’.
No sea ice, not arbitrary but taking Trenbeth’s 15 year scenario.
I think El Nino might have busted the pause, as expected. The pause should return with La Nina, also as expected. I believe it’s called weather.
Sorry off-topic. No place to put it.
“The basin in Xinjiang, China is approximately the size of Venezuela and is home to the largest desert in the country.
“While the water in the basin is too salty to drink, it’s believed the reservoir may be helping to slow climate change. Still, there is a downside to the discovery.
“Professor and lead author in the study Li Yan told the South China Morning Post that if all the carbon in the reserve was released into the atmosphere it could be catastrophic.
“It’s like a can of coke. If it is opened all the greenhouse gas will escape into the atmosphere,” Li told the Post.
“This is a terrifying amount of water. Our estimate is a conservative figure — the actual amount could be larger.”
“Li had been searching for missing carbon around the Tarim basin, a phenomenon that has eluded researchers for years. It was those efforts that led them to a giant aquafier housing the water.
“Calculations suggest there could be as much as a trillion tonnes of missing carbon on the planet, leading researchers to speculate their could be more water reserves hidden under other deserts around the planet.”
http://www.theweathernetwork.com/news/articles/massive-ocean-found-under-chinese-desert/57335/
Yesss, Li had been searching for misssing carbon. Dum ta dum dum
sposed to be bigger than the combined Great Lakes.
Source: Discovery | South China Post
“Calculations suggest there could be as much as a trillion tonnes of missing carbon on the planet, leading researchers to speculate their could be more water reserves hidden under other deserts around the planet.”
Last I heard, there’s about 36,000 gigatons of carbon in the oceans . . and I saw a study last year that concluded there’s about twice as much water on this planet below the ground as above . . so, I don’t see what’s “terrifying” about this particular report . .
Agreed. It is not alarming. There are a trillion tons of coal under Mongolia. There I perhaps half that under Tajikistan, not sure. Kazakhstan? Could be huge as well. There is an enormous amount of oil under Tajikistan. I was talking to a petrogeologist there. Haiti and Cuba are floating on oil. What’s a bit of CO2 in a salty underground aquifer? What are they going to do – irrigate with it??
Dark carbon!
Don’t climate models generally look temperatures on sea level while the data for the ‘real’ arrow is based on troposphere data? These two are quite different so it’s disingenuous to compare them so directly.
ben, the claim that christy makes is that the lower trop is where all the action is with agw, therefor it would be the perfect place to look for it…
Perhaps, but that’s irrelevant if you want to make a fair comparison. The models give temp ranges for sea level. You should compare apples to apples, do you not agree?
I’m not looking to start a debate on what measurement is better, just pointing out that it’s wrong to equatethe two like this, and therefore this comparison is disingenuous. Which is weird because the author knows that this is the case and does it anyway. Doesn’t make the skeptical case any stronger to the not-already skeptical crowd 😉
“You should compare apples to apples, do you not agree?”
Apples show up in trees before they appear on the ground, so you picked the wrong cherry, it seems to me, Benben ; )
haha 🙂
benben, keep digging sir…
https://wattsupwiththat.com/2016/05/25/introducing-the-global-warming-speedometer/comment-page-1/#comment-2223422
BTW, Bob Tisdale has been using the surface warming prediction for the models as well. He indicated in his next detailed post he will show the Troposphere observations vs. the model troposphere predictions. Benben, perhaps this will relive you of your CAGW concerns, as these models, critical to CAGW alarmism, are even further off.
So if bob tisdale has the appropriate data, why not just make make the appropriate figures? That’s all I was pointing out. No need to get into a discussion on who’s right or wrong about AGW.
Repeating what I said above:
that picture compares troposphere numbers with surface predictions. It’s just not correct. They’re not the same. You might prefer troposphere figures. So go find troposphere predictions from the models. It’s really that easy. No need to start into a flamewar on who’s right or wrong. Just match the appropriate figures and everyone wins?
Pointing out to you that the numbers, as bad as they are compared to the observations, are actually 27.2% worse, as Bill Illis demonstrates here https://wattsupwiththat.com/2016/05/25/introducing-the-global-warming-speedometer/comment-page-1/#comment-2223434 makes not a dent in your cherry picked skepticism.
benben says once shown this uncomfortable fact, “I do not want to discuss if CAGW is right or not” or words to that affect. At this point Benben I have no interest in discussing what you wish to discus, as you cannot even acknowledge that it is worse for the models then the GW speedometer shows.
Well david A fee free not to respond to these posts then 😉
I will point out what I choose, including your ability to miss the point; the models are worse then the speedometer shows.
The confusion about the rate of warming in climate science is exposed very clearly here. thank you.
would just like to add that AGW is not a theory that it is warming but a theory that warming is caused by fossil fuel emissions and without that causal linkage between warming and fossil fuel emissions there can be no AGW.
In climate science that linkage is shown as a correlation between cumulative emissions and cumulative warming. this correlation is spurious.thus, there is no empirical evidence for AGW.
http://papers.ssrn.com/sol3/papers.cfm?abstract_id=2725743
seaice1 says:
Is there any valid reason why we should use 2001 as the start point?
Instead, seaice wants to use 1990.
Well then, let’s go back to the 1980’s.
ARRGH. Can’t use that! It shows a clear step change, which debunks the notion that rising CO2 is the cause of global warming.
And if a longer time frame is better, why not go back to 1900?
Oops. I see why not: there was global cooling from the 1940’s through the 1970’s.
Or, we could go back to the 1800’s.
But that’s no good either, because it shows that global temperatures aren’t accelerating upward.
Even going back thousands of years puts things in a perspective that destroys the man-made global warming scare (click in image to embiggen):
http://www.climate4you.com/images/SummitAndCulture.gif
What’s an alarmist to do? ☹
” What’s an alarmist to do 🙁 ”
Stealy, i’m sure phil. will figure out something…
Thanks for the segue dbstealey!
One small quibble Lord Monckton.
Your, (my apologies for making it sound personal), speedometer does not take into account the fickleness of Mother nature.
Especially as dbstealey points out, sometimes the warming rate is cooling.
I know that car speedometers are unable to distinguish driving forwards versus driving backwards. Cars driven backwards have their mileage slowly decrease, but the reverse speed is still shown as positive. A physical representation of absolute numbers in play.
For teen age amusement, I once reduced my Triumph herald’s mileage by driving backwards for a few miles…
While the ice mass of the world might increase when the world cools, that isn’t really equivalent to reversing mileage.
Perhaps the new warming meter could be called a Monckton thermal inertia meter?
ATheoK, I would guess that you were a teenager quite some time ago. Did you ever see Ferris Bueller’s Day Off? Actually, bad example, the movie got it wrong… the mechanical odometer in that car SHOULD have decremented just like your Triumph, but didn’t. Modern cars (starting around the time that the Global Cooling scare was coming to an end), however, have electronic odometers which aren’t fooled by which direction you are going ([whistle_innocently] or whether you are using a drill to make your 300K beater sell like a 20K original mile gem on Craig’s List [/whistle_innocently]). Modern cars thus can’t be manipulated fraudulently and can be completely trusted [whistle_innocently] kick OBD2 and CAN programmers under the rolling toolbox while buyer isn’t looking [/whistle_innocently].
That said, I once drove in a kit car (completely mechanical) that, when in reverse, looked like it was trying to break the speedometer needle by going negative. All depends on if the appropriate cables are attached before or after the gearbox.
Dbstealey – Beautifully done, and quite right too. 🙂
It is perfectly clear to me what needs to be done. Mathews 1976 and NAS 1975 show the 1940-1975 decline to be as large as the rise from 1900 to 1940. 1975 brought us right back to where we were in 1900.
The all important metric is the climate sensitivity to CO2, or so we were told.
The metrics ECS and TCR should be calculated using the time period 1940-1975.
That would fix things.
After all, “You need to pick cherries to make a cherry pie.”
TonyL May 25, 2016 at 6:52 pm wrote: “It is perfectly clear to me what needs to be done. Mathews 1976 and NAS 1975 show the 1940-1975 decline to be as large as the rise from 1900 to 1940. 1975 brought us right back to where we were in 1900.
The all important metric is the climate sensitivity to CO2, or so we were told.
The metrics ECS and TCR should be calculated using the time period 1940-1975.
That would fix things.”
That’s right. We should definitely be using the hottest part of the record, the 1930’s as our starting point. We have been in a longterm temperature decline since the 1930’s, that has not been broken yet, even considering the high temperature of Feb. 2016.
Using the 1930’s high point as our starting point puts the climate picture in the proper perspective: A longterm temperature downtrend, not broken as of today’s date.
Any other starting point is bogus, if you want the real picture. Unless you go even further back in time. 🙂
dbstealey. I know this will be over your head, but somebody might understand, so here goes anyway. Nice graph, but Greenland is not the world. Do you think the temperature is now -31C?
If you pick different start years and get the same result it shows robustness and defends against cherry picking. There must be some reason for selecting a start year. There is no valid justification given for picking 2001. An interesting test is to try different start dates and see if you arrive at a different answer. If you do get very different answers from dates that are quite close together it indicates that the signal is too noisy to draw conclusions over the time period you have selected. If you still pick the date that gives you the result you prefer you are cherry picking.
Back to the 1980’s is fine, as the step change you mention is totally irrelevant and spurious. I cannot imagine where you get the idea that it “debunks the notion that rising CO2 is the cause of global warming.” Please, calculate from the 1980s.
There are statistical tests to detect significant changes in trend.
Christopher Monckton,
You have steadily become more impactful!
Nice graphic.
John
“observed warming since January 2001”
I thought I read that warming had stopped?
All those cited predictions were for surface warming. Lord M as usual compares them with satellite, not surface.
In fact, the trends since 2001 were:
GISS 1.609°C/Cen
HADCRUT 1.136°C/Cen
NOAA 1.620°C/Cen
All in the pink range of predictions.
Nick,
According to the hypothesis of man-made global warming, the troposphere should warm more and more rapidly than the surface. That has not happened. Thus, yet again the conjecture of AGW is falsified.
Not to mention that the surface “data” set books have been cooked to a crisp by crooked bureaucrats and academics with vested interest in falsifying (in the conventional sense of the term) the “record”.
Touché.
that doesn’t change the fact that this graph compares predictions for surface temperature with troposphere data. Clearly a disingenuous comparison.
And before the surface.
Ben,
Seems you miss the point. The “surface” record (a misnomer, as land “data” are above the surface and water “data” below it from various depths) cannot, according to the unsupported AGW assertion, be warmer than the air above it, where GHGs work their alleged magic. Thus, if predictions (or “projections”) for “surface” warming from GCMs are below the actual observations of the troposphere, the models have to be wrong.
QED.
And I might add, the corrupt “surface data” sets also must be wrong.
Gabro,
benben still doesn’t understand that the troposphere is around benben’s ears — the same height as a Surface Station. It begins at one bar and goes up from there.
“the troposphere should warm “
You need to document that. I think people mix up with the tropical hotspot, which doesn’t imply faster warming overall.
But in any case, that’s not a matter for the predictions. They predicted certain rates of surface warming, and that is what they got. The troposphere warming is observed to be slower, and if that’s a problem, then so be it. They still predicted surface correctly.
In fact UAH V5.6 shows a trend of 1.268°C/Cen since 2001. That is also well within the pink region. Now this is the version they still supply to NOAA, and v6, still in beta, first came out last year. So a likely explanation for the discrepancy is that the satellite measures are just inaccurate. RSS now gives its V3.3 results with a caution. It’s a stretch to claim this shaky data proves the surface measures wrong.
The surface record of years since since 2001 is very good, and very little affected by adjustments.
Gabro,
“Thus, if predictions (or “projections”) for “surface” warming from GCMs are below the actual observations of the troposphere, the models have to be wrong.”
Again, no. The models predicted the surface warming observed. If observed surface warming is different from observed troposphere, that is a matter to be explained. It’s not the fault of GCMs that the observations are different.
The models haven’t predicted a thing, Nick. Their uncertainty bars are too large to distinguish among their projections, their projections are therefore not falsifiable against observations and so are not predictions at all. GCM air temperature projections are without any discernible physical meaning.
Pat Frank,
“The models haven’t predicted a thing, Nick.”
You should take that up woth Lord M. His speedo is based on model predictions.
index?
What do you think is the physical meaning of a lower troposphere index? You have a pointlessly pessimistic view. Models can’t predict, we can’t measure. What’s a Lord to write about?
Ha, nice discussion. But I find it fairly puzzling that people here are not capable of admitting that surface =! troposphere.
As Nick said, what the value of the different datasets is, is a different discussion. We are only – and correctly – pointing out that it’s wrong to put the two together and pretend they are comparable.
Pat Frank, hello! I’ve had some discussions with my climate modelling friends here at Yale about this and your view is just not correct. Models have plenty to say about the central question at hand (is it time to start closing those coal fired power plants or not?). They are not as accurate as you would want in experimental physics, but more than enough for the policy arena.
Pat, have you ever looked at the accuracy of economic models, used for policy making every day? You’d have a heart attack 😉
Nick, the overall Troposphere is expected, per CAGW theory to warm about 20 percent faster then the surface. Not just the tropical troposphere, another model failure.
David A
“Nick, the overall Troposphere is expected, per CAGW theory to warm about 20 percent faster then the surface.”
People say this stuff, but never give citations. OK, maybe someone expected that, and maybe they were wrong. Who were they?
But whether they were wrong depends on what they said. Things don’t move in lockstep. Any such expectation would have had timeframes etc.
And it doesn’t change the issue. The IPCC predicted GMST and were right. If they had predicted 0.47 C/Cen they would have been wrong, by a factor of about three. The supposed theory about trop > surface wouldn’t change that.
‘For global observations since the late 1950s, the most recent versions of all available data sets show that the troposphere has warmed at a slightly greater rate than the surface, while the stratosphere has cooled markedly since 1979. This is in accord with physical expectations and most model results, which demonstrate the role of increasing greenhouse gases in tropospheric warming and stratospheric cooling; ozone depletion also contributes substantially to stratospheric cooling. ‘
https://www.ipcc.ch/publications_and_data/ar4/wg1/en/faq-3-1.html
lee,
“For global observations since the late 1950s, the most recent versions of all available data sets show that the troposphere has warmed at a slightly greater rate than the surface”
Yes, that is an observation, as it stood in 2006. There’s no claim there that it must always be so, for any period.
In any case, if UAH V6.0 and RSS V3.3 (but not UAH V5.6 and probably RSS V4) are to be believed, the corresponding observation in 2001-2016 is that surface rose faster. The IPCC predicted GMST and got it right. The possibility that TLT did something different doesn’t make that prediction wrong.
The pause in the Troposphere is currently over 20 years. Yes, the Troposphere is suppose to warm the most at the level it begins to intercept out going radiation, which is why the stratosphere above it is suppose to cool. I think Dr. Spencer ran some of this against the models and the warming rate was 300% off.
Nick, you missed “This is in accord with physical expectations and most model results”.
lee,
“Nick, you missed”
No, I didn’t. To say that observed TLT warming from 1950-2007 is in accord with physical expectations and model results is not to expound a general theory that for all future periods TLT warming will exceed surface.
Gabro is right on the money. Why should we be using “cooked books” to try to figure out the climate?
Nick, science is a bitch. She speaks quite clearly about the inadequacy of models and the irresolution of the historical surface temperature measurements. There’s no way around biting the bullet, Nick.
benben, your climate modeling friends at Yale are wrong. I have yet to encounter a climate modeler who knows the first thing about physical error analysis. And I mean freshman-level first things. Climate models are predictively useless. They shouldn’t be within miles of any policy decision.
By the way, you’ve typically claimed to be stationed in Europe. What are you doing “here at Yale“? Not a European after all?
Ha hey, you know how the academic world works. Just started a postdoc at yale but going back and forth occasionally.
“I thought I read that warming had stopped?”
Nick, presumably Lord Monckton posted this in leiu of his usual “pause posts”… those posts will surely be back later this year when nina arrives
If you look at an SST chart (I prefer the one at Unisys Weather, you will find that the La Niña is well on its way.
MoB’s laughable weak-tea follow-on to his cherry-picked troposphere pause distortions …
“All global-warming mitigation policies should be forthwith abandoned and their heavy cost returned at once to taxpayers by way of cuts in energy taxes and charges.”
===========
Lets not get crazy, that money has been spent/used.
I mean, we’re already running on money borrowed against any future children.
OK, here it is. The speedometer with the actual data that they were predicting.
So if that is what they predicted why all the references to 4 degree. Paris agreement is supposed to restrict us to under 2 degree, well that is done according to those predictions. Now you are going to introduce an pre existing offset now aren’t you, it’s your only way out?
The predictions are as cited by Load M and are in °/Century. They are, if cited correctly, for that period 2001-2016. The thing about AGW is that it continues. 3 C/Cen gets us to 4° in 133 years.
Nick, the MEASUREMENTS, cited by Lord M, are compared to IPCC “predictions” made in the past in degrees C/Century. The measurement “mean” from 2001-2016 are, if cited correctly, “was determined and found equivalent to 0.47 C°/century.”
The THING about the current “global warming” is that, if it CONTINUES at it’s current rate, 0.47C/Cen gets us to 0.63C in 133 years. Who does your math for you?
Does it continue? A doubling of co2 gets us to 560 ppm. The next doubling of co2 gets us to 1120 ppm. So for all practical purposes a doubling of co2 is pretty much it for agw. (where am i going wrong here?)…
“Nick, the MEASUREMENTS, cited by Lord M, are compared to IPCC “predictions” “
Well, he compared measurements of something with poredictions of something. But they aren’t at all the same. IPCC was predicting GMST, and it is perfectly possible to compare them with measurements of GMST. That’s what I did, and they are quite good. Lord M chooses to compare them with dubious measures from somewhere else. That is pointless.
Nick Stokes says:
The thing about AGW is that it continues. 3 C/Cen gets us to 4° in 133 years.
—————————-
Are you serious?
Yes, starting in a La Nina, ending in a strong El Nino, and ignoring the failure of the Troposphere to warm per CAGW theory. See you again in 16 months to one year, “He’s back” (Meaning the pause of course.)
Nick– Isn’t it funny how adding heat “adjustments” to GISS, HADCRUT4 and NOAA datasets through: in-filling, removing high-altitude/rural weather stations, over-weighting Arctic temp anomalies, weather stations near hot airports, adding 0.15C to ocean temps (KARL2015), adjustments for changing thermometer equipment, etc., makes the line go up?
It’s also amusing the CAGW hypothesis projected lower troposphere global temps (what satellites measure) should be warming about 20% faster than surface temperatures…
Hmmmm…. I wonder why GISS, NOAA and GISS datasets show warming 3 TIMES that of satellite data when they should be 20% less? Why indeed…
Hint: (read my first paragraph).
Here is the US temperature fiddling NOAA admits to on their own website:
http://www.ncdc.noaa.gov/img/climate/research/ushcn/ts.ushcn_anom25_diffs_urb-raw_pg.gif
How GISS, NOAA and the CRU can get away with this seemingly fraudulent data manipulation is astounding…
Once CAGW is officially disconfirmed, I hope those involved in this blatant data manipulation will be brought to justice, but I’m not naive enough to believe anything will actually happen…
SAMURAI,
“makes the line go up?”
You haven’t been reading the recent posts of Bob Tisdale. That just isn’t true. And it doesn’t get truer however many times you trot out the tired old USHCN graph from 2 versions ago, which show mainly the effect of TOBS.
Nick– Here are just a few examples showing the HUGE impacts NOAA/JISS “adjustments” to raw temperature data have had on raw data vs. “final” temperature datasets:
https://stevengoddard.wordpress.com/data-tampering-at-ushcngiss/
Since CAGW model projections already exceed reality (RSS/UAH/radiosonde data) by 2+ standard deviations for 20 years, CAGW alarmist have been relegated to adjusting raw-temperature data to prevent the CAGW hypothesis from being officially disconfirmed.
That’s not how science works…. “Scientists” don’t get to change inconvenient raw data to get the numbers they need to avoid hypothetical disconfirmation…. In actual science, the HYPOTHESIS is adjusted to match reality, not the other way around…
CAGW has become a joke.
It’ll be comical to see the data manipulation/excuses CAGW alarmists concoct/devise once both the PDO and AMO are in their respective 30-year cool cycles, because global temps ALWAYS fall when this phenomenon occurs.
Nick Stokes
I think that graph is making the same mistake as Monckton’s.
The IPCC projections are for the 35 years from 1990 to 2025. You and Monckton are comparing this with the trend from 2001 to present. But this ignores all the warming that occurred between 1990 and 2001.
The trends since 1990 are
HAD 1.67 C / century
NOAA 1.77
GISS 1.90
BEST 1.67
RSS (v3.3) 1.25
RSS (v4.0 TTT) 1.93
UAH (beta 6) 1.11
UAH (v5.6) 1.83
All are within the IPCC 2001 projections, despite the 20 years of no warming in two of the satellite sets.
Bellman,
“You and Monckton are comparing this with the trend from 2001 to present.”
I don’t endorse the choice of period. I just showed what happens if you use the right data for that period. I think a more serious issue may be what whether even land/sea indices correspond to the earlier predictions. In 1990 they didn’t have either land/sea indices or ocean-linked GCMs, so they would have been projecting air temperatures. In 1995, AOGCMs were still fairly experimental. And there is an objection even now that when you read the fine print, projections are of surface air temperature, which is not quite the same as the land/ocean indices usually quoted as observation.
The IPCC is like the VW and Toyota Gimmicks to get past the emission testing standards and fool the public.
Germany and Japan.
Now there IS the Axis Powers!
Ha ha
Nick,
“All those cited predictions were for surface warming. Lord M as usual compares them with satellite, not surface.”
Nick, Nick, Nick. What exactly are you implying that satellite data is used for? Space temps? Are you trying to get people to believe that the IPCC was concerned over “global warming” that MIGHT occur somewhere BESIDES the surface of this planet? Are you implying that the IPCC DID NOT use GISS, Hadcrut or NOAA satellite data sets when they made their predictions in the past?
Looking at YOUR “speedometer”, the “real” actual, temperatures (taken by RSS and UAH) indicated by the GREEN arrow is still WAY below the first measurement according to your ” actual data that they were predicting!!!”. His point was, and is obvious, the IPCC’s predictive/projection abilities (when using the GISS, Hadcrut and NOAA modeled data) SUCKED completely in 1990, again in 1995, and again in 2001. But they ARE getting closer. 🙂
“Looking at YOUR “speedometer”, the “real” actual, temperatures (taken by RSS and UAH) indicated by the GREEN arrow is still WAY below the first measurement according to your ” actual data that they were predicting!!!”.”
That is a difference between two sets of observations. That is no fault of the predictions – it’s just a fact about the world The IPCC was predicting GMST. There was no general prediction about troposphere – stratosphere was predicted to cool, and it has.
So why do TLT and surface disagree. Two obvious possibilities:
1. They are different places. That’s just the way it is.
2. One set of measurements is wrong.
If 2, which could it be? Well, the surface indices have been fairly steady. UAH has gone within a year from showing more warming 2001-2016 than surface, to showing much less. RSS V3.3, used here, now comes with this caution:
“The V3.3 TLT data suffer from the same problems with the adjustment for drifting measurement times that led us to update the TMT dataset. V3.3 TLT data should be used with caution.”
Nick
Can I just say how much I appreciate your clear explanations. While I tend to whiz past the political and opinion stuff written by others, it is always a pleasure to read the work of a man who obviously has a very good understanding of the data. And you are always so polite despite what is often thrown at you. You must be a patient man. It is clear Mr Watts has a level of respect for you to and I would say, based on the help you have offered him (and he has accepted), it is well deserved.
“… stratosphere was predicted to cool, and it has …”.
=========================
The stratosphere stopped cooling 20 years ago:
http://s11.postimg.org/lxwzon2rn/Volcanoes_and_Lower_Strat_Temps_1978_2014.png
Simon, Nick is being disingenuous, as in insincere. He Knows the stratosphere has paused for twenty years, he knows the surface data has radically changed over the past 40 years, he knows radiosonde in general supports the satellites, and he know the troposphere is supposed to be more sensitive to El Nino, La Nina.
Nick,
I do think you are a rather reasonable “warmist” . . as warmists go, but I wonder if you really believe we are on the brink of climate catastrophe. Whether a pause or a slow crawl, the rise in temps has not been all that alarming for a goodly spell it seems. (nor sea level, major storms, droughts, etc.) . . and there is an apparent “greening” effect one would expect from extra CO2 . . So, are you at least somewhat skeptical of the CAGW hypothesis?
John Knight
“So, are you at least somewhat skeptical of the CAGW hypothesis?”
CAGW is WUWT-style terminology. As I see it, we’ve burnt about 400 Gtons carbon, and seen modest warming. There would be more, even if burning stopped. The GHGs make a sustained increase in flux, and the earth with its oceans takes a while to respond. But the thing is, we could likely burn at least five times more. Is that safe?
“The stratosphere stopped cooling 20 years ago:”
No it did not according to RSS at least…..
http://data.remss.com/msu/graphics/C13/plots/RSS_TS_channel_C13_Global_Land_And_Sea_v03_3.png
“Figure 7. Globally averaged temperature anomaly time series for the AMSU Channel 13, in the middle stratosphere. The plot shows the that middle stratosphere cooled during the most recent 15 years, even as the lower stratosphere ceased cooling. (Click on the figure to go to the time series browse tool.)”
Try it also for other channels covering the Strat here:
http://images.remss.com/msu/msu_time_series.html
Nick,
“But the thing is, we could likely burn at least five times more. Is that safe?”
Could be, if CO2 climate sensitivity is low . . especially given the logarithmic decline in further effect with more CO2. But if it’s even modest, that should become readily apparent long before we could burn five times what we have already, so your question seems rather loaded, in the here and now. So I suppose I could restate my question as; Are you at least somewhat skeptical that the CO2/GHG sensitivity is high? . . such that big trouble is rapidly becoming unavoidable?
To me, it seems dangerous in many ways, to many people, to continue/accelerate the sort of “alarmist” policies I see being pursued currently. Most of the “alternative energy” expenditures seem wasteful, even counter-productive, and that money will not available for mitigation/adaption efforts, if temps do eventually become a problem. “Shackling” economic development, with ineffective remedies, could actually result in us (the non-wealthy us anyway) being less able to deal with serious trouble if and when it does manifest, it seems to me. If we were discussing moving to sound alternatives, this conversation would be different, but at this point we’re simply not . .
Tony B, the level where the Troposphere physics in the model do not predict a 20 year pause is the LOWER stratosphere where it is suppose to cool just above where the troposphere is suppose to warm at a rate faster then the surface, indeed, per IPCC physics, the very cause of the surface warming and LOWER stratospheric cooling is the additional CO2 and w/v feedback.
I find it intriguing how you claim that the models predicted Stratospheric cooling yet the Stratosphere has not cooled at all since 1994 as shown by NOAA here..
http://www.arl.noaa.gov/documents/JournalPDFs/RandelEtal.JGR2009.pdf
Yes the stratosphere cooled from the start of the satellite era to 1994 but this is arguably in steps associated with large volcanic eruptions like Pinatubo.
There has been no significant stratospheric cooling for 22 years with very stable temps.
“Tony B, the level where the Troposphere physics in the model do not predict a 20 year pause is the LOWER stratosphere where it is suppose to cool just above where the troposphere is suppose to warm at a rate faster then the surface, indeed, per IPCC physics, the very cause of the surface warming and LOWER stratospheric cooling is the additional CO2 and w/v feedback.”
Nope:
Models predict cooling optimum around the 50mb level…..
From: http://iopscience.iop.org/article/10.1088/1748-9326/10/5/054007/meta
Which is where the RSS channel C10 shows cooling (and all the channels centred above) …
http://images.remss.com/msu/msu_time_series.html
RSS TLS is below the optimum cooling predicted by models.
(20km ~58mb)
Nick-
Prediction-“a thing predicted, forecast, conjecture, guess”
Measurement-“the action of measuring something, evaluation, assessment”
You just posted your own “speedometer” in which you posted the NOAA, GISS and HadCrut data, which you are arguing should be used to determine GMST correct? So let’s forget UAH and RSS for the moment. Let’s assume that the IPCC made all of their predictions in the past using models programmed with NOAA, GISS, and HadCrut data sets. According to current measurements, at least up to 2016 so far, those predictions have been wrong! That IS the “fault” of the predictions that Monckton is pointing out. He’s pointing out that there is a big difference between what was PREDICTED would happen by this point in time, and the actual MEASUREMENTS of what actually did happened by this point in time.
Following the link you embedded above in the words “fairly steady”, you show that GISS shows pretty much exactly the warming between 2001 and 2016 that the green arrow shows in Lord M’s speedometer. And the balloon data is just a slight bit lower, but it’s close enough.
Now, if the IPCC was indeed predicting GMST, what they predicted in 1990, was that by 2025, the GMST would have warmed in pretty linear fashion-“1.0 [0.7, 1.5] C° over the 36 years to 2025, a rate equivalent to 2.8 [1.9, 4.2] C°/century. This predicted interval is 6.0 [4.0, 8.9] times observed warming since January 2001.”
According to your GISS data chart (your link) currently the world has warmed roughly 0.4 C since 1990. So to meet the 1990 IPCC prediction, in the next 9 years, the GMST must rise by 0.6 C. That would be a large amount of warming.
The IPCC has LOWERED it’s expectations a lot since 1990, but their models are still running way too hot. If the warming is supposed to happen in a steady, linear fashion-as predicted-it might only just barely make it to their LOWEST predicted rate of warming by 2025.
David A May 25, 2016 at 10:04 pm
“Simon, Nick is being disingenuous, as in insincere. He Knows the stratosphere has paused for twenty years, he knows the surface data has radically changed over the past 40 years, he knows radiosonde in general supports the satellites, and he know the troposphere is supposed to be more sensitive to El Nino, La Nina.”
Actually I think you are being rather unfair. I don’t believe Nick is being insincere at all. I think when you read what he has to say, he believes very much in what he writes. If you want insincere, then look no further than the graph Mr Monckton produced at the top of this page, that compares two different concepts (The IPCC’s surface data predictions with the satellite data) saying the IPCC is therefore wrong.
Monckton is no fool, he knows exactly how to muddy the waters, only this time it was a little too obvious and his pants have been caught down (actually I would say on fire).
Simone, actually Monckton helped the models by showing surface warming projections. Your own bias is showing.
The models are hopeless to defend as Steve McIntyre demonstrates in two detailed posts refuting Gavin Schmitt’s attempts at complaint about John Christy’s chart…..
Conclusion:
In the present case, from the distribution in the right panel:
•a model run will be warmer than an observed trend more than 99.5% of the time;
•will be warmer than an observed trend by more than 0.1 deg C/decade approximately 88% of the time;
•and will be warmer than an observed trend by more than 0.2 deg C/decade more than 41% of the time.
see…. https://climateaudit.org/2016/05/05/schmidts-histogram-diagram-doesnt-refute-christy/
Tony, thanks for the 54 year long 1958 – 2012 radiosonde weather balloon estimate which picked “good stations… ” ‘Good’ stations are defined as those whose temperature trend (1958–2012) is no more than two standard deviations away from the median for stations in that latitude band.” which is still not close to what the models predict for the entire atmosphere.
http://jonova.s3.amazonaws.com/graphs/hot-spot/mckitrick-models-observations-rss-msu-uah-radiosondes-flat.jpg
•a model run will be warmer than an observed trend more than 99.5% of the time;
•will be warmer than an observed trend by more than 0.1 deg C/decade approximately 88% of the time;
•and will be warmer than an observed trend by more than 0.2 deg C/decade more than 41% of the time.
see…. https://climateaudit.org/2016/05/05/schmidts-histogram-diagram-doesnt-refute-christy/
David A:
“Tony, thanks for the 54 year long 1958 – 2012 radiosonde weather balloon estimate which picked “good stations… ” ‘Good’ stations are defined as those whose temperature trend (1958–2012) is no more than two standard deviations away from the median for stations in that latitude band.” which is still not close to what the models predict for the entire atmosphere.”
That’s OK. I merely wanted to highlight the fact that there is a problem with Sat temp data post 2000.
Actually RATPAC A radiosonde data is defined as …
https://www.ncdc.noaa.gov/data-access/weather-balloon/radiosonde-atmospheric-temperature-products-accessing-climate
“RATPAC-A contains adjusted global, hemispheric, tropical, and extratropical mean temperature anomalies. From 1958 through 1995, the bases of the data are on spatial averages of LKS adjusted 87-station temperature data. After 1995, they are based on the Integrated Global Radiosonde Archive (IGRA) station data, combined using a first difference method (Free et al. 2004). For analyses of interannual and longer-term changes in global, hemispheric, and tropical means, the team recommends use of RATPAC-A since it contains the most robust large-scale averages. “
The satellites are fine….
Chris Christy says. ”
“The weights applied to the pressure level temperatures are determined by radiation code that has been empirically tested. We’ve tested such results with controlled radiosonde measurements and found them to be virtually identical – this was all published in our papers years ago (see Spencer and Christy 1992a,b, Christy et al. 2003, Table 2 of 1992a and Table 7 of 2003 show regional correlations of 0.95 to 0.98)”
===============================================================
and the models fail at every point in the bulk of the atmosphere…
“… stratosphere was predicted to cool, and it has …”.
====================================
20 year pause, not predicted. Has warmed at about one third of predicted rate.
That is the TLS data which includes some of the troposphere, about half the data is from between 10 and 15 km. As you go higher in the stratosphere the cooling increases, centered on 20km= -0.235ºC/decade, 25km= -0.36ºC, 30km= -0.48ºC, 35km=-0.50ºC, 40km= -0.76ºC.
According to HADCRUT4 data, we’ve enjoyed about 0.82C of total global warming recovery since the end of the Little Ice Age in 1850, for a trend of just 0.0496C/decade or the century equivalent of 0.496C/century…
Moreover, based on the physics and empirical data, CO2 has likely contributed only 0.2C of the total 0.82C ofwarming recovery enjoyed since 1850…. Oh, the humanity…. sarc/off.
Given the logarithmic forcing effect of CO2, we’ll likely enjoy another 0.3C of CO2 induced warming recovery in the 21st century, for a total of just 0.5C of CO2 induced warming recovery between 1850~2100, LESS the possible cooling effects of a potential Grand Solar Minimum (GSM) event expected to start in 2035, and last 50~100 years….
Accordingly, global temps may well be COOLER than they are now by 2100…
Given Leftists’ crazy belief that human’s control the world’s climate through CO2 emissions, should we INCREASE CO2 emissions now to help offset the possible cooling effects of the coming GSM???
Oh, the Immutable Law of Leftist Irony (aka ILLI)…
But, but, Samurai, think of the glaciers! Especially the feminist ones ; )
A metaphor for the “Green” CAGW feminist witches…:
The argument being run is that the observed satellite and radiosonde trends are irrelevant for testing the enhanced greenhouse effect IPCC model predictions because those model predictions were for the surface trend.
But as the satellite and radiosonde observations contradict the very basis of IPCC predictions, i.e. that the troposphere average is warming less than the surface (the predicted ‘hotspot’ is a zone at least 20N – 20S), that argument is void.
“But as the satellite and radiosonde observations contradict the very basis of IPCC predictions, i.e. that the troposphere average is warming less than the surface (the predicted ‘hotspot’ is a zone at least 20N – 20S), that argument is void.”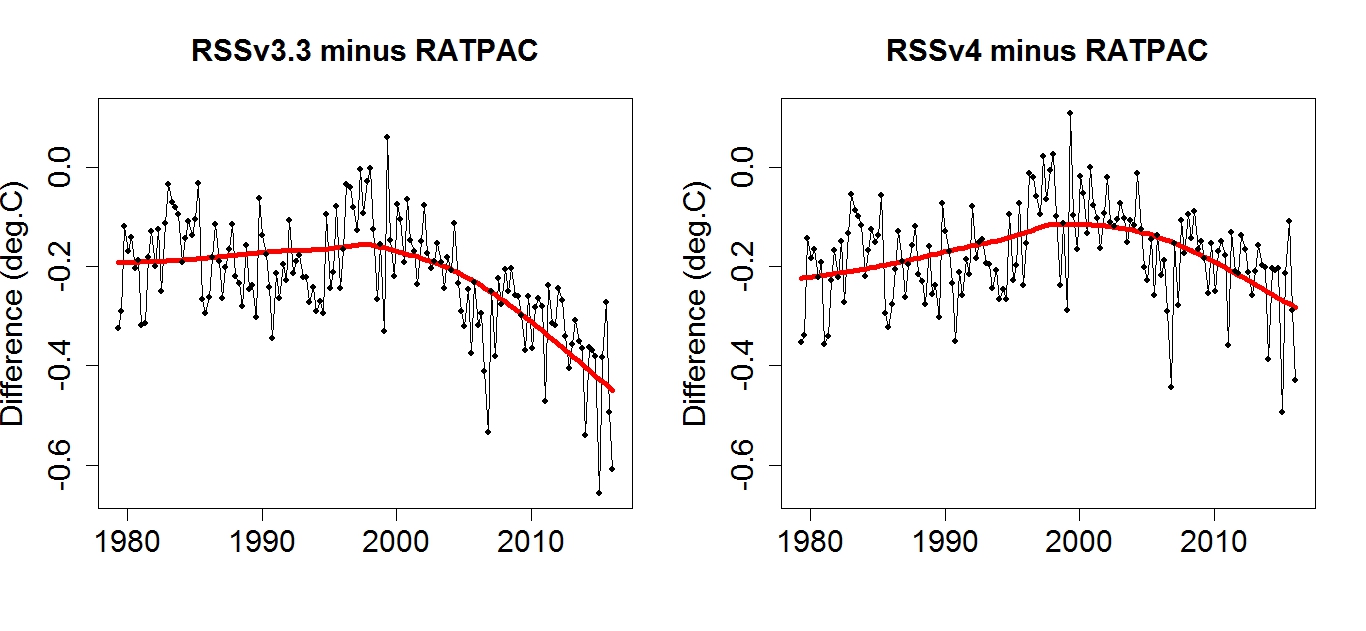
Nope not true.
Actually Sat and radiosonde contradict each other.
That land stations suddenly warmed relative to the Sat data since the time of the NOAA14 MSU > NOAA15 AMSU changeover is beyond incredible.
(note this is for RSS TTT, as they have yet to revise TLT)
Maybe why RSS brought in V4.0 to address the obvious divergence of sat data from surface.
The correlation is now better but still not eliminated.
We await of course UAH to bring out V7.0 or some such.
yet at RSS they used the term “denialists”
Fail.
all adjustments = global warming trend increase (not temperature increase << the false argument)
From top to bottom the models vs. observations are simply wrong with the model mean running way to warm…
Christopher— Actually, according to the CAGW hypothesis, the lower troposphere should be warming 20% faster than surface temps because that’s where all the supposed CO2 downwelling LWIR occurs….
Unfortunately for the CAGW hypothesis, GISS/HADCRUT4 surface temp datasets show 3 TIMES MORE warming than observed in the lower troposphere as measured by RSS/UAH/radiosonde datasets…
Either the CAGW hypothesis is wrong, GISS/HADCRUT4 data is being manipulated (which they already admit to) or RSS/UHA/radiosonde data is being manipulated downward…..
I’m going for doors #1 and #2…
SAMURAI
“Actually, according to the CAGW hypothesis, the lower troposphere should be warming 20% faster than surface temps because that’s where all the supposed CO2 downwelling LWIR occurs….”
Really? Forgive me for being suspicious… But… Can you please give a direct quote that says this the “CAGW hypothesis”?
OK, my phrasing was clumsy.
Does Simon object to the term CAGW? Which is more accurate, CAGW or C.C.?
Are not the harms (catastrophes) predicted by hundreds of alarmists (all failing to manifest) due to the predicted GMT rise. Is not the cause of the warming suppose to be human emissions.
Simon: wrote, “Really? Forgive me for being suspicious,…but….can you give me a quote…blah, blah, blah”
Sure, Simon.. Here’s a quote for you:
“Christy et al. (2010)
“The magnitude of the trend in recent decades of TLT has become controversial because of differing views on … whether the relationship between the observed temperature trend of TLT and the observed temperature trend of the surface (TS) is faithfully reproduced by … climate model simulations. These model simulations indicate that a clear fingerprint of greenhouse gas response in the climate system to date is that the trend of TLT should be [1.4 times] greater than [that of] TS. There have been essentially two groups of publications on this contentious issue, one reporting that trends of TLT in observations and models are statistically not inconsistent with each other and the other reporting that model representations are significantly different than observations, thus pointing to the potential for fundamental problems with models.”
In fact the only lower stratosphere cooling before the 20 year and ongoing pause appears to be two volcanic induced step changes…
The models are hopeless to defend as Steve McIntyre demonstrates in two detailed posts refuting Gavin Schmitt’s attempts at complaint about John Christy’s chart…..
Conclusion:
In the present case, from the distribution in the right panel:
•a model run will be warmer than an observed trend more than 99.5% of the time;
•will be warmer than an observed trend by more than 0.1 deg C/decade approximately 88% of the time;
•and will be warmer than an observed trend by more than 0.2 deg C/decade more than 41% of the time.
see…. https://climateaudit.org/2016/05/05/schmidts-histogram-diagram-doesnt-refute-christy/
“In fact, the trends since 2001 were:
GISS 1.609°C/Cen
HADCRUT 1.136°C/Cen
NOAA 1.620°C/Cen
All in the pink range of predictions.”
2015-16 are the strongest El Nino years. Try starting from 1997-1998 (another strong El Nino years) and see the trends. If ENSO has significant effect on the trends, then the noise is stronger than the signal. Maybe we should be more worried about the noise (natural variability) than the signal (man’s influence) or even doubt whether the so-called signal is just an artifact of the noise.
By the way, between surface temperature and satellite data, I pick satellite. For more info on surface temperature, satellite data and IPCC projections, read this testimony of Prof. Christy before the House Committee on Science, Space & Technology
http://docs.house.gov/meetings/SY/SY00/20160202/104399/HHRG-114-SY00-Wstate-ChristyJ-20160202.pdf
There is no human signal, period. Only an interpreted one after adjusting data, cool pre 1960 hey presto warming
Then the concealment of uncertainty, which is fraud
“2015-16 are the strongest El Nino years. Try starting from 1997-1998 “
It’s Lord M’s “single devastating graph”, not mine. His argument is that the prediction period starts in 2001, the year of AR3.
Yes, but nick, you seem to be making this subjective argument and then claiming it’s an objective one. (maybe your not drinking the kool aid, but you’re getting a little too close to the vat…)
“For more info on surface temperature, satellite data and IPCC projections, read this testimony of Prof. Christy before the House Committee on Science, Space & Technology”
Or read this from Mears et al 2011…
“Examination of the differences between TMT from MSU channel 2 on NOAA-14 and AMSU channel 5 on NOAA-15 shows a long-term trend difference, with NOAA-15 cooling at a rate of 0.2 K per decade relative to NOAA-14 over the July 1998 to December 2004 period of overlap. This trend difference is not present for the other channel pairs, including, to our surprise, TLT, and is more than 2.5 times larger than the trend difference for any pair of MSU satellites with more than 18 months of overlapping observations. This trend difference is too large to explain using the difference between the MSU and AMSU TMT weighting functions. It is about 100 times larger than the trend difference simulated using HadAT data over the overlap period. The cause is not known and could be a drift in calibration in one or both of the satellites that is not explained by our calibration error model (equation (3)). Since we do not know which satellite is closer to being correct, we treat this drift as an additional source of uncertainty. It is unlikely that the drift is caused by errors in the diurnal adjustment because the magnitude of the drift is similar for land-only and ocean-only averages, which is unlikely to be the case for errors in the diurnal cycle.”
Now I seem to remember that Mears did not testify. I wonder why?
Global average temps are most certainly not “the best data we have” (J Curry).
And since then RSS has gone to V4.0.
What a fantastic debate! We have fist fights over data, preachers, name calling, trolling – all extremely entertaining but sadly everyone has picked sides and no one is listening to each other.
Politics and religion aside, we will have our answer! One side or the other will be wrong.
My question to all on this thread… What is the consequences of your being wrong? Choose wisely, friends because someone will be wrong and our judge will be our grandchildren.
For the sake of argument, let’s say there is 10% chance climate change could cause even a fraction of the predicted repercussions are realized. Are comfortable with this? What about 5%?
What if the climate change believers are wrong?
Personally, as an engineer, I am in favor of taking advantage of opportunities to encourage innovation within the Energy sector. The US’s greatest export is innovation and I would hate to see us play second fiddle to other countries particularly on energy.
Ted, the atmospheric carbon dioxide growth rate has been tracking temperature for over half a century since the inception of the mauna loa observatory data set. If this correlation holds true (meaning that if the past half century is any indicator of the future), then IT DOESN’T MATTER WHO IS RIGHT AND WHO IS WRONG !!! If the carbon growth rate continues to track with temperature, then human emissions will (continue to) not impact the growth rate. Thus, even if agw is real, there is nothing we can do about it…
http://woodfortrees.org/graph/plot/esrl-co2/from:1958/mean:24/derivative/plot/hadcrut4sh/from:1958/scale:0.31/offset:0.09
No matter what you do with the base satellite data, it is going to be argued that the person is cherry picking. The only way to avoid that is to correct for the natural variations like ENSO and volcanoes. We can see those results here:
http://www.nature.com/ngeo/journal/v7/n3/images/ngeo2098-f1.jpg
There’s little doubt there has been no warming since around 1993. What Monckton should have done is extended this graph to the present. I think I understand where Christopher is going. He realizes this trend is going to get lower and lower over the next 2-3 years as the current El Nino upward influence is eliminated by the coming La Nina. I still prefer to remove the influence completely.
I like this wag at GMT but do not think it properly accounts for the AMO. We will see, but if we follow the past AMO and it continues to go negative over the next decade plus, and the PDO reverts to negative after the blob dissipates, full ocean cycles in sequence may well erase most of the .4 degrees warming we have had in the past 37 years.
Could you please explain exactly how you remove volcanic and El Nino / La Nina influences from these data sets. I would like to see the actual numbers involved. This “removal of influences” occurs widely in climate literature, but I have yet to see a numerical demonstration of the processes involved.
Thanks!
Nick Stokes
May 25, 2016 at 6:45 pm
According I need to document that under the AGW hypothesis the troposphere should warm before and more than the surface? On your planet GHGs in the atmosphere should warm the land and sea “surfaces” before the air in which they float?
Please explain to me how that works. Thanks.
I’m not confused with the non-existent yet predicted tropical tropospheric hot spot at all. I’m stating what should be obvious under the man-made GHG warming conjecture. GHGs are supposed to warm the air by retarding escape of heat to space. This warmth is then supposed to heat the land and oceans. Does the speculation operate differently in your world?
The rates of warming shown on Monkton’s graph depend on realistically picking the start and end points.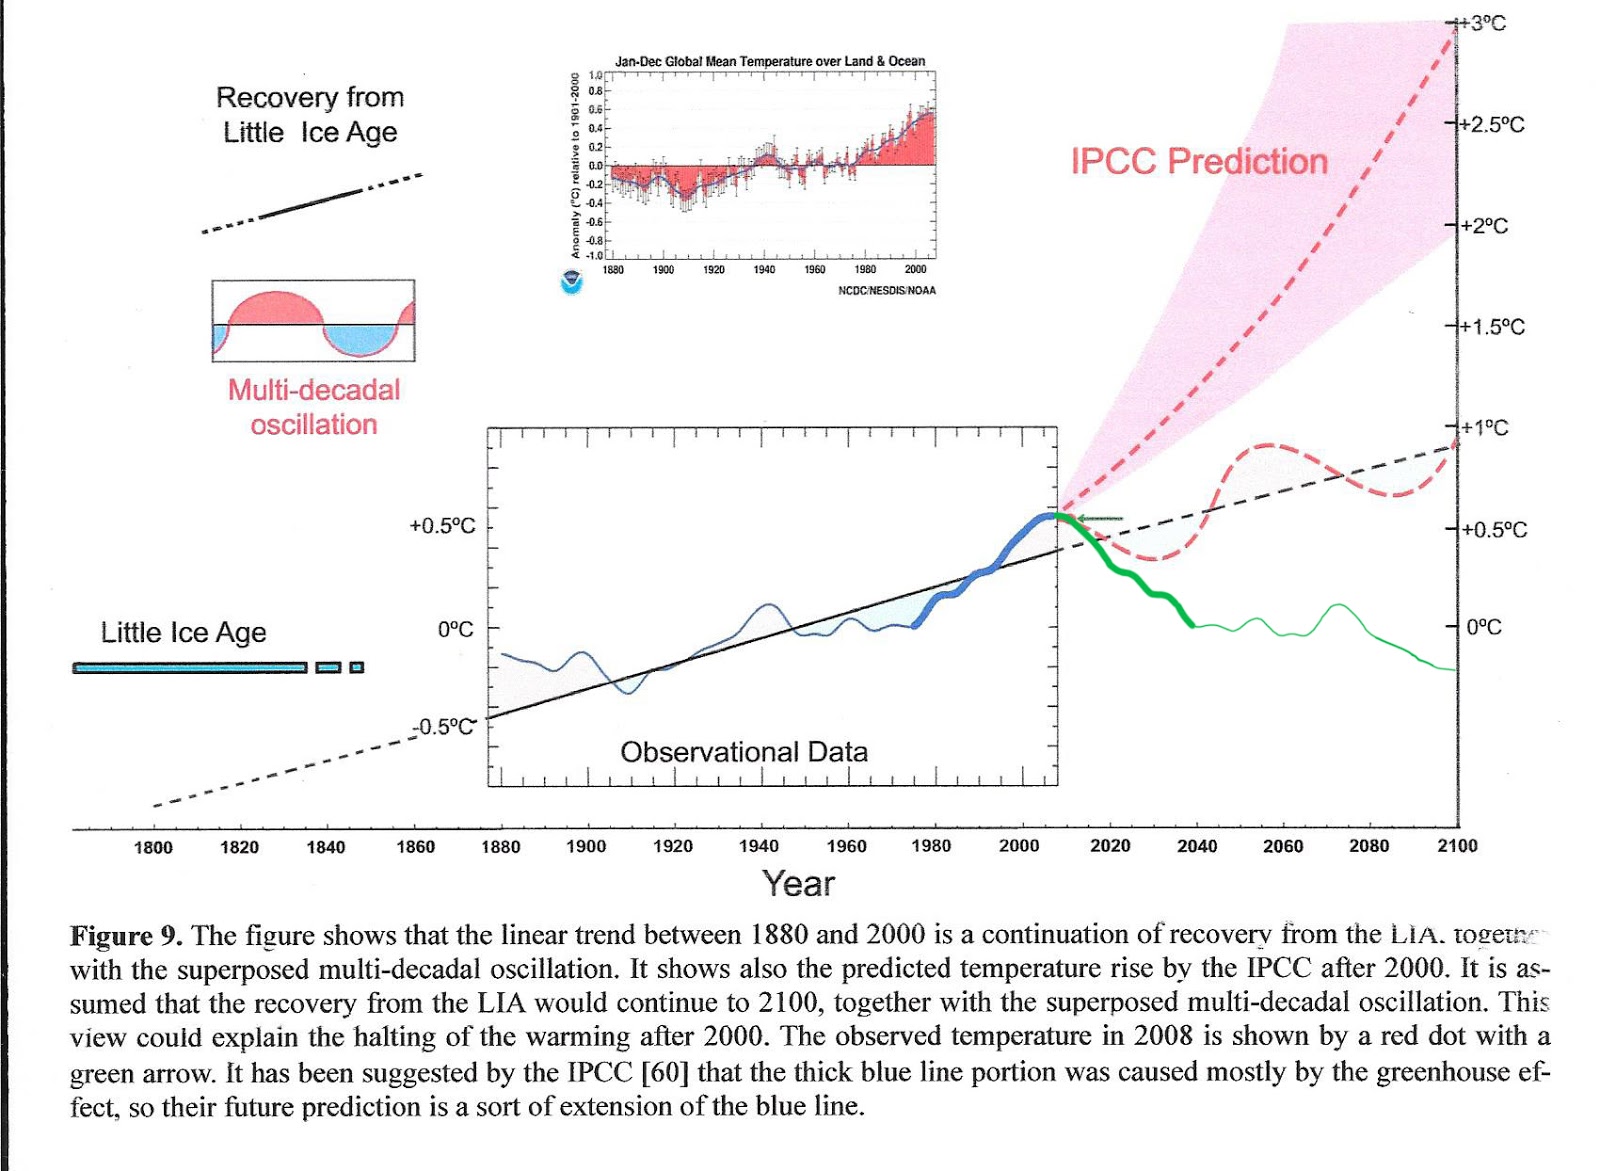
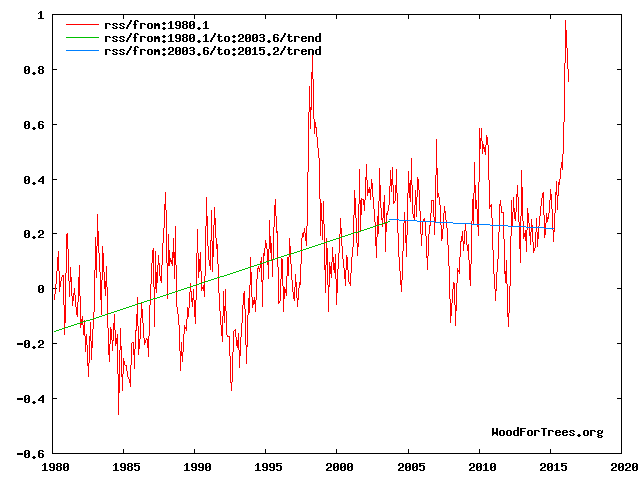
Both the millennial and sixty year temperature cycles peaked in about 2003.This is an inflexion point between the warming and cooling trends. See Figs 1,5,and 5a at
http://climatesense-norpag.blogspot.com/2016/03/the-imminent-collapse-of-cagw-delusion.html
Temperatures rose until 2003 and the earth has been cooling since then. Rates based on straight line projections past the peak really have no physical significance.
Figure 1 above compares the IPCC forecast with the Akasofu paper forecast and with the simple but most economic working hypothesis of this post (green line) that the peak at about 2003 is the most recent peak in the millennial cycle so obvious in the temperature data.The data also shows that the well documented 60 year temperature cycle coincidentally peaks at about the same time.
The cooling trend is truncated at 2015 because it makes no sense to begin or end a trend during an Enso event which is only a temporary aberration,
Climate prediction is reasonably obvious and straight forward on the basis of the millennial and 60 year temperature cycles and the solar “activity” as measured by the neutron count and 10 Be data Figs 7 and 8.There is a 12 year delay between the solar activity peak and the RSS peak in Fig 5. There is a 21 year delay between the solar peak and the Arctic ice volume minimum in 2012.We do not need to completely understand the mechanisms involved in order to make useful predictions.
For a more complete discussion see :
http://climatesense-norpag.blogspot.com/2014/07/climate-forecasting-methods-and-cooling.html
No straight line projection can be anything other than ridiculous when it is a first year engineering undergrad level exercise to show the cyclic nature of the data using Fourier. A best fit curve should be produced and analysed but sadly climate scientists do not even come close to having the level of training required to see this or that linear methods were fine in 1700 but dated by 1750.
“Temperatures rose until 2003 and the earth has been cooling since then.” That is an astounding claim totally ignoring the evidence. If you extend the blue line using the same data set you see it well within the IPCC prediction and diverging in a dramatic way from the green and red lines.
The graph has three “prediction” lines – the IPCC, the red and the green. Since the blue line stops in 2010, we can actually see which of the lines is closest to reality for the last 6 years. The IPCC wins hands down.
It is not often that we get a post that almost literally debunks itself.
Seaice1
“Temperatures rose until 2003 and the earth has been cooling since then.” That is an astounding claim totally ignoring the evidence. If you extend the blue line using the same data set you see it well within the IPCC prediction and diverging in a dramatic way from the green and red lines.”
Ok, granted the second dashed line should have been another color (and not red), but you really need to learn to read charts based upon the informational material that comes WITH the graph, rather than making flawed assumptions.
The blue line ends AND diverges from the IPCC predictions between 2000 and 2008-where the red dot on the green line is…the blue line BECOMES the green line of observed data. The red dashed line with the lighter red “error fan” that continues to go UP is the IPCC prediction “mid point” line with the lighter red background showing both the low end and the high end of the predictions. The red “dashed” line that moves in perfect up and down regularity over the trend line is NOT an “IPCC prediction”….it represents the multi-decadal oscillation according to the chart’s legend. Basically the blue line BECOMES the green line when the temperatures start to drop, and it shows it diverging in a dramatic way away from BOTH the IPCC prediction AND the MDO around 2015.
So…either YOU ignored the data shown in the chart or are making astounding claims about it, because the observational data does not show the blue line extending upwards, which it would have to do, to remain “well within the IPCC prediction”.
The IPCC intentionally supports the climate models which are the necessary tools needed to overstate and exaggerate warming from fossil fuel use.
Why?
I would disagree which those that think they have fundamentally done it to primarily promote any political philosophy. Political aspects would be only a derivative result. Rather I think they are primarily doing it because they have a philosophy of science that allows any kind of subjective influence to exaggerate and to intentionally cause misdirection for any philosophically created purpose (like environmental radicalism or secular theologies or existential emotionalism or social pragmatism) . Objective philosophy of science would not allow what the IPCC has done wrt subjective manipulated warming of the climate model.
John
John Whitman,
“Rather I think they are primarily doing it because they have a philosophy of science that allows any kind of subjective influence to exaggerate and to intentionally cause misdirection for any philosophically created purpose (like environmental radicalism or secular theologies or existential emotionalism or social pragmatism) .”
It seems to me you are generating a distinction between political philosophy and the brute acquisition of political power, which is not real, if a political philosophy is similar to what you describe there as a philosophy of science. Which is to say, if those seeking great political power, seek it not to implement/manifest this or that particular political philosophy, but rather to get into a position that will allow them to implement/manifest whatever will subsequently facilitate keeping that power.
That’s what I believe we are witnessing, in regard to the promotion of the “climate change” meme, and in conjunction scientists who have no problem with adopting “a philosophy of science that allows any kind of subjective influence to exaggerate and to intentionally cause misdirection for any philosophically created purpose”. As in, what could be called “scientist shopping”, with the intent to develop a very “rubbery” quasi-scientific basis for justifying whatever policies and movements and devils the ones in power wish, as the need arises.
I wonder if the figure for real means the unadjusted one or the fiddled one. Real needs two sets, one of urban sites and one of rural ones which should match if the results are to be meaningful as real temperatures. No one in the climate fraternity is trained in real world data acquisition so we really cannot trust even the modest level of warming to be representative of reality given the upward adjustments when the US climate reference network proves the need for a significant downward one.
Anyone remember using a computer in 1995…. Just because they were wrong then does not mean there has been no improvement in models and computing since then….
I’d say there’s been some improvement in computers:
http://americandigest.org/aabuy.jpg
But it’s not computers that are wrong. It’s the models.
I was writing and selling statistical software for microcomputers in1985. Developments of the same underlying programs (much enhanced) still run perfectly, and still get the correct answers and diagrams.
Robin
So many people giving excuses
Satellites =/= Surface.
Chosing starttimes.
Just take their best, modded data, compare it to their predictions. Notice how its still in the lowest end of predictions and go with that? They cant complain about that?!
Nick Stokes says: May 26, 2016 at 12:37 pm
“In 1990 they didn’t have either land/sea indices or ocean-linked GCMs, so they would have been projecting air temperatures.”
How does that tally with section 4.8 – Simulation of Ocean Climate – of the First Assessment report?
Or, more particularly?
“4.9 Validation of Coupled Models
While much has been learned from models of the atmosphere and ocean formulated as separate systems, a more fundamental approach is to treat the ocean and atmosphere together as a coupled system This is unlikely to improve on the simulation of the time-measured atmosphere and ocean when treated as separate entities (with realistic surface fluxes), since the average SST can only become less realistic, however, it is the only way in which some of the climate system’s long-term interactions, including the transient response to progressively increasing CO2, can be realistically studied (see Section 6).
Typical of the current generation of coarse-grid coupled GCMs is the simulation shown in Figure 4.22 from Washington and Meehl (1989). The general pattern of zonal mean temperature is reproduced in both atmosphere and ocean in this freely interacting coupled model, although during the time period simulated the temperature in the deeper ocean is still strongly related to the initial conditions……”
OK, they mention one coarse grid coupled GCM from 1989, and said there is something still not worked out. But it doesn’t seem that they would be using it for prediction of land/ocean GMST. That section ends:
“In summary, coupled models of the ocean.atmophere system are still at an early stage of development…”
The saddest thing of all is all this brain power wasted on a non issue. We could be walking on Pluto by now.