From AGU EOS —Terri Cook, Freelance Writer

Was the Recent Slowdown in Surface Warming Predictable?
From the early 2000s to the early 2010s, there was a temporary slowdown in the large-scale warming of Earth’s surface. Recent studies have ascribed this slowing to both internal sources of climatic variability—such as cool La Niña conditions and stronger trade winds in the Pacific—and external influences, including the cooling effects of volcanic and human-made particulates in the atmosphere.
Several studies have suggested that climate models could have predicted this slowdown and the subsequent recovery several years ahead of time—implying that the models can accurately account for mechanisms that regulate decadal and interdecadal variability in the planet’s temperature. To test this hypothesis, Mann et al. combined estimates of the Northern Hemisphere’s internal climate variability with hindcasting, a statistical method that uses data from past events to compare modeling projections with the already observed outcomes.
The team’s analyses indicate that statistical methods could not have forecast the recent deceleration in surface warming because they can’t accurately predict the internal variability in the North Pacific Ocean, which played a crucial role in the slowdown. In contrast, a multidecadal signal in the North Atlantic does appear to have been predictable. According to their results, however, its much smaller signal means it will have little influence on Northern Hemisphere temperatures over the next 1 to 2 decades.
This minor signal in the North Atlantic is consistent with previous studies that have identified a regional 50- to 70-year oscillation, which played a more important role in controlling Northern Hemisphere temperatures in the middle of the 20th century than it has so far this century. Should this oscillation reassume a dominant role in the future, argue the researchers, it will likely increase the predictability of large-scale changes in Earth’s surface temperatures.
Paper:
Predictability of the recent slowdown and subsequent recovery of large-scale surface warming using statistical methods
Authors
Michael E. Mann, Byron A. Steinman, Sonya K. Miller, Leela M. Frankcombe, Matthew H. England, Anson H. Cheung
(Geophysical Research Letters, doi:10.1002/2016GL068159, 2016)
Abstract
The temporary slowdown in large-scale surface warming during the early 2000s has been attributed to both external and internal sources of climate variability. Using semiempirical estimates of the internal low-frequency variability component in Northern Hemisphere, Atlantic, and Pacific surface temperatures in concert with statistical hindcast experiments, we investigate whether the slowdown and its recent recovery were predictable. We conclude that the internal variability of the North Pacific, which played a critical role in the slowdown, does not appear to have been predictable using statistical forecast methods. An additional minor contribution from the North Atlantic, by contrast, appears to exhibit some predictability. While our analyses focus on combining semiempirical estimates of internal climatic variability with statistical hindcast experiments, possible implications for initialized model predictions are also discussed.
Yet they’re sure it will be at least three degrees warmer in 2100 than now.
What will Mann say when the Plateau resumes with the coming La Nina, or turns into a valley rather than resuming foothill status?
Mann needn’t worry about a La Nina cooling. The Church Priests will Karlize the temperature data to report what they need.
I thought Mr Mann and his ilk had actually gone to some lengths to deny that the ‘pause’ ever happened at all?? Now he’s saying it did?
You notice he called it a temporary slowdown… Lol
“””””….. The temporary deceleration in warming across the Northern Hemisphere earlier this century could not have been foreseen by statistical forecasting methods, a new study concludes. …..”””””
Well I hate to break the news to them, but absolutely nothing ” can be foreseen by statistical forecasting methods. ”
Statistics is always an analysis of stuff you already know because it has already happened. So you can’t even do any analysis, until you know what happened.
But then you still know absolutely nothing about anything that hasn’t happened yet, and you never will, until it has happened.
You can take a wild ass guess on what you THINK might happen.
But your guess is no better than mine on that. Neither of us knows what is going to happen next.
Nothing ever happens again, so the fact that something did happen, is no basis for assuming it will happen again, because it won’t; something else will.
G
george e. smith: Well I hate to break the news to them, but absolutely nothing ” can be foreseen by statistical forecasting methods. ”
I’m guessing that you don’t use Garman or a modern cell phone to help you navigate in a place you have never been before. Are you guessing when Halley’s comet will return, or the next lunar eclipse will occur?
Put more directly, statistical modeling and forecasting methods (e.g. Kalman filters, weighted nonlinear least squares regression) are used routinely to estimate the positions and trajectories of the GPS satellites.
Its more like a plateau and escarpment, the Klimatariat will have nowhere to run.
So, the bottom line here is that Mann and his models cannot make any worthwhile predictions.
We all already knew that, pity it has taken him so long.
But he got a bunch more grant $$$.
If the accuracy of climate models was graphed in numerical form as temperatures are, without alteration they would have a negative anomaly approaching 100.
The models do not know if we are rapidly entering an ice age, or entering a global sauna…

Geologists have identified the evidence of (at least) 17 previous Ice Ages separated by brief Inter-Glacials. There may be more Ice / warm cycles before that, but the evidence kept getting chewed up by the geological processes at work.
A core tenet of Geology is that the processes we see at work today were at work in the past. Given the cyclical nature of Ice Ages and Inter-Glacials, I’m betting on another 170K long Ice Age will soon be upon us, and the petty musings of Mann and his superstitious fear-mongers will be proven very wrong.
The Greenies were lucky that after their failed Ice Age prophecies there was an uptick from a rebounding from the end of the Little Ice Age. They rode that pony, but it has died. We are now entering at least a 35 year period of lower temperatures, which Mann and his disciples will shake their Ju-Ju Beans at and make all sorts of pronouncements, as they try in vain to keep milking the cash cow that will progressively dry up more each year.
I predict all sorts of drastic actions by the Alarmists, including violence, but if we Skeptics can just hold on (and stay alive long enough to pass our belief in The Scientific Method on to the next generation) we will finally be vindicated.
Reference is incorrect. It should read:
Paper:
Predictability of even more excuses for the recent slowdown and continuing failure of climate models and consensus using statistical bullshit.
Authors
Michael E. Mann, Byron A. Steinman, Sonya K. Miller, Leela M. Frankcombe, Matthew H. England, Anson H. Cheung
Spot on Michael – LOL
And only a couple of years back many of them were still refusing to discuss ‘the pause’…I guess they had to wait for the El Nino spike to save face.
Strange bedfellows Mann and Statistics!
We don’t need no stinkin’ statistics !
One Charlie Brown Christmas Tree in Yamal, is all you need to tell you the climate anywhere, at any time.
g
“statistical methods could not have forecast the recent deceleration in surface warming because they can’t accurately predict the internal variability in the North Pacific Ocean”
Other than the fact the models don’t work they’re wonderful at supporting some people’s belief that man in the cause of global climate change.
OK, so they couldn’t predict the recent deceleration in surface warming but they can predict, with what, 95% confidence, that the surface will warm in an “unprecedented” manner?
Yeah, I can’t see where anyone would have a problem with that.
Semi-empirical mann bends over backwards to retain the models –
oh-you-cargo-cult-pseudo-scientist – you!
“statistical methods could not have forecast the recent deceleration in surface warming…” because statistics isn’t physics. Statistics cannot predict physical events.
The fact that Mann & Co., can even write that sentence is enough to demonstrate without doubt that none of them are scientists.
If I read this right, Mann is asking “if we’d tried to use our models to predict the current pause, could we have done so?” But they already did NOT predict this. So what he’s really asking is can we tweak our models now to match what we now know really happened? And then he finds the answer to be “no.” So then he feels the need to equivocate, so makes up a story about how they could have predicted small component of a cool-down in the North Atlantic, if they’d wanted to.
And I need to give up fossil fuels for this level of chicanery and prestidigitation?
you said it all
Which let us wonder how it could be published.
“because statistics isn’t physics”
The mechanism is physical – AMO and NAO cycles. Statistics are neded to identify the cycles, and estimate the extent to which they can overcome natural variability, including possibility variability in the oscillations themselves.
“Statistics are neded to identify the cycles, and estimate the extent to which they can overcome natural variability, including possibility variability in the oscillations themselves.”
But the science is settled, right, Nick? Our CO2 emissions will cause catastrophic global warming, despite the physics only indicating slight warming, and the rest resulting from hypothetical amplification mechanisms, assumed into the models . . which tell us with certainty that assuming those in causes the models to project catastrophic warming . . Which will them become real . . unless we give out firstborn to the UN, right?
Mickey Reno — well, said. — Eugene WR Gallun
Nick Stokes, at 5:47 AM…”The mechanism is physical – AMO and NAO cycles. Statistics are neded to identify the cycles, and estimate the extent to which they can overcome natural variability, including possibility variability in the oscillations themselves.”
So..AMO and NOA are not part of “natural variability”? Are they then……Super-natural?
Can you point us to a paper that defines which physical processes are variable and unpredictable are “natural” vs. “supernatural”?
Sorry, but these ill-defined terms allow people to say some strange things…
Nick, “Statistics are neded to identify the cycles, and estimate the extent to which they can overcome natural variability, …”
Not correct, Nick. Physics is needed to identify climate cycles. Statistics might be used to estimate time of appearance, if sufficient cycles are identified as physically iso-causal.
I’m glad you showed up here by the way, so I can let you know that your BOM resolution argument was wrong. And the self-congratulatory purring among some of the commenters at your site didn’t speak well for them, either.
Astounding how they can’t “see” (natural) variability as a cause of anything BUT the failure of their GIGO “models” to “predict” ANYTHING. And also astounding that they actually believe that people seeing the phrase “internal variability” are gullible enough to believe it means anything less than “We have no idea what the $^#! is going on.”
What does this mean?
“In contrast, a multidecadal signal in the North Atlantic does appear to have been predictable. According to their results, however, its much smaller signal means it will have little influence on Northern Hemisphere temperatures over the next 1 to 2 decades.”
He seems to be saying that they can detect a longer signal but it doesn’t have any significance? My head hurts now.
If I recall properly, Mann + Co. presented a paper where they used dendrochronology to reconstruct the NAO (North Atlantic Oscillation). That’s right, tree rings as a proxy for ocean currents. No doubt using the Global Climate Teleconnection Signal (I love that one). {The paper was featured here at WUWT} This current work seems to be based on that previous effort.
Your head feel better now?
No, and now my stomach is bothering me as well.
I just left a large Mann-uscript in the loo. Lit a candle to alleviate the remainders and turned on the fan.
Too bad lighting a candle won’t remove the Mann-stench in Climate Science.
Well it does appear to have been predictable but the facts of the matter, is that it WAS NOT PREDICTED.
So fooey; you Monday Morning quarterbackers. If you didn’t predict, don’t tell us later that you could have.
So Cartoon !!
Andy Capp, somewhat sloshed, is staggering home on radar, in the late evening fog in London. He crashes into another lost drunk staggering along, and grabs a hold of him for stability. ” ‘ear; ‘ang on tuh me, mate; I know where every drainage ditch in London is ” ; ‘ Sssploosh !!! ‘; ” See, there’s one of ’em now ! ”
Yeah; predict, my A***.
G
So the science has been unsettled?
Hmm, the total ocean heat capacity is about 1000x greater than the atmosphere. The surface layer they are modeling and measuring is the first 1.5 m of an atmosphere that extends 1000s of meters up. If approximately 1/1000 of the atmosphere’s mass is in the lower 1.5 m (seems like a reasonable approximation, but it’s a difficult calculation with pressure dropping as you go up.) Then they are measuring/modeling something that represents 1/1,000,000 of the earth’s total heat capacity, while completely ignoring the other 999,999/1,000,000 portion which is constantly and actively transferring heat in and out of the surface layer. And they wonder why the models can’t predict the surface temperature.
may be but then comes the magic part…
Oh, but see you’re just providing us with a preview of the next round of excuse-mongering. They’ll just dust off that “heat is hiding in the oceans” (which couldn’t be heated by IR beyond the top few MICRONS of surface) canard, when they no longer have El Nino to produce “scary” thermometer numbers.
But I thought Karl had abolished the “pause”.
banished by waving engine room readings over the data from specifically designed measuring devises mounted on bouys.
So how can the Mann be so off message to refer to a “Temporary deceleration”.
Not a pause of course.
I wonder what he would call a full stop?
I guess when you have nothing left to support your belief except models,then you must cling to them.
Re-examining ones beliefs is far too hard.
I almost feel sorry for the mann, way in over his head and first to be thrown to the angry mob as the mass hysteria dies.
But I thought Karl had abolished the “pause”.
Wah, you beat me to it.
Karl says the pause never existed, Mann says it did and explains why the models missed it.
This “consensus” seems rather fractious, does it not?
Good thing Mann isn’t a police officer, “Sir, you failed to STOP at that STOP sign. Now I’m going to have to charge you”.
Car driver “But the car hasn’t moved in 19 years, how much stopped do you want?”
Mann never acknowledges the pause either.
He calls it a slowdown in warming.
A variation of the old “The long term trend is still (when I start my “trend” in the LIA) up!” canard.
Wow, the threat of a president Trump has really shaken things up !!
Marcus, I like your take on the situation. With this study, these Climate Change Charlatans may very well be positioning themselves for Trump’s possible election.
I don’t think anything they do will save them from intense Trump scrutiny, though.
If Trump gets elected, the whole CAGW three-ring-circus is going to be put under a microscope.
I can’t wait! 🙂
Here in Britain, we can’t wait either. Trump is going to stuff it to so many people – here in Britain too.
For a moment I read that to say “TREE ring circus,” which would have given you the “Pun of the Climate Cycle” Award. 😀
From the article: “From the early 2000s to the early 2010s, there was a temporary slowdown in the large-scale warming of Earth’s surface.”
Why end it in 2010? The years subsequent to 2010 are also included in the “flatline” of the 21st century, since they are all within the margin of error.
Because once the period exceeds 10 years it is approaching a substantial fraction of the “standard” climatological period of 30 years. As it is, the “pause” is now more than half of such a period. Do you think they will ever wish to use 1991-2020 (or 2001-2030) as a reference period?
“Why end it in 2010?”
They didn’t. Your quote says “early 2010s”, not 2010. In fact they took data to 2014, but note that the slowdown effect diminishes if you go to the end of that period:
“Though less pronounced if data through 2014 are used [Cowtan et al., 2015; Karl et al., 2015], the slowdown in Northern Hemisphere (NH) mean warming is evident through at least the early part of this decade.”
Thanks for that clarification, Nick.
Gee, Nick! The Pacific Ocean and its Blob had nothing to do with 2014 temperatures, did they? Ram and jam through 2015 and 2016 Pacific Ocean ENSO temperatures and Cowtan and Karl will really have something to show the rubes. No big pressers projected after 2017? Get a grip.
“The Pacific Ocean and its Blob had nothing to do with 2014 temperatures”
They were talking about an observed slowdown. By 2014 they weren’t observing a slowdown any more. No use saying – well there really was an observed slowdown, except for the Blob, and ENSO etc. On that basis, you could project the slowdown for ever.
Mann is off-message. I thought they did away with the pause, just like Mann did away with the Medieval warm. Very convenient things, models and proxies. About as good as onieromancy, but convenient.
Tom, He is trying to buy street cred. He’ll jump on the pause bandwagon long enough to be quoted and therefore relevant. …shallow has been.
Shallow never was
Since when do the warmists use statistical models anyway? I got the impression all their supercomputer-powered models where determistic…wholly dependent on input variables, assumptions, and initial conditions. Statistical models wouldn’t have really predicted a specific outcome either, only assigned a probability estimate. Bottom line, this warmist propaganda piece is fail on top of fail inside a fail.
Exactly.
If you can’t do a deterministic model, that means you don’t understand the process. That, in turn, means your predictions of future behaviour should not be believed.
“If you put tomfoolery into a computer, nothing comes out of it but tomfoolery. But this tomfoolery, having passed through a very expensive machine, is somehow ennobled and no-one dares criticize it.”
– Pierre Gallois
Deterministic models don’t work on just about everything, especially on computers. see Edward Norton Lorenz’s paper Deterministic Nonperiodic Flow for the full explaination, the Short answer;
Also note that weather is an instance of climate and if weather is chaotic, than Self-similarity forces climate to be chaotic as well.
Yes. You beat me to it, but that’s the real problem and also the reason the models they’ve developed using “hindcasting” can never work.
Anyone with even a basic understanding of statistical modeling knows you can’t ever use an empirically derived model outside its calibration range; it is never valid to extrapolate from an empirical model.
I’ve had this discussion with devotees of the CMIP models many times, on every occasion I’ve been assured I don’t know squat about how those models work, that they are in fact theoretical models based on physical relationships (i.e. the so called “greenhouse” effect) and therefor may legitimately be used to predict the behavior of Earth’s climate. Mann very clearly just denied that and in so doing admitted the methods currently used to model climate change are completely invalid. They can never succeed.
It’s a fundamental rule: You can’t ever extrapolate from an empirical model. Unless you have a complete theoretical model of the system, it will fail to predict. It may appear to succeed randomly, but it will never consistently predict the behavior of the modeled system. This is burned into the brain of every single experiment designer employing statistical methods.
Under this declaration, there is absolutely no reason to continue funding this research. It’s snake oil. Plain and simple.
I have argued for years that the climate models are nothing but expensive curve fitting programs. The super computers and millions of lines of code is just the lipstick they put on the curve fitting pig.
My landlord does this every year.
From the data base of years gone the monthly costs of winters heating are derived – every new year to get accomodated.
Predictions -forget it.
“Since when do the warmists use statistical models anyway? I got the impression all their supercomputer-powered models where deterministic…wholly dependent on input variables, assumptions, and initial conditions. “
People use statistical models when appropriate. But yes, GCM’s are solutions of the basic conservation equations (mass, momentun, energy) locally. That is precisely the issue of Mann’s paper. Some say that the slowdown was statistically predictable by identifying PDO, AMO etc. GCM’s don’t generally do that, for good reason. The physics they use is local, within elements, and superimposing other effects has to be done vary carefully. Still, it is done, most notably with radiation. Mann is finding out whether adding observed cycle information (without mechanism) would improve the result. He’s something of an AMO enthusiast himself. But no, he says, statistically it wouldn’t have helped predict the slowdown. NAO gives some help, but only predicts a small effect.
Gavin Schmidt probably was one of his anonymous reviwers. He likes this sort of hand waving.
Mann was a physics hick when he started scamming fake hockey stick generators as statistics, and you’re one now.
What’s the name of the law of thermodynamics to solve temperature of gas in chemistry?
What’s it’s equation and what do all the factors stand for?
Show where the Green House Gas Effect fits when solving temperature in gas physics.
Or you’re just another fake like all these other Green House Gas Effect barking
hicks.
Nick Stokes on May 11, 2016 at 7:31 pm
“Since when do the warmists use statistical models anyway? I got the impression all their supercomputer-powered models where deterministic…wholly dependent on input variables, assumptions, and initial conditions. “
People use statistical models when appropriate.
________________________
And yes, Nick: people use heavy metall when appropriate.
What are you gonna
CON vince
us.
How can you model something that even the IPCC’ers admit they don’t understand?
“The team’s analyses indicate that statistical methods could not have forecast the recent deceleration in surface warming because they can’t accurately predict the internal variability in the North Pacific Ocean, which played a crucial role in the slowdown.”
Well if the models can’t predict the past then what good are they for predicting the future. This sounds like an indictment of their own sloppy half-a$$ed conjuring. I am surprised that the twit Mann didn’t instrument trees to get a signal for the future…. somehow.
Translation – We simply have no idea what is going on and we are scrambling to find something in our models and everything else we have said that sounds like we aren’t completely full of it.
In contrast, a multidecadal signal in the North Atlantic does appear to have been predictable
=====
There’s so much wrong with this lucky guess……..
It has been shown that the surface temperature series not a random walk but a Hurst process at a wide range of time scales. So it is unlikely that the models will ever get it right with OLS trends that treat the temperature time series as Gaussian and independent and ignore memory, dependence, and persistence in the data. See for example
http://papers.ssrn.com/sol3/papers.cfm?abstract_id=2776867
“It has been shown that the surface temperature series not a random walk but a Hurst process at a wide range of time scales.”
By whom? It is neither.
” So it is unlikely that the models will ever get it right with OLS trends that treat the temperature time series as Gaussian and independent “
GCMs do nothing like that.
Of course they do, except for stuff they want to throw in.
…Our greatest threat is the liberal media ! ?oh=bcbf8ae36f937ac701f5a9a0aeb68708&oe=57AE30AB
Statistical models are not fit for the purpose of forecasting climate trends. Forecasting general trends, with probable useful accuracy ,is straightforward when we know where we are with regard to the natural millennial and 60 year cycles which are obvious by simple inspection of the temperature and solar records.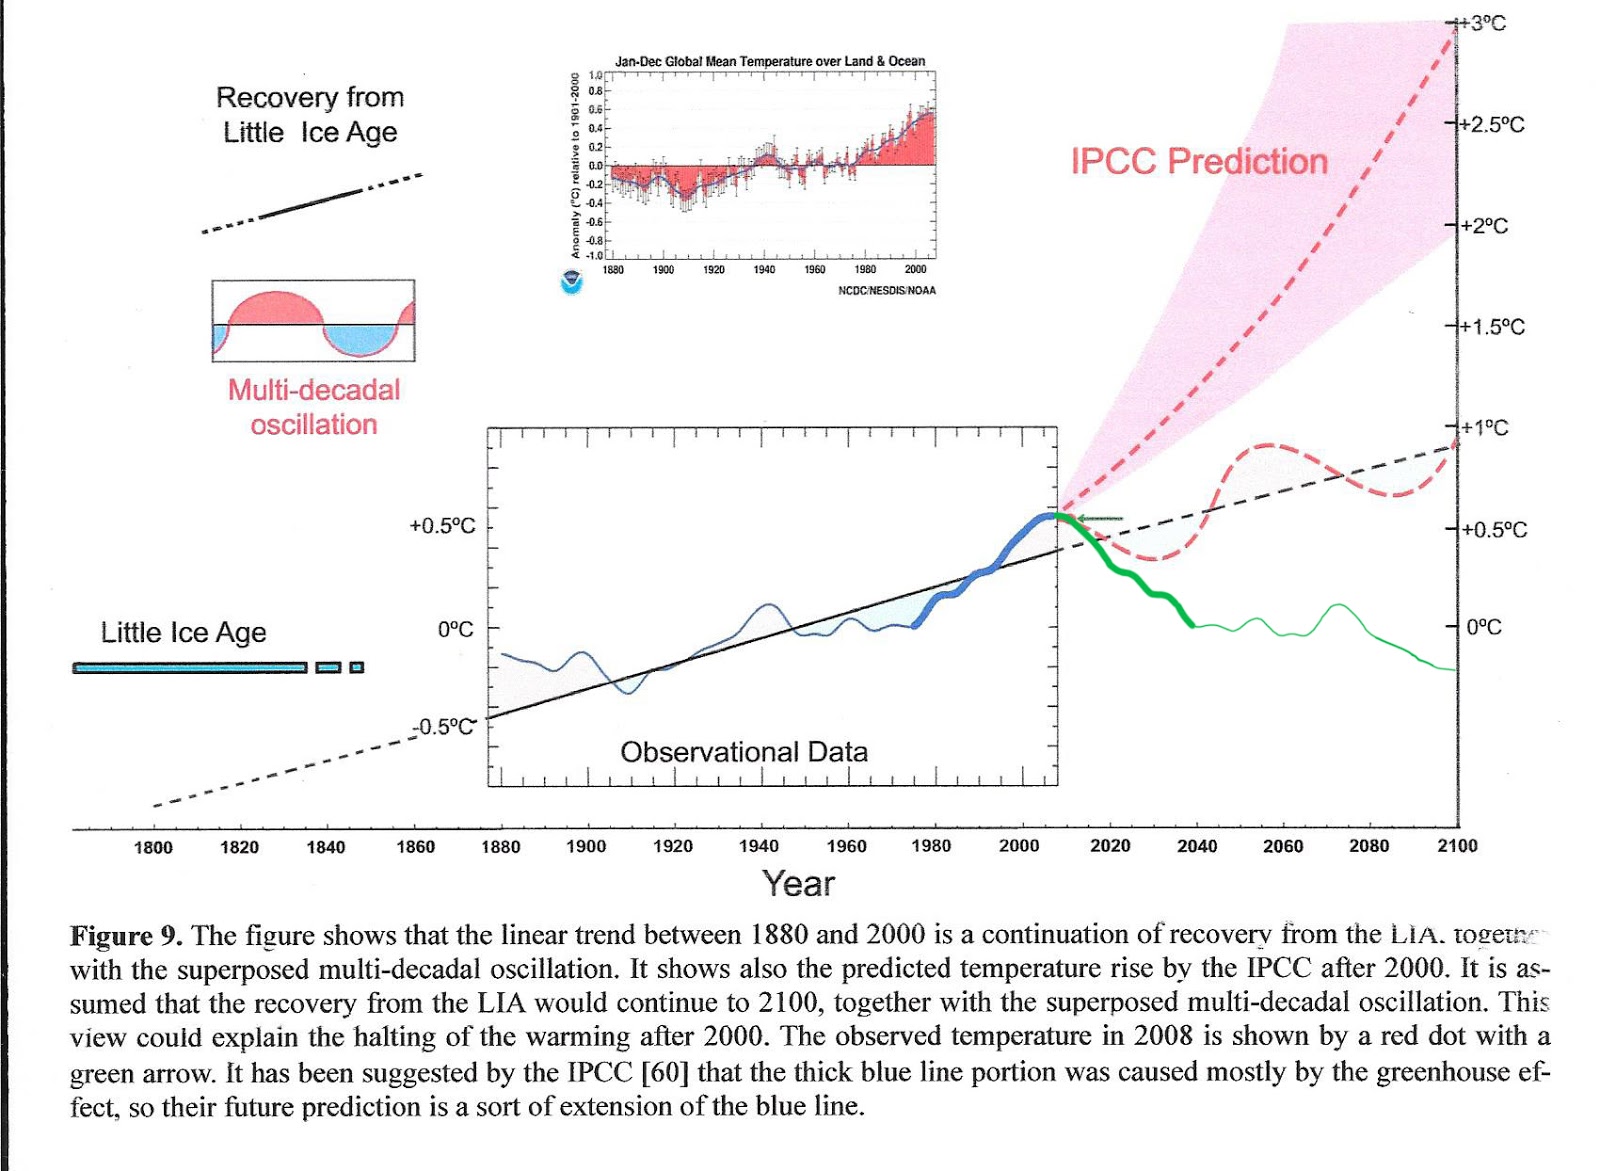

See Figs 1, 5 ,5a and 8 at
http://climatesense-norpag.blogspot.com/2016/03/the-imminent-collapse-of-cagw-delusion.html
Here is Fig 1 which illustrates the general trends, forecasts and in particular the millennial peak and trend inversion at about 2003.
Figure 1 above compares the IPCC forecast with the Akasofu paper forecast and with the simple but most economic working hypothesis of this post (green line) that the peak at about 2003 is the most recent peak in the millennial cycle so obvious in the temperature data.The data also shows that the well documented 60 year temperature cycle coincidentally peaks at about the same time.
Here are Figs 5 and 5a
The cooling trends are truncated to exclude the current El Nino as an end point. The Enso events are temporary aberrations which don’t have much influence on the trends – see the 1998 and 2010 events in Figs 5 and 5a.
By anyother name a Bond Event in the Holocene, aka a D-O event in the larger-longer Pleistocene.
What is semiempirical?
I taught I taw a puddy-cat!
I did, I Did, I DID saw a puddy tat!
Thought the same but there is a definition. Sounds like an oxymoron to me. I fact I reckon it is.
In the government, they have base funding, one-time funding, and recurring one-time funding…I only wish I was making that up.
nonemperical is a theoretical model that is a construct of logic and underlying principals that makes predictions, by which observations can be made and experiments can be made which will strengthen or weaken confidence, empirical is based on, concerned with, or verifiable by observation or experience rather than theory or pure logic; so it follows that Semiemperical is not based on pure logic and underlying principals and is only supported by adjusted data products!
It must be a bit like like semiepregnant.
It seems the opening line of the paper presumes to know the future by stating flatly that the pause was temporary.
It seems patently unscientific to start with a predetermined conclusion.
Of course, this is no surprise to me or anyone else who has kept up with the great yet settled debate, but it does immediately flag the author, for even a new-comer to the issue, as highly biased and therefore not to be taken as a credible source of scientific information.
” the internal variability of the North Pacific, which played a critical role in the slowdown, does not appear to have been predictable using statistical forecast methods”.
They didn’t know about the PDO so it wasn’t ‘predictable’, now they do, they have to adjust the models.
thingodonta, you didn’t read what they said. They said that North Pacific internal variability was not “… predictable …” That means that future models still won’t use “… statistical forecast methods.” North Pacific internal variability will not (cannot in their world) be used in future models going forward. The next IPCC Report, then, need not concern itself with inaccurate prior “projections” as they relate to the intervening past. Thus, the writers of history just erase portions of the past. In the future, those pointing out discrepancies are dismissed as cranks.
William R nails it, bit I’ll add my bit anyway: The climate computer models (see here) operate entirely on smallish bits of local weather. That is, they use a global grid of smallish cells interacting in small time slices (by definition, conditions in a small area over a short time are “weather”). They are not statistical models.
The article says “Several studies have suggested that climate models could have predicted this slowdown [..]. To test this hypothesis, Mann et al [compared] [..] compare modeling projections with the already observed outcomes. The team’s analyses indicate that statistical methods could not have forecast the recent deceleration in surface warming“.
The finding by Mann et al is therefore completely false, because what they did (applying statistical methods to model projections and observed outcomes) has nothing whatsoever to do with what goes on inside climate models and therefore cannot determine whether the climate models could have predicted the slowdown. All the study did was to show that the models did not predict the slowdown.
But we knew that already.
Mike, I assume (see here) was meant to be a link? It didn’t come through. I’m very interested because what you’ve done is refute Mann’s understanding of the models, and argument I’ve faced many times before when trying to point the fundamental architectural and mathematical failures of GCM models.
I’d really like to read and understand your sources.
Bartleby – the link is one of a series of articles that I wrote a while back, looking at and into the models. The missing link was : https://wattsupwiththat.com/2015/11/08/inside-the-climate-computer-models/
The sources for that article are linked from the article. There’s also a link to my previous article (take special note of the footnotes!).
Thanks Mike, I appreciate it!
Mike writes in the citation above:
Thanks for the treatment Mike, now I believe I have a better understanding of the GCR models and the term “semiempirical”.
After reading your review, I don’t feel compelled to withdraw my criticism; these models may include some poorly understood theoretical components, but they also attempt to “blend” those theoretical parts with empirical models. In my opinion the approach is both flawed and doomed to failure.
I don’t think the criticism I made, that it isn’t legitimate to extrapolate from empirical models is invalid. They appear to be doing exactly that, while at the same time claiming the models are based on theoretical models. I have no idea how such an approach ever made it passed a scientific review since it is completely unfounded.
PS.
Thinking just a bit more about this (and after putting down a couple glasses of good red wine so don’t take this too seriously) I’d speculate the GCM models adapted for Climate Change use resulted from a small group of post-docs having an “oh shit!” moment when they began to understand the true complexity of statistical thermodynamics, not to mention the outrageous computational resources needed to make any progress at all.
Books have been written on the perils of attempting to simultaneously solve multiple partial differentials uniquely, how could they make anyone believe they’d cornered they’d market? Where are the papers?
I definitely agree with you conclusions. This is all smoke and mirrors.
Carbon dioxide in the atmosphere cannot be compared to blue dye in a river. Metacycles like PDO even less so. Filtering them out and reinserting them is just a tautology.
Statistics is just witching, useful only as an indication of where to drill for physics.
“The finding by Mann et al is therefore completely false, because what they did (applying statistical methods to model projections and observed outcomes) has nothing whatsoever to do with what goes on inside climate models and therefore cannot determine whether the climate models could have predicted the slowdown. All the study did was to show that the models did not predict the slowdown.”
No, that isn’t what the study did. It showed that statistical models could not have predicted the slowdown (using cycles), or at least not much. He’s really interested in whether a newish style of decadal predictions using AMO etc information might have been able to do better, These are initialised, and would operate, he suggests, by removing the AMO component from the initialising data, and restoring it in the results. But that isn’t going to work until some statistical predictability is shown.
With all due respect, that’s tosh. “Several studies have suggested that climate models could have predicted this slowdown [..]. To test this hypothesis, Mann et al [..]“. Mann et al purported to be testing the hypothesis that climate models, NB. not statistical models, could have predicted …..
Ferchristsakes, there has been randomly varying temperatures, with a general downtrend over the last few thousands of years, over this interglacial. There is no statistical predictability over any timeframe. Other than the use of pseudo-scientific mumbo jumbo, there is no way to ascribe CO2 to the minor jig from 1975 to 1998. Public alarm will play out, at great cost, to the benefit of the obvious.
Dave Fair
Mike,
With all due respect, that’s tosh. “Several studies have suggested that climate models could have predicted this slowdown [..].
No. The press release didn’t specify GCMs. In fact, they are talking about decadal prediction – could have been clearer. But the paper is very clear. They tested statistical models – not GCMs. There is some use of EBM’s, which is different again. But what is perfectly clear, from both abstract and paper, is that Mann was testing statistical models. And the purpose, clear in the paper, is to test whether they (AMO etc) might be useful in decadal prediction.
Nobody expects that GCMs would predict the slowdown. They aren’t initialised to do that. ” possible implications for initialized model predictions are also discussed”,/i> is the key phrase in the abstract.
Nick – OK I accept your explanation. But the article as written did say otherwise.
I’m amused by your statement “Nobody expects that GCMs would predict the slowdown. They aren’t initialised to do that.“. You and I know that the climate models can never produce any climate prediction of any value, but in the wider community surely everybody expects the models to make reasonable climate predictions, and surely everybody expects climate models to be initialised correctly for the real climate. Isn’t it now long overdue for the wider community to be told that the climate models bear absolutely no relationship to the real climate.
“Isn’t it now long overdue for the wider community to be told that the climate models bear absolutely no relationship to the real climate.”
No, climate models do track the evolution of earth climate. They just don’t do weather, because they aren’t initialised to do that. For the longer scale weather (ENSO) they do show the appropriate oscillations – they just can’t predict the phasing.
Here’s an analogy. You’re injecting blue dye into a river. You want to predict where and how much you’ll see blue downstream. If you carefully measure the river flow at the input point, you might predict the downstream trajectory for a metre or so. That’s like NWP. But pretty soon (a few metres), you won’t be able to say where the eddies will take it.
But if you look 1 km downstream, and you know the injection rate, you’ll be able to give a good estimate of how blue the sampled water is, and it won’t depend on the eddies that were around at injection time. All that has faded, but conservation of mass still works, and gives a good answer, even though medium term prediction failed. That’s because of mixing. The weather itself doesn’t mix, but the climate averaging process does, and conservation holds.
But your analogy assumes the “scientist” – who is demanding the “right” to experiment with the world’s entire economic drivers, the life and health and well-being of every person living on the planet – does know everything sufficient about the river to APPLY the well-known approximations and assumptions of “mass flow” of the river. Of the ink. And of all of the “other stuff” affeting the river, the blue ink, and all of the rest of the stuff going on that affects the river between the test point and every subsequent point downstream.
We do know, absolutely, that the global average temperature has increased, been steady, decreased, been steady, and increased when CO2 has been steady.
We do know, convincingly, that global average temperature has increased, been steady, decreased, and been steady, and increased while CO2 has been steadily increasing.
Thus, we do know, absolutely, that the global circulation models are incomplete. They do NOT sufficiently predict the future, because they do NOT predict even the present, the past, nor the “invented” past.
For example: Your little analogy falls apart if the blue ink evaporates. If the ink is alcohol-based, and so volume added and the change in final volume do not correspond. If the water evaporates, or goes into a sinkhole. Gets sucked out by an irrigation pump or city water works. Gets added by the clean discharge from a factory or a sewage treatment plant. Gets disturbed by a filling lock or opening dam. Gets sucked up by a deer or antelope playing nearby. Gets the sewage from a bear in the woods.
1. There is NO HARM from CO2 being added to the atmosphere – except when the “scientists” and their tame politicians and social-multipliers become propagandists.
Nick writes:
Nick, this isn’t news though. The important part is they used techniques that are known (well known) to not work. Ever. Under any circumstance.
They appear to have blithely violated every rule of mathematical inference. This isn’t a small thing.
RACookPE1978 writes:
However we also know that CO₂ has increased significantly, while temperature has not?
And isn’t this observation alone sufficient to break the model that correlation equals causality, which appears to be the basic hypothesis of AGW? Correlation isn’t causality, but the complete absence of correlation certainly must deny causality?
Nick writes
This analogy has assumptions that make it invalid IMO. Firstly you can see how fast its flowing and so you can guess how fast the dye will take with reasonable accuracy even though you cant know the detail. Flow rate at one point in the river implies flow rate throughout. AGW simply isn’t like that, the flow rate of the river is what we’re trying to work out.
Secondly there are many injectors of ink, not just the one you’re interested in. Also there are consumers of ink. And all that that muddies the waters as far as knowing whether your ink is what you’re looking at downstream.
Nick,
“No, climate models do track the evolution of earth climate.”
No maybe at all? No if they got it right? Just do? . .
Logically speaking, you just said it’s not even possible to mess up a climate model such that it will not track the evolution of earth climate, and that is very hard for me to believe. Did you mean something more like they’re only designed to track earth climate, not weather?
Like Bartleby, I would like to see the details of the climate models. I am reviewing John Casti’s text on mathematical models (Reality Rules) to refresh my memory before checking to see if the climate models are “good.” (In an earlier life I built some models to perform reliability and maintainability anayses, but they were much simpler than a climate model.) A main point is that a model is not the system being modeled. Although a model does not include all the factors that affect the actual system, it must include all the most important factors and must be coded correctly. Another issue is round-off error, which can be magnified in sequential runs of a model where the output of one run is used as the input for the next run without correcting the round-off error. Unfortunately, the current climate models are not likely to be abandoned until a better model is developed and adopted. Casti emphasizes that the person doing the modeling must have extensive knowledge of the system and also extensive knowledge of math model development including the algorithms used to represent how the system actually functions, but does not need to be an expert. The community of AGW skeptics should be working to develop a better model (or system of models) or a more accurate alternative method to project future climate performance.
See my reply to Bartleby above. Note that I don’t go far into the models, because long before you get to the sort of detail that you are talking about it becomes very clear that the models are incapable of working.You would like to see a better model (or system of models) or a more accurate alternative method. From my article you can see that the models are heading up a blind alley. As they are currently structured, you just can’t get a “better” or “more accurate” model. A completely different kind of model – top down instead of bottom up – is needed.
“I would like to see the details of the climate models.”
CCSM is a well documented GCM. The detailed scientific description is here. The code is available via here.
Mr. Jonas and Mr. Stokes, thanks for your responses. SRI
Mmmmm, subversion code. Interesting terminology for the climate model. Descriptive?
“The temporary slowdown………..has been attributed to both external and internal sources of climate variability”? please explain. Also “semiempirical estimates” sounds like a get out of jail card to me!.
“semiempirical”? Ain’t no such animal.
Trump is going to have to appoint a CAGW Debunker, as one of his first moves in Office.
Who would be best for this job?
Ted Cruz???
Can’t be done. You’ll never “debunk” a religious belief system. If the cAGW folks were in any way influenced by scientific method, they’d have gone back to the drawing boards long ago.
All anyone can do is ignore them. The temptation, from the perspective of any politician, would be to cater them to as “gimmee” demographic, just as you might cater to any other religious group. If Trump is actually trying to change things, he’ll just ignore them. Any energy spent on de-programing is just wasted energy.
“cater to them…”
Where is the “edit” button?
@Bartleby. I understand what you are saying. Indeed you can probably never destroy a dogma or orthodoxy like CAGW in the minds of the diehard believers. It can only just die away eventually if that is going to happen at all.
The idea in my comment below is to severely damage or destroy the crediblilty of the alarmists in the minds of the majority of the American people and the majority in Congress. I am thinking that CREDIBILITY should be the issue here rather than trying to kill off CAGW altogether. If that can be done, then I think the alarmists will not have the power to push their agenda.
So you don’t think an intervention would work on these CAGW people? You’re probably right.
Oh but there’s something much better you can do to them – it’s called “defunding.” And if they object, just remind them that THEY said the “science was settled,” and that there is therefore no further need to fund more of it.
If I were in Trump’s shoes, I would assemble a panel of the best skeptic scientists (maybe 5 or 10) I could find and have them prepare a presentation containing all the falsifying scientific evidence. Then I and my scientists would go on national television and present the evidence to the American people. Then challenge the alarmist scientists to debate all the evidence in a followup presentation.
John Christy and Richard Lindzen immediately come to mind (if they were interested). They would all probably have to take a leave of absence from the academic positions.
Yes, but not a one time thing, and not stopping with falsifying evidence, but also presenting what is know about alterations to historical data, station deletions, UHI contamination, homogenization, the history of failed predictions, the way headline banners differ from actual reported findings in a great many instances, and the whole rest of the bamboozle, in a series of reports and hearings.
I doubt you will find anyone to take the proCAGW side in such a debate in such a situation…they will not even do that in a public debate with the political machine staunchly on their side.
That’s what I want: A real, pubic debate on the issue. I want to watch the Climate Change Charlatans try to defend what they have done.
@Menicholas. Absolutely agree. All the funny business that has been going on at NOAA, NASA and elsewhere needs to be exposed (and, if necessary, prosecuted) as well. And yes, this needs to be a long term ongoing campaign of severly damaging or destroying the credibililty of the alarmists, as I said above.
Why not start by showing climate hustle nation wide?
CD – Yes, but with a small change: assemble a panel of the best scientists, rather than the best sceptic scientists. OK, it will be a lot more difficult to get an agreed result, but if only sceptic scientists are used then the warmists will find it much easier to oppose. OK, it will be very difficult indeed to find a warmist scientist prepared to participate, but there is a precedent – when Anthony W published a paper recently, a well-known warmist was one of the co-authors. https://wattsupwiththat.files.wordpress.com/2015/12/agu-poster-watts-website-release.pdf, the warmist co-author was John Nielson-Gammon. The benefit was two-fold, (a) J N-G would make absolutely sure that the paper was unbiased and fully substantiated, and (b) the paper had credibility with both ‘sides’. I absolutely applaud J N-G for participating in that paper. If only others had the guts to do so, there would be a chance of ending the toxic debate.
Mann: The pause was not predictable – BS – the amo/pdo has shown up 4 times in the historical records since the the 1750’s. Mann’s explanation shows how climate scientists are utterly dishonest.
Or genuinely ignorant of earth history and geology and physical geography and historical data…etc…
“Not predictable” by junk models is what I think he is implying
We must all adhere to contaminated, upside down, and bad (and advised against) proxies.
It smells of aggravation between paleo reconstruction and modelers.
I would agree if Mann said modelers are not scientists. I would agree 100%
Incompletely and, in fact, insufficiently characterized, and unwieldy. Ergo: chaos.
No matter how plausible the circumstantial evidence, the scientific domain does not tolerate forecasts outside of a limited frame of reference, let alone predictions or prophecies about either the future or the past.
If it couldn’t be predicted, then the science isn’t settled.
The first noun in the abstract says “temporary”. That in of itself is a prediction that he should argue as he already stated the models got it wrong, but he believe in the long run they are right? Well what constitutes short and long for his paper?
I know it is illegal for a goverment employee, such as a State Department employee, to delete emails from a government server, because the emails are government property.
Is it illegal for NASA and NOAA goverment employees to delete surface temperature data? Isn’t that government property also?
Nick Stokes May 11, 2016 at 7:19 pm
“Why end it in 2010?”
They didn’t. Your quote says “early 2010s”, not 2010. In fact they took data to 2014
___________________________
This needs to be called out for the classic case of subterfuge that it is. By being unspecific, they give the impression that the time span is shorter than it is. By phrasing it as “early 2000’s to early 2010’s” the impression to the casual reader is of a period of about a decade. Does science no longer require precise reporting of data?
It would be equally reasonable for them to have said from the beginning of the millennium to nearly half way through the most recent decade. This would have been just as fair a description of the time frame, would have given an impression of a much longer time frame, and would be equally unscientific. The clever wording is deliberate obfuscation, as no one reporting actual scientific results would phrase it just that way.
Nick, you’re frequently right. But in this case you’re defending a clear attempt to obscure the magnitude of the error in the models being swept under the rug.
“Nick, you’re frequently right. But in this case you’re defending a clear attempt to obscure the magnitude of the error in the models”
Well, I try to improve correctness. In this case it was said that data ended 2010, which needed improvement.
But there is no issue here of error in models. They are just describing the duration of an observed slowdown. The precision is appropriate to the vagueness of “slowdown”. If you look at GISS, for example, the longest period of zero slope is Nov 2004 to Jan 2014. You can push the start back, getting small positive slopes, which probably qualify as a slowdown. Jan 2001 to Jan 2014 has slope 0.576 °C/cen. Is that a slowdown?
I don’t think early 2000’s to early 2010’s is unreasonable – certainly not a subterfuge.
“Jan 2001 to Jan 2014 has slope 0.576 °C/cen. Is that a slowdown?” Yes Nick, start with a La nina and end after a La Nina.
If you start in 2001 you end in 2012,
Cheeky boy, what is your trend then, stop cherry picking lad 2002 to 2014 would be accurate and senisble
Well, I try to improve correctness. In this case it was said that data ended 2010
Yes. Because it was intended to be read that way by a casual reader, and in this case it was. The subterfuge worked precisely as intended. You yourself exposed that subterfuge by pointing out that the data in fact went to 2014. Then, after having exposed the subterfuge yourself, you claim that it is reasonable to describe the data that way, and hence it isn’t subterfuge.
In science, it is NEVER reasonable to state data in such a vague manor when the specific data (as you yourself were quick to point out) is available. You cannot have it both ways Nick. Subterfuge or not, it isn’t science.
But there is no issue here of error in models.
And let’s call that statement out for what it is as well. It is a concerted effort to excuse the poor performance of the models without admitting that they are in error. Subterfuge.
“Because it was intended to be read that way by a casual reader”
Scientific papers aren’t written for casual readers. They are written for people who pay attention. But “early 2010s” is a common phrasing. And it doesn’t mean 2010.
Oh come on! This is the same guy that excoriated the entire temperature history of climate on Earth by flattening natural variability and tacking on a vertiginous and decidedly unnatural warming that climbed – whipped by forces of the anthropogenic kind – to the heavens!
Now this same dick is proposing to flatten** that very vertical with the non-existent natural variability that he so graphically* demonstrated to the world, didn’t exist!
*Very, very famous hockey-stick graph
**Or at least, take the edge off…
Nick, I believe you might benefit with using these guys method. a bit more accurate since the time of B. Franklin.http://time.com/4001563/old-farmers-almanac-predictions-accuracy/
This is a result of 2 generations being given no critical and cognitive skills. Carrot on a stick education, be a good boy accept dogma and you will progress. “Chase that carrot you donkeys”.
Science is a dirty game, just as dirty as the corporate world, just as dirty as politics or athletics, and for once the public get to see that.
davidmhoffer:
‘Yes. Because it was intended to be read that way by a casual reader, and in this case it was. The subterfuge worked precisely as intended.’
YES – that is exactly it – and it is exactly how the alarmism is accomplished – an ostensibly true statement that is phrased specifically to give the wrong – i.e. ALARMIST – impression.
I call it a lawyer’s trick – and I’ve also compared it to Lucifer’s methods – lying with a statement that is literally true.
This reads like a weeping puss filled wound.
Nick is too disingenuous in my humble opinion.
Besides, all that time arguing global average temperature is wasted time, and it seems thousands of science hours have been sh!t down the bowl.
And in the end, we still dont even have an agreement on the temperature record or temperatures after 30 years of this nonsense.
30 years fussing over something that is as worthless to climate science as ash is to a fire.
An after the fact residue, which is what the global average temp is, is an effect not a driver.
besides no trend in water vapor shows the atmosphere is not seeing an increase in heat transport by evaporation surely. No Troposphere warming relative to surface warming.
There is no signal in precipitation either, no signal in ocean alkalinity, no signal in weather.
I wish this nonsense would just up and die already, dangerous AGW is complete junk science
‘Nick Stokes’:
“Because it was intended to be read that way by a casual reader”
‘Scientific papers aren’t written for casual readers. They are written for people who pay attention.’
Deliberately obtuse. You know damn well what’s being put out there in front of the public and why. And it’s alarmism. Your presence here is damage control, to justify misleading statements that hide the details.
In journalism, the rule of thumb is that most people don’t read beyond the headline. Those that do, rarely read beyond the lead paragraph. So if you want to hide something, without giving the appearance that you are doing so, you simply put it lower in the story. That way you can say you reported the facts, while in point of fact you were using a standard method of obfuscation. Playing your part in the propaganda.
So, Nick – if that’s your real name – what you are doing is pointing out what’s written at the bottom of the story, and ignoring the implication of the lead. Which in this case, is exactly as davidmhoffer said: “It is a concerted effort to excuse the poor performance of the models without admitting that they are in error.”
“because they can’t accurately predict the internal variability in the North Pacific Ocean.” I am surprised to see an admission that the El Nino and La Nina are not understood and they are causing the climate models to be incorrect.
I can see this paper causing a lot of cognitive dissonance over at the Granuiad 😀
Anyone have any idea what effect a contracting atmosphere has on surface atmosphere convection?
Is there data for atmosphere size over any time?
One of my favorite new quotes re models vs observations is this one from Rob Honeycutt:
“One thing that bothers me about the model/obs discussions is, many seem to assume that the obs are correct and the models are wrong. That fails to recognize the challenges inherent in the observations. It seems as likely as not that models could be giving us a better picture of what is actually occurring than the observations do.”
from here: https://andthentheresphysics.wordpress.com/2016/05/10/the-uncertainty-on-the-mean/#comments
Except that’s not the case. False logic
Models that are missing many components and do not actually model every aspect and as such use more simplistic fudges, cannot be relied upon because they are based on an assumption.
Measurement is empirical, this is as close to fact or proof as we can be. (This is individual measurement) NOT the global average temperature (global average is not a measurement it is an artifact)
Neither models nor surface measurements can not be even verified as giving us a good picture (in the context of AGW) because neither contribute to validation of AGW.
There are some real pseudo arguments on ATTP lol Junk
If an argument is not logical, nothing it produces is logical
The IPCC have been taking models over observation for years. This is yet more of this nonsense.
What that crackpot is suggesting is taking empirical science (measurement! not averages!) and replacing it with computer models that cant model the earth’s climate system.
Is that what you are telling us?
The problem with “observation” as you call it, is one you missed, averages are not observations, GISS does not produce observations, neither does Berkley or anyone else, those are artifacts, created by mathematics of man.
We need to fix that area, and the ATTP article suggests we replace one faulty process with another faulty process (one that has a tragic record)
They need to start teaching kids logic at 12 I swear!
You seem surprised? One assumes you are only passingly familiar with the garbage font
that is Robhon
I’m fairly new here :p
What’s he saying? That if the models don’t match the observations, we should go with the models?
It’s akin to Trenberth and his lets change the null hypothesis.
These liberals want to change the world to their view, and changing the rules of science is not a step too far, neither is changing measurement data 96 years after collecting it (repeatedly changing it)
Political movements are famous for revisionism
It’s more likely that the models and observations are equally wrong. For different reasons.
MarkW, models and observations cannot be “equally wrong”.
Since everything about observations come from real world systems, all sources of measurement error and systemic error can be identified. The observer effect is always a factor to consider, which is why standard approaches to measuring anything have to be adopted – so that the errors are at least consistent, the measurements from different observers mean the same thing, and those measurements can then be compared. (The lack of compliance to standards in the USHCN was what started Anthony’s interest in this debate – see http://www.surfacestations.org/)
Those sources of observational error can be determined, and specific statements made about the levels of uncertainty in the measurements. Corrections to measurements, based on scientific evidence, can be made when there is agreement that the corrections will result in improved data. This has been done several times over the last 30 years with interpretation of satellite measurements. (A recent article here on systematic errors gives more explanation: https://wattsupwiththat.com/2016/04/19/systematic-error-in-climate-measurements-the-surface-air-temperature-record/).
So observations are based on agreed standards; raw data may be corrected for known errors; and the resultant data still has specified levels of uncertainty.
Climate models are completely different. Firstly, as has been pointed out elsewhere here, they are built bottom up. Small elements of the real world are converted into mathematical functions. Many of these functions are stochastic, meaning that assumptions are made about the probability distribution function that best represents a particular real world event. Compromises are made, particularly around which functions to model and how much time will the model take to run. A modeller has to determine which functions are significant and need to be included, and which can be safely ignored.
Secondly, these small model elements have to be put together, much like components in a car. As the models get bigger, modellers need to check for unexpected emergent behaviour – the sort of problems that software developers face when building any large application. Before the model can be usefully applied, it should always pass through a rigorous verification and validation (ie testing) process. To the best of my knowledge, none of the climate models have gone through such a process. And numerous errors with these climate models have been identified. (see David Evan’s series starting here: http://joannenova.com.au/2015/09/new-science-4-error-1-partial-derivatives/)
In simple terms then, it is not possible to determine how wrong climate models actually are. That is why the IPCC’s CMIP5 experiment used 27 completely different models. I think they were trying to convince us using the opposite of the Delphi method – that if we accumulate enough guaranteed wrong answers, then average them, that the average will be right! An interesting example of how wrong these climate models are was pointed out by Bob Tisdale in a recent article – see the text accompanying Figures 6 & 7: https://wattsupwiththat.com/2016/03/01/climate-models-are-not-simulating-earths-climate-part-4/
As far as I am aware, climate modellers have no way of determining the uncertainty of their model output. So, no, they are not “equally wrong”.
“To hell with what you’ve observed – I’ve got a MODEL!!” LMAO
I know we are supposed to hate him as the hockey stick man, but this does sound as though he is admitting there was a problem with the models and he is trying to fix it with healthy doses of real world data.
or more probably, Schmidt threw tree rings under the bus recently, Mann threw Tom Karl’s pause buster under the bus before that.
Now Mann is throwing models under a bus lol.
Egos like those are bound to have friction
I think Robin is correct. Mann is admitting the models have flaws and he is trying to figure it out. If I understand this correctly, he did the same in his 2015 collaboration “Robust comparison of climate models with observations using blended land air and ocean sea surface temperatures” found here https://www.researchgate.net/publication/280571227_Robust_comparison_of_climate_models_with_observations_using_blended_land_air_and_ocean_sea_surface_temperatures.
in this article he called the pause a “divergence” between models (CMIP5 with both historical and RCP8.5 scenarios) and observations “after 1998” and attributed it to over estimation of climate sensitivity to co2, under estimation of natural variability, and a misunderstanding of how to use temperature data.
Maybe it is early onset, or, just maybe, he is breaking the mold and actually trying to learn from the mistakes.
Mann wrote (apparently)
If this were true then we can only conclude that the model’s error margins must be too narrow. So next one must wonder what they’re based on. And what they really should be?
What he really means is, he and the modelers dont understand how internal variability actually works.
or more simply “we couldn’t forecast it”.
Yet in his 2015 he professes statistics can predict the future
“Nobody expects that GCMs would predict the slowdown. They aren’t initialised to do that” but if models ‘predict’ a temperature rise then that’s accepted?
How can you have it both ways.
Surely models are setup to predict climate outputs, most important being temperature.
Is Nick Stokes implying they run climate models not to predict climate outputs?
I think Nick is simply acknowledging (unintentionally to some extent) that models do nothing more than reflect the input assumptions. And since the input assumptions are garbage, so are the “predictions” dropping out of the (cough) rear end…
The basic truth is, all the models are designed to do is predict catastrophic warming caused by CO2, because they assume that CO2 drives the temperature. And since this is nonsense, so are the modeled outcomes, as can be seen by comparing them with (uncooperative) reality, past and present.
Ergo, the faster warming in the last two decades of the 20th century must be ascribed to the frequent El Nino conditions in that period. You can’t have your cake and eat it too.
Global temperature is a function of several factors in space and time. The GCM models rarely account them. Even IPCC is not sure of quantitative factoring of broader contributors at global scale, namely [1] anthropogenic greenhouse gases mpact under greenhouse effect [human induced factor]; [2] volcanic activity related natural impact under greenhouse effect; [3] human induced non-greenhouse effect associated with changes in land & water use, Land & water cover. Also, the temperature curve itself is built on partial data of space. Even if, for example, you got a 100% accuate model to verify it you don’t have the 100% accurate data. Everything we presume from the air. At least scientists must work out models at regional and national level!!!!
Dr. S. Jeevananda Reddy
Worse still, the greenhouse effect is not the difference between a planet without an atmosphere and a planet with atmosphere’s difference in temperature
-19c without, 15c with an atmosphere, if the atmosphere was static that would be true, but the atmosphere does some serious cooling by evaporation so the actual effect of the atmosphere, or greenhouse effect is actually far greater than 34c, probably twice as much half of which is taken from the surface and worked around as weather.
If the surface becomes warmer, in such a scenario, + or – 1c is going to have no detectable effect, because the total effect is far greater than claimed.
When you invoke natural factors like the AMO and La Niñas to explain part of the pause,
… Now you have invoked the AMO and the ENSO over the “whole” global temperature record.
In fact, you do need these two factors (and several volcanoes) to explain all of the up and down cycles we have experienced since 1850.
And now that one can explain the up and down cycles and the pause over a longer period of time, then you have a much smaller global warming signal.
Michael Mann needs to take the next step, extend the analysis and become a skeptic. Then he will be a whole-Mann instead of a half-Mann.
We haven’t considered all of the factors though and we cant replicate many of them in the models
The climate is influenced from the ocean floor (or maybe earth’s core) to the galaxy to varying degrees. We dont even know what inputs are missing.
The way it is, Mann was working to incorporate the pause into global warming and while he was doing that Tom Karl came out and said no pause, pre empting Mann’s paper, essentially throwing it under a bus.
Schmidt three tree ring proxies under a bus not long after, and now Mann is throwing models under a bus in the politest way possible.
Hopefully these massive egos will implode the central core of the warm camp
Tom Karl’s paper really did outshine Mann’s in the media and disagreed too, alarmists loved karl’s pause buster, they though they had it made, no pause, alarmist wet dream!
There is no doubt this pissed Mann off, Tom karl sole this “thunder” baaahahahahaha
Stupid keyboard!
Next to be published in Geophysical Research Letters :
“Predictability of the recent outburst of large-scale self-evidences using statistical methods”
Captain O. Bevious, Pedro Grullo, Jacques de la Palice, A. Truism, Otto Logy, Pla Titus de Bromide.
And so the backpedaling begins……
It was the late 1990’s to the middle 2010’s.
Additionally it was not a slow down, it was a complete halt.
Even when making excuses for their own failures, they can’t help but lie.
Surely they can predict the internal variability. Their equation is: Internal variability = models – observations.
I think you might be confusing “configured to reproduce” with predicting the future.
They might not be able to predict it, but they can “hindcast” it with uncanny accuracy. 😉
The eternal question really is, why did all the Ice Ages end very suddenly? What causes a world half-encased in thick ice, to rapidly melt at an amazing pace?
The only force able to do this trick is our local star, the sun. There is no other possible mechanism for this trick. This is why studying the local star is life and death for animals inhabiting this planet.
“The only force able to do this trick is our local star, the sun”
Are you not happy with orbital changes, tilt and procession, plus volcanoes, dust, fires creating a random stew?
Geothermal, with the surface under ice, maybe the freeze happens very quickly and then it takes geothermal heat a very long time to build up and melt it all, this would maybe explain a rapid melting, because if melted from below, the surface is basically the last of the, and ice on land obviously but open oceans is enough to get things warming up gain rapidly
Precession, not procession.
The problem with you lay climate people here is the finer nuances of semiempirical estimates are completely lost on you, whereas climberliturgical experts in the field have been nuancing the semiempiricals for years.
@Observa…Well put.
“The problem with you lay climate people here is the finer nuances of semiempirical estimates are completely lost on you, whereas climberliturgical experts in the field have been nuancing the semiempiricals for years.”
A phrasing worthy of the high art of “Climate Science Communication”
“Using semiempirical estimates…”
What a fricken joke. If Boeing and Airbus used semiempirical estimates when designing structures, aircraft would fall from the sky on a routine basis.
Maybe this illustrates the real reason why Bill Nye left Boeing. Perhaps he was making engineering calculations via “semiempirical estimates” and his management thought it was so funny that they recommended he become a comedian and wannabe scientist.
or they no longer found him funny. :p
Impossible to forecast? Fancy statistics don’t work well in a chaotic system with unknown unknowns but your eyeball will give you a pretty good idea. Prof Akasofu did so in his paper back in 2008. See Fig 2b
http://people.iarc.uaf.edu/~sakasofu/pdf/two_natural_components_recent_climate_change.pdf
I suppose we all should be grateful that Mann actually accepts now that there was a pause….
Nick Stokes May 12, 2016 at 12:46 am
“Because it was intended to be read that way by a casual reader”
Scientific papers aren’t written for casual readers. They are written for people who pay attention. But “early 2010s” is a common phrasing. And it doesn’t mean 2010.
_________________________________________
I see. So, after admitting that the paper doesn’t say what a casual reader of it would think it says, your position is now that it doesn’t matter because the paper wasn’t written for “those people”. The great unwashed getting the wrong impression because the paper wasn’t written for “them”? That’s now your argument? That the great unwashed have to parse every last sentence of every science paper in excruciating detail to learn if the sloppily worded summary actually matches up to the actual science?
Wouldn’t it be so much easier to just be precise in the first place?
I shall answer that question. Well yes it would. Unless of course the goal was to manipulate perception, the hallmark of marketing, not science.
Nick Stokes said: “…For the longer scale weather (ENSO) they [i.e. the models] do show the appropriate oscillations – they just can’t predict the phasing [of the long term temperature changes].
N.B. the bracketed texts are my additions.
However the Lunar tides can be used to predict the phasing of the ~ 30 year warming and cooling climate periods!
The 31/62 year Perigee-Syzygy lunar tidal cycle is produced by the synchronization of the slow precession of the lunar line-of-apse with the lunar Synodic cycle (i.e the Moon’s phases) and the Earth’s seasons.
A detailed investigation of the precise alignments between the lunar synodic [lunar phase] cycle and the 31/62 year Perigee-Syzygy cycle over the period between 1865 and 2025 shows that they naturally breaks up six 31 year New Moon and Full Moon tidal epochs.
N.B. The New Moon tidal epochs have peak seasonal tides that are dominated by new moons that are predominately in the northern hemisphere, while the Full Moon epochs have peak seasonal tides that are dominated by new moons that are predominately in the northern hemisphere.
The six tidal epochs of the 31/62 year Perigee-Syzygy lunar tidal cycles between 1865 and 2025.
Epoch 1 – Prior to 15th April 1870 ___________________New Moon Epoch
Epoch 2 – 15th April 1870 to 18th April 1901____________Full Moon Epoch
Epoch 3 – 8th April 1901 to 20th April 1932_____________New Moon Epoch
Epoch 4 – 20th April 1932 to 23rd April 1963____________Full Moon Epoch
Epoch 5 – 23rd April 1963 to 25th April 1994____________New Moon Epoch
Epoch 6 – 25th April 1994 to 27th April 2025____________Full Moon Epoch
If you look at figure 5 of Bob Tisdale’s post at:
https://bobtisdale.wordpress.com/2016/05/12/does-ed-hawkinss-spirally-global-temperature-animation-defeat-its-purpose/
that shows the world mean temperature times series, you find that there are five noticeable increases or decreases in the World’s mean temperature between 1865 and 2015, with all except the last one spanning a period of ~ 30 year.
Period__________World mean temperatures
1880 – 1912___________ Cooling
1912 – 1943 ___________Warming
1943 – 1975___________Cooling
1975 – 2005___________Warming
2005 – 2015___________Cooling (= first 10 years of 30 year epoch?)
What is remarkable is that the transitions between a cooling and warming in the World’s mean temperatures almost precisely match up with dates that are 10 years after the transitions of the 31/62 Perigee-Syzygy tidal cycles from Full Moon to New Moon epochs.
Period________________Epoch
1880 – 1911___________Full Moon Epoch 2 + 10 years
1911 – 1942 ___________New Moon Epoch 3 + 10 years
1942 – 1973___________Full Moon Epoch 4 + 10 years
1973 – 2004___________New Moon Epoch 5 + 10 years
2004 – 2035___________Full Moon Epoch 6 + 10 years.
If this explanation is correct then the current cooling period in the World’s mean temperatures should last until about 2035.
Of course, that should have read:
“N.B. The New Moon tidal epochs have peak seasonal tides that are dominated by new moons that are predominately in the northern hemisphere, while the Full Moon epochs have peak seasonal tides that are dominated by full moons that are predominately in the southern hemisphere.”
I have a model that when two “fair dice” are rolled, the model predicts the sum of the uppermost dice faces. Unfortunately it didn’t predict that the guy in the green shirt shooting craps would make his point 10 times in a row, But it did predict he wouldn’t make his point on his eleventh pass. I’ll sell you my model for $1,000,000, Alternately, if you think my model needs improvement, you can send me $1,000,000 in grant money and I’ll give you the model after I have improved it.
And based on the GCM climate models we’re supposed to drastically change the way produce useful energy while simultaneously funding improvements to the climate models. With equal correctness, such action can be called Voodoo Science or Voodoo Economics–take your pick.
Hmmm….so the models couldn’t get the last 20 or years right but we can trust them enough to act on their output?
I wonder if he’s positioning himself to be perceived as more “trustworthy” than he has been?
“Well, yes, there was a pause…but just wait till this summer!”
Mann’s attitude towards models in this paper can best be stated as — Caesar is ass but all hail Caesar!
Eugene WR Gallun
But… but… but… they told us the AGW was unstoppable. All those tipping points, all those 5 or 10 year predictions if we didn’t stop CO2 NOW…
Did they lie to us all?
For MONEY?
MarkMcD — You cynic, you. Believing the worst about those people! — Eugene WR Gallun
Surely perusal of the graphs showing the global temperature history from 1880 should have provided a strong hint that another pause in temperature rise might well occur around the year 2000. That it did occur (beginning in 2002 the way I interpret the graphs) should give credence to the presence of a pattern of temperature change that appears to be predictable. Any conclusion that the pause has ended appears to be premature. Events like El Nino are distractions from the underlying pattern of temperature change and should be ignored for purposes of accurately evaluating that apparent pattern.