An evaluation of the use of min/max temps to determine average temps, and a comparison of three observation times.

Guest essay by: Robin McMeeking
I was an Air Force weather observer in the early 1960’s and have retained an interest in weather things. Later in in my civilian career I spent many years developing software. Several months ago while reading about adjustments that had been made to the historical temperature record it piqued my interest. I was initially surprised to learn about the reliance on min/max thermometers in these early records.
But in the days before flight there wasn’t any need for regular systematic tracking of temperature. At any rate much of the historical temperature record is based on averaging min/max values. To be useful these values need to be recorded daily at reasonably close to the same time of day. This record keeping was done by volunteers reading thermometers at selected locations. The assumption is that the volunteers were fastidious in performing this task.
It’s not intuitive, but has been recognized for many years that the time of day used for the readings can exert some bias toward higher or lower average temperature determinations. It’s called Time of Observation Bias (TOB). I was not convinced by the explanations of the reasons for TOB, but I was even more dubious about the validity of relying min/max values to calculate an accurate average temp.
So, when the issues about TOB and average temps came up I was interested in performing some analysis, but didn’t have any data to work with. Some time later I discovered the network of Personal Weather Stations (PWS) on Weather Underground. Eventually I found that daily historical data from the PWSs can be downloaded (one day at a time!). Fortunately I was able to develop software to perform the downloading. And when I was almost done with my preliminary analysis I reread some of the posts on TOB and discovered the NOAA and other sources of official temperature data. Oh well!
I wasn’t trying to look at climate trends, I basically wanted to evaluate the suitability of using Min/Max temps to derive daily average temps. And I wanted to simulate a variety of observation times. I selected 16 PWS’s from around the US and downloaded all of 2015 plus 1/1/16 to allow for shifting observation times (well over 1.5 million records).
Most of these PWS’s record at 5 minute intervals, a few at 15. I calculated a mean temp from the min/max values in each 24 hour period, averaged all of the reported temps, and averaged the last reported temp in each hour to simulate what would be available from historical WBAN records (like we did in the ’60s). I evaluated TOBs of midnight, 0800 and 1600.
I selected PWS’s that are in rural locations, but I realize that I have no information on the suitability of the siting of any of these stations. That bothered me so when I finally became aware of NOAA data (after I was done with the PWS stuff) I downloaded data for one station from NOAA and performed the same analysis. Results from that data were consistent with the PWS analysis.
Below are tables of the summarized data. If you know of anyone that would like to see results from the intermediate steps (daily totals with monthly summaries) I’d be happy to share it. What I have concluded is that Min/Max method tends to yield a higher value than the more inclusive averages at all three TOBs, with 1600 being worst and 0800 being “best” of the times I tested. Averages based on hourly readings (which frequently don’t include the max &/or min) are virtually indistinguishable from averaging all readings.
The tendency of Min/Max to be high led me to wonder how much time per day is spent with temp above or below the mean. The results on that surprised me. Shown in the tables below.
Based on 12 months of data for 2015. All temps in Farenheit.
![tob00[1]](https://wattsupwiththat.files.wordpress.com/2016/05/tob001.gif?resize=720%2C544)
![tob08[1]](https://wattsupwiththat.files.wordpress.com/2016/05/tob081.gif?resize=720%2C548)
![tob16[1]](https://wattsupwiththat.files.wordpress.com/2016/05/tob161.gif?resize=720%2C548)
Note from Anthony: Some readers might suspect the PWS network has exposure and placement problems, like the NOAA network, and they would be right. However, since he isn’t looking at trends, just the diurnal variation of temperature and the issue of recording times, in my opinion, that issue doesn’t apply here.
I believe there is a lot that can be done to improve the quality of adjustments. First of all, are TOBS adjustments really needed anymore for most stations? Aren’t most of the stations now automatically recording temperatures at regular intervals? Secondly, when it comes to “homogenization” and correcting for station location / equipment changes, shouldn’t the closest CRN station be used as the reference? The CRN stations should, in theory, provide a rock solid reference in a location that hasn’t undergone nearby land use or station siting changes. Why aren’t CRN stations used as the reference for USHCN station adjustments?
“Why aren’t CRN stations used as the reference for USHCN station adjustments?”
Because that would push the adjustments in the “wrong” direction.
“First of all, are TOBS adjustments really needed anymore for most stations? “
In terms of current readings, no. In the period with hourly or better data, it’s not relevant. Both TOBS and general homogenisation are needed principally to relate more distant past measures to present. That’s why CRN isn’t a big help. They don’t cover the period that is needed.
Then maybe it is time to break the data into two separate series — a legacy series and a modern series which requires no such adjustments. We can “freeze” the legacy data series where it is with no further adjustments needed there, either.
We need to also apply proper error bars to the legacy data.
Error bars that are larger than maximum variation over the entire record make data analysis unfun. Isn’t it good to have fun?
What Nick Stokes says is correct. (Well, for the metadata-rich USHCN, there is no real need to homog past maybe 1975. But for the as of yet sparse, spindly, poorly distributed, inhomogenous, GHCN, there really isn’t a lot of choice.)
The problem arises, however, that homogenization is incorrectly applied, failing to account for a systematic bias in the dataset. Doing so would take a healthy slice off Tmean LST trend. As, as the more alarmed sometimes put it, the LST is where we live.
I agree, however, that raw data other than CRN-equivalent won’t do. Just won’t. The trick is to get the adjustments somewhere in the vicinity of right. (I don’t think the answer lies in either the data smearing of NOAA or the data vivisection of BEST. Not for the last 40 years of USHCN, anyway.)
Except the majority of documented U.S. station inhomogeneities occur post-1975…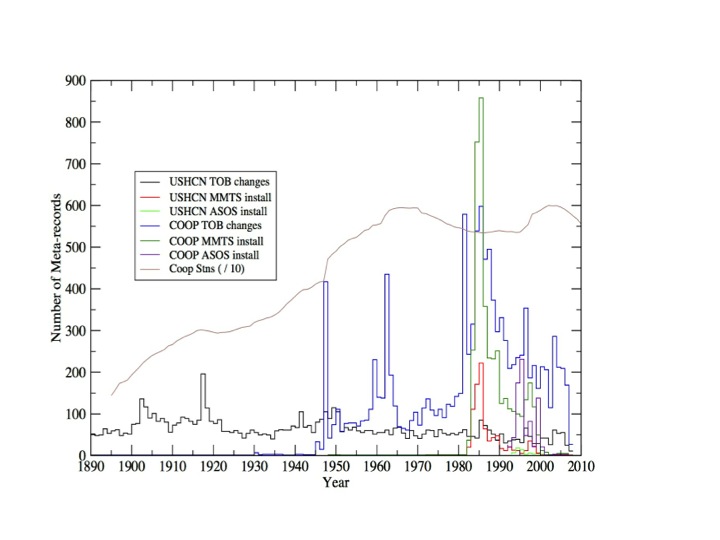
For folks interested in exploring TOBs biases in more detail and looking at their impact on trends, I’d suggest this post from a few years back over at Judith’s blog: https://judithcurry.com/2015/02/22/understanding-time-of-observation-bias/
Except the majority of documented U.S. station inhomogeneities occur post-1975
Why would Obama era changes to the record be in what is arguably the best data? The US has gone from 30% to 50% of the global stations in the post 1990 period it is claimed. And there are satellites and such.
It should be easy for US climate people to determine what mistake they made post-1975 that made the stations inhomogeneous and correct it so the stations weren’t inhomogeneous, and didn’t need to be homogenized.
It really sounds like someone has mistaken temperature data for milk.
Back in the 1960s the warmists of the day predicted 7 degrees of warming by the year 2000, accompanied but 10 feet of sea level rise.
Since that didn’t happen, we are left straining to discern tenths or even hundredths of a degree of warming from 100+ year old data.
Is tobs real? Perhaps. It’s it relevant? Not really.
Same goes for the nearly imperceptible “anthropogenic” component of climate.
Well I have a fundamental issue with the min/max daily temperature concept.
For starters, reading between the lines, of the author’s post, it sounds like what is NOT recorded is the actual minimum, and the actual maximum temperature for the day. And it sound like the author would prefer to take those readings at two fixed times each day.
Well as a general rule, we can say, that the maximum temperature for the day, will not occur at the same time as the minimum temperature for the day does, unless the temperature never changed at all during that particular day.
But in any case, the daily maximum and the daily minimum (true actual maxmin) do not satisfy the Nyquist criterion for sampled data systems with a dominant one cycle per 24 hours temperature cycle.
Those samples would only be valid IF the daily temperature record, was a strictly sinusoidal variation with a 24 hour period, with ZERO harmonic frequency components, or anharmonic higher frequency components.
In that case, the true min and max would happen exactly 12 hours apart, and those two values, presumed to be recorded when reached, could be read into the record at any subsequent time, and would constitute a valid set of samples.
But the daily temperature cycle cannot realistically be a pure 24 hour sine wave, in which case, two samples per day equally spaced would not be valid data. And unequally spaced, they would be even less valid, as only the longest time interval between two samples is relevant.
So I’m skeptical of min/max readings, so it’s good to read that the author here has his reservations about it as well.
A correct non-aliased daily average cannot be obtained from just min/max readings for the day. At least four equally spaced readings for the day, would likely give a more correct average.
G
“For starters, reading between the lines, of the author’s post, it sounds like what is NOT recorded is the actual minimum, and the actual maximum temperature for the day.”
For a large part of our temperature record, what was recorded were the actual min and actual max for a 24-hour period ending at the time of obs. There’s not much point in wishing it were something else – that is what we have. It’s true that there is a TOBS bias depending on that time of obs. That mainly becomes important if the time changes. In analysing past climate anomalies are generally used, where consistent biases subtract out. Fortunately, it’s reasonable to expect that the TOBS bias doesn’t change very much over years, since it depends on the pattern of diurnal variation. So with modern hourly readings, it’s fairly easy to calculate and adjust for.
The data is what the data is. True.
On the other hand, if the data quality is not up to the job of trying to determine temperature drifts of a few tenths of a degree per century, then no amount of hand waving or turd polishing will make it so. No matter how much some people want it to be so.
> reading between the lines, of the author’s post, it sounds like what is NOT recorded is the actual minimum, and the actual maximum temperature for the day.
Well, my reading between the lines say that temperature data every 5 minutes for 366 days from 16 stations is less than 1.5 million data points. The WeatherUnderground displays high/low data, so I conclude it was available to Robin and she downloaded it which explains “well over 1.5 million records,” if you adjust records to data points. 🙂
it’s reasonable to expect that the TOBS bias doesn’t change very much over years, since it depends on the pattern of diurnal variation. So with modern hourly readings, it’s fairly easy to calculate and adjust for.
The TOBS is somewhat site and temporally dependent.
The temperature profile of pristine areas is different than areas that have been altered by man. Even bare dirt (particularly when the surface has dried out) doesn’t perform a lot different than asphalt. Which is wildly different than trees and grass. So the current temperature variation in many locations is somewhat different than in the past.
Further the modern diurnal temperature range is getting compressed – presumably by CO2. So it isn’t the perfect guide to TOBS adjustment.
Assuming you could accurately compensate this still doesn’t explain the almost monthly change in historic temperature adjustments which didn’t kick into high gear until after Obama was elected. They have changed almost as much as the history books and I didn’t think either was a moving target.
Since you are adding an adjustment with its own error to historic temperatures, the result even if theoretically less biased will have larger error bounds.
Finally the theoretical “harm” from more CO2 is almost exclusively due to the high temperatures so isn’t that the trend we really should be tracking?
“There’s not much point in wishing it were something else – that is what we have.”
Sure. But then you go extract conclusions from low quality data for the precision you claim…
Nick, if the thermometer does record permanently the true exact maximum temperature, and the exact minimum temperature, it matters not at what time of the day those numbers are read. Certainly the time at which those extrema actually occurred does matter.
There’s no need to read the thermometer numbers (min-max) at any specific time of the day.
But if they do not occur 12 hours apart (why would they) then the maximum time between samples is the longer of the two periods, and is the one that defines the maximum band limited signal frequency that can be correctly sampled.
I agree that hourly data will yield more valid samples. The time of the day, that the extremes occur is not relevant.
G
Correct me if I have misread, but the temperatures here are taken at short intervals throughout the 24-hr period, and the min and max are taken as the lowest and highest readings. The statements about TOBS relate to this method and AFAICT are valid for that method. But I understand that some weather stations in the past used min/max thermometers. That means that they record the actual min and the actual max, regardless of the time of day at which they occurred. The thermometers were read at a fixed time of day which was not midnight, so some of the period being measured was attributed to the day before. At some time in the past, they changed the fixed time of day at which the readings were taken. This introduced a different TOBS problem, because the risk that a min or max temperature would be attributed to the wrong day was changed. So for example, in simple terms, if a min temperature on a cold day occurred near TOBS so that it was similarly cold on both sides of TOBS, then that cold temperature could end up being the recorded minimum for that day and for the day before. If you change TOBS then the risk changes.
I think averaging min/max to get mean leads to being able to hide or throwing away good data.
I think daily min max is a chance to test the thermal response of the atm to a very well controlled input of a lot of energy, and seeing it response for differing inputs.
The derivative of the min and max temps are very insightful, but it shows that what is happening to our climate now can not be a effect of a global forcing, but is from regional changes to min temp.
“””””….. To be useful these values need to be recorded daily at reasonably close to the same time of day. …..”””””
I didn’t say that; the author of the story did.
A Min-Max thermometer is supposed to capture and save these values at the precise time that they actually occur.
So now comes the confusion. Does the author mean that the THERMOMETER needs to record these values at the same time (roughly) each day ? OR does the author mean that the OBSERVER needs to read the thermometer at roughly the same time each day ?
At MY first reading, I took it to be the latter; but if the OBSERVER is RECORDING the thermometer Temperature at the same time(s) each day, then clearly there is no assurance that those readings are in fact the daily min and max values, because it doesn’t matter one iota, what time of the day the observer reads the CAPTURED min-max values.
In general, the observer can have no control over what times of the day the daily min, and the daily max actually occur and get captured by the THERMOMETER.
So if the min and max temperatures happen to be spaced, somewhere from say one hour apart to 23 hours apart, then clearly, the value of the min max average, is not a good measure of the actual daily average Temperature.
Cloud variations throughout the day could make the spacing of the extreme values, almost anything.
In any case, unless the min-max time interval is 12 hours (perhaps 11 -13 range), then the min-max average would NOT be a good average daily Temperature for that day, and would imply there were aliasing errors.
It’s somewhat academic anyhow, because the spatial sampling of the global Temperature is a total joke, except perhaps for the satellite scanning data.
A min-max daily pair of samples can only be a valid Nyquist sample, in the degenerate case where the daily temperature cycle is a pure sinusoid with a 24 hour period, and that just barely makes the cut.
That implies no clouds.
Well it all seems self flagellation to me; anyhow. The different thermometers aren’t all read at the same times, so that spatial temperature differences at any given time are unknown.
But if the author is suggesting that min-max daily samples are inadequate, I would certainly agree with that; although I would use a somewhat different word from “inadequate”.
G
” But if the author is suggesting that min-max daily samples are inadequate, I would certainly agree with that; although I would use a somewhat different word from “inadequate”.”
And in the global summary of days data set, mean temp is an average on min and max.
But I still think calculating the derivative based only on 2 values for min, and 2 values for max in sequence is the best use of the only surface data we have. And the a straight average of the derivative based on actual measurements of the stations by area have the most useful information and is not infected with bias.
I’m now calculating daily solar watts, which is a sine wave (well close enough ), that should cause the most change, and then weather reduces the response to the solar.
I m working on CS daily and seasonally.
Nick writes
But if the time read was random, then it wouldn’t be an issue either. And I rather suspect that human nature being what it is, that the readings were much more random than they were reported as being…
I authored the the piece and want to address some aspects of the comments by various folks. First, min/max thermometers of the pre-electronic era are divided into two sides connected through a U-tube. As the mercury on one side goes up the other side goes down. There is a steel rod inserted into the mercury column on each side of the thermometer that floats on the mercury. It fits snugly enough that when the mercury its floating on goes down the steel rod stays at its high point. One side goes higher with higher temps, the other side goes higher with lower temps. When the thermometer is read it is reset by using a magnet to pull the steel rods back into contact with the mercury. There is no clock mechanism involved. The thermometer just shows the highest and lowest temps since it was last reset. See one here: http://www.sperdirect.com/min-max-thermometer-with-magnet-366-prd1.htm
As for the min/max values used in my analysis I relied on the highest and lowest values reported at the 5 minute intervals. True, this may not include the actual high or low for the day. However, since the averages I got with 5 minute values are virtually identical to hourly values, I don’t think it introduces a meaningful error.
One comment doubts that I used over 1.5 million records. 12 (readings / hr) * 24 (hours) * 365 = 1,681,920
Q) “First of all, are TOBS adjustments really needed anymore for most stations?”
A) Absolutely…without proper adjustments the true “Adjusted Temperatures” can’t be measured and only RAW data could be used. We all know that the RAW data has too many cold bias errors that must be adjusted out.
Q) “Aren’t most of the stations now automatically recording temperatures at regular intervals?”
A) AYUP
Q) “Secondly, when it comes to “homogenization” and correcting for station location / equipment changes, shouldn’t the closest CRN station be used as the reference?”
A) Most definitely not. It has been discovered that, 97% of the time, the closest CRN station is generally reading a cooler temperature than the automated station so the records must be searched to find the closest station with a warmer bias prior to making adjustments and homogenization AlGoreithms applied.
Q) “The CRN stations should, in theory, provide a rock solid reference in a location that hasn’t undergone nearby land use or station siting changes. Why aren’t CRN stations used as the reference for USHCN station adjustments?”
A) The CRN stations Do, in practice, provide a rock solid reference in a location that hasn’t undergone any alterations and as such are better determiners of temperatures, but because of this cannot be used as reference because they will make the adjusted data look bad.
LOL………
I appreciate the many people that have special ability that I lack.
‘AlGoreithms’ = precious
What is missing from the article is a comparison to the effects of TOBS adjustments to the averages.
The article does a great job of analyzing the TOBS max/min averages to a true daily average… Not that there is a true ‘average’ for any given day, year, century.
“A) The CRN stations Do, in practice, provide a rock solid reference in a location that hasn’t undergone any alterations and as such are better determiners of temperatures, but because of this cannot be used as reference because they will make the adjusted data look bad.”
CRN is the WUWT gold standard
Hypothesis: If you compare all the ‘bad stations” to the Gold standard, The bad stations will
have different trends. because they are biased.
Test That
http://www.ncdc.noaa.gov/temp-and-precip/national-temperature-index/time-series?datasets%5B%5D=uscrn&datasets%5B%5D=climdiv¶meter=anom-tavg&time_scale=ann&begyear=2005&endyear=2016&month=3
Opps all the “bad stations” produce the SAME ANSWER as the gold standard. Actually they run a “bit”
cooler.
why?
Because the errors in bad stations tend to cancel.?
because “bad stations” are not really bad. They just dont meet overly stringent siting guidelines.
There’s that figure again 97 percent
Actually they run a “bit”
cooler.
why?
====
because they were adjusted that way
Steven Mosher May 5, 2016 at 7:17 pm
Opps all the “bad stations” produce the SAME ANSWER as the gold standard. Actually they run a “bit”
cooler.
why?
Because the errors in bad stations tend to cancel.?
because “bad stations” are not really bad. They just dont meet overly stringent siting guidelines.
All that proves (since the 2005 installed USCRN predates Obama) is that this limited them to torquing the 1975-2005 data and relying on the “rising tide lifts all boats” effect to give them new records.
Let alone the mean vs nice average issue. For CO2 the variance decline means the ‘mean average” trend is higher than the “nice average” trend.
And just because errors cancel for a period doesn’t mean that they will continue to.RE: the RSS removal of a cooling bias and finding a NOAA-14 warming bias that they (for the time being) aren’t going to correct.
The RSS reasoning on NOAA-14 follows the general US climate network reasoning of “bad data+good data” better than “good data”.
A map plot of the USCRN vs ClimDiv vs USHCN individual station trends might be interesting,comparing the broad averages as computed and claimed by them doesn’t tell you much. I plotted out Gaylord, MI and it had a negative temperature trend and a negative surface trend. If the stations have a negative surface trend by definition that means the land is cooling.
And this is NOAA not GISS anyway. What does USCRN vs GISS look like?
Anyway the claim that the USCRN is warming needs closer inspection.
Ushcn is used to adjust uscrn.
If you doubt this, look at the starting values of the anomalies for uscrn.
Hint, it isn’t zero.
“I believe there is a lot that can be done to improve the quality of adjustments.”
There are many different approaches to homogenization. these methods are tested
by applying the in a double blind fashion to synthetic data. They are scored
for accuracy. In the global record the difference between raw and adjusted is
rather slight ( on the order of 10-15%) So the window for improvement is slight.
Nevertheless all improvements are welcome:
“First of all, are TOBS adjustments really needed anymore for most stations? ”
1. TOBS adjustments are concentrated in the US. canada, norway, japan and austrialia
may also require them. It depends on you station selection.
2. For the US TOBS adjustments are made once at some point in the past. The adjustment is not continuous.
“Aren’t most of the stations now automatically recording temperatures at regular intervals?”
Not really. And even if they were we still need to reduce it to Tmax and Tmin
Secondly, when it comes to “homogenization” and correcting for station location / equipment changes, shouldn’t the closest CRN station be used as the reference?
CRN is only in the US. for the most part NON CRN stations match CRN stations.
Futher CRN only exists from 2000 on. You need to adjust records before 2000.
The CRN stations should, in theory, provide a rock solid reference in a location that hasn’t undergone nearby land use or station siting changes. Why aren’t CRN stations used as the reference for USHCN station adjustments?
1. CRN starts in 2000 ( a couple stations)
When I watch a local weather report, they tell me what the max and min temps are expected to be over the next 4 to 10 days.
If the max is just average, and the min is somewhat elevated, I don’t think that hot weather is on the way. I guess if I was a “climate communicator” I would have to be re educated to believe that less cold = hot and less basic = acidic.
But until that happens, I will continue to use my brain and common sense to argue that if we want to observe global warming trends we should be looking at max temperatures.
TOBS is a small part of the total adjustments to the historic record. Was this ever adjusted for?
Jo Nova has a report on the work of a retired scientist. He is in Australia and validates the findings of a scientist in Germany. (Reported at NoTricksZone.)
The last couple of days I posted on an 8.5 year side-by-side test conducted by German veteran meteorologist Klaus Hager, see here and here. The test compared traditional glass mercury thermometer measurement stations to the new electronic measurement system, whose implementation began at Germany’s approximately 2000 surface stations in 1985 and concluded around 2000.
Hager’s test results showed that on average the new electronic measurement system produced warmer temperature readings: a whopping mean of 0.93°C warmer. The question is: Is this detectable in Germany’s temperature dataset? Do we see a temperature jump during the time the new “warmer” system was put into operation (1985 – 2000)? The answer is: absolutely
TOBS is a small portion of the adjustments to the historic record.
Jo Nova has a report on the work of a retired scientist. He is in Australia and validates the findings of a scientist in Germany. (Reported at NoTricksZone.)
The last couple of days I posted on an 8.5 year side-by-side test conducted by German veteran meteorologist Klaus Hager, see here and here. The test compared traditional glass mercury thermometer measurement stations to the new electronic measurement system, whose implementation began at Germany’s approximately 2000 surface stations in 1985 and concluded around 2000.
Hager’s test results showed that on average the new electronic measurement system produced warmer temperature readings: a whopping mean of 0.93°C warmer. The question is: Is this detectable in Germany’s temperature dataset? Do we see a temperature jump during the time the new “warmer” system was put into operation (1985 – 2000)? The answer is: absolutely
In the global record the difference between raw and adjusted is
rather slight ( on the order of 10-15%)
====
In the global record the temperature increase is rather slight…….10ths of a degree
Steve: Corrections for TOB are an example of temperature adjustments that have been proven to correct a demonstrable bias. Does anyone actually use TOB corrections anymore – or do we just talk about it?
Does BEST make use time of observation metadata? Or do you rely on the “splicer” to separate records at when changes in TOB produce a significant inhomogeneity?
In the US (3%? of global land area), we have documented changes in time of observation along with papers that properly quantify its bias and prove that it can be accurately corrected. The US record CAN be corrected for TOB. Is this practical in the rest of the world? Aren’t global temperature records corrected by looking for empirical inhomogeneities and ignoring whatever metadata about changes in time of observation that might exist? Is the TOB-corrected US data feed into homogeneity correction algorithms when creating a global record?
Using USCRN stations as a reference for HCN stations adjustments? I published a paper on that very subject: http://onlinelibrary.wiley.com/doi/10.1002/2015GL067640/full
Paywall-free version here: http://www-users.york.ac.uk/~kdc3/papers/crn2016/CRN%20Paper%20Revised.pdf
Short answer is that most U.S. stations are still volunteer-managed min/max thermometers and are still subject to homogeneity issues (station moves, instrument changes, and yes, still TOBs changes). CRN stations are included in the pool of stations used to check for inhomogeneities in HCN (and all co-op) stations. Homogenization tends to make USHCN stations much more similar in record to proximate CRN stations during the period of overlap, even when CRN stations are excluded from the pool of stations used for homogenization.
A recent study done of the TOD Bias adjustment showed clearly that there is a bias of using the (min + max)/2 over the continuous average temperature. During summer months min + max produces a higher temp by up to 0.6C. During winter months it produces a substantial similar lower bias. Depending on the length of winter vs summer months this can produce an overall bias. This has not been counted. The report I read suggested that due to the nature of most places inland there is a small higher bias and over-reporting of temps. However, they don’t bother to “adjust” for that.
A more substantial problem was reported due to the inefficiencies of the screens and other methods that mask thermostats. Using a sonic means of measuring temperature they are able to eliminate all issues about humidity and get a thermodynamically extremely accurate measure of temperature. The units for doing this are way more expensive than a thermostat but study using this showed that depending on air speed and other factors the thermostats report temperatures that are off substantially.
I have a blog at https://logiclogiclogic.wordpress.com/category/climate-change/ that talks about “what is a temperature anyway?” A large portion of the temperature change seems to be happening as higher lows in the middle of the night. For various reasons another study found that nighttime temperature measurements are much more inaccurate than day temps especially around structures the increased airflow tends to mix the air better producing a much higher temperature reading at night.
Of course we all know temperature is relative to the humidity in the air and the wind speed. If the temperature were up 1C but air speed went up 1km/hour on average would it actually feel cooler? If the humidity dropped a little the high temps might seem a lot milder even if 1 C higher. What does it mean to compute an average temperature when there are so many micro-climates. In my area alone within a square mile temperatures vary by 2C easily. What is the average temperature of my area? Depends completely on the stations you choose. What if you use only one station in my area that is more shielded from the wind? To ferry out a 0.4C difference in 70 years over the entire globe is kind of absurd.
Lastly consider the temperature of the surface of the ocean which comprises 72% of the surface area of the Earth. It is limited to a minimum of 0C and the variation a foot above the ocean is meaningless. Nothing lives a foot over the surface of the ocean. Almost everything lives IN the sea. So, what is the meaning of temperatures above the ocean? What about all the ice regions of the Earth where nothing lives above the surface. Should this get the same weight? What are we trying to do with temperature?
If you are at all interested in this subject I think my blogs at : https://logiclogiclogic.wordpress.com/category/climate-change/ would be interesting.
much of the historical temperature record is based on averaging min/max values. To be useful these values need to be recorded daily at reasonably close to the same time of day
Why? All that should be required is to record them after they are reached. If the temp peaks around 3 PM reading the max at 9 PM shouldn’t change anything. This is assuming the thermometers keep the max values like medical thermometers do and need to be reset. Similarly, for min temps. If there is no actual max/min mechanism and reliance is placed on hourly readings then I still don’t see the need as long as the hourly reading doesn’t become a 2-5-whatever hour reading.
Is it important to know what hour the peaks occurred?
You are right. For calculation of daily mean it is not important.
Because the average value of a daily min, and a daily max, even if correct values, is not a correct daily average temperature for the day, UNLESS the daily temperature cycle is a PURE 24 hour SINUSOID.
Nyquist criterion failure will result in aliasing noise at zero frequency, which means even the average value is corrupted.
As Nick Stokes suggests, an hourly reading regimen is much more credible.
G
Which is irrelevant to my question. The statement appeared to me to say that max/min should be read at close to the same time every day. I can see no reason for this. The values will be what they are and will occur when they occur. As long as the reading is taken after they have been reached then the time of the reading is unimportant.
DAV; I’m in total agreement with you. When they read the thermometer is not relevant. When the min – max values occurred is.
G
Changing the time of observation CHANGES the observed Tmax and Tmin.
https://judithcurry.com/2015/02/22/understanding-time-of-observation-bias/
If you change the TOB, the recorded Tmax and Tmin will change.
This has been discussed ad nauseum By John daly ( yes and adjustment is needed)
By Steve mcIntyre, by many studies.
You can get CRN data and see for yourself.
Take CRN hourly
Define a time of observation, start with 00:00
Calculate Tmin and Tmax
Change the TOB to 01:00
repeat
This is what Zeke shows in his post.
Changing the TOB will change the Tmax and Tmin
Assuming that it makes no difference has to be PROVEN with DATA. not words.
If you get the data you will see. Changing the TOB changes the Tmax and Tmin
This test was done by skeptics LONG AGO
JerryB on John Daly’s site
🙂 The question is – what is the correct daily mean temperature in the historical records where you had just max/min temperature?
Please read the post before you comment. See the difference between the 0800 and 1600 TOBS? Likely what’s happening is that if there’s a warm afternoon followed by a cold front or at least a cloudy day, then the temperature around 1600 will likely be close to the high temperature for both days. I’d guess the effect is less pronounced at 0800 because the difference between morning temps often isn’t that pronounced.
I may dig up some samples from my records. Well, no – no time this month….
Yes, please. The comment was about the need to read the max/min temps at the same time of day which has nothing at all to do with when they occur. You are familiar with max/min thermometers, yes? They record and hold their value until reset. So, while you may want to know then when of the peaks it doesn’t seem to be universally recorded.
The problem comes about due to resetting the Max/Min thermometer. Doing it at 1600 will lead to several instances of maxima close to each other. Suppose it’s 83 F at 1530, goes down to 82 F at 1600, and the next day is a lot cooler. The high for the first day will be 83 F, the high for the next day will be 82 F and instead of having the expected 24 hour separation between highs, its half an hour. The high may wind up occurring nearly 48 hours later. The problem is that two temperatures from essentially the same time are used for two days.
The same thing can happen with a midnight reading – if I’m in the warm part of a storm at midnight, then the cold front sweeps through at 0200, that midnight temperature mucks up the max/min average for the day. Fortunately, that only happens a couple times each year.
The liquid max/min thermometers used by the weather service and also the consumer grade one from Taylor both use metal markers that are pushed by mercury and don’t pull back. At the reading time, they’re reset via gravity or a magnet.
Awhile back I used hourly CRN data to see what, exactly, would happen for all the possible definitions of day (midnight to midnight, one AM to one AM, etc.). By comparing all of these to a midnight to midnight result you can see exactly how TOBs affects the temperatures you observe.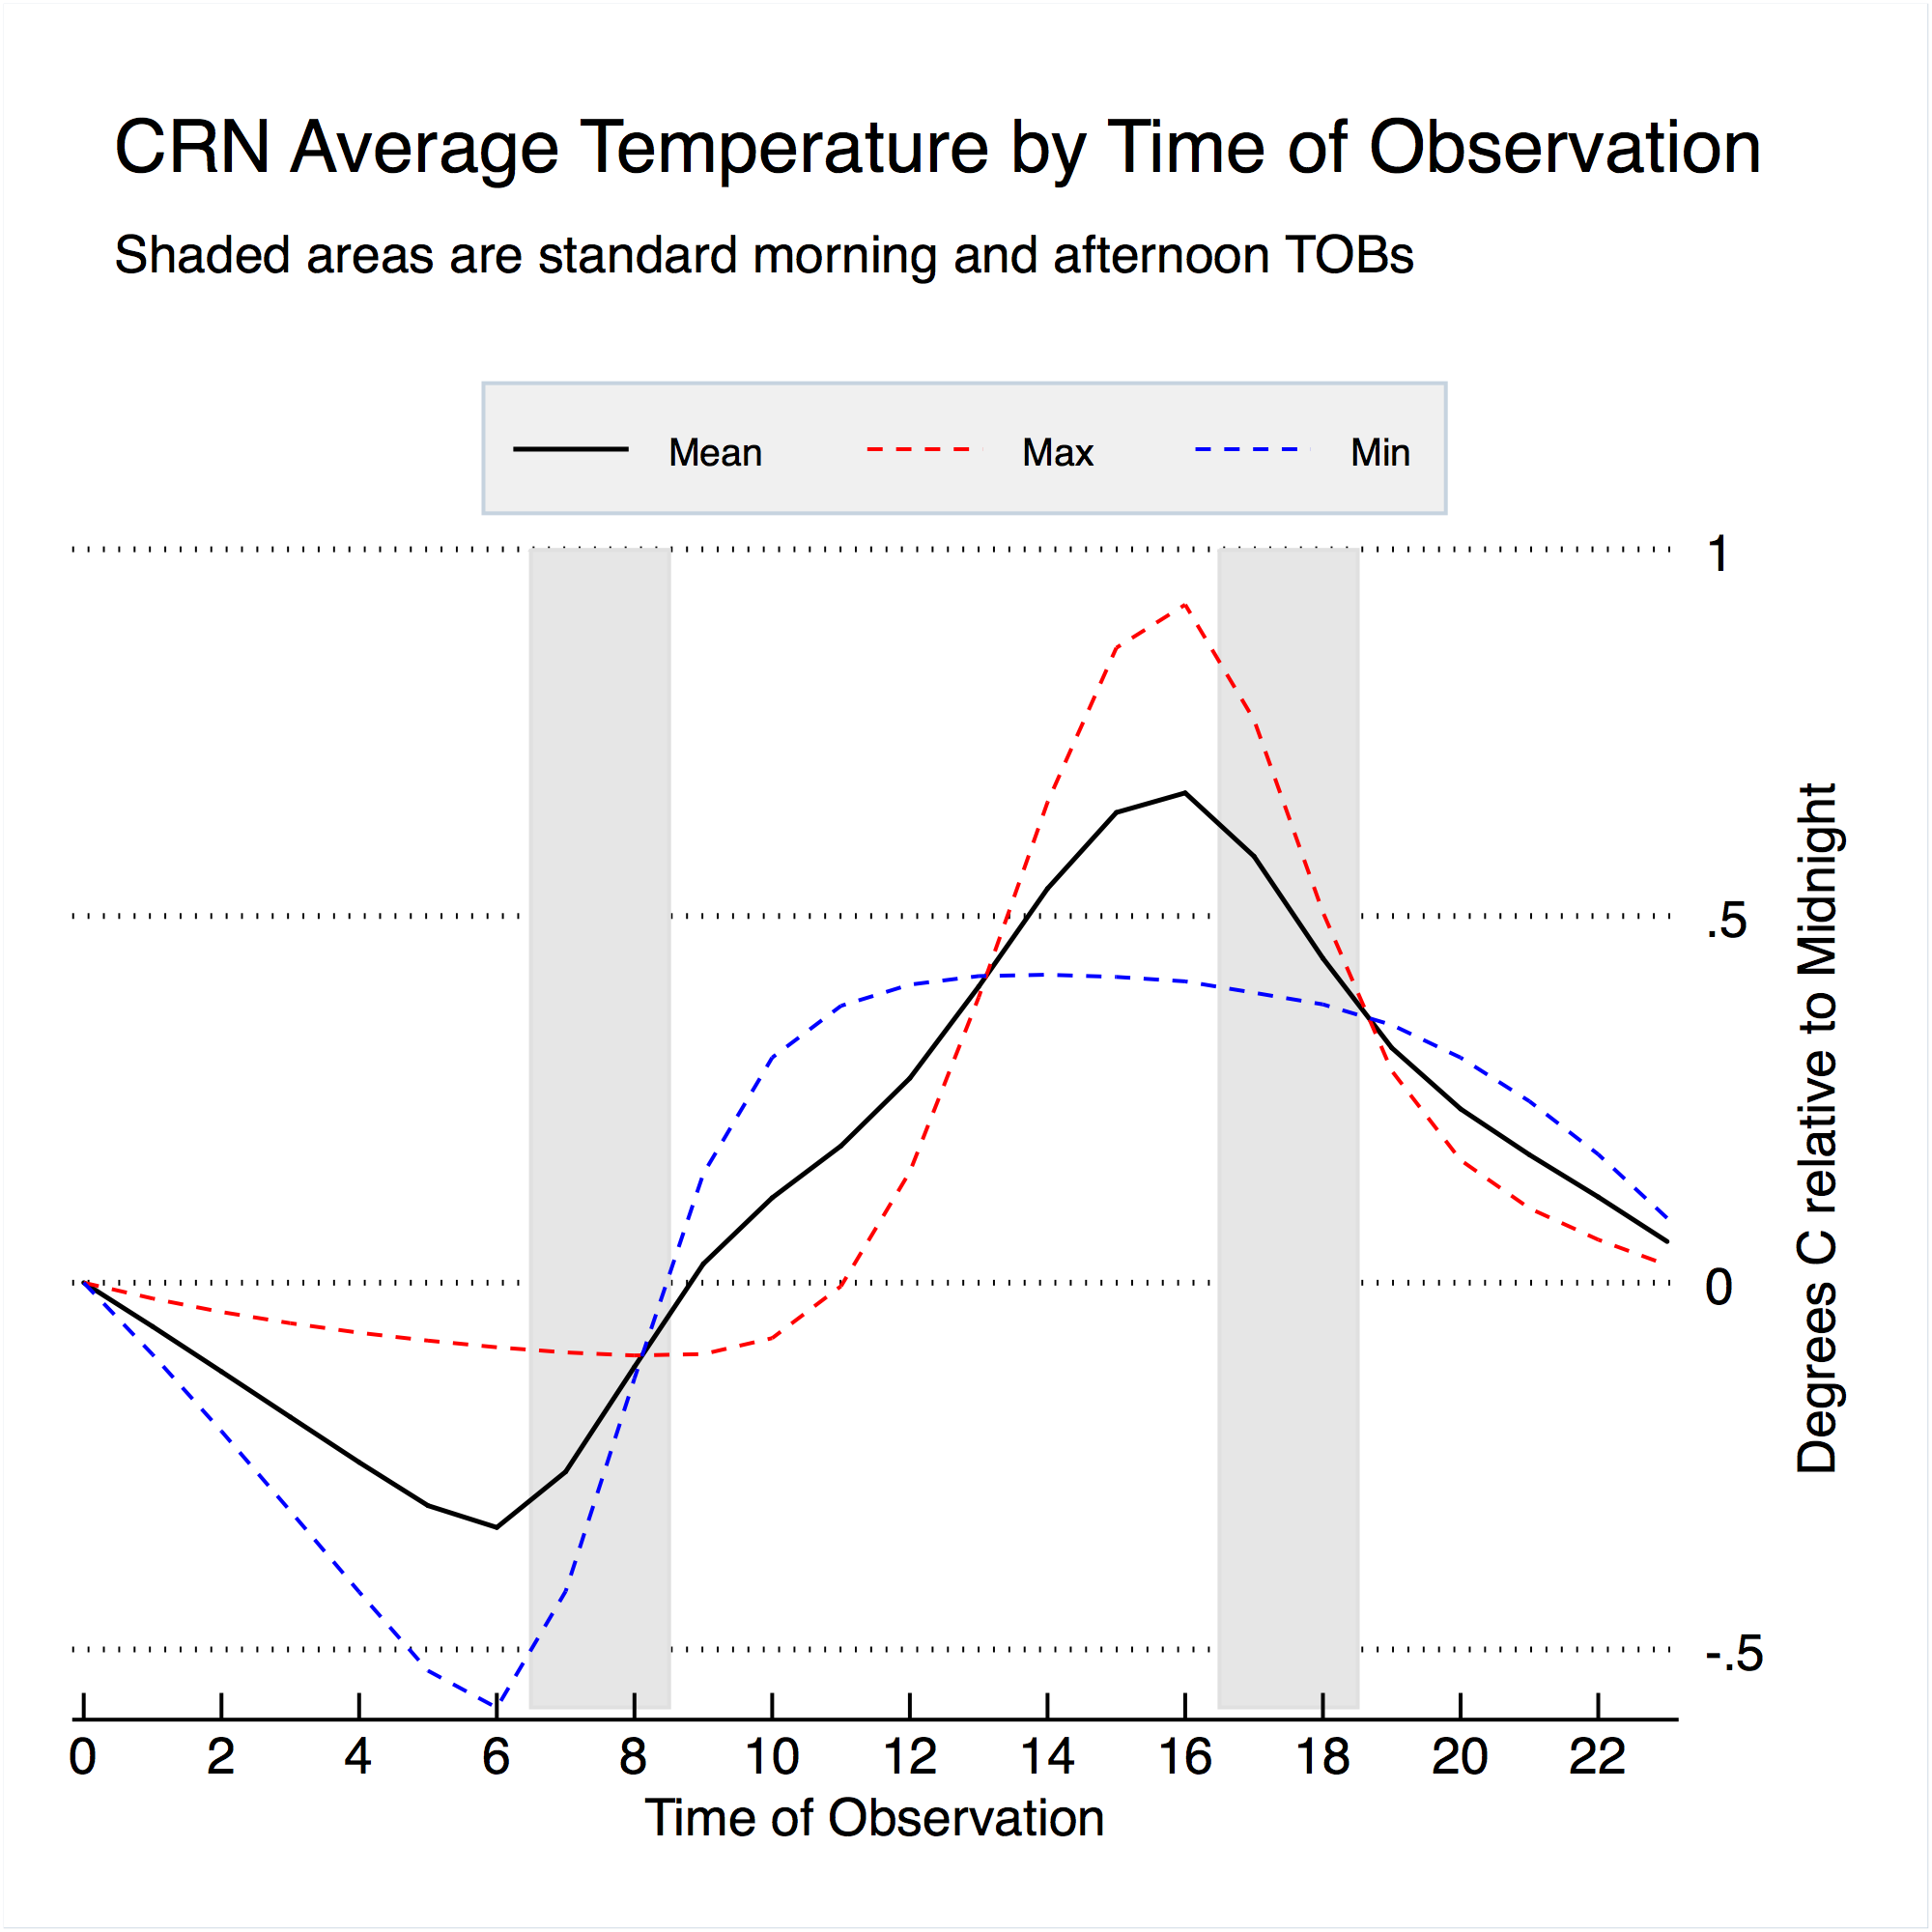
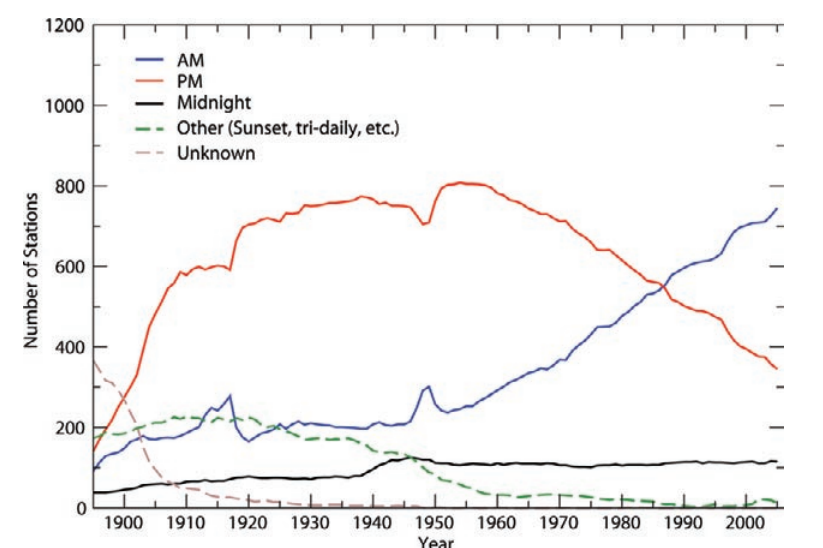
Now, as long as TOBs remains unchanged its not an issue; the absolute temperatures will be a bit biased but the trends will generally not be. Its when you change the TOBs that you get a bias, up to 0.7 C or so. The reason this is an issue for the U.S. is that a large portion of U.S. stations changed from evening (~ 5 PM) to morning (~ 7 AM) readings:
Thanks Zeke for your neat graph.
Zeke, your study is fine, however you are looking at an artificial system. Until you produce the hourly temperature records for USHCN stations from 1895, you’re extrapolating from data that is unrelated.
The USCRN hourly is very precise, but it’s lacking one key variable, the human variable. When people were reading these thermometers decades ago they were rounding to the nearest degree. They were closely attuned to the weather, to the extent that they would volunteer to monitor these temperatures day after day.
Now what if they reset the thermometer at 5 PM on a very afternoon with a storm on the horizon? They might worry that the max temperature for the next day could be polluted and reset the thermometer again later AFTER the temperatures cooled. We don’t know, but they could have done that. And if they did, applying TOBS to their carefully collected data would be improper.
Or what if they’re looking at the thermometer and it’s half-way between 85 and 86 degrees, but they don’t remember it being a particularly hot day. So they round down to 85 rather than rounding up to 86. They’ve just “corrected” the daily average temperature by half a degree, but it’s invisible to scientists crunching the data 80 years later.
Taking hourly reading from an automated climate monitoring station with readings to the hundredth of a degree is a far cry from a farmer hand-writing temperature records to the nearest degree a century ago. But you insist that your study proves that any adjustments you deem necessary are appropriate when that is just not so.
They will only assume, with certainty that anything volunteers did wrong always lowered temperature data and anything they did that might have warmed it, actually meets skepticism.
#confirmationbias
Another thing that’s really important about keeping TOBS in mind is if you want to compare one weather station with another. I didn’t (rather, I assumed a USHCN station these days was a midnight reporter), and the result was this embarrassing post that I hope you also won’t read.
https://wattsupwiththat.com/2013/02/24/nws-station-at-corinna-maine-same-old-problems-now-with-global-impact/
“Is it important to know what hour the peaks occurred?”
Yes. I’ve shown in a plot below the difference it makes. In Boulder, Colo, it’s up to 1°F either way.
Which would require regular frequent readings and not just readings taken at close to the same time of day which was the stated need. To be useful these values need to be recorded daily at reasonably close to the same time of day
Exactly. Recording them at the same time every day without adjusting for changes in the time for the daily max/min would certainly throw off the measurements so much that they’d be worthless.
For instance, the daily high in July will be much later in the day than the daily high in January by a few hours.
I know this is a problem with historical data only, in some regions only. How many stations globally and how long (in which period) used max/min method for calculating daily averages? For example the middle Europe (Austria, Czechia, Slovakia, Hungary) in the history measured 3x a day (07, 14 and 21) and calculated daily average by (07+14+21+21)/4. It was very precise method of calculation. Really better than max/min method.
Do you have references that show how much better that is than max/min?
I’ve seen a claim that (07+14+21+21)/4 was considered somewhat better than (07+14+21)/3. I wasn’t convinced, but hope to think about it some more. I guess the idea is that the 2100 reading is closer to the average and deserves to be counted twice.
I have some (07, 14, 21) data from New Hampshire in 1816 and nearby years. I’m considering comparing that to NOAA Max/Min averages for KCON or my (0650, 1350, 2050) data from home. (That should take into account summer local time and Daylight Saving Time.)
3 is only slightly less useless than 2 measurements if you want an actual average of daily temps, you need hourly or every 30 minute values, from sunrise to sunset. That is a daily average.
This is important, Finland in Winter has days that are much shorter, and days in summer that are much longer, hence sunrise and sunset actually capture this change too.
The average of a 6 hour day in Finland is very different from an average from a 12 hour day.
Cutting the max and min with daily mean is illogical nonsense (unless you are trying to sell a statistical artifact)
The TOBS issue in controversy is the effect of a past change in observation time on the monthly average. The existence of an effect is established to my satisfaction. If you are considering this topic, this is what you need to analyse and then express an opinion on whether various adjustment systems are as unbiased as possible.
Steve: There should be no controversy about TOB. Above, I asked Mosher if time of observation corrections are used in ANY global temperature records these days. I suspect the answer will be no; everything is done by homogenization algorithms, not correcting for TOB.
Capturing the temperature readings of all global sensors at the same instant and then averaging those values would produce a true average temperature of the Earth. This means that roughly half the measurements would be captured during daylight with the other half at night. Of course this isn’t the method used. Introducing a time component to the data collection (highs and lows over 24 hour period) means that moving air masses can influence more than one reading. And with a time component, it’s possible that the true average temperature is trending in the opposite direction from the contrived “average” that we’re tracking.
I once grabbed the temperature reading throughout a single day for two separate American cities to make a point, and by chance I used Denver on a day where the temperature fell over 30 degrees in under an hour. Those temperature disparate air masses were moving quickly and would likely influence readings at other sites over a 24 hour period. Wouldn’t that skew the calculated average from the true average?
Do forest fires influence local temperature readings and are they accounted for?
The high and low temperature of Earth can typically differ by 150 degrees F – what value is there of a single number representing the “average”?
+1000
This comment belongs in the WUWT Hall of Fame.
The idea that we are .7C over some equally arbitrary anomaly average for April, therefore proving CAGW is beyond farcical
To illustrate your point, UAH data identifies last month as one of the “warmest” April’s ever, meanwhile, in the real world Europe is facing a worsening agricultural crisis due to record-breaking COLD.
http://www.freshplaza.com/article/157370/Extreme-snowfall-and-frost-damage-in-Europe
I guess the farmers just need to exhale on their frozen plants. We are truly living in a theatre of the absurd.
UAH measures without gaps and passes round the earth twice a day and covers most of it.
For this reason it is far more reliable than the junk currently called “temperature measurement data ” << especially so if you add "Final" to that tag 😀
yes it is not perfect, it has it's problems but if this is where all the energy was put, we'd already be ahead, instead it is left to a tiny few to deal with our best method for collecting data
Of course the fact the troposphere didn't cook up was the cause of satellite data being, in some people's minds, "marginalised".
If even as a non scientist, look at this pragmatically and rationally, the only conclusion you can come to satellites are the best option by far that require the minimum effort.
I did a somewhat similar analysis of the hourly data from the GHCN station at Boulder, Colorado, for a three year period. The plot below shows the running one-year average (to remove seasonal effect), of days averaged in different ways. The black curve is the mean of the 24 hours. The color curves are what you would get if you read as a max-min thermometer, reading at various times. It averages the max and min in the 24 hours ending at the times shown in the legend.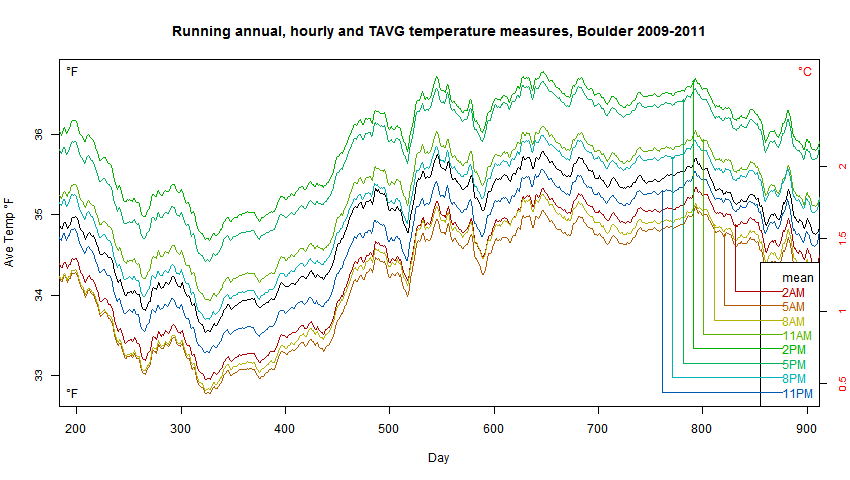
The black curve tracks the median of the curves, showing that the 24 hr average is not greatly different to the min/max family. What is different is within that family. This is the TOBS bias, and it can be a °F either way. The need for adjustment arises of the time of observation changes, and you move from one curve to the other.
So don’t average. Just use MAX temp to find warming.
Temperature is an intrinsic property. When you average it you do not get a temperature you get a statistic about temperatures…
As soon as the daily average of two temperatures is used, you have lost the plot and no amount of adjusting can recover it.
This is a fundamental property and can not be fixed.
Oddly, the trend of MAX temps don’t show warming….
Global Warming is entirely an artifact of bad math done on wrong physics using poor data not fit for purpose, then adjusted oddly, for effect.
Don’t average temps, just plot trend max of unadjusted data, it goes POOF!
Note recent record late snow in places asserted to be “hottest ever”…. Ask the Austrian farmers how warm it is… I’m presently under cool cloudy skies in California, when the 1980s had it hot now. So the fantasy heat has run off to hide somewhere, they say… But the AVERAGE!!! they wail… and you know it isn’t a temperature or found anywhere in reality…
Isn’t the Max Temp a “statistic about temperature”, too?
If the Max Temp is important and should be measured, why shouldn’t Min Temp be measured as well?
It will be, just need to wait another 30 years….
Stephen,
No, the MAX temperature is an actual measurement. The mercury reaches a point where it no longer rises and that is one temperature of one thing at one point in time. No math applied to it.
Yes, you ought to record the MIN temperature too, just not average it with MAX. Also it has been shown that MIN is more sensitive to siting error and UHI contamination, so you will have more accurate trend data from MAX alone.
Those two things together do imply a use for MIN: Compare the trend in MAX to that of MIN for a better idea of error in the data from siting and UHI…
As soon as the daily average of two temperatures is used, you have lost the plot and no amount of adjusting can recover it.”
This is the sort of logical conclusion that is lost on some. This is exactly true, and as a result monthly averages are pure bunk.
Statistical artifacts used to sell a story
Those that live off of making statistical artifacts, seem to have avoided E M Smith’s points
@E.M.Smith
It is a fact that during the course of a day moving between the Max temperature, an actual measurement, and the Min temperature, an actual measurement, the thermometer actually measured what will be Average temperature of the day. It went unrecorded. We don’t know when the Average Temp was measured on the thermometer. We don’t know for how long.
But the same can be said for the Min and Max Temperatures. We don’t know when they were recorded, we don’t know how long the thermometer rested at that point. We only know that the Thermometer did measure the Max and the Min each at least once since the last reset of the thermometer. Likewise, we know the Thermometer did measure the Average temp, not once but at least twice since the last reset.
Aside from the allegation that the Min temperature is more subject to site problems and increasing artificial warming contamination (which I agree is plausible and likely), I am having difficulty understanding why Min and Max should carry any more significance than the Tavg = (Tmin+Tmax)/2.
” I am having difficulty understanding why Min and Max should carry any more significance than the Tavg = (Tmin+Tmax)/2.”
First, they are inflection points, second how many different t min/ t max value pairs average to say 44F?
Lastly which of these number sets contain the most available information?
Of course you have to be careful comparing boulder to other stations because of the proximity of the mountains. They are so close, the sun “sets” rather early, and the temperature can drop abruptly as a result.
It is not just the TOBS offsets that are pertinent to long-term climate data. The very high coherence between all your curves implies negligible TOBS effect upon the yearly average anomalies. Temperature variation, not absolute levels is the essence of climate signals. Indeed, bias in such anomalies arises only as a step-change when the reset time is changed. Karl’s tortuously rationalized “correction” of all data to a common midnight reset time is a patent excuse for producing fictional data series.
This post did not address the time of observation issue. Instead it only addressed the difference between the actual mean daily temperature and the use of (TMAX+TMIN)/2 to approximate the average daily temperature. To see the difference on a monthly basis check the monthly summaries from the CRN network. For instance, look at April 2016 for the Marblemount WA site. The true average temperature for the month was 52.5 F while the mean temperature approximation calculated from (TMAX+TMIN)/2 was 54.2 F:
https://www.ncdc.noaa.gov/crn/newmonthsummary?station_id=1017&yyyymm=201604
I could see the same thing just by looking at the hours spent above or below the mean. 94% of these stations spent more time below the mean than above. That would leave the average temp lower than the mean.
Using a single max and min to calculate a daily average is so bogus to begin with, that the whole issue with TOB adjustments is just trying to polish a turd.
MarkW writes:
My thoughts exactly. There was a time, shortly after gas stations began giving out digital wristwatches as fealty awards, that it became cheap and easy to collect hi resolution temperature data anywhere in the world. A decade or so after that it became cheap and easy to publish that data with positional and temporal precision equal to the GPS system.
There’s no longer an excuse for min/max averaging. It would be trivial to very accurately profile the surface temperature at any location on the plant people live.
of course I dropped a /blockquote after the word “turd”. Any help would be appreciated.
[Reply: Fixed it for ‘ya. -ModE ]
“Using a single max and min to calculate a daily average is so bogus to begin with, that the whole issue with TOB adjustments is just trying to polish a turd.”
You just killed UAh and RSS. They use one time for the whole day.
Thank you for playing
Yes Mosher you’ve pointed out RSS and UAH may also be too hot given the TOB. Thanks for playing.
At least RSS and UAH can actually measure all over the planet, rather than having no data for significantly more than half the earth’s surface.
Purely by data resolution it is superior to surface measurements.
Neither change the fact, half of global warming has come from adjusting old surface data and estimated old surface “data” they never had in the first place.
That and rewriting the historical records of entire countries to fit globull warming.
The 1940s blip was surely dealt with, at sea first, and then the land.
Bogus schmogus
Garbage is garbage, even if it is all we have.
If the data is not up to the task, then it’s better to give up rather than attempt to build a house of straws on a pile of turds.
PS: UAh and RSS aren’t using high and low readings to calculate a daily average.
So your comment has no relevance to mine.
Please quit trying to change the subject to hide your failures.
You just killed UAh and RSS. They use one time for the whole day.
Huh? How can they just use 1 time? A planet has two sides (unless you are a flat earth believer).
Satellites have to make AM and PM passes of the planet unless they teleport between poles on the return pass.
If RSS and UAH are only using half the data that is a choice not a system issue.
UAH specifically mentions “ascending and descending satellite passage” time convergence at the poles as part of their diurnal correction so I’m not sure where the one pass a day comes from.
Land based temperature data leads to all sorts of statistical manipulation with nothing to validate the data.
It makes for dodgy junk science.
“since he isn’t looking at trends”
or she, in this case.
averaging temperature readings is completely idiotic to begin with.
if you want to see valid trends, you chart the morning, noon and evening readings separately, like so:
or you chart the min or you chart the max – like with like.
and that’s all there is to that.
AND you do that for each individual site – no homogenizing Death Valley with Antarctica
or you chart the min or you chart the max – like with like.
and that’s all there is to that.
===
exactly
http://realclimatescience.com/wp-content/uploads/2016/05/2016-05-05071059.gif
Where did you get this chart?
That is an interesting chart with that meta-data annotation.
If you look at only 1958-1988 (the magical 30 year interval) you can paint an alarming picture.
I wonder if there is an equivalent chart showing increased cooling into the 70’s.
Thanks.
stephen,
Just cut the above chart at 1935 to1980. 45 years of “catastophic” cooling…
Is “daily average” really meaningful?
No
nor is a geographical average meaningful (homogenization of averages is nonsense with an exponent)
Yes.
Depends on your purpose.
For some customers I use tmax.
For otther customers Tmin
For others the daily average
From some monthly.
They all have a use and therefore a meaning
What do they use the daily average for?
I can use a spoon for digging..
An average is of no use in understanding what is happening, it’s meaningless to the thermal environment of an area.
They all have a use and therefore a meaning
There are physics books.
There are chemistry books.
There are cook books.
There are comic books.
They all have a use. They all have meaning.
Don’t confuse their uses.
“What do they use the daily average for?”
they use it for making business decisions.
I use it routinely to evaluate models.
I’ve used it to evaluate UHI.. it has any number of meaningful uses.
The point is this. It is Meaningless to claim that a metric is meaningless.
Metrics ( such as daily average ) can be more or less useful for a variety of purposes.
Skeptics are generally so afraid of doing actual WORK with actual DATA that they tend to adopt
“Philosophical” objections to the data or methods.
They make untestable and silly proclamations about what is “meaningful” without actually working
on practical problems.
They make silly and contradictory claims like.
Global averages dont exist BUT
it was warmer in the MWP
In that case why not track long term trends using the best data available?
If a station was taking readings in the afternoon, that would be Tmin. If the station was taking readings in the morning, that would be Tmax.
By attempting to use Tavg as a one size fits all solution you are guaranteeing that it will be polluted by Tobs bias. Insisting that midnight be the reference point is just idiotic.
If a station switched from afternoon to morning readings, use the Tmin to track the trend before the change, then Tmax after the change. The biggest problem with this approach to Tobs is that a precious fudge factor would be eliminated.
Some business leaders use prophecies of astrologers. Some use averages of temperature. All useful for “it wasn’t me”.
TOBS is of minor relevance. More important is Christy’s new paper showing that the ‘best’ land trend estimate is Tmax, not min or avg, because of UHI. Even more important is error (calibration, human, otherwise like Stevenson screen paint: as AW showed years ago, if it aint whitewash it aint ‘real’. Or that ship engine water intake depths vary with ship and loading, and there is this thing called a thermocline– so ignore all that and Karlize the more accurate floating buoy temperatures). Not to mention siting problems, lack of measurement for much of Earths land (so we infill regional expectation guesses). The extreme ‘bad’ regional expectations example being Amundson -Scott South Pole, the most expensive weather station on Earth, where BEST 166900 automatically rejected 26 months of record cold readings based on ‘regional expectations’ from the nearest other continuous record station, McMurdo on the Antarctic coast 1300 km away and 2700 meters lower. Fn 24 to essay When Data Isnt.Right. NOT.
No amount of fiddling or homogenization or reanalysis can make the historical record fit for an AGW purpose it was never intended to fulfill. We ought to stop trying and admit dunno for sure.
This post is IMO a contribution in that direction.
Well…
Miscellaneous studies have showed all of the commonly deployed sensors (except it is claimed USCRN) get warmer with age. Every station update or modification that causes a discontinuity would presumably “lock in” this upward adjustment. This is in addition to the UHI problem.
It would be useful to plot the USCRN stations by location as large colored dots indicating the trend. Comparing this to a USHCN class 1/2 trend map for the same period may be informative. There was a USHCN regional trend map on WUWT a while back but it wasn’t for the USCRN period.
Steve Mosher. Comment on this please?
zeke wrote a paper on this.
read that.
Christy’s latest work on Tmax is pretty bad
From a post on a previous “aging” thread at WUWT.
I asked Zeke how he knew that the problem that needed ajusting was MMTS negative bias, rather than CRS positive bias. After all, the MMTSs were coming newly calibrated from the labs, and the old CRSs were loosing their albedo. Zeke never answered that question. Much like Zeke never explained how his UHI reduction algorithms were not simply smearing the UHI effect evenly across all stations.
I have noticed similar strange Best regional expected climate adjustments in the sparse observation network in Western Australia. I think in some climate areas the data is too far apart or topographically different to use expected regional climate adjustments.
Posting the station trends as colored dots, particularly the post 1975 trends, of Raw and “Adjusted-Raw” data on a globe would be interesting.
Error / Data Glitch?
CHART 1 TOB 00:00
Hell, MI — 48.18 — 48.15 — 45.13 ?????
In all other cases, the difference between All Obs and Hrly is a few hundredth at most. here it is 3.
Comments or verification?
Maybe Hell is an outlier.
Station metadata got messed up, the Lat/Lon is confused, and part of the data is from Hell, Grand Cayman Is.?
Dante didn’t think so.
@ Nick
At first glance, I just wanted to look at All Obs vs. Hrly, to start.
For the other sets, TOB 08:00 and TOB 16:00, all differences between All Obs and Hrly are 0.00, 0.01, 0.02 with the lone exception of TX 16:00 with 0.06. So far, so good.
For TOB 00:00 we get this:
VA – 2.28
ND – 0.66
MI – 3.02
NY – 0.74
Now, what is the simple basis for this? We are just going from 288 readings/day to 24 readings/day, that is all. More, we do not see this anomaly at the other starting points for a 24 hour period.
Yet these differences are 200 times what we see elsewhere in the data, and there does not seem to be any plausible physical explanation.
TonyL,
I don’t know. As I understand the calculation, only the first column should change going from table to table. So then 45.13 for H would be a typo, or columns exchanged. It may b that the tables vary by calculating the 24hr average from 8 to 8 instead of midnight to midnight, .but over a year that should make only a tiny difference, an end effect. The year average of daily average of hourly should just be an average of all the hourly (or all obs) readings for the year.
The other question not explained is how missing values are handled. That can make a big difference. But I wouldn’t expect a difference between hourly and all obs.
TonyL:
In going from 5min discrete sapling to hourly, there is little change in the calculated daily mean. But what is lost is a close reading of the actual extrema, which almost never occur exactly on the hour. Not only is the diurnal range consistently underestimated thereby, but the hourly data series is subject to non-negligible aliasing of high-frequency variations (due to turbulence in the atmosphere) into all lower frequencies. Examinations of sporadic TOBS biases based on hourly data are by no means definitive.
I’d like to say I put in some errors to see if anyone was paying attention. Three of the values identified by TonyL in the 4:39 pm comment were off for different reasons too involved to explain. Operator error will do. Two were in the Hrly column of the 00:00 TOB. For Fishersville, VA the Hrly should be 55.50 (same as all obs); for Harwood, ND the Hrly should be 44.60. And for Ithaca, NY the three colums for 00:00 should be 48.54, 47.85, 47.85. The Gaylord, MI looks like the real outlier but I don’t believe there is an error. The monthly summaries show the all obs totals to be about .20 the .35 greater than the hrly for most months. When the hrly is higher its only by hundredths of a degree.
The bottom line affect of the corrections is to make the hrly totals closer the the all obs totals. Corrected bottom line averages are: 54.67, 54.08, 53.95
Nice catch! In doing copy/paste from one sheet to another I got that one wrong. The third value should also be 48.15. Unfortunately that change also propagates to the summary line making the Hrly average 53.93 instead of 53.75. It brings those values more in line with the other TOBs. (Frankly, I was surprised this article was accepted. I’m grateful for the amount of commentary on it.)
Nice work. It would be helpful, however, to know the data sampling rate at each of your stations.
be wary of the bangor maine one, its kbgr airport and flight schedules as well as ramp activity (and snow removal in winter) can affect variations as its just off a taxi way.
taxiway usage (and holds on taxiway) used to cause issues especially.
when there are a bunch of tankers and nato/air force jets departing in formation the temps skewed high for about 30-45 minutes iirc.
this would (imo) potentially cause the means to be off independent of the normal siting issues, a lot more a/c activity on particular day could skew the av temp that day as most of the time the military stuff happened first part of mid morning.
dmacleo,
Do you know of nay back-of-envelopes whee the calorific value of fuel plausibly consumed in a nominated airport volume is great enough to induce a discernible temperature change? Like the area inside the perimeter fence times 50 metres high for the volume, fuel usage from airport trucking records.
Geoff
GS:
Less an issue of warming the entire volume than directing a plume of warmer air toward the measuring station.
See, for example, https://wattsupwiththat.com/2015/07/18/heathrow-hijinks/
nope but I know our saab 340A models had to be very careful comparing airport reported temps against the adc after some tornados/f16/kc135/c5 sat short distance from measuring equipment while doing engine runsups
From the author: I didn’t use any airport data in the analysis because of formatting differences. Here’s the scoop on Bangor:
Bangor, ME
Weather Station ID: KMEBANGO3
Station Name: Essex St Hill
ahh “cool” lol
it initially looked like kbgr was used, sorry about that
my mistake
My tuppence worth here involves my 3 little data loggers and comparing them against my Wunderground station, (ICUMBRIA1) – about 6,000 metres away as the proverbial crow flies.
One logger is hanging from a fence at a point as far from habitation as I can put it, nearest house is 300M away and unoccupied for 11 months of the year then my house is about 600M away.
Logger #2 is hanging off my washing line in my garden and #3 is 2ft below ground beside the stop-tap on the farm water supply pipe.
For curiosity some while ago I did pretty well whats described above and was quite gobsmacked to find that simply asking Excel to return the daily max and min values and averaging them gave *exactly* the same value as averaging all 288 daily values. I, like George E above couldn’t get my head around it and to this day put it down to my local climatology= wet, grey, wet, drizzle, grey and windy, rain, rain, drizzle, mist, fog and rain
Same thing happened with the PWS data, it was amazing how closely the numbers matched.
Also, not quite so amazing was/is the data coming from the logger thats 2ft underground.
Average the data-logger hanging 3 feet off the ground on fence-post (running at 288 readings per day) over maybe a fortnight and you get the exact same as the underground logger doing 2 readings per day. Things change slowly under the ground, 1 reading every 3 days would be plenty.
The final not so amazement is comparing the PWSs data against nearby Met Office numbers. Just how the PWS manage 288 readings per day in real time yet the Met Office takes 3 months to produce 2 numbers representing each month is a modern day wonder.
No matter, both sets of data for England, across 7 roughly matched pairs of Met office stations and PWS, show a cooling trend over the last 10 years. But, why do the PWS show a cooling of about 1.5 degC per decade but the Met Office stations show 0.8 degC per decade of cooling?
skeptical?
moi?
Max and min are the extreme outliers.
TOB 8am is yesterday afternoon high with this morning’s pre-dawn low.
Absolutely correct.
Yes, we should swithc to the next day at noon and not at midnight.
If your variable is time, then time is the only valid adjustment.
Cogent and interesting.
Because the diurnal cycle is strongly asymmetric in its histogram, averaging Tmax and Tmin produces a MID-RANGE value typically appreciably above the true mean. With min/max registering thermometers properly reset each day, TOBS bias occurs only when the following day’s extremum falls within the range set by the reset temperature. It should really be called TRES bias.
Thank you 1sky1! This is the only physically plausible explanation I have seen for explaining why TOB exists for Min/Max. And I doubt this bias changes much with time of observation (in ranges of time-of-day actually used much in practice) on average over the world’s land weather stations.
As for average of hourly or more frequent readings, I still don’t see how a TOB can exist.
I am aware that average of Min & Max is usually different from, often higher than, average of hourly or more frequent readings. But if a station does not change between Min/Max and average of multiple readings for reporting an average, then this should not be an issue.
Spot on. Since the effective bias in the monthly average is N/60 of the average bias in mistaking yesterday’s reset temperature for todays inside extremum N times during the month, the effect is quite small and can be partially corrected by flagging sporadic extrema that correspond to the recorded reset temperature. Wide field experience indicates that N typically varies from 0 to as much as dozen and the average bias is on the order of half a degree. Contrary to warmista claims, even the uncorrected bias tends to wash out in the aggregate station average of yearly average anomalies
“I wasn’t trying to look at climate trends, I basically wanted to evaluate the suitability of using Min/Max temps to derive daily average temps.”
There is related literature on this . ( much of it agriculture related )
http://www.nrcse.washington.edu/NordicNetwork/reports/temp.pdf
https://www.ars.usda.gov/SP2UserFiles/Place/50600000/Products-Reprints/1989/459.pdf
http://research.eeescience.utoledo.edu/lees/papers_pdf/Weiss_2005_AFM.pdf
Weiss A, Hays CJ. 2005. Calculating daily mean air temperatures by different methods:
implications from a non-linear algorithm. Agric. For. Meteorol. 128, 57-69.
And even a blog post
https://wattsupwiththat.com/2012/08/30/errors-in-estimating-temperatures-using-the-average-of-tmax-and-tmin-analysis-of-the-uscrn-temperature-stations/
Tmean ( integrating temps over the day) will differ from (Tmax+Tmin)/2
The latter is commonly referred to as Tavg. You can think of it as an estimator
of Tmean. Since the historical record only has Tmax and Tmin ( for the most part)
If we are interested in creating a long record we are stuck with Tmax, Tmin, and the
average of these two. Also, we are also most interested in the trend.
It’s well known and well documented that Tavg {( Tmin+Tmax)/2} differs from Tmean
( integrated temperature). The important question is this: Does the trend in Tavg
serve as a good estimator of the trend in Tmean? In other words if the trend in Tavg
goes up do we see a similar trend in Tmean?
http://www.ncbi.nlm.nih.gov/pmc/articles/PMC3982162/
“Global mean surface air temperature (Ta) has been reported to have risen by 0.74°C over the last 100 years. However, the definition of mean Ta is still a subject of debate. The most defensible definition might be the integral of the continuous temperature measurements over a day (Td0). However, for technological and historical reasons, mean Ta over land have been taken to be the average of the daily maximum and minimum temperature measurements (Td1). All existing principal global temperature analyses over land rely heavily on Td1. Here, I make a first quantitative assessment of the bias in the use of Td1 to estimate trends of mean Ta using hourly Ta observations at 5600 globally distributed weather stations from the 1970s to 2013. I find that the use of Td1 has a negligible impact on the global mean warming rate. However, the trend of Td1 has a substantial bias at regional and local scales, with a root mean square error of over 25% at 5° × 5° grids. Therefore, caution should be taken when using mean Ta datasets based on Td1 to examine high resolution details of warming trends.”
Lastly to really understand temperatures
we look at the following. Tmin (by itself), Tmax(by itself) Tmax-Tmin, and (Tmax+Tmin)/2. In the public communications about AGW people tend to focus on just one of these. In the science we look at all of them.
The problem of estimating Tmean from just two observations in the day, is even more pronounced in satellite data. For UAH and RSS there is no Tmax and Tmin. There is no hourly data. RSS for example adjust all measurements to local noon. The Satellite crosses one patch of earth at 9Am and another at 3PM ect and these are all adjusted
to one uniform time: Local noon.
Finally, if you want to look at how Tmean differs fromTavg.. Just look at CRN
https://www.ncdc.noaa.gov/crn/sensors.htm?stationId=1550#temperature
https://www.ncdc.noaa.gov/crn/qcdatasets.html
Thought you said sates only have 1 measurement a day..
Satellites measure a contiguous average twice a day for most of the surface.
Surface stations dont even come close to achieving anything near that.
This is not a reason to say the data is accurate or valid, or anything else. BUT it is a good place to start.
Surface stations should be an other element, these should not be competing data sets, surface station is just not good enough in distribution coverage and placement, Satellites are but provide contiguous measurement as they fly around whereas obviously surface stations record simultaneously but only within time zone.
The point is the satellite data should be the primary focus and other data supplemental because if one is unreliable, it is the surface data, because of two inarguable points, distribution and coverage.
“Thought you said sates only have 1 measurement a day..
the measurements are Adjusted (in RSS) to represent a single time. local noon.
But go ahead and amuse me. FInd Tmax and Tmin for UAH and RSS?
Satellites measure a contiguous average twice a day for most of the surface.
Surface stations dont even come close to achieving anything near that.”
http://images.remss.com/papers/msu/MSU_AMSU_C-ATBD.pdf
1. One issue the Post brings up is the viability of measuring the average temperature
with merley the Min and the max.
2. If you think two measurements a day are bad, then you should have similar problems with sats.
We are talking about the TEMPORAL sampling.
since 1998 the sat record is composed of AMSU data. AMSU are in sun-synchronous orbits. They cross the equator at the same time every orbit ( more or less you have to adjust for deviations from this as well.)
On aqua the ascending orbit is daytime and descending is nighttime. during a 24 hour period there are 16 orbits. Some parts of the globe are only observed in daytime, some only in nighttime, some in both day and night.
Here are the times for may 7th
Since One patch of earth may be viewed at dawn and another patch at noon.. and another at 6pm, the RSS approach is to adjust all the measurements to the same local time. You get the temperature at ONE time.. not min and max.. but everything adjusted to local noon.
For UAH the twice daily measures at 1/2 degree resolution are combined into a monthly grid of
One measurement at 2.5 degrees. So you lose visibility into the lower level data..
Why thank you for that Mr Mosher, appreciated.
I did say that 3 measurements is also useless. That definitely includes the satellites.. to base policy and action on, we dont know enough and certainly cannot produce an answer with statistics ROFLL
I would not argue to the contrary.
I stated quite clearly, that Satellite data should be the lead, because it gives data where surface does not and should be “supplemented” by surface data.
I said the data sets should not be used to conflict each other. I was never a proponent of satellite data anyway, I am not a climate scientist or statistician, logical problem solving is more my thing.
The value of satellite data is not the measurement but WHERE they measure as AGW should be in the troposphere, and the satellites show us there is no panic (as best we know).
What use are surface stations in detecting AGW? NONE, nada nil zero zilch.
Yes yes temporal sampling, is a fancy way of saying you take measurements of one location every so often. Temporal sounds more sciencey, I prefer explanations to be as plain as possible which is where they are most open to scrutiny The more accurate you want a representative average value the more measurements you take per hour (reasonably of course). But it is irrelevant, if you dont define a proper balance in data capture, sun, no sun, is the ideal split to get average day and night temps.
Again remember the average is an artifact, you created it, you cant use it as “data”.
The planet it warmed by the sun, sunrise sunset, every 30 minutes, average the numbers, daily average bingo, anything else done to that data is abuse plain and simple, and the averages cannot be used to make any claims either, because they are not real, and as a result have no consequence for the real world.
“I did say that 3 measurements is also useless. That definitely includes the satellites.. to base policy and action on, we dont know enough and certainly cannot produce an answer with statistics ROFLL”
1. Luckily you dont get to decide what is useful for policy.
2. We knew enough in 1896 with much less data, to set a policy.
3. the Ocean is 70% of the data.. only once measurement per day there. Its enough.
I would not argue to the contrary.
I stated quite clearly, that Satellite data should be the lead, because it gives data where surface does not and should be “supplemented” by surface data.
1. Ahh more settled science from folks who have no clue.
2. Satellite data has higher levels of structural uncertainty,
3. Only a silly goose would try to prioritize them by your criteria. We dont live 6km in the air
I said the data sets should not be used to conflict each other. I was never a proponent of satellite data anyway, I am not a climate scientist or statistician, logical problem solving is more my thing.
The value of satellite data is not the measurement but WHERE they measure as AGW should be in the troposphere, and the satellites show us there is no panic (as best we know).
1. Wrong on the hotspot again.
2. wrong on satellite data.
Steve: The diurnal temperature cycle is much smaller in the free atmosphere that 2 m above the surface, which is absorbing an average of 300 W/m2 of SWR during daytime. Errors in time of temperature sampling should have much less impact on satellite temperature than surface temperature.
[1] This study estimates the amplitude and phase of the climatological diurnal cycle of temperature, from the surface to 10 hPa. The analysis is based on four-times-daily radiosonde data from 53 stations in four regions in the Northern Hemisphere, equatorial soundings from the Tropical Ocean Global Atmosphere/Coupled Ocean Atmosphere Response Experiment, and more recent eight-times-daily radiosonde data from the Atmospheric Radiation Measurement program’s Central Facility in Oklahoma. Our results are in general qualitative agreement with earlier studies, with some quantitative differences, but provide more detail about vertical, seasonal, and geographic variations. The amplitude of the diurnal cycle (half the diurnal temperature range) is largest (1 to 4 K) at the surface. At 850 hPa and above, the regional-average amplitudes are <1 K throughout the troposphere and stratosphere. The amplitude of the diurnal cycle in the boundary layer is larger over land than over ocean, and generally larger in summer than winter (except for monsoon regions, where it is larger in the dry season). In the upper- troposphere and stratosphere, land-sea and seasonal differences are not prominent. The diurnal cycle peaks a few hours after local noon at the surface, a few hours later at 850 hPa, and somewhat earlier in the upper troposphere. The timing of the diurnal cycle peak in the stratosphere is more uncertain. Radiosonde data are also used to simulate deep-layer mean temperatures that would be observed by the satellite-borne microwave sounding unit, and the amplitude and phase of their diurnal cycles are estimated. An evaluation is made of the uncertainty in these results due to the temporal resolution of the sounding data, which is only barely adequate for resolving the first harmonic of the diurnal cycle, the precision of radiosonde temperature data, and potential biases in daytime stratospheric temperature observations.
Citation: Seidel, D. J., M. Free, and J. Wang (2005), Diurnal cycle of upper-air temperature estimated from radiosondes, J. Geophys. Res., 110, D09102, doi:10.1029/2004JD005526.
http://cdiac.ornl.gov/epubs/ndp/ndp041/graphics/ndp041.temp.gif
Now the WorldClim map (stations with at least 10 years of data) looks like a pin cushion. Except for the Sahara, Siberia, and Alaska/Northern Canadia, and part of Australia.
So the tradeoff is bad coverage with uneven station quality or universal coverage in a daily time window.
Which is more likely to give a consistent result?
The landers claim that the temperature of the atmosphere can magically change when you aren’t looking so the satellite trend is unreliable. But that you can make up for a mish-mash of stations in various states of repair with a random station distribution with serious holes by using software magic that has failed at climate prediction.
PA:
Your “pin-cushion” map would look even more dismal if restricted to stations with more than 100yrs of data. In the face of non-ubiquitous, but strong, multi-decadal oscllaitions, that is roughly what is needed to avoid making station location an uncontrolled variable in any global average.
However, since he isn’t looking at trends, just the diurnal variation of temperature and the issue of recording times, in my opinion, that issue doesn’t apply here.
Even if it does, it will be Tmin which is mostly affected. Therefore, with good siting, the difference would likely be even a bit wider.
AlexS
May 5, 2016 at 2:55 pm
“There’s not much point in wishing it were something else – that is what we have.”
Sure. But then you go extract conclusions from low quality data for the precision you claim…
Yeah, that one bothers me too, AlexS.
“We know we are putting garbage in, but through our mathematical wizardry, we get gold out”
It is the new “GIGO” – Garbage In, Gold Out.
No Gold, but Gospel.
JohnWho,
“It is the new “GIGO” – Garbage In, Gold Out.”
I agree. I took a look at the TOBS bias issue a while back. I learned that the TOBS compensation used is too simplistic and potentially adding additional error of unknown size to the temperature record.
Here is my digging on the subject: http://climate.n0gw.net/TOBS.pdf
Gary
I refer to this as the “Rumpelstiltskin Effect”. However, Rumpelstiltskin was only able to spin straw (bad data) into gold (good data). The folks at NASA GISS contend that they are able to “out-Rumpelstiltskin” Rumpelstiltskin, by spinning nothing (missing data) into gold (good data). I suspect the Brothers Grimm would have been impressed.
There are ‘purist’ problems with correcting ‘actual’ data using a probabilistic approach rather then an actual one.
Can’t see the value in rejecting a daily reading in case there was a certain type of weather thought to be there the day before or after.
Does anyone know of any reported analysis of the day-by-day differences, to accept those measured, by some criterion set in advance, as unlikely to be affected by observation times?
It seems, shall we say, a little socialistic to attribute wrong to the majority of readings, without first discerning if indeed they were wrong. All for the greater good.
…………………………
Nick Stokes, re Tmax might be better than Tmean, would it be easy/possible to redo your graph shown above at May 5, 2016 at 1:00 pm for Boulder, using Tmax instead of Tavg? Might be useful.
Geoff.
Geoff,
“using Tmax instead of Tavg? “
Well, it wouldn’t be easy – there is a lot of data to download. But I can’t see what I could do. The point was to compare the 24 hr average with the min/max average, and also to check TOBS. The first comparison wouldn’t work with TMAX and I don’t think anyone does TOBS adjustment to max alone.
Nick,
Please, if it is too hard, do not worry about it. I had never seen this type of comparison done on Tmax either, so I was fishing rather than asking a question when I already knew the answer.
How do you feel about adjusting data that probably has a high % of valid results, just in case it needs adjustments, the TOBs way.
Geoff,
“How do you feel about adjusting data that probably has a high % of valid results”
There is no issue about validity. There is no valid or invalid time to observe. The issue is consistency and comparability. Or homogeneity. If you move from one of those curves on the plot I showed to another, by changing TOBS, you create a spurious change that wasn’t climate. The good news is that you have all the information to correct it. The change of TOBS is on the record. And for the diurnal patterns that determine the effect of the change, we now have a huge amount of data.
Love this. As a Meteorologist and Historical Climatologist…Min/Max tells us noting about
Diurnal variations. Sometimes the old ways were better 7/2/9 or more perfectly 7/2/9/9 /4.
It was great!!!
The bottom line is the data for the last 130 years is junk data. The SH time series is almost all fabrication
The truth is half of global warming comes from adjusting the past, half of what is left is natural and half of what is left of that is our influence since 1970 (alleged) meaning, of the “measured” 1 degree of warming in that time, we “may” be responsible for 10% of the warming since 1850. “may”.
For me, when NOAA told us a record temperature in 2015 only using land data, because they tried to detach it from El Nino was the most pathetic sly tactic one could imagine.
When you see what they have done to the records of countries like Iceland, and openly talked about “getting rid of some of the 1940s blip” and you see the NASA adjustments, wow, how does one deluded themselves into thinking this is not suspicious, very suspicious.
What amazes me is the lack of logical thinking in “scientists”
They either dont believe or cant admit that if half of warming is from adjustments, half of warming is HIGHLY uncertain.
max min night time temps and all recorded temps inbetween give a nightly average. Daily max min and all measurements inbetween give a daily average.
This shows the duration of temperatures in the average for example, if there are 4 consecutive hours at Max temp 54f and 6 hours at 49 min temp with 2 at 51f, an average of max min will create a warmer trend than measurements actually show.
How long any one temperature is sustained is very relevant which is why you need to average all measurements, 8 hour periods are not great and only serve to paper over the fact that 3 is almost as useless as 2 values to average.
Monthly max and min in calculations are useless if the underlying monthly averages, derived from incorrectly calculated daily averages, is meaningless.
The Washington Post weather page includes a section that compares the difference between the “30 year average (Reagan)” with the current month and year to date temperatures. Today it indicated that this month is -2.7 and YTD is +1.5. Does anyone know how this 30 year average is computed? Is it the historical daily average of highs and lows and has anyone looked at the UHI effect at Reagan airport. My guess is the Washington Post may use this as definitive proof of AGW.
Sadly for the Wapo a temperature trend has no bearing on AGW theory. Warming does not testify to the fact CO2 can actually have the effect claimed by AGW proponents.
All long term stations at airports that have grown will see increased UHI influence, the heat drifting from runways in a breeze as well as siting issues, and all that heat comes right back out at night time.
London city is now home to species of plant that would not grow there previously, because of UHI. BBC had a documentary on it years ago, when they were skeptical about man made global warming of course, they’d never do a doc on UHI’s effects now!
What about bias due to “timezone time” vs solar time?
US time zones are more political than having anything more than a passing relationship to solar time (position of the sun in the sky). Throw in the other political factor – daylight saving, and trying to compare readings from different locations, in different seasons becomes almost meaningless.
Why get into a tiswas over TOBs and whether readings should be hourly or whatever? In
T min mathematical language even hourly readings are “discrete” whereas time is “continuous”.
(Tmax + Tmin)/2 can only approximate to Tmean , no matter how frequent the readings. Why not calculate Tmean directly from the area under the curve?
sorry, gremlins got in, corrected post below.
Why get into a tiswas over TOBs and whether readings should be hourly or whatever? In
mathematical language even hourly readings are “discrete” whereas time is “continuous”.
Any (Tmax + Tmin)/2 can only approximate to Tmean , no matter how frequent the readings. Why not calculate Tmean directly from the area under the curve?
To produce what?
Time is quantised into seconds minutes hours ect. If you took a measurement every second the data would be continuous too, each measurement would be discrete as each second the measurement was taken.
You are replacing valid data capture and averaging with statistical artifact.
If I have a jug of water and I measure it at sunrise, and every 15 minutes thereafter until sunset, all of those values contain time and temperature! Cant you see that? There is no need to put into the statistical mincer
Time is captured because if you measure at 15 minute intervals, or 30 or an hour, and if 4 consecutive measurements are the same temperature, that’s 1, 2 or 4 hours respectively of temperature data and it adds the correct value to the total average for the day. There is your time right there if you want higher resolution take more readings, say 30 minute intervals as temperature can reasonably be expected to change within an hour, less than 30 minutes is probably too much. Smaller fluctuations are noise.
The data is the data, you average it all to get average daily temp, simple as, doing anything else is creating an artifact.
The obsession with anomalies is disturbing, all we need is the measurements and averages, but we only use the measurements for future work, not the averages. The averages when used in 2 more consecutive statistical operations mean the final work is 3 steps removed from the actual data.
This is why temperature record now looks nothing like the temperature record we had from measurements.
All through the numbers mincer to create artifacts that really have no bearing on the real world.
Essentially all you have left after all that chicanery is a fictional residue of something that has nothing to do with the real world, if you are stuck in a concept, you wont see it that way
“The obsession with anomalies is disturbing, all we need is the measurements and averages, but we only use the measurements for future work, not the averages.”
if you dont like anomalies dont use them.
People tend to like to make things more complicated than they are to feed intellectualism, academics especially so.
Simplest answer is more often than not the best answer.
I do love Heller’s gifs though, they amuse me 😀
http://realclimatescience.com/wp-content/uploads/2016/05/Teigarhorn-2011-2016-1.gif
The 1940s “blip” had to go, models cant recreate it without CO2, the same reason the MWP had to go, the same reason Karl’s data is more and more resembling the CO2 growth curve
That station in the picture looks like it is in a reasonable position but then they put some steps there and painted them a dark colour which when the sun is out would generate heat.
Recently I saw a photo of a station with an incinerator within ten metres of it.
Robin: In your post, what is it that is biased? If temperatures are consistently biased in one direction or another, the temperature TREND will remain constant. If a bias in temperature readings CHANGES, the TREND will be biased.
If we had continuous monitoring of temperature, we might think we have a better idea of what the temperature at a location really is. However, there is no “right” way to measure temperature at 2 m above the surface and we are stuck with historical temperature data from min/max thermometers. Our job is to measure WARMING or TREND as accurately as possible, to remove changing biases, not constant ones.
_____________________________________________________
Temperature adjustment bias have an axis centered on around 1960. Adjusted lower pre 1960 and adjusted more linear post 1960 (not adjusted to increase but to match CO2 growth)
Tom Karl tried to then revise the slow down in warming which would have further revised the record with a bias towards CO2 growth)
“historical temperature data from min/max thermometers.”
A large loss of stations in cold parts of the world too in Russia
Massive gaps and the closer you get to 1900 the more data % is US only.
Revisionism of records for countries.
The open discussion of “getting rid” of the 1940s SST and the remaining land blip
Making adjustments based on assumptions like “what they think people were doing with thermometers in the past”
Some think statistical analysis is science, it’s a tool used in science, it is not science.
From the author: Not quite sure how to answer. I have run across the term Time of Observation Bias in several articles. The term bothered me and it took some research to understand. But even once I understood the claim I wasn’t completely convinced of its validity.
The claim is only a concern with a particular type of record keeping. But that type of record keeping is what most of the first 50 years of temperature records are based on. As I understand it, some government department before there was a weather bureau (after the Civil War) decided to try to develop a climate history for the US which included temperature data from a variety of selected locations. In these locations they installed instrument shelters that housed recently developed thermometers that recorded maximum and minimum temperatures between settings. The sticky part is “between settings”. To get daily Min/Max temps the thermometer needs to be read and reset daily. This task was performed by volunteers (which raises other issues). For the most part the readings were initially supposed to be done around 4:00PM local time (which raises other issues). Somewhere around 1900 the recommended time was changed to 8:00 AM. In both cases some local discretion was allowed. At some point the question was raised about the effect of doing the readings at various times of day. Was there some bias introduced by choosing different times of observation.
Eventually it was concluded that “Time of Observation Bias” was a real artifact and should be corrected for. I had a hard time getting my head around the issue so I decided to perform the analysis described above. Hope that helps.
Mark,
“Some think statistical analysis is science, it’s a tool used in science, it is not science.”
Very true. But no scientist should fail to use it. Because proper understanding and use of statistical evidence is essential for verifying scientific discoveries, particularly when experimental replication is complicated or, as in the case of much climate “science”, impossible.
“…we are stuck with historical temperature data from min/max thermometers. Our job is to measure WARMING or TREND as accurately as possible, to remove changing biases, not constant ones.”
True. But the fact that modern methods of recording temperatures continuously were not available in the past is no reason not to use them today.
Consider the purely hypothetical case of the thermometer placed close to the runway at a wartime air strip on an underpopulated island, currently in use as the island’s sole airport. In the fifties and early sixties the only flights were props but, later, one service each day was replaced by a jet. As the island became more popular with tourists one of the jets was upgraded and by the late 1990s this aircraft was very large. If Tmax is recorded once every 24 hours what is the betting that Tmax in the 21st century is significantly greater than Tmax in the fifties and early sixties? And what is the betting that the “trend” in Tmax is far greater than the trend in Tmin? And would the trend in (Tmax+Tmin)/2 really represent the increase over the period?
Of course it could be said that this is a unrealistic example, since all thermometers are better located. (are they?) Or that no natural phenomena replicate the temporary increase in temperature that would be produced by a jet engine. But, for many years, I lived in a country where, in the summer months, the maximum temperature during siesta time in the rural areas, inspired by the midday sun, invariably recorded a spike of several degrees Fahrenheit higher than that shown on the thermometer for the remaining eight or nine daylight hours.
Incidentally I agree with most of your posts, particularly “People tend to like to make things more complicated than they are to feed intellectualism, academics especially so. Simplest answer is more often than not the best answer.”