Guest essay by Jim Goodridge, former California State Climatologist
Hidden in the sunspot numbers are long-term trends. See the graph below.
Orbiting observatories since 1978 show solar irradiance and sunspot number are associated.

Sunspots have increased by 1 percent per year since 1700. This suggests recovery from the Little Ice Age of 1660 to 1710. A major increase in sunspot trend was observed from 1940 to 2002.
This is coinciding with the atmospheric CO2 increase. This suggests that the temperature-CO2 correlation is spurious, rather than causal.
Thanks to Dr. Leif Svalgaard for help in revising sunspot numbers.
The correlation is also not very good, since steadily increasing postwar CO2 has coincided with falling temperature, c. 1945-77, with rising temperature, c. 1977-96, and with flat temperature, c. 1996-present.
“””””…… Sunspots have increased by 1 percent per year since 1700. ……”””””
Well obviously, from your first graph; Annual Sunspot number, sunspots have most definitely not increased 1% per year. They spend as much time diminishing in number as they do increasing in number.
It’s the well known solar eleven year cycle of sunspot numbers.
G
Quite obviously he was talking about the trend line, not the change from one individual year to the next.
Well if we stop trying to analyse everything in terms of “trend lines” we may get a little further.
The claimed correlation in the middle panel of the graph does not work so well, as Bye Doom commented.
There is a clear downward trend until 1935, which was in fact globally about as warm as the end of the 20th c. It then reverses and ramps up, while the temp record from multiple sources shows that there was global cooling until about 1975, ie strong anti-correlation with the proposed solar driver.
“This suggests that the temperature-SSN correlation is spurious, rather than causal.”
I’m not opposed to the idea that sun may be a player, but to suggest, as seems to be the case here, that it is the dominant driver of 20th c. changes in surface temperature is about as credible as suggesting that it is CO2 that is the dominant driver.
george e. smith
Looking at the graph of Annual Sunspot number there seems to be a 100 year cycle too with a 50 year drop. If it was shown with (I believe its called) a 11 year running average I think it would show up well.
I’m sure that Dr S was involved in providing the new modified SSN data. There is no suggestion that he endorsed the rather questionable comments and conclusions in the rest of this this trivially brief article.
Nonsense, 1% per year is an exponential increase. What has been fitted is a straight line. 1% per year produces a doubling in 70 years. An increase of 35 from a base of about 65 over three centuries is only a 50% increase.
The slope of the second panel is meaningless since it depends upon the mean value subtracted and that mean is arbitrarily determined by period of observation and has no objective physical value w.r.t to earth’s climate system. WUWT?
The scientific content of this site has taken a nose dive since Anthony took a back seat.
Well if he was talking about the trend line, why plot all that data on sunspots. All it does is confuse the trend line which you say he is talking about.
Anybody who presented that trend line to me as being in any way related to that underlying historical plot of sunspot numbers would get ejected from any class I was giving.
There is NO reason whatsoever to believe that sunspots on the surface of the sun should increase in number in a strictly monotonic fashion from year to year as if the sun was wearing out or some such thing.
They clearly are not.
A “trend line” would presumably show what some variable or factor, was tending to do.
Clearly sunspot numbers are in no way tending to increase in anything like a monotonic fashion.
That trend line has no more meaning in relation to the sun spot number plot, than would a single number that is the average of all of those sunspot numbers.
The proper term for that trend line is ….. Bull shit ….
G
Such a trend line can be calculated for the sequence of numbers obtained from this morning’s daily news paper.
If you start at top left of front page, and read to the right and down in normal English reading fashion, until you reach the bottom right corner of the final back page, you will get a sequence of numbers, as you reach them during the read, and a plot of those numbers will have a calculable trend line, just as on this sunspot graph.
The daily news number trend line, is also an example of bull shit; same as for the sunspot numbers.
Why people have to manufacture total fictional garbage out of nothing, is beyond my understanding. It is with no redeeming social value whatsoever; total balderdash, that conveys NO information of any kind.
No it looks more like a 105 dip which seems to say they are not in sink and means they meet about 700 and 2700 AD.
That’s truly humorous. The sun may be a player? Do you imagine Carbon Dioxide generates heat? At all? Perhaps we could harness this energy release?
Carbon dioxide doesn’t generate heat. The sun does. Go to school Greg. This isn’t a mystery.
Clearly Greg is talking about the flux in GMT. Clearly he is not denying that the Solar insolation is the source of the vast majority of heat energy in the earth’s system.
The possible affects of variation in TSI, and more importantly, variation in solar spectrum are many, complex, and very difficult to determine as they operate on vastly different timescales and intermingle with other major climate change factors, also operating on different timescales, and additionally we do not know or have the information available to determine all the hypothesized solar affects.
So for now saying,
“I’m not opposed to the idea that sun may be a player”
is a reasonable statement.
At a minimum the trend line in the chart should be smoothed to something like 11 year averages. The straight linear trend makes no sense.
1% – maybe. If you look at the last 300 years (from 1716) the trend is different. So, this looks suspiciously like an endpoint selection artifact.
I’m happy with this article. It doesn’t suggest that solar activity is responsible for every variation in temperature over the last few centuries, only that an overall increase in solar activity coincides with an overall increase in temperature over the same period. Given that the IPCC et al have no explanation for the centuries-long increase in temperature, this could be a good clue,
We know that there are many factors that might affect temperature, and it would be pretty daft to expect one factor to do everything. So now we have solar activity as a possible cause of a long-term warming trend, ocean oscillations as a possible cause of the approx 60yr ‘cycle’ on top of the long term trend, and plenty of other factors for other wiggles. Looking good. Thanks, Jim and Leif.
Such long term trends and large scale departures from trend hold the key to correlation with climate
Try this, including the kink in the uptrend in the 1970s period.
http://www.climate4you.com/images/AMO%20GlobalAnnualIndexSince1856%20With11yearRunningAverage.gif
Looks good to me There are more things in heaven and on earth than CO2, Horatio!
Try what? What exactly are you suggesting. That the surface temperature record may be related to the surface temperature record? What a’ thought?
Greg, that is not the surface record. It is the AMO. De-trended to N.H temperatures it looks like this…
This does suggest that solar insolation flux,(especial the large flux in disparate sola wavelengths) into the oceans may have significant long term affects and that the atmosphere is nothing more then a one pound tail being wagged between the TOA solar insolation, and the oceans containing 1000 times the energy of the atmosphere.
woops
How much of the increase can be attributed to better observations or change in sun spot number counting? Seeing that Dr. Leif Svalgaard was involved, I’m sure this was accounted for, but not mentioned in the above information.
Astronomers have been counting sunspots for 4 centuries, there would be wide discrepancy in reported numbers if sunspots could not be accurately counted.
Are you aware of such problems? Just wondering
There has been controversy regarding changing/improving technologies over time.
Full time sun spot activity tracking actually began in ernest with the foundation of the Solar Observatory on Kitt Peak, Arizona, back in the 1960’s when I was a child there.
Before then, various astronomers including my grandfather, tracked them sporadically.
For a lot longer than 4 centuries. Plenty of ancient Chinese records.
g
The changes lowered the change, not increased.
Sunspots follow a long memory stochastic process. Very extended periods of high or low sunspot numbers is par for the course and not indicative of a trend. Perhaps only thing new under the sun is our latest post hoc interpretation.
And very obviously, the science is settled.
“This is coinciding with the atmospheric CO2 increase. This suggests that the temperature-CO2 correlation is spurious, rather than causal.”
Err no.
logic fail.
before the temperature data got revised, 18 years, that’s all the correlation there is, from around 1975 to around 2000.
But since the data for the 1940s has been revised CO2 now correlates from the 60s to 2000.
Changing data (much of which you didn’t even have due to lack of records) 60+ years later, and using it to make scientific claims of ANY certainty is complete garbage.
Logic is not for you Mosher
It must sting that there is still not a shred of hard evidence as to the source of CO2 growth
not even wrong.
Then don’t. It has been found that TSI is related. It’s been proven mathematically to be an integral, not an instantaneous function. Look it up. The proof has been published on this web site. It isn’t a secret.
Steven
If you and another motorist are driving on the highway’s parallel lanes at the same time in the same direction, that doesn’t mean you started at same place and ending in same office.
But if you do, it is none of my business.
The bottom line is, scientifically, we do not know if CO2 is leading temp, or if temp is leading CO2 or if something else is leading both, that is the reality of the situation and anyone claiming to “know” different is full of BS (Barry Sotero) :p
Hi Mark
I think is worse than that, I have no confidence in the CO2 data obtained from ice cores, since ice is porous. The CO2 measurements conducted on an active volcano’s island also could be doubtful. Just sayin.
certainly agree with you that the ice core data is in no way certain due to how ice forms over time, for those areas it is “that’s all we have” data.
Is the O18 proxy any use? I have no idea
Nice to see you expanding your horizons by learning a new language, hillbilly. That just tickles me.
Not as good as some cockney rhyming slang . My first job was in the East London, now area is transformed and known as ‘Silicon Roundabout’ – the London’s technology hub.
http://londontopia.net/londonism/fun-london/language-top-100-cockney-rhyming-slang-words-and-phrases/
Steven Mosher May 3, 2016 at 12:23 pm
Err no.
logic fail.
How?
michael
logic fail.
===
It’s the exact same logic you use….
“It’s the exact same logic you use….”
err wrong again.
If one variable (like c02) was correlated with temperature ( as it is)
And
If I found that a second variable ( like TSI) was also correlated I would
Not argue, as Steele has, that the second correlation suggests that the first one
is spurious.
That would be silly.
What If I had found the solar correlation first and then found the co2 correlation.
Would the c02 correlation suggest the solar one was spurious?
The problem is that Jim doesnt even understand what he is doing.
The bottom line: Leif has explained this many times.
1. There is a long term secular increase in temperature
( even in the raw data, pre adjusted)
2. There is little to NO secular increase in TSI.
3. That implies:
A) A really sensitive climate system OR
B) Something other than TSI is driving the climate.
People can happily disagree about what “B” is
I suspect Leif and I might disagree about “B”
But we can agree on the fundamentals of explanation
temperature is increasing ( Yes there was an LIA)
TSI is NOT increasing ( yes Leif did fantastic work)
So, we agree that it must be “something else” driving the temperature.
That “something else” could be
1. Unicorns
2. Internal variability
3. GHGs
4. Some strange unicorn property of the sun.. call it X
5. a combination of 1-4
or.. you could just apply all sorts of “adjustments” to sunspot data… ‘accumulate then”
multiply by cos, add 52,,, divide by 6…. ect and show some “relationship” to the increase in temperature.
or you could attack temperature records and say all the warming was not real and we are still in a LIA
Steven, It’s not Jim Steele. It’s Jim Goodridge.
billw1984 “not Jim Steel” looking forward in comments that shut Mosher up for awhile
err wrong again.
===
nope, I’m right….even when CO2 levels shoot off the chart…you’re still trying to figure out that log
….and according to your post….it’s obvious why (Jim Goodridge)
“or.. you could just apply all sorts of “adjustments” to temperature data… ‘accumulate then”
multiply by cos, add 52,,, divide by 6…. ect and show some “relationship” to the increase in AGW agenda”
Mosh finally reveals the BEST algorithm !
Temperatures go up while CO2 goes up.
Temperatures go down while CO2 goes up.
Temperatures stay stable while CO2 goes up.
Tell us again how CO2 is correlated to temperature?
CO2 has little to no effect what’s so ever on climate, the sun’s polar field drives climate, fast polar reversals are more active, slow polar reversals are weaker and more dangerous… also, changes in planetary orbits such as “milankovitch cycles” and the graph I’ll post of Jupiters inclination of orbit to the elliptic are major forces (and the timing correlates with the suns polar reversals over thousands of years),
it has also been well known that our planet is dipping in and out of an interglacial for sometime and there will be another glaciation in our future, to suggest another glaciation will not happen due to a rise in Carbon dioxide is a very dangerous practice.
Whatsoever is one word.
So it is… thanks, I’m soooo silly 😀
Do you have a website Sparks?
It is, of course, theoretically possible that sunspots represent a small thumb under the temperature scale that is pulled up and down with the various oceanic-atmospheric cycles. No proof, however.
I remain an agnostic regarding solar. We wait and see.
Steven Mosher
I have never heard of anyone mention some strange unicorn property of the sun.
I’ve learnt that all the Unicorns are hiding out in the CO2 camp along with the other fantasy properties of (trace) GHGs, it is well known that planetary orbits and our stars own polar field drives planetary changes in climate. You really are out of your depth trying to push your “Global temperature” nonsense based on a “sensitive climate system” we’re talking about trace amounts of planetary carbon dioxide and you a correlating your data to it while trying to appear objective…
Steve? The data were changed. Why they were changed is perhaps a suitable topic of debate, but they were changed.
“Not even wrong” is a comment you have no claim to.
Feeling it in your bones again Mosh? Care to get beyond Shakespeare and into quantum?
Excitation happens when the unit of wavelength exactly matches the space between shells and subshells. It is not occult. Victorians would totally have understood it had the information been available. So should you.
Reading through all the contrary nonsense you spout, I would like you to actually look at all the parameters of the sun as it is our only heater. TSI is only one measure of the suns output and there are many others, it is not my job to educate you but it may be worth your while to educate yourself.
The Earths reaction to the sun typically has a lag of about a full cycle normal considering the size of the system. We have just have some very large solar cycles but the current one is small and the next will be smaller. The next few cycles will be a cooling period for the Earth nothing to do with CO2, it will put a spanner in the works of the alarminista crowd, such as yourself.
The suns moods are driven by two things the positions of our large planets and our place in the galaxy, the so called dark energy received by the sun varies causing the suns moods. The sun in turn cycles this energy out to the planets, if the sun is getting less the Earth gets less so we cool. The changes in energy flow also cause more or less earthquakes and volcanoes. THIS IS YOUR CLIMATE CHANGE, nothing to do with CO2.
Could you add graphs showing irradiance over the same time period(s)? Sorta hard to process with only the sunspot info.
irradiance
=========
climate change may be caused by the same thing that causes sunspots. sunspots are not caused by irradiance, so climate change may be caused by something other than irradiance. something that is as yet not recognized. it wouldn’t be the first time the experts got it wrong, and certainly won’t be the last.
Jupiter? Saturn? Neptune? ANy other guesses?
People seem to regularly forget that our planet orbits the dun with other planets. Massive planets. Really big planets. Big enough to influence the orbit of Earth. Every so often, they all line up and really move the Earth.
“When the Moon is in the seventh house
and Jupiter aligns with Mars,
then peace will guide the planets,
and love will steer the stars.
This is the dawning of the Age of Aquarus”
The moon has three or four orders of magnitude more gravitational influence on the earth than do all the other planets combined.
For that matter, compare the size of the moon tides to the size of the sun tides.
“This suggests that the temperature-CO2 correlation is spurious, rather than causal.”
According to my research I agree 100%
Recently I posted this elsewhere
Number of well informed contributors to this website maintain that solar activity effect on the climate change amounts to about 0.1 C. I am not so well informed, and not easily convinced by anyone’s views, I go and do my own thing and form my view.
N. Atlantic SST is available from 1850s onwards, but there are uncertainties regarding the earlier data.
Central England temperature has far more accurate data and goes back to 1660.
Dr. Svalgaard & co tell us that the sunspot group number GSN is a more reliable metrix than simple SSN. Despite some reservation towards Svalgaard’s ‘new’ GSN numbers they will be used in this short analysis.
To ascertain any effect of the solar activity on the longer term climate change I compared rate of change in the average GSN to the CET. For averaging I used a low pass filter since it gives more accurate results than a moving average.
Since the ‘new’ sunspot date has lost most of its up-trend and the rate of change by its nature tends to eliminate trend, I de-trended the CET data to obtain a more fair comparison as shown in this graph.
http://www.vukcevic.talktalk.net/G&C.gif
(click on the graph to enlarge)
Data used are
GSN: http://sidc.oma.be/silso/DATA/GN_y_tot_V2.0.txt
CET: http://hadobs.metoffice.com/hadcet/cetml1659on.dat
for the LPF response see the graphic inset.
From the graph above we can see that the solar effect varies from time to time, with respect to our dear sun, despite being the beginning and the end of it all, there are other factors, one of them being volcanic eruptions.
Strongest solar effect was just after coming out of the Maunder minimum and amounts to almost 1C, while the average is more likely to be around 0.5C. These values are based on highly smoothed data by the LPF, in reality the value could be somewhat greater. So much for the 0.1C limit to the solar influence.
I do not consider ‘global temperature anomaly’ index as having much value in relation to the real world I happen to live in, you are welcome to disagree, but I’m sticking to what I think to be right.
You can’t be serious? Uncertainties regarding earlier data? There are huge uncertainties now. Not small uncertainties, very large uncertainties.
The uncertainty in 1850 isn’t comparable to the uncertainty now. We don’t know the SST with any accuracy or precision. There are no checks on those data. It’s fantasy. To pretend otherwise isn’t in any way, shape or form, scientific. We may guess the SST based on limited, unconfirmed measures. Nothing better.
ooooh Popcorn!! 🙂
Just curious, has the sun spot count from 1600-1700 been scrapped because it is too questionable? Including even a slightly revised 1600-1700 would make the “trend” much more apparent.
“A major increase in sunspot trend was observed from 1940 to 2002.
This is coinciding with the atmospheric CO2 increase.” …. It’s worse than we thought….Burning fossil fuels is wrecking the sun……..
Phys.org article on comparison of solar activity comparison
http://phys.org/news/2015-02-sun-18th-century-similar.html
http://cdn.phys.org/newman/gfx/news/hires/2015/1-thesunsactiv.jpg
European observatories since 1850ish have good data, trend is increasing since 1850
Some claim mid 1930s were hotter than the 00s after about 2002, this is true for sunspot numbers.
The 30’s were hotter than today… The suns polar field reversed a bit slower too, which causes spikes in the ENSO such as el nino, when the suns polarities strike earth when they are reversing we always see these spikes.
very interesting analysis. did not know that we had a state climatologist but happy to find you here and looking at solar activity. would like to share my analysis of randomness in sunspot counts.
http://papers.ssrn.com/sol3/papers.cfm?abstract_id=2767274
Sunspots do ok on actual events, LIA maunder Minimum, Arctic ice was low in the early 70s, the bit NOAA chopped off of their charts used in the IPCC 1990 report.
late 70s spots jump up and stayed up and the ice has retreated until 2010 and it’s been bouncing up and down since.
It’s tempting to do an alarmist and scream correlation but one should always resist such haphazard science 😀
The ‘trend’ is likely not statistical significant.
What trend is?
Statistics is not statistically significant ! (it is numerical origami) And now we also have statistical maths for complex numbers.
G
George, could you imagine if I had a “magic” multimeter in work where every time I took a reading it changed? lol
Yes, I used to design digital multimeters. I also designed the mechanisms for faking stability in the least significant digit :-), and I can assure you that the lower digit (or the one below it at least) was hopping quite madly even if you didn’t see it.
The one I use regularly has a range button, it’s actually quite old but very accurate and if I take a reading with it you can be absolutely sure it’s correct 🙂
George E. Smith,
“Statistics is not statistically significant” is a wonderful phrase. I’m going to borrow it.
“””””…..
Peter Sable
May 3, 2016 at 4:19 pm
“
George, could you imagine if I had a “magic” multimeter in work where every time I took a reading it changed? lol
Yes, I used to design digital multimeters. …..”””””
My first job in Silicon Valley, was working for Dr. Victor Grinich; one of the Fabulous Fairchild Founders. Bob Noyce, Gordon Moore, Jean Hoerni, Julie Blank I think was one. Vic was the only EE in the group, and was responsible for developing the electronic testing equipment for testing semi-conductor devices in production.
So Counter-Timers, DVMs, Pulse Generators, etc were subsystems that we developed to be computer controlled (PDP-8, or PDP-11) to do the high speed testing.
My immediate supervisor (A Swiss chap) was the purported ” inventor ” and patentor of the Fairchild Dual-Slope integrating A-D converter, that became the crux of low cost DVMs. His ‘ invention ‘ was a modification of an already existing dual slope integrating DVM (patented). I can’t remember the name of that patent or the company that held it, but the Fairchild guy’s invention, made the original quite obsolete, and absolutely nobody would ever again build a dual slope integrator DVM that way. It was a free running system, and acted as if it was an AC coupled DC voltmeter. So the first reading it took was wrong, and so was the next, and so on, so it slowly settled down to the correct DC voltage value (few seconds).
The Swiss guy’s system was triggered, so it didn’t start integrating the test voltage, until it was ready to make a measurement. So you integrated the test voltage for a fixed interval of time, and then you applied a negative reference voltage, and integrated back down to zero. The ratio of the down reset time to the fixed up time, and the Reference voltage value gave you the result, which was accumulated in a digital counter that read out the test voltage value. Very low cost system for three or four digit DVMs.
Fairchild eventually acquired the earlier patent, which their patent depended on, and licensed the pair of them to other users.
There was only one problem with this, and that was a very big problem; spelled IBM.
The Dual Slope Integrating DVM was actually invented by IBM; the exact system and method later discovered by the Swiss guy. (who knew nowt about IBM).
IBM had a practice, when they invented things that were not mainstream to their business (computers); they published them openly in the IBM Technical Journal (fabulous journal, same as the BSTJ). This open publication prevented somebody else from patenting the idea, and then trying to prevent IBM from using it, should they decide to do so. Plus it made good ideas available to others who might be able to make some business out of it. Really great, and no patent issues to deal with for the users of such published ideas.
So both the Fairchild patent, and the earlier patent whose name I can’t remember, were actually invalid, and would not have survived a court challenge.
Fairchild subsequently sold the DVM and DPM business to another company (also forgotten), along with both of those invalid patents.
I have no knowledge as to whether Fairchild, or the other company they sold it to, were ever aware of the IBM prior art publication in the IBM technical journal.
We actually developed a five digit variant of the dual slope technique, that involved a second corrective integration cycle, while at Fairchild, for use in the semiconductor test system instruments.
At one point I became the manager of that subsystem group myself, and my Department Secretary was a lady who had been Dr Grinich’s personal Secretary, when he was the divisional VP.
She later on became the secretary for one of the big brand name mucky muck silicon valley law firm’s top partners.
That was when secretaries were real secretaries, and were totally invaluable to their bosses. She certainly was for me; I would have been lost without her. Yes she also had something on everybody, I’m sure, so she could move mountains, when necessary.
Well I digress. But yes, I know about DVMs. I also designed and built what is believed to be the very first commercial piece of electronic test equipment, that was entirely constructed out of small scale integrated circuits. (Fairchild RTL circuits developed for Minuteman and the like). So if you ever run across a Monsanto Model 1000, 20 MHz eight digit general purpose counter timer, with its Rosewood handles on the front, you will know who designed it. (Nixie Tube display). That was Christmas of 1964.
G
It doesn’t necessarily matter. All that matters is that the earth may have received more energy recently than it did in the past. Current thinking is that it’s not enough but then again current thinking wants to place the blame on one component of the climate rather than accept it’s made of a great many components interacting.
Except sunspots (and for that matter TSI) have been decreasing since 1940. Your accumulated departure from average graph has little physical meaning, unless you are actually arguing that the climate is a function of the cumulative sum of the difference from average of sunspots, rather than the actual sunspots or TSI observed at the time in question…
Methinks Leif will have some issues with your interpretation of his data when he arrives 🙂
Sunspots are on a downward trend since 1960 not 1940 but the trend is still increasing since 1850 not by much but there it is, it is no more evidence than the 18 year correlation of CO2 and temperature from 1975 to 2002 (before someone denied the 1930s hot) :p
The sunspot peak for the IGY of 1957/58 was the highest sunspot peak in the credible record. It’s been trending down ever since.
Dunno why. Don’t care either, it just is so.
G
@ george e smith, 256 pm May3 : Dunno why. Don’t care either, it just is so.
Thanks for that george, I am starting to think the same ( sane?) way.
G
That the earth has quite a bit of thermal lag shouldn’t be surprising.
Lag is one issue, inputs into a chaotic system may take time to manifest, this also works for the oceans eating the heat argument too, there is no how so it is not interesting to me, just guessing for the most part I reckon.
Seeing as we dont know what causes El Nino, I might as well guess that radiance charges up the oceans and the effects manifests in El Nino events and a purge of excess heat from circular systems into the climate will cause a sudden cooling. << I have no idea what I am talking about but seeing as we are just making guesses 😀
The question is "how", and we dont know "how", there is an epic amount of educated guessing going on, which is fine, but tell people that is what is going on, the arrogance, and models cant tell us because they do not incorporate known unknowns and unknown unknowns. The general public have no idea how lacking models are, none and I am not talking about the divergence of most models compared to observation. That's the least of their problems
Air temps respond fairly rapidly, ~18F/day, and 75F/year swing in temps.
It take on average till Jan4th for minimum temps to start rising from the longest day of the year, and till July 28th for max temps to peak past the longest day. On average since 1940 through 2014.
For the stations used for these, Daily Solar kWh/day for a flat surface minimum energy was Dec 22nd, max was on Jun 22th.
My guess is that the delay from Max solar to Max temp is delay in the rate ocean evaporation takes to respond to reduced solar.
Also, these were all stations (North and South of the equator), so they cancel each other some, once I get all my reports redone for 2015, I’ll have more to work with, I think I can directly compute Climate Sensitivity in this fashion.
Earth doesn’t have a thermal lag.
When the sun goes down in the evening, the surface Temperature drops rapidly so that formerly hot black top is cool to the touch long before evening twilight ends.
And by morning it is ALL much colder than it was at sunset.
G
And next morning when the sun rises, the Temperature will start rising immediately just as fast as it can, with no lag at all.
George energy is taken into the climatic systems, and we don’t know any more than that. So we cant claim a lag or no lag.
Especially with oceans, do we really know if there are lag effects lasting a thousand years or not, just because we have not statistically identified any trends?
it doesn’t/
We just do not know, words scientists do not use nowhere near enough
George, if the earth doesn’t have a thermal lag, why is the hottest time of the day an hour or so after the time of max insolation?
If the earth doesn’t have a thermal lag, why is July hotter than June in the northern hemisphere?
The earth has a tremendous amount of thermal lag, it takes decades to centuries to heat the oceans.
of course it would be silly to claim one input into a poorly understood chaotic non linear system will result in one linear outcome. Ahem.. cough AGW cough
Everything is happening just as fast as it can; so nothing is waiting for something else to happen.
If you supply energy to some system at some (non infinite) rate, and some fraction of that gets absorbed (immediately) by something that has a certain specific heat, then its temperature will start to change, as fast as it possibly can given the limited rate of energy input, and once the Temperature of that starts to change, it will start diverting some “heat” energy to something else that is colder, and those things will change Temperature just as fast as they can given the limited rate of energy transfer to them.
Nothing is waiting for anything.
G
If you choose to call that a lag, so be it. If something is lagging then presumably there must be something else that is leading, but how many billion years do you want to go back to claim the start of whatever it is that is lagging; in your view.
Let me get this straight!! you believe in the accumulation of temperature caused by a tiny amount of Carbon dioxide in the planets atmosphere, but not energy from the sun reaching the planet?? Interesting…
Zeke
There are significantly more consternating issues of “interpretation” and “logic fail” at the heart of the CO2 based climate orthodoxy you [and Mosher] espouse. In particular the proposition: CO2 is a greenhouse gas, ergo an increase in man-made CO2 is the main driver of temperature on earth – inherently unscientific because it is impossible to prove or disprove.
And an increasingly untenable one [Karl, et. al. efforts notwithstanding] since three independently sourced and managed data sets show a flat lining of global temperatures over the past 20 years – the very same period N.B. in which mankind released some 35% of all anthropogenic CO2 since 1750. Fail on both correlation and causation I would say.
But then again, faithful interpretation lies at the heart of any orthodoxy, and is blind to logic.
Why was the revision necessary?
https://www.google.de/url?sa=t&rct=j&q=&esrc=s&source=web&cd=5&ved=0ahUKEwi6iZqZwMHMAhXqCpoKHaCxD3wQFghDMAQ&url=http%3A%2F%2Farxiv.org%2Fpdf%2F1407.3231&usg=AFQjCNGPwtrjSLM7Jsat70P3uCL2X9Pb0A&bvm=bv.121099550,d.bGs&cad=rja
That linear trend is over 315 years. The more immediate impact of the most recent couple of cycles (22 years) are not captured by that.
It would be much better to break it into 100 year epochs.
The two are not mutually exclusive.
Nope. A couple of lower than average cycles (24 & 25) don’t make for a quite period. The Sun is fine.
Let’s look at a long-term weather/climate event influenced by our sun and not by any man-made CO2 fairy tale.
Jupiter’s Red Spot continues to shrink. Now we really don’t understand the dynamics of what created it, but the darker red is undoubtedly cooler ammonia compounds from deeper in the Jovian atmosphere.
http://science.nasa.gov/media/medialibrary/2014/05/15/splash2.jpg
source: http://science.nasa.gov/science-news/science-at-nasa/2014/15may_grs/
plus here for a really cool time lapse video of Jupiter from Hubble:
http://www.nasa.gov/press-release/goddard/hubble-s-planetary-portrait-captures-new-changes-in-jupiter-s-great-red-spot
But this July 4th, the NASA Juno probe will arrive to take a close look for a couple of years:
http://www.nasa.gov/sites/default/files/thumbnails/image/pia13746-whereisjunonotext.jpg
IIRC, this is NASA’s deepest space use of solar PV to power a probe.
http://www.nasa.gov/sites/default/files/thumbnails/image/junorotate_web.gif
Any significant variation in solar output should be seen in the gas giants, if indeed the sun is “going to sleep” for a bit.
Thanks for the nice Jupiter pictures, joelobryan.
The “thanks” is really to the honest scientists and engineers at JPL-Pasadena and Goddard-Greenbelt. (not the those pseudo science Charlatans at the the other NASA-Goddard)
Solar magnetic influence and alignments of planets are used for accurate mid and long range forecasting with a 88% success rate, which is about as good as 4-5 day forecast accuracy, this is something that should be getting more attention and funding.
This method predicted the US weather well before it was out in the US. A hurricane and its path 80 days in advance, the end of the Indian floods and the UK record snows in 09\10 when the met said mild.
There is obviously something to this method of forecasting. Maybe it could be expanded to longer term predictions as far as a chaotic system will allow anyway, no method on current computers can do it.
I can accurately predict every time the tide changes from my balcony and watch the sea go out and come back in, the integrate timing of major natural forces acting on our planet are always being swept aside. there is only one reason for this and it’s to down play nature in favour of a human cause…
Good discussion.
I hate to bust the bubble, because Jim Goodrich is a good guy, but once you take autocorrelation into account the p-value of the sunspot “trend” is 0.36 for monthly data and 0.27 for annual data.
In other words, there is no statistically significant trend of any kind in the sunspot data.
Folks, it’s not optional. When dealing with highly autocorrelated datasets, you MUST allow for the autocorrelation when calculating statistical significance.
Regards and regrets,
w.
” there is no statistically significant trend of any kind in the sunspot data”
Is the debate over Willis? There’s always someone who has their mind made up I guess.
Sparks: There’s always someone who has their mind made up I guess.
That isn’t what he wrote. There is little evidence that the “line” is different from a flat line.
I note the second chart is a cusum with latest value equal to zero. Ie back where it started. No rise and no fall. Huh.
Is that statically insignificant trend still a 1% per year increase?
Oh good, Willis must have a satellite link or something on his boat. I was going to have to put together the signal processing version of this point, but now I don’t have to…
Naw, we leave tomorrow, I’ll be out of touch until New Caledonia.
w.
Applying common sense is always a good idea when drawing conclusions from a graph. If the sunspot count was really increasing at “1% per year” from 300 years it would have increased by 300% by now. It hasn’t. In fact solar activity is falling. Ask Leif if he turns up. Putting a linear trend line through that data is just plain silly.
@ jimmi, @ 5:01 pm May 3, “If it is increasing 1% per year from 300 years it would have increased 300% by now” , I wonder about that should it be not accumulative and way higher? ( I am really terrible at this but if it is in year 1, it is 101% and then increases 1% on 101% in year 2 would that not be fractionally higher than 102 % and so on?
We don’t know enough to claim any trend is significant anyway.
Correlation is what it is, and nothing else.
Until we can figure out all of the inputs statistical analysis will be a sore replacement for solid data.
We know sunspots are related to irradiance, but we dont know how exactly, and we dont know what effect irradiance changes have on climate, whether driver or merely energy input which is put to work, well, what doesn’t get reflected anyway.
Is it wrong to say we are poking around in the dark with a stick on much of this debate?
Evolution baby!! 😀
Reports from others at the National Solar Observatory NSO and the NASA Marshall Solar Physics Center have said cycle 24 is the smallest sun spot number for 100 years. Looks like the California guy has got it very wrong. Russian solar physicist Abdussamatov agrees with low solar sunspots
T,
it (SC25) probably will be a lower cycle than 24. the solar models on magnetics and hemispherical readings will likely get broken and their adherents backpeddling to “eat crow.”
I’ve been musing on the sunspot number, TSI and solar activity correlations, particularly in light of the current cycle.
This cycle has had the fewest earth-directed x-class flares of any since we started monitoring flaring. Geomagnetic storm conditions at earth have been weaker as well.
At this stage it’s just a musing, but what if the effect on climate is not merely the amount of energy reaching the earth, but also the form that energy takes. If we’re taking fewer, weaker shockwave events, and having fewer, weaker plasma penetration events in the upper atmosphere, what effect does that have on our climate?
If the suns polarities remain at the geographical north and south for an extended period we’ll find the answer to that question, the precision in which we can time actual events will be impressive.
Instead of SSN, it seems like sunspot area may be better to look at for a potential link. See data below.
http://solarscience.msfc.nasa.gov/images/bfly.gif
You likely wont see the real trend until you have data that spans the suns complete orbit around the center of the milky way…. But thats just my opinion. Im sure the galaxy has negligible impact on the sunspot numbers 😉
a quarter of a billion years is a tad too long to wait for humanity.
Steven Mosher May 3, 2016 at 2:44 pm said
“temperature is increasing ( Yes there was an LIA)
TSI is NOT increasing ( yes Leif did fantastic work)
So, we agree that it must be “something else” driving the temperature.”
Yes, because it is right in front of your collective noses – but you just don’t want to see it!
It is the lunar tidal modulation of the seasonal variations in the solar flux.
In the long term, this is coupled with the hemispherical asymmetry of the Earth’s surface properties (i.e. Nth Hemisphere – dominated by continents, St Hemisphere – dominated by oceans).
On inter-annual time scales
There are periodic slow downs in the Earth’s rotation rate every 13.66 days. These slows downs are caused by the passage of the lunar tidal bulge across the Earth’s equator once every half lunar tropical month = 13. 66 days. The ratio in the magnitude of the increase in Length Of Day (LOD) at one crossing with respect to the magnitude of the increase in LOD at the next is primarily governed by the orientation of the lunar line-of-apse with respect to the seasonal cycle as marked by the solstices and equinoxes (there is also a secondary effect caused by the 5 degree tilt of lunar obit with respect to the ecliptic). Please see:
http://astroclimateconnection.blogspot.com.au/2016/03/there-is-natural-gleissberg-like-cycle.html
On decadal time scales
The climate variation is driven by the ratio in strength and frequency of El Nino to La Nina events – This is dominated by the 31/62 year lunar tidal cycle. For 31 years, El Ninos start in years when lunar line-of-apse is pointed at the Sun near the Winter/Summer solstices, then for next 31 years, El Ninos start in years when lunar line-of-apse is pointed at the Sun near the Vernal/Autumnal equinoxes.
On centennial to millennial time scales
The climate variation appear to be correlated with variations in the overall strength of the Sun’s magnetic field as indicated by Be10 and C14 proxies. These primarily occur at 88.5 years (Gleissberg cycle), 208 years (de Vries Cycle), 354 years, 510 years, 708 years, 980 years (Eddy Cycle) and 2300 years (Hallstatt Cycle). It just so happens that these cycles in the Sun’s magnetic field strength are matched by the times at which the lunar line-of-apse points at the Sun at either the solstices or equinoxes of the Earth’s seasonal calendar (in a reference frame that is fixed with the Earth’s orbit).
This produces a long term 21,000 year climate forcing which when coupled with the Milankovitch orbital forcings and the formation and melting of ice sheets at the Earth’s poles, produces the ice-age cycles.
@ Ian Wilson
Very nice Ian.
it was never as simple as 120 k yr cycles glacial-interglacial. Even during the Pleistocene in the paleo-records, we see rapidly warmer D-O events and Heinrich cold stadial events interspaced during Glaciations. D-O events still happen in interglacials, but today’s Climate priests cannot (by church canon and dogma) acknowledge they are likely natural variation or else their offering plates (grants from political authority) would most assuredly go bare. So today, the dishonest climate priests have sold their integrity for a a bauble of gold and use a natural D-O event as “unprecedented” to extract offerrings to “appease the climate gods for salvation from their prophesied thermageddon.”
“TSI is NOT increasing ( yes Leif did fantastic work)”
And like Tom Wiggly.. he told us was going to do it, BEFORE he found a way to do it.
I always wonder about “revised datasets”. Do they now represent “concretely, empirically, objectively” verified data (i.e. the absolute truth). Or, are they merely questionable data altered by “informed opinion” — that may be altered in the future by even “better informed opinions” (i.e. a guess).
Unless we know the genuine, accurate empirical data, we can’t really say much about genuine cause and effect. Given how poor the data collection relevant to AGW was in antiquity and even 40 years ago (versus recently) and the questions surrounding most proxy data, I think there is very little we can say with genuine confidence that confirms possible AGW or clarifies much else about what causes global warming/cooling in the relatively short term of hundreds of years.To me, its all “thoughtful educated guesses” — but, guesses nonetheless.
Are you suggesting that carbon dioxide proxies, as measured by fossil foramanifera, aren’t precise to 1 ppm (atmospheric)? By golly and by gosh! What were you thinking?
“Two Hundred and Fifty Eight Thousand Dead”.
Two Hundred and Fifty Six Viet Cong Captured is the correct citation.
Prisoners in Nigertown, It’s a dirty little war.
Thousand. Two Hundred and Fifty Six Thousand Viet Cong Captured. And that was just 40 years ago. Now, let’s discuss the precision of CO2 measurements 800,000 years ago shall we?
“Facing a dying nation of moving paper fantasy. Listening for the new told lies.”
I always wonder about “revised datasets”. Do they now represent “concretely, empirically, objectively” verified data (i.e. the absolute truth).
Of course not. They are best estimates at the time. If you want the absolute truth down to the last molecule you’ll find it in nowhere in science. You might have better luck in a church.
It is not 1% per year. It is under 0.1per year, or 30 in 300+ years.
What is the meaning of that graph about the orbital change of Jupiter? What does the graph show? The orbital inclination on the ecliptic? In what units? Degrees? Then it is not possible that the inclination was 30 degrees about the year -4000.
That’s an excellent question Jean, have a cookie 😀
There’s a clever bit of mathematics involved as the inclination of Jupiter changes about + or – 3.6 degrees over a period of 8 thousand years to the elliptic, and as we are dealing with whole numbers where you subtract the small integer from the larger one, I have done the conversion on a scale of 360 degrees instead of -180 or +180 with the deliberate intention of measuring the difference of change in a planets orbit as it travels around the sun and moves up and down in relation to other planetary bodies and the sun itself, it’s a technique I’ve developed called ‘orbital subtraction’ using very basic mathematical principles.
The values are correct and the graph is accurate in the way I have chosen to present it 🙂
I don’t understand how you got those values. According to Simon et al. (1994), of the IMCCE (Institut de Mécanique Céleste et de Calcul des Ephémérides), the inclination of the orbit of Jupiter on the ecliptic of the date, in degrees, is given by
i = 1.303267 – 0.0054965*T +0.00000466*T2 -0.000000002*T3
where T is the time in centuries from AD 2000, and T2 stands for the square of T, and T3 for the cube of T. That gives the following values
year inclination
-4000 1.6503
-2000 1.5307
0 1.4151
+2000 1.3033
+4000 1.1952
Jean Meeus
The values you have there look incorrect, the formula seems okay, it’s pretty straightforward, I’ll give you specific dates and you can double check.
1/1/4000 BC is 32° 58′
1/1/4000 AD is 9° 48
When looking for trends in solar cyles to temprature on Earth, one should look at the cycles themselves. Not for statistical correlation to those pieces which make up a cycle. Breaking a trend upwards would take greater exponent.
So we are prepared to believe the peeps counting sunspots by eye from the year 1700 on have been consistent throughout in that endeavour.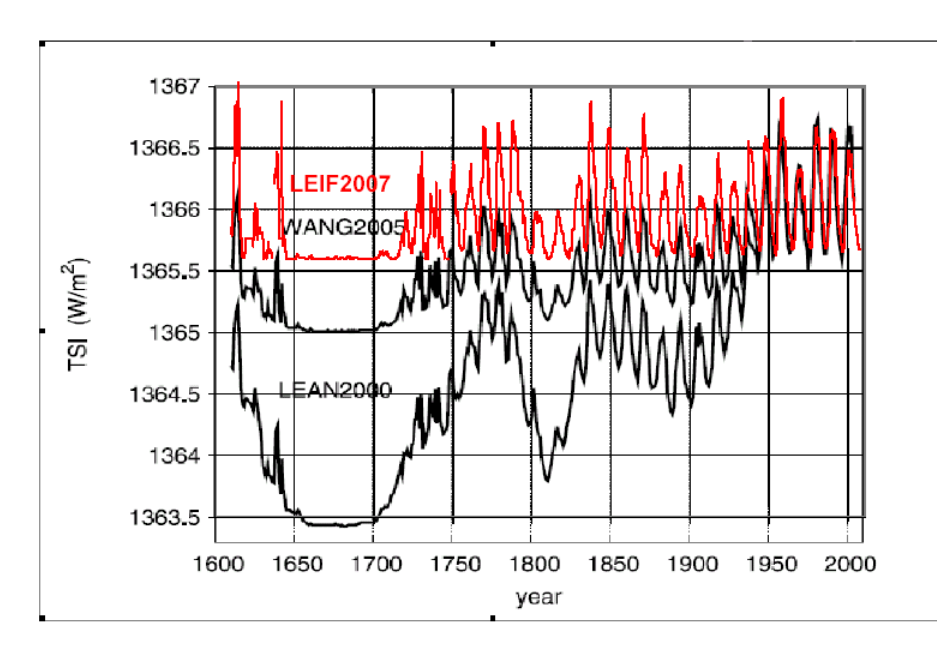
And that a 0.1% trend is statistically meaningful.
What, do you imagine, are the error bars here.
I would guess that they easily outway that trend, even allowing for Leif’s re-imagining of them.
(heck – they’ve *homegenised* them).
That aside, TSI has cycles and drawing any sort of linear trend through ~300 yrs of them is meaningless, false *science*.
TSI changes through them do not amount to more than 0.2 W/m^2 and the climate system responds quickly to them.
Sunspots and TSI have been in decline for ~35 years now. Completely contrary to the trend in average GMT.
There was not a “major increase in sunspot trend” from 1940 to 2002. Sunspots reached a maximum of 269 in 1957, and declined in number from there on.
According the Leif’s TSI reconstruction there hasbeen a variance of ~1.5 W/m2 in TSI since 1600.
“This suggests that the temperature-CO2 correlation is spurious, rather than causal.”
In no way does it.
http://solar-center.stanford.edu/sun-on-earth/600px-Temp-sunspot-co2.svg.png
So we are prepared to believe the peeps counting sunspots by eye from the year 1700 on have been consistent throughout in that endeavour.
And that a 0.1% trend is statistically meaningful.
What, do you imagine, are the error bars here.
We know what the error bars are, as you can see here:
http://www.leif.org/research/Estimate-of-Group-Number-Big.png
The graph shows the number of groups [the sunspot number is larger by a factor of 20] which is easier to determine back in the 18th century.
Can I have the data for that graph, The 1660 to 1700 looks different… and I’m curious…
Apologies… I meant 1600 to 1700…
http://www.leif.org/research/gn-data.htm
Correction:
TSI changes through them do not amount to more than 0.2%
It’s not only TSI, there are magnetic connections between earth and the sun, as studied by NASA, calling them magnetic ropes
magnetic connections between bodies require energy transfer too via energy waves. This area is very poorly understood at present.
Lets not get carried away.
Obviously CO2 emissions cause sunspots 😉
Obviously!!
Here’s how to fit the CO2-curve.
http://tinyurl.com/WoodForTrees-CO2-Model
With the first integral being the basic global temperature waveform, without (oceanic)oscillations,keeping Henrik Svensmark’s theory in mind.
And the second integral being the CO2 waveform, the temperatures integral as prof. Salby suggested.
Maybe one should take more notice of Leaf Stomata calibrations and air flask measurements than Antarctic ice cores?
What are the physical interpretations of the offsets, & why were those values used?
This is curve fitting, never mind the physics.
First offset: best fit to HADCRUT 4, second offset :best fit to CO2
From Warren Meyer about a week ago:
http://www.coyoteblog.com/wp-content/uploads/2016/04/Slide90.png
No, it has not:
http://www.leif.org/research/The-Waldmeier-Effect-Levi.pdf
Look closer, the sunspot number anomaly time-integral as shown on Figure 8 at http://globalclimatedrivers.blogspot.com clearly shows more solar activity after about 1945.
The old sunspot number used in your graphs was contaminated by the weighting of sunspot count by the Zurich observers introduced in the 1940s. This increased the sunspot number by some 20%.
http://www.leif.org/research/Effect-of-Sunspot-Weighting.pdf and
http://www.leif.org/research/Sunspot-Weighting-and-Group-Counting.pdf
Perhaps not unusually active, but clearly more active in the second half of the 20th century than in the first. The average monthly sunspot number is 30% higher as the figure shows (78 versus 102).
Leif – I used your SSN in determining R2 as noted in Table 1 of http://agwunveiled.blogspot.com . I still have that EXCEL file and looked at that graph (source of pre 1850 data is uncertain). It shows what looks like the same slope increase in about 1945. Wouldn’t that be expected with a “20% increase”?
This looks like the old sunspot numbers”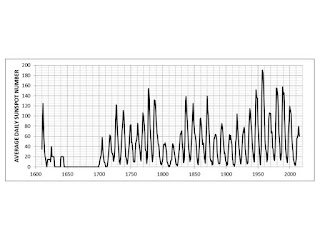
Leif – Doesn’t the longer uptrend starting in about 1945 in the chart above titled “Accumulative departure from average sunspot numbers” indicate higher solar activity?
Leif – The graph you posted is the Brussels Int as the caption, Fig 5 in http://globalclimatedrivers.blogspot.com states. I added the graphs that I used for ‘your’ SSN to http://agwunveiled.blogspot.com . Note the slope increase in about 1945 which I perceive indicates increased solar activity.
The slope depends on your choice of ‘average’ sunspot number.I could choose another value and get a negative slope, even.
Such cherry-picking is rather meaningless. The cosmic ray record shows that the 20th century was less active than the 18th:
http://www.leif.org/research/Comparison-GSN-14C-Modulation.png
What is important isn’t how hot the sun is, how many sun spots or cosmic rays, what is important is how much visible radiation reaches the surface of the earth. You can have a very hot sun, but a cloud layer that blocks the radiation from reaching the oceans. You can have a cool sun and clear skies and a great deal of warming. Unless there are solid ground measurements of the W/M^2 reaching the surface, the sun, cosmic rays etc etc will only be telling part of the story. Warmists always point to the stability of the sun as reasoning to rule it out as the cause. That is pure nonsense, even a stable sun can warm the earth much like lifting a blind can warm a room.
Not meaningless. It also shows the second half of the 20th century being more active than the first.
And sure there was global warming between the Maunder minimum and the Dalton minimum in the 18th century. The 18th century was quite good compared to the awful 17th century. Between 1695 and 1697 one third of the population died in Finland from famine due to failed crops (can you imagine that today?), and in Scotland the ill years at that time killed about 15% of the population and were one of the main reasons to join the UK putting and end to their independence. The start of the 20th century was quite bad climatically, although not as bad as the start of the 19th century, when failed crops contributed decisively to the French Revolution.
That graph reads as a climatic history. Food for thought.
I would say that except for the period 1910-50 when another factor might have become relevant, the fit of your graph to temperature reconstructions is also remarkably good:
http://i1039.photobucket.com/albums/a475/Knownuthing/Comparison-GSN-14C-Temp_zps3g7gauzw.png
So temperature reconstructions, climate history and solar activity all nicely fit for most of the period analyzed.
Javier May 5, 2016 at 4:49 am
Yet the world warmed strongly during the first half of the 20th century – and cooled just as solar activity was peaking.
.
The French Revolution kicked off in 1789 – towards the end of a series of strong solar cycles. Perhaps the crops failed in anticipation of weaker solar activity.
It doesn’t read quite as you describe.
I agree. The temperature record for all of the 20th and so far for the 21st go in opposite direction of solar activity. This is well-known and need not be flogged anymore. But true cult-believers are fully capable of overlooking this fact, as we see here. So, I say, let them as they are lost anyway.
co2islife May 4, 2016 at 4:05 pm
” What is important isn’t how hot the sun is, how many sun spots or cosmic rays, what is important is how much visible radiation reaches the surface of the earth. You can have a very hot sun, but a cloud layer that blocks the radiation from reaching the oceans. You can have a cool sun and clear skies and a great deal of warming. Unless there are solid ground measurements of the W/M^2 reaching the surface, the sun, cosmic rays etc etc will only be telling part of the story. Warmists always point to the stability of the sun as reasoning to rule it out as the cause. That is pure nonsense, even a stable sun can warm the earth much like lifting a blind can warm a room.”
Once again you seem to be confusing TSI and insolation. You have pointed out insolation changes due to cloud cover but that does not have anything to do with the stability of the Sun’s energy output. Keep in mind that in your window example the energy hitting the window is the same whether the blinds are up or down. The position of the blinds only determines how much energy is let in not how much is available from the source.
John Finn:
“Yet the world warmed strongly during the first half of the 20th century – and cooled just as solar activity was peaking.”
You talk as if the Sun should be the only factor affecting climate and the correspondence should be perfect. Logical Fallacy of Argument by Demanding Impossible Perfection. The general agreement of solar activity and climate is undeniable, but I don’t see why we should expect it to be perfect.
“The French Revolution kicked off in 1789 – towards the end of a series of strong solar cycles. Perhaps the crops failed in anticipation of weaker solar activity.”
1789 falls in the deep prolonged minimum between cycles 4 and 5. Look at the graphs above.
“It doesn’t read quite as you describe.”
Just review the climate history and take notice of when most of the bad periods have taken place.
The general agreement of solar activity and climate is undeniable
It is herewith denied.
You point out yourself that the agreement broke down in the first half of the 20th century. Sine the 1950s, solar activity has been decreasing while temperatures have soared.
I dissent. Let’s make it more simple:
http://i1039.photobucket.com/albums/a475/Knownuthing/Sunspot-Activity-Temp_zpsmjipiser.png
Above average periods would cause warming, while below average periods would cause cooling. As we are recovering from a very cold epoch, the general trend is upwards and recent warming periods have caused temperatures to be higher than previous warming periods.
If current below average trend prolongs for a couple of decades, as expected, we might see some cooling.
The accumulative deviation from the average depends on what value you use for the average. So is a free parameter that you can vary a you want, hence has no physical meaning.
My EXCEL file allows easy changing of the average SSN. I have several with different SSNavg. The overall slope of the graphs changes with the value of SSNavg but the abrupt increase in slope at about 1945 is consistent in all of them.
Look at this plot:
and you’ll not see any special increase in 1945 different from other increases in earlier centuries.
Furthermore solar activity is now down to where it was 100 years ago, and temps are not. In every century since 1700 there has been the same sort of increase and decrease.
As warming fails to progress we will see even more dismal attempts from few zealots to eliminate out sun from the climate change, but when it all fails I suspect ad home and personal abuse might be the next stage.
Attempts to write out solar influence on the climate change are doomed to failure !
‘ad hom’
Auto spell correct is a pain !
As warming fails to progress we will see even more dismal attempts from few zealots to eliminate out sun from the climate change, but when it all fails I suspect ad hom and personal abuse might be the next stage
This has already started by using phrases like “dismal attempts from few zealots”.
Sparks:
Sorry, but your values for the orbital inclination of Jupiter seem absurd. Remember that in the formula T is expressed in centuries from the epoch 2000.0. For the year 4000 BC (that is the year -4000), we therefore have T = -60. This gives i = 1.6503 degrees. I cannot understand how you obtain the improbable value of about 33 degrees.
And it’s all the fault of humans.
Made me smile. From the history of the discussion it was foreseeable that the 10 sentences, that I counted , would get discussed against their content. So
“Thanks to Dr. Leif Svalgaard for help in revising sunspot numbers.”
– and for patience!