From York University
Citizen scientists collected rare ice data, confirm warming since industrial revolution

TORONTO, April 26, 2016 – In 1442, Shinto priests in Japan began keeping records of the freeze dates of a nearby lake, while in 1693 Finnish merchants started recording breakup dates on a local river. Together they create the oldest inland water ice records in human history and mark the first inklings of climate change, says a new report published today out of York University and the University of Wisconsin.
The researchers say the meticulous recordkeeping of these historical “citizen scientists” reveals increasing trends towards later ice-cover formation and earlier spring thaw since the start of the Industrial Revolution.
Sapna Sharma, a York University biologist, and John J. Magnuson, a University of Wisconsin limnologist, co-led an international team of scientists from Canada, United States, Finland, and Japan looking at this early data. Their findings are published in Nature Scientific Reports.
“These data are unique,” says Sharma. “They were collected by humans viewing and recording the ice event year after year for centuries, well before climate change was even a topic of discussion.”
The records from Lake Suwa in the Japanese Alps, says Sharma, were collected by Shinto priests observing a legend about a male god who crossed the frozen lake to visit a female god at her shrine. A local Finnish merchant initiated data collection on Finland’s Torne River because the river, and its frozen-or-thawed status, was important to trade, transportation, and food acquisition.
Ice seasonality, or when a lake or river freezes over in winter or thaws again in spring, are a variable strongly related to climate, says Magnuson. And while such a long-term, human-collected dataset is remarkable in and of itself, the climate trends they reveal are equally notable. “Even though the two waters are half a world apart and differ greatly from one another,” he says, “the general patterns of ice seasonality are similar for both systems.”
For example, the study found that, from 1443 to 1683, Lake Suwa’s annual freeze date was moving almost imperceptibly to later in the year – at a rate of 0.19 days per decade. From the start of the Industrial Revolution, however, that trend in a later freeze date grew 24 times faster, pushing the lake’s “ice on” date back 4.6 days per decade. On the Torne River, there was a corresponding trend for earlier ice break-up in the spring, as the speed with which the river moved toward earlier thaw dates doubled. These findings strongly indicate more rapid climate change during the last two centuries, the researchers report.
In recent years, says Magnuson, both waters have also exhibited more extreme ice dates corresponding with increased warming. For Lake Suwa, that means more years without full ice cover even occurring. Before the Industrial Revolution, Lake Suwa froze over 99 per cent of the time. More recently, it does so only half the time. A similar trend is seen with extremely early ice breakup on Torne River. Extreme cases once occurred in early May or later 95 per cent of the time, but they are now primarily in late April and early May.
“Our findings not only bolster what scientists have been saying for decades, but they also bring to the forefront the implications of reduced ice cover,” says Sharma. The consequences of less ice span ecology, culture and economy. “Decreasing ice cover erodes the ‘sense of place’ that winter provides to many cultures, with potential loss of winter activities such as ice fishing, skiing, and transportation.” Less ice and warmer waters also lead to more algal blooms and impaired water quality, she says.
The team of researchers say they are planning follow-up studies to better understand the ecological consequences of the big changes in these two water bodies.
###
Direct observations of ice seasonality reveal changes in climate over the past 320–570 years
Sapna Sharma , John J. Magnuson , Ryan D. Batt , Luke A. Winslow , Johanna Korhonen & Yasuyuki Aono
Scientific Reports 6, Article number: 25061 (2016) doi:10.1038/srep25061
The paper http://www.nature.com/articles/srep25061 (open access)
Lake and river ice seasonality (dates of ice freeze and breakup) responds sensitively to climatic change and variability. We analyzed climate-related changes using direct human observations of ice freeze dates (1443–2014) for Lake Suwa, Japan, and of ice breakup dates (1693–2013) for Torne River, Finland. We found a rich array of changes in ice seasonality of two inland waters from geographically distant regions: namely a shift towards later ice formation for Suwa and earlier spring melt for Torne, increasing frequencies of years with warm extremes, changing inter-annual variability, waning of dominant inter-decadal quasi-periodic dynamics, and stronger correlations of ice seasonality with atmospheric CO2 concentration and air temperature after the start of the Industrial Revolution. Although local factors, including human population growth, land use change, and water management influence Suwa and Torne, the general patterns of ice seasonality are similar for both systems, suggesting that global processes including climate change and variability are driving the long-term changes in ice seasonality.
I was less complimentary last night whenI found that this graph:
http://scottishsceptic.co.uk/wp-content/uploads/2016/04/TrueImage-.png
has been turned into this:
http://scottishsceptic.co.uk/wp-content/uploads/2016/04/Fraud.png
Article
That is so bad it should never have passed peer review.
Give man a break, he’s just not mastered the Excel.
Come to thing about it
Diocletian, my Dalmatian dog, made a far superior global temperature dot graph.
http://www.vukcevic.talktalk.net/DD.jpg
Vuk
You should be ashamed of yourself by failing to interpret the Dalmatian scatter graph properly. Clearly, the preponderance of data points goes down the belly, meaning a substantial temperature drop from 1900 until 1960. At this point it shoots up, obviously due to mans impact from that date-as acknowledged by the IPCC.
It appears your dog then ate the resultant hockey stick evidence, as it looks very pleased with itself.
For this unfamiliar with Roman History, Diocletian was a Roman ’emperor’ who came from humble beginnings from an area that might be familiar to Vuk.
http://www.roman-empire.net/decline/diocletian.html
tonyb
“””””….. Climate News
Ice freeze data from two lakes suggest warming winters since the end of the Little Ice Age
From York University Citizen scientists collected rare ice data, confirm warming since industrial revolution …..”””””
So lemme guess. Izzit the ice that is rare, or izzit the data that is rare ??
g
Hi Tony,
Do you mind, I learned how to do graphs from my dog.
Diocletian’s palace is still standing, and people live in it, part is a hotel, and anyone more adventures can rent a double bed room for about US $30-40/night.
It’s starting in the middle of the LIA so it seems plausible to me.
Hey Vuk
Lovely dog He certainly doesn’t lookn100 years old
Thanks for the travel info about Croatia I was thinking of paying a visit for the first time this summer
Cheers
Hi
August could be on the hot side. Dubrovnik further south is a must and the bay of Kotor (on the other side of the border) is best from a boat ride. Lord Byron said of it: “At the birth of the planet the most beautiful encounter between land and sea must have been on the Montenegrin coast.”
Enjoy your trip.
I can see a face in that briar patch on the left with the hyperbolic blue lines on it. No I cannot identify the face, but it is definitely not Abraham Lincoln.
So what function does that blue venturi serve ??
g
The bottom trends lines are what you get if you water board the data sufficiently.
They also compared recent 63-64 year periods in Figure 2 to preceding 50 year periods, exaggerating the apparent increase in “extreme events” by 26-30%.
Part of the issue with the graph is that there were numerous years where the lake did not freeze at all – represented by the hollow circles at the top. There are enough of these years in the last few decades that they overlap on the graph, so you don’t realize that there are actually many data points above the trend line in there version of the graph (five in the last ten years). The short term trend line does generally follow the data as they provide it.
They gave all years with no freeze a value of 62, as that is the latest date of recorded freezing – occurring roughly 1600. That date is about twenty days later that any other date in the history, making it more likely an error or extreme anomaly as opposed to a true limit, which seems to be about day 45. Another issue is that for most of the record there were two sources which usually agreed. In periods they did not agree, they were inconsistent with which source to use, going back and forth between the two.
You could get away with an average for the century showing earlier melt, as well as other evidence there that climate has changed beyond doubt (just don’t blame man unless the data goes back another 500 years).
but a linear fit?
Hmmmm, CO2 started rising in 1683 ??
These warming winters are well documented in British records and more especially in the Met Office maintained CET from 1659. This from my recent article;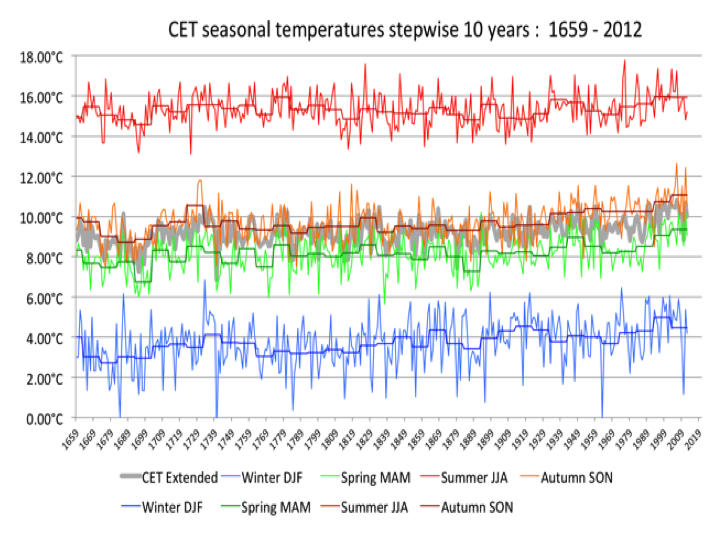
—- ——
Here are the four seasons from the Met Office data;
See Figure 4-CET seasonal showing decadal change
Cold winters in general -which can exhibit the greatest annual temperature range of any season-are becoming increasingly absent, as noted by the Dean of Brasenose College, Oxford-compiler of a major book on historic climate- in 1898:
“By 1708 the middle aged would say, where are our old winters?”
Other seasons have also warmed to a greater or lesser extent.
Eyeballing the graph in Figure 1, a rapidly warming trend from around 1700 can be observed. It rose from the nadir of the coldest LIA period around 1690 and came to a crashing halt with the winter of 1740 which heralded the coldest year in the series. This caused Phil Jones of CRU to write an article on the period in 2006 confirming:
‘The study, therefore, highlights how estimates of natural climatic variability in this region based on more recent data may not fully encompass the possible known range.’
(See section 3.5 for full reference)
—– —–
Taken from my article here
https://judithcurry.com/2015/02/19/the-intermittent-little-ice-age/
tonyb
I think it is very important to note that 3 out of the four major famines in the British Isles can be directly linked to cold periods. In particular, the 1690s cold period led to the famines that ended Scottish independence:
http://scottishsceptic.co.uk/wp-content/uploads/2015/03/IrishFamines.png
Climatereason and Scottish Sceptic,
I just have no idea how to read these plots since they don’t show me temperature anomalies relative to some arbitrary baseline period. You both are obviously not climate scientists. /sarc
Scottish Skeptic, the Irish famine was not a famine really, it was a failure of the primary staple crop, potats, it was a potato famine, there were 14 other staples and fruit and livestock.
The Monarchy shipping all of Ireland’s food to Britain when the potato famine was occurring was what caused the starvation as potats were the primary staple.
The same thing happened in the Bengal famine when Britain continued to ship harvests out of there while Indians were dying in the streets with foreigners in cafes eating eggs and ham and looking on.
Just saying, the Irish famine was not actually a famine, it was partly population reduction and fear in England of shortages there.
Blight was the problem in Ireland not cold surely
But yes, the thing about cold drought is, food doesn’t grow and it’s dry, whereas with warm drought, if you can get water via some means, you can grow stuff
So Mark,
With all of these foreigners in cafes eating eggs and ham and looking on, had they already eaten all of the cows that were available there for food ??
Were those Bengal Indians, Pakistanis or Bangladeshis ??
Did
“The same thing happened in the Bengal famine when Britain continued to ship harvests out of there while Indians were dying in the streets”
Actually the Bengal famine was mostly caused by the impossibility to ship supplies in since all major rice-growing countries had been occupied by the japanese.
The Winter CET temperatures look more like a natural warm-and-cool cycle with a period of about 50 to 70 years.
There is a slight upward trend that might be reversed by natural cooling starting circa 2020-2030, as we predicted in 2002.
3 million people died (between 1.5 and 4) as Britain continued to ship out food and British officers could eat well in cafes and so on, not so for the natives, but hey, like this is news regarding the British empire, this is par for the course in those times
As for cows, I have no idea.. British officers liked ham and eggs.
An Argument that the Irish Famine was Genocide
Author unknown
A controversial look at how the “Great Potato Famine” of Ireland in the 19th century. It was not a famine as there was plenty of food other than potatoes. The British government stood idly by and let millions of Irish die in what is now being called genocide.
A blight upon the potatoes of Ireland forever changed the histories of Ireland, England, and the United States of America. The blight that we now know was a water mold (and not a fungus as originally believed), Phytophthora infestans, attacked the cash crop of the Irish Catholic peasant farmer. This was the crop with which the Irish paid their rent to the English and Protestant landlords.
The Irish Famine was Genocide – Irish History Links
http://www.irishhistorylinks.net/History_Links
An Argument that the Irish Famine was Genocide Author unknown.
Enough stuff about the cow case / here from the ‘economist’:
“” style=”border: 0px; font-size: 12px; margin: 0px; padding: 0px; vertical-align: bottom;”>
IN 1997 Tony Blair, the British prime minister, made the first formal apology for Britain’s role in the Irish famine. Between 1845 and 1855 Ireland lost a third of its population—1 million people died from starvation and disease and 2 million emigrated. Mr Blair regretted a time when those who governed in London had failed their people. Two new books explore Britain’s role in the famine and rekindle the debate about whether its misdeeds can be considered genocide.
“The Graves are Walking” by John Kelly, a historian and popular science writer,
If in the UK, don’t rejoice too soon. Mayday is in just over 3 days, but the weather forecast for UK is one from the last January.
Click on the video link ‘UK Forecast Video‘
Spin to 1.0 min and see overnight temperatures, virtually all of UK is in blue at -2C.
http://www.bbc.co.uk/weather/
coldest weather in the warmest year evah.
The Cockbridge to Tomintoul Road A939 ‘Lecht Road’ was closed by snow this morning according to BBC traffic reports. However in 2013 the road was closed on 23rd May in 2013 so did not make it onto the main news.
“YELLOW EARLY WARNING of SNOW for parts of EASTERN SCOTLAND”
not to worry, some place north that has been adjusted 2c cooler with adjustments will be claimed to be creating the anomalies to keep the GAT (Gavin’s average temperature) at record levels
Scottish Sceptic,
I misread your post as “Warning Yellow Snow for parts of EASTERN SCOTLAND” – You know what they say about yellow snow…
Scottish Skeptic, they are warning of yellow snow?
Yellow snow is snow that has been warmed
And so it began!
And did they even look at other human activities? i.e. more growth around the lake producing HIE? Power boats? How about the strongish solar cycles during that time?
etc. etc. etc……
It’s a lake fed by hot springs with a freeway running past, which the paper says has been recently developed. There is so much wrong with the paper that it beggars belief it got published.
It’s also a lake surrounded by large towns! Suwa, Okaya and Chino.
Exactly, the also admitted that on the lake humans developed a hot springs resort…..yet blame the early ice break-up on CO2.
My professors in college would eviscerate any paper I turned in that made those kinds of assumptions and assertions. Heck I got a zero for slightly suggesting the pelicans I was observing off the coast of California MIGHT be fishing. ZERO with large freaking red letters on the top—DO NOT ASSUME OR ASSIGN SPECIFIC BEHAVIOR UNLESS DIRECTLY OBSERVED BY USING PROBABLE LANGUAGE. In smaller letters were the words, “if you don’t know, say you don’t know.”.
Could you have said they were diving into the water for no apparent reason ??
That would report a direct observation, with no speculation.
g
@george e. smith:
Yep, I was learning at the time and fortunately I had a lot of very strict professors who had no qualms about turning a research paper into a murder scene if it violated the rules of the scientific theory and drawing conclusions based on bias or inference.
If they were part of this peer review that paper would never have seen the light of day–no matter how much money was spent on it. To say I was taught by purists is an understatement. 🙂
I think the general idea of making observations in the first place was to then offer a possible explanation for what you observed; from which you could then devise further experiments to try and verify your thesis, or else disprove it.
I can’t imagine anything more useless than watching pelicans diving into the water, and then not speculating that maybe there was a shoal of fishes down there that they were feeding on.
I would fire all of those professors of yours for daring to restrict theoretical postulation.
Their attitude teaches one to simply shrug ones shoulders, and say; ” Gee, don’t ask me, I don’t have any idea what they are doing; and for good measure I couldn’t care less.”
G
@george e. smith:
“I think the general idea of making observations in the first place was to then offer a possible explanation for what you observed; from which you could then devise further experiments to try and verify your thesis, or else disprove it.”
That was the exercise. I unfortunately drew my conclusions from only my observations–probable conclusions but not as a way to devise further experiments, which is why I got a zero. Like I said, I was learning at the time–both the observation and how to use those to devise an experiment. It was very tedious I assure you but it taught me a very valuable lesson on being objective and questioning bias. And I learned that lesson well which carried though the rest of my college research papers.
Like salt water from road salt circulatory’s property owners install to stop ice from damaging docks. There are so many factors.
So they discovered the climate changes? WOW. Imagine that. /snark
From the paper:
The most important explanatory factors for ice freeze and breakup dates were atmospheric carbon dioxide (CO2) concentrations and local seasonal air temperatures (March for Suwa and January-April for Torne). In addition, NAO was significant for Torne after the start of the Industrial Revolution, while for Suwa ENSO was not a significant predictor in either period (Fig. 4).
WAIT, WHAT?? How the hell did they measure the CO2 concentrations from observed ice break-up data? AND HOW did they KNOW the NAO and ENSO had absolutely NO effect? Who was monitoring those?
Too many HUGE LEAPS to JUMP to their “justification” about CO2.
THIS IS PURELY WRONG ASSUMPTIVE SCIENCE.
More good news! Since the End of the Little Ice Age, the climate in temperate regions has been getting more benign for human beings! And the world is getting greener. And we’ve had an economic boom fueled by cheap energy. (and rivers navigable for more days, I guess. It’s getting harder for the prophets of doom who wish to control populations with visions of armageddon to convince folks. Isn’t science wonderful? Oh, wait. This is bad news?
I encourage people to look at the raw data graphs and the lines they are fitting to the data to. Almost pure noise, I couldn’t find R-squared anywhere in the article, it must have been pretty bad. And this is after dumping a bunch of the data that they didn’t like for multiple reasons.
Agree X1000. They claim a 95% confidence interval but just looking at those graphs I couldn’t figure out how they calculated anything let alone what they claim.
I sometimes think that the 95% confidence level so often boasted refers to the researchers being 95% confident that they don’t know a thing about the scientific method.
A.D. Everard
Statistically Significant
Statistically significant is a catch phrase developed in the mid-twentieth century to describe situations which are not otherwise significant. Of course the term may also be used in situations in which no particular significance has been found – since this would be significant in itself.
Journal of Irreproducible Results
Start tracing the roots of Exxon mergers to explain it.
These numbers do not match with their dreams…errrrr, I mean, hypothesis !
http://jonova.s3.amazonaws.com/guest/de/temp-emissions-1850-web.jpg
The answer to stopping CO2 global warming is in the graph. Between 1940 and 1945 CO2 was rising quickly but temperatures fell rapidly. Obviously that was due to WWII with all the particles thrown into the atmosphere from thousands of explosions and massive burning around the globe. So another world war with conventional weapons seems to be the answer. It also lowers the human population which, as we all know, is the scourge of Gaia. Now that we know the solution, shall we get started?
oh come on, they want nukes … much more airborne particulates and (this is the good part from the greens perspective) alot less evil humans after …
If that’s the case… you could also point to the Clean Air Act (and reductions in particulate emissions) for warming since 1970…
I believe that would be a real consideration.
Yes, the “Clean Air Act” definitely had a net increase effect on global temperatures through the removal of particulates
Tom et al:
http://wattsupwiththat.com/2016/02/29/climate-models-are-not-simulating-earths-climate-part-3/comment-page-1/#comment-2155478
[excerpt]
I reject as false the climate modellers’ claims that manmade aerosols caused the global cooling that occurred from ~1940 to ~1975. This aerosol data was apparently fabricated to force the climate models to hindcast the global cooling that occurred from ~1940 to ~1975, and is used to allow a greatly inflated model input value for ECS.
Some history on this fabricated aerosol data follows:
http://wattsupwiththat.com/2009/06/27/new-paper-global-dimming-and-brightening-a-review/#comment-151040
More from Douglas Hoyt in 2006:
http://wattsupwiththat.com/2009/03/02/cooler-heads-at-noaa-coming-around-to-natural-variability/#comments
Regards, Allan
of course, CO2 has only matched temperature from 1980 to 1998 where we have measurements.
Well that was before NASA really started “correcting” the chit out of temperature data, the Karlised data tries so hard (too hard) make temperature to rise with CO2.
This paper is just more of the same nonsense.
But different rates of emissions and different rates of cooling between the heating events
By your graphic
1860 to 1880 +0.35C
1880 to 1920 -0.4C (.4C cooling)
1920 to 1941 +0.57C
1941 to 1977 -0.11C (.1C cooling)
1977 to 2002 +5.7C
2002 to 2015(ish) +/-0.0C (0C cooling) so far
Chute 1977 to 2002 should be 0.57C as well
Looks like the amount of cooling experienced during the cooling phases is diminishing over time
Having their rivers clogged with ice is supposed to be good?
I believe they drove across the river when it was frozen rather than driving an extra hundred miles or so to the nearest bridge. That is a big economic boon, knocking three hours off travel time and much reduced fuel costs.
In the far north there are many places where ice roads are the only direct means of transport, and some of those ice roads are completely impassable when it thaws, or a major river crossing thaws.
“Ice Road Truckers” I believe it was on TLC.
We get by down here just fine without any rivers getting frozen over. And we can cross rivers year round. We have bridges.
True, we don’t get the neolithic joy of fording a river. Or waiting for the river to freeze so we can go see Grandma.
So coming out of the Little Ice Age means reduced ice coverage on bodies of fresh water. Gee, who in the world would have thought that? And from where did you receive your funding to study the hell of out this hypothesis? Are we now entering the Age of Disenlightenment?
But, Mikey Mann proved that there was no little ice, didn’t he??????
On some lake in Minnesota they put an old car out on the ice each winter and people guess which day in the spring it will fall through. That’s my kind of science.
One such lake was Lake Ripley on the south east side of Litchfield MN in Meeker County. It was put about 200 yards out beyond the swimming beach by the park. You guessed day and time it finally broke through. I was really sad when they stopped doing this due to ‘enviromental concerns.’ But places are still doing it: http://whotv.com/2013/04/05/annual-fundraiser-car-falls-through-ice/
Sound like they were making natural fishing reefs. As long as all the fluids were purged, it should be an environmental bonus.
If you follow the link in the paper, you can see graphs of the data. The sharply climbing “hockey stick” regression lines for the period 1900 forward on scatter plot for the lake in Japan are laughable. There is no other way to describe them. Totally dishonest!
The data for Finland shows a steady warming trend since the end of the Little Ice Age with no discernible acceleration of warming in the post 1940 period when CO2 concentrations have generally considered to be a factor. Nothing new here that we have not understood for a long time and nothing that makes it seem that CO2 is the culprit.
The Japan data is a joke. The Finnish data is an own goal, as it proves natural variation. Even IPCC AR4 did not think there was sufficient increase in CO2 to make a difference until after 1950.
This is part of the “history must be made match CO2 growth” campaign of revisionism.
Take two locations, add no knowledge of the area and the changes of worth, add copious amounts of assumptions and hey presto, climate change cake.
and of course linking breakup of ice after winters hundreds of years ago cannot and will never be empirically shown in anything because the data to do so does not exist and never will
“The team of researchers say they are planning follow-up studies to better understand the ecological consequences of the big changes in these two water bodies.”
There it is, the need additional grant money request. They are only “planning” the studies until they get the money. Let then eat ice.
Have they adjusted for the growth in nearby towns? Both in terms of warmer air temps from UHI and from any increases in waste water being dumped into the waterways?
Science the institution is well and truly f576ed
FUBARRED ?
too many letters 😀
Are you giving Marcus a “D” for having too many letters or is that one of those text smiley faces (that hurt my neck to look at)?
afonzarelli
April 27, 2016 at 8:09 am
Are you giving Marcus a “D” for having too many letters or is that one of those text smiley faces (that hurt my neck to look at)?
No I actually smile sideways, like a deranged Cheshire cat.
It is very disappointing to see a paper of this abysmal quality appearing in Nature. I could never had presented this kind of data in even an in-house presentation and not get laughed at!! It would seem that peer (or is it now all pal?) review has sunk to a new low. How can one now trust anything that comes out in what was a premiere science journal?
disappointing, but not surprising
So they “prove” that the industrial revolution caused climate change, but one could just as easily “prove” that the industrial revolution and climate change were coincident. The old “correlation does not equal causation” saying comes to mind.
Seems to be better “evidence” that the climate change caused the industrial revolution.
Yes, Tucker, i hate to say it, but thank God for the ipcc… The ipcc is claiming that as little as half of the warming of the last fifty years ONLY is due to humans. (y no mas…)
I am shocked, shocked! A warming trend during an interglacial period! Who’d a thunk it?
The willful abuse and misuse of the term “climate change” continues unabated, as intended.
Are these homogenized readings or raw data? How did they handle leap year way back when? The Romans had it right but you kind of wonder how they did it back in the 1600’s, especially with the fact the year is actually 365.2422 days and you even have to adjust once a century for that. So if you are going to display rates of change to the hundredths of a day per decade, you might actually be off a whole day to begin with.
And also, what constitutes a “break up”. I doubt there is a ASTM standard out there for it. A whole lot of subjectiveness out there, in my opinion.
Given the sources, the only possible meaning of “breakup” would be “passable”, as in you can row a boat through it.
Plus this is very old anecdotal evidences here, which I find odd, because the thousands of reports of extreme weather, storms floods and such in news papers for the last 200+ years is completely ignored.
It had to be, Iceland is the perfect example, all of the anecdotal evidence and Icelandic met measurement data all say Hansen’s redrawing of their temp record is complete BS
Such double standards one can only laugh, or get mad, so I laugh 😀
Besides Finland is known to get warm air in vie eastern Finland from Asia, this is largely why minimum temps are going up in Finland for the last 200 years.
Sometime in the middle 1700’s they changed from the Gregorian to the Julian calendar.
I’m getting so angry I’ll probably blow an artery one day. Springs here in Scandinavia had already been getting warmer 250 years before The Magic Molecule entered the stage.
Finnish Forest Research Institute METLA (government institute which by the way is mostly sceptical about AGW, can you believe?) says this about the Torne river and Torne valley temps:http://www.metla.fi/uutiskirje/mil/2012-01/uutinen-1.html
METLA have been receiving lots of flak here for their views.
I was also surprised Finnish state TV YLE, when the question of if the “weather” is related to “climate change” wa put to the meteorologist, she said “lets leave it up to the experts”, which I took as “If you cant say anything good dont say anything at all” 😀
Turning into a lovely Spring-
Snowfall in the Caribbean islands – In the spring
April Is Being Called The NEW DECEMBER for Toronto
Brazil – Historic cold wave on the way!
Snowing on Adriatic islands
Winter returns to Bosnia
Snow in the Netherlands today
Freak snow storm in London
Las Vegas ties lowest high since 1971
up to 18 inches snow expected in WY – late April
Almost May – Snowing in Flagstaff
1 to 2 ft of snow for northern Nevada
Winter returns to Germany
Up to 15 cm of snow in Denmark
Heavy snowfall in Belgium
Norway – Snow causes chaos on the roads
Unexpected snow in Czech Republic
Venezuela – Pico Espejo in Merida covered with snow
Heavy snowfall in Argentina
Heavy snowfall hits St Petersburg
Turkey – Snow surprise in April
Record-busting spring snowstorm in Newfoundland
Romania – Blizzards and heavy snowfalls in the middle of spring
Heavy snowfall closes major interstates in Wyoming and Colorado
Blizzard and (very) heavy snowfall in Sakhalin, Russia
Blizzard forecast for western U.S.
Record snowfall in Montana
Irish advised to take out the winter woollies again
Nova Scotia – Snowfall snarls traffic, cancels schools
Winter Storm Warning for Colorado – In mid-April
Heavy Snow Strands 300 Vehicles on Road in Xinjiang
Rare snowfall forces Taiwan to include snow-related questions in driver’s license test
Snow to sweep across northern Scotland this weekend
Up to 2½ feet of snow possible in Utah
Freeze warning for Illinois
Russia – Snowfall and blizzards continue
Record cold headed for Midwest, East yet again
Record snow in New York city – Only the fourth snowfall EVER in April
Coldest since the presidency of Ulysses S. Grant
Russia – Unexpected blizzard in Bratsk
Record cold across Southern and Northeastern Ontario
Snowfall and blizzards for the Urals, Siberia and the Far East
Snowfall and blizzards for the Urals, Siberia and the Far East
Boston flips from spring back to winter
Second snowiest march on record for Colorado ski resort
Snow in Texas and New Mexico on April fools day
Snow chaos in Germany on April Fools Day
but that’s just weather 😛
Hot days are obviously not weather but proof of climate change
Yep, some more weather…..
http://ecosocialistsvancouver.org/article/extraordinary-heat-wave-sweeps-southeast-asia-and-points-beyond
“All-time national heat records have been observed in Cambodia, Laos, and (almost) in Thailand, Malaysia, Singapore, and Vietnam. Meanwhile extreme heat has resulted in all-time record high temperatures in the Maldives, India, China, and portions of Africa as well. ”
http://www.deccanchronicle.com/nation/current-affairs/250416/searing-heat-continues-bengaluru-breaks-85-year-old-record.html
“Severe heat wave conditions prevailed in several parts of the country on Monday with Bengaluru recording the highest ever maximum temperature for April in 85 years at 39.2 degree Celsius, while Titlagarh in Odisha continued to sizzle at 46 degrees.”
http://www.cbc.ca/news/canada/north/pangnirtung-heat-record-1.3553971
“Pangnirtung, Nunavut melted a 90-year-old heat record Tuesday as temperatures climbed to 10 C, according to Environment Canada.”
http://myinforms.com/en-ca/a/31028664-calgary-breaks-heat-record-newfoundland-hit-with-snowstorm/
“Calgary broke a 106-year-old record on Tuesday as the temperature climbed to 27.1 C. The previous record for April 19 was set in 1910, when the mercury reached 26.7 C.”
I see that the comic relief has arrived.
Yep, that’s what I thought as I considered the stupidity of the OP.
…. and then you added that comment.
Confirmed.
Toneb
Question, when was the most number of days above 90f recorded in the US, what year?
What was the biggest heatwave index year?
#globalwarming
Mark:
Question:
What does the G stand for in AGW?
USA = ~2% of the globe.
The Satellites show no significant warming for 18 years.
Antarctic ice is growing
Greenland surface ice is growing
Global sea ice is not declining (last time I looked)
Meteorological balloon data corroborates the satellites.
Every single temperature metric that gives us an idea of the current trend in temperature shows no warming or cooling.
Except for one: The massively upjusted surface data heavily influenced by urban/rural heating.
So which metric do the “scientists” use?
And … I could add … it snowed here today (but didn’t settle for long).
Flurries in Paris yesterday…
But…but..but….that’s BECAUSE of AGW–don’t you read beyond the fold? LMAO. And the Polar Vortex (which was -60 F wind chills here…I had frost in my house!) is also because of AGW….yea right.
And they wonder why people in the US don’t “believe” and just drink the Kool-aid.
I have a theory; I think the Chicken Littles all bought property in Yuma, AZ and are trying to maximize their ROI by telling everyone it’ll be beach front property worth a fortune in 20 years. Because aren’t all their “predictions” about 20 years into the future?
What happened to New Zealand ??
g
Gee Englandrichard, That looks like an Al Gore Climate change speech itinerary
Is Al Bore really traveling this spring?? Must be too cold at his palace
More evidence that the LIA was global.
Amazingly incompetent and deceptive bit of analysis, well illustrated in their Figures 1 and 2. In Figure 1 they conveniently exclude 200+ years of data as unreliable in order to present a recent trend line that appears greatly accelerated, when including those data points makes it obvious that the recent history is a continuation of a gradual trend. Figure 2 compares recent 64 (Lake Suwa no freeze) and 63 (Torne breakup dates) to preceding 50 year time periods, thus exaggerating the apparent acceleration in these events by 28 and 26 percent respectively. Without such exaggeration, the data would appear to be more of a continuation of the historical trend. They found a point of inflection in the trend of Torne River breakup that is coincident with the end of the Little Ice Age, yet felt compelled to enlighten us with magical transforms of the obvious.
But wait, they haven’t done their adjustments yet. I can for see the ‘Benjiwa adjustment’: where during his honorable tenure as shinto head priest he required all materials that were written to be thoughtfully contemplated and hence they assumed the recording took place the day after observing but recorded the next days date.
Or the Julian adjustments and Gregorian adjustments all of which could be 10-14 days off. And Japan used the lunar-solar calendar (nengo), so we could have adjustments there. This won’t be over until they’ve properly adjusted all the dates!
By the end of the adjustments the lake will be shown to have evaporated completely.
When you torture the data, at least try to hide your fingerprints. Figure 1, 95% confidence intervals (those blue hourglass shaped lines) should enclose . . . . wait for it . . . . 95% of the points. Those lines enclose maybe a tenth of the points.
Talking of record keeping l myself have kept a record of the date of the first snow of the winter for nearly the past 40 years for where l live in North Lincolnshire England. lt is as follows.
77/78 21st Nov
78/79 27th Nov
79/80 19th Dec
80/81 28th Nov
81/82 8th Dec
82/83 16th Dec
83/84 11th Dec
84/85 2nd Jan
85/86 12th Nov
86/87 21st Nov
87/88 22nd Jan
88/89 20th Nov
89/90 12th Dec
90/91 8th Dec
91/92 19th Dec
92/93 4th Jan
93/94 20th Nov
94/95 31st Dec
95/96 17th Nov
96/97 19th Nov
97/98 2nd Dec
98/99 5th Dec
99/00 18th Nov
00/01 30th Oct
01/02 8th Nov
02/03 4th Jan
03/04 22nd Dec
04/05 18th Jan
05/06 28th Nov
06/07 23rd Jan
07/08 23rd Nov
08/09 23rd Nov
09/10 17th Dec
10/11 25th Nov
11/12 5th Dec
12/13 27th Oct
13/14 27th Jan
14/15 26th Dec
15/16 21st Nov
From this no noticeable trend stands out.
Yes since 2000 the two latest snowfalls have happened but also during this time has been the only the time its snowed in October since the record began. What this seems to suggest is that there has been less cold weather turning up during the winter. Rather then the cold setting into the season at a later date.
“From this no noticeable trend stands out.”
And nor should it, as a first snow is not an indicator of climate. In these climes it is more likely a transitory effect as a warm air arrives after a brief cold spell.
FYI: I also live in N Lincs and coming back from the local pub 20 mins ago it was snowing.
It’s called weather. And by no means unusual in April… in fact it’s more usual than snow in December.
Yet Tone, a hot day gets front line news in every liberal rag and has the Met going wow
Like their hottest evah recorded by a sensor right next to a runway at heathrow.
so why dont you use your time better dealing with the utter hyperbole on the Guardian, your time is wasted here, as we know weather is just weather, we just point this out for when Schmidt comes back telling us this was the hottest month in human history baaaaaahahahahaha
“Yet Tone, a hot day gets front line news in every liberal rag and has the Met going wow”
Now let me think …..
Oh yes that’s it.
That’ll be journalists wot do that……. because it sells.
Typical conflation of the science with the media with politics.
Typical lack of critical thinking.
Another citizen science story making the news..
SFU study taps indigenous stories to paint picture of climate change
Researchers at Simon Fraser University have analyzed observations of temperature and rainfall from 92,000 indigenous and non-indigenous people in an effort to fill in knowledge gaps in our understanding of the Earth’s changing climate.
Interviews gathered in 137 countries for about 1,000 studies paint a picture of changing sea levels, species ranges and rainfall, according to lead author Valentina Savo of the university’s Hakai Institute.
Changes in the timing and nature of the seasons — affecting fishing, hunting, food gathering and crop production — were observed in about 70 per cent of participating communities, according to the study published in the journal Nature Climate Change.
The observations of indigenous people match well with conventional climate data and computer models, but much of the information gathered comes from parts of the world not well monitored by scientists.
http://vancouversun.com/news/local-news/sfu-study-taps-indigenous-stories-to-paint-picture-of-climate-change.
Yet the Hudon’s Bay record is marginalized because it doesn’t conform to the narrative and is said to be from a single location. Such bullcrap because the ships entering Hudson’s Bay kept record’s as well. wtf?
“…… increasing frequencies of years with warm extremes, changing inter-annual variability, waning of dominant inter-decadal quasi-periodic dynamics, and stronger correlations of ice seasonality with atmospheric CO2 concentration and air temperature after the start of the Industrial Revolution. ”
Whoa Nelly!
I’m a simpleton. Help me out here.
“changing inter-annual variability, waning of dominant inter-decadal quasi-periodic dynamics, ”
Really? That’s how they want to say that? Whatever it is?
I get the first part. Changing variability.
However, and sorry for the crudeness, but the second part is the stuff written by a quasi-ass trying to display their education and self impression of superiority.
It (the paper) reads like something from Sks if I am to be totally honest.
Go wash your mouth out, Mark?
I did, with paint stripper
Lake Suwa is a resort town with 100’s of hotels, ryokans (small Japanese inns) and private homes with onsen (hot-spring baths) dumping their onsen runoff water into Suwa Lake, which obviously didn’t occur 500 years ago….
Almost the entire lake is surrounded by homes, ashfault roads, hotels, restaurants, office buildings, large parking lots, and one of the busiest highways in Japan (Chuo Expressway) runs close to lake as do various train lines…. Obviously none this stuff existed 500 years ago, either…
What a BS paper. The huge UHI effect can account for most of the change, plus natural LIA warming recovery for the rest…
What a BS paper…
You have provided the most important comment of all by introducing a new variable. Even if this new information did not influence their findings, they should have made an analysis and explained why. I thought this was an interesting study except I too was thinking recovery from LIA was a possibility. Now, it is just another example of a study reeking of motivated reasoning.
Amazing how they focus on all the negative and often nebulous negatives instead of the positives
Where is the extreme weather-
“Wrap Up of U.S. Agriculture for 2015
Normal weather conditions prevailed in most major growing regions around the world in 2015.
As a result 2015 saw continued building of global grain and oilseed stocks that began with the
large harvests of 2013”
“Decreasing ice cover erodes the ‘sense of place’ that winter provides to many cultures, with potential loss of winter activities such as ice fishing, skiing, and transportation.”
Which is why Inuit from all southern latitudes flood Fairbanks in February, so they can get that ‘sense of place’.
That statement is possibly the most gobsmackingly stupid utterance from a so-called ‘scientist’ in human history.
I was going to use exactly the same quote to make the same point. Looks like we need another 9/11 as it creates a wonderful sense of place… Or another Siberian Gulag, because who would know where Siberia was unless it had Gulags.
this extreme weather is crippling-
“A major catalyst behind the strong farm income of recent years has been the strength of U.S.
agricultural exports, which have shown remarkable growth since 2000—nearly tripling in
absolute value and accounting for over 30% of gross cash farm income”
Well there does not seem to be a great deal of melting taking place in the Hudson Bay soar this year. 🙂
Sorry “so far this year”
For what it is worth, one of the senior advisors to Canadian farmer training (extension) workers told me, in answer to the question, “Is the growing season in Canada getting longer?” with the reply, “About 3 days per decade since 1960.”
That matches vaguely the record shown above. I am not concerned by it. 1960 was cold, colder than it had been 20 years before. so it took time to get back the temperatures in the late thirties. If we are there by now, it is not much more, but hard to see because of the fiddling of the records to make it appear cooler in the late 30’s. Obviously the growing season is not 6 days longer since 1996 because the temperature has not, on average, changed.
It should be possible to find ice melt records for lakes in the US and Canada going back 400 years. Cape Town has 400 years of rainfall data. Let’s keep our eyes open.
“It should be possible to find ice melt records for lakes in the US and Canada going back 400 years.”
That I strongly doubt. From 1616? Four years before the Mayflower? I understand that even the Torneå record is quite unusual, and probably owes its existance to the fact that ice breakups on Torne älv tend to be violent, and sometimes quite destructive.
I followed the article link to supplemental information believing that contrary to previous alarmist articles, this one might even have data so that replication might be easily attempted. What I found was a Word doc with more graphs.
Did anyone find any data or is this one more of the alarmist articles where we are supposed to trust their mathematical manipulations which turn no trend into a warming trend with a correlation to CO2?
The problem with mathematics is that every input into the calculation has to be absolutely correct in order to have an absolutely correct outcome. Someone had an article on here recently that tried to point this out, yet the heaps of scorn were directed at the author. People really need to think critically here. Now, more than ever.
Well it is certainly true that the output is uniquely determined by the input.
The output is always correct for the set of input numbers entered.
G
The Lake Suwa data are here:
https://www.jstage.jst.go.jp/article/jgeography1889/63/4/63_4_193/_pdf
They were actually originally published in 1954. The Tornio data are linked in my post below. This is just plagiarizing old research with a CAGW slant, a very common form of “science” today. It being much less trouble than doing actual research.
More me-too science. So somebody in Climate Science™ has apparently stumbled upon Kajander’s 1993 paper:
Kajander J. 1993. Methodological aspects on river cryophenology exemplified by a tricentennial
break-up time series from Tornio. Geophysica nr 29 (1-2), 73-95.
Anyone interested in actual data, can find them on page 7 of this report:
http://www.smhi.se/polopoly_fs/1.24419!Hydrologi_118.pdf
It’s pretty interesting really. It shows the brief quite warm period around 1750 known from a number of Scandinavian records, a quite cold interval in the early 1800’s, a slow steady warming from c. 1880, a marked cooling c. 1950-75 and then warming again.
Sounds familiar?
Anything goes to get a grant, including sacrificing science.
Do you think any of ’em feel it? Remorse, I mean. Is there any one of them who feels a twinge of conscience when they lay this sort of stuff out on the table for the world to see? Is there any honor left at all? Any sense of shame? Isn’t there even the tiniest voice whispering in their ear that something is not right?
I wouldn’t be able to look myself in the mirror, much less step outside. It surprised me these people can act as though they have no inkling at all. There is no care for honesty. They are not even trying for it.
Typo – “surprised” should be “surprises”.
“Our findings not only bolster what scientists have been saying for decades, but they also bring to the forefront the implications of reduced ice cover,” says Sharma.
Which scientists, and what, exactly have they been saying? They’ve been all over the map, and wrong about everything so, the only thing they’ve shown is that there has been a warmup since the LIA. No shirt Shirlock.
Oh, and hilarious how they desperately try to find something “bad” about the reduced ice cover.
Yes, the earth (high latitude regions both poles) has warmed after the little ice age. The earth warms and cools cyclically correlating to solar cycle changes.
The recent warming cyclic is high latitude warming which same pattern of warming that occurred in the past cyclically correlating to solar cycle changes.
http://www.climate4you.com/images/GISP2%20TemperatureSince10700%20BP%20with%20CO2%20from%20EPICA%20DomeC.gif
If CO2 was the cause of the warming the entire earth would have warmed as CO2 is more or less evenly distributed in the atmosphere. As the amount of warming is proportion to the increase in atmospheric CO2 and the amount of long wave radiation that is reflected off into space the most amount of warming should have, if CO2 was the cause of the warming occurred in the equatorial regions, as that the region where the most amount of long wave radiation is emitted to space.
http://www.drroyspencer.com/wp-content/uploads/TMI-SST-MEI-adj-vs-CMIP5-20N-20S-thru-2015.png
http://www.eoearth.org/files/115701_115800/115741/620px-Radiation_balance.jpg
The latitudinal temperature anomaly paradox is the fact that latitudinal pattern of warming in the last 150 years does match the pattern of warming that would occur if the increase in temperature was caused by the CO2 mechanism.
As noted above in this paper, there is a latitude warming paradox which supports that assertion that the majority of the warming in the last 150 years not caused by the increase in atmospheric CO2.
http://arxiv.org/ftp/arxiv/papers/0809/0809.0581.pdf
http://icecap.us/images/uploads/DOUGLASPAPER.pdf
” if CO2 was the cause of the warming occurred in the equatorial regions, as that the region where the most amount of long wave radiation is emitted to space.”
No.
Equatorial regions are dominated by water.
Which as we know is both a much more powerful GHG but also performs cooling on the surface.
Both of which easily dominate/mask the anthro CO2 warming.
Should say after the great famine: https://en.wikipedia.org/wiki/Great_Famine_of_1695%E2%80%931697
It killed third of the population of Finalnd
This business of talking about warming since the beginning of the industrial revolution, i.e. 1750 seems to be getting more common from the warmers. Presumably they see warming starting as the LIA ends and they want to make that warming all anthropogenic. But they can’t possibly tie warming to human CO2 emissions until at least the middle of the 20th century. It’s a low-key message being intentionally, insidiously insinuated into public consciousness to eliminate any ideas that post-LIA warming has any natural component to it.
I tried looking for a table or chart of historical world coal production. Couldn’t find one, but settled for this little chart of UK coal production from 1800 on:
http://www.makingthemodernworld.org.uk/learning_modules/history/04.TU.04/illustrations/04.IL.39_02.gif
Carefully scaling off, I get annual production of 10 million tons in 1800, after which it ramps up progressively faster and peaks at about 270 million tons during World War I (these would be long tons: 1 long ton = 1.015 tonnes). The 20th century decline is presumably matched by increasing oil imports and decreasing coal exports which accounted for up to 25 percent of UK coal production in the “heyday” of the empire. It seems fair to estimate that world coal production had a similar pattern, but lagging somewhat behind the UK. US coal production was minimal before 1850, but did ramp up very fast after that.
OK here’s a world coal (and oil) production chart starting in 1850.
http://capita.wustl.edu/capita/capitareports/GlobSEmissions/GlobS1850_1990_files/image002.jpg
Scaling off again, it looks like world coal production was about 100 million tonnes in 1850, and going back to the UK chart – good grief the UK accounted for almost half that total!
The point of all this being that coal was the only fossil fuel of significance before the late 1800s. Using the world chart, annual coal production in 1890 was about 500 million tonnes, and in 1990, annual hard coal + soft coal + oil production was 7,700 million tonnes. Ignoring the difference in carbon/hydrogen ratio for now, that’s an increase of over 15 times.
So if they want CO2 from fossil fuels to be the sole driver of the modest warming in the late 20th century, there’s no possibility that it could account for any detectable warming before about 1900. And to be realistic, nothing of significance before about 1960, when world annual fossil fuel production was about half of the 1990 number.
So all this “warming since the start of the industrial revolution” stuff is nonsense. No matter what you believe about the 1979 to 1998 warming period, there’s no way that any warming before mid-20th century can be anything but natural. Any suggestion to the contrary would be propaganda.
This interesting info when checking ice. From Wikipedia.
‘Lake Suwa is the site of an interesting natural phenomenon, The God’s Crossing (御神渡り o-miwatari?). The lake has a natural hot spring under its surface. When the lake’s surface freezes in the winter, its lower waters are still circulating. This results in ice pressure ridges forming in the surface ice, reaching heights of 30 centimetres (0.98 ft) or more.’
So can it be that the hot spring Is changing?
Nenana Ice classic continues to show an earlier break-up of ice on the Tanana river.- A noisy signal that is to be expected.
http://s25.postimg.org/vsme6rmi7/neenan_equinox.jpg
I thought it had gone rather quiet on this river since the excitement of 3 years ago, and now I see that the last 3 break-ups have been close to the earliest on record.
By the way, the slope of the trend-line since 1965 is about -7 days in 50 years, so it should be about minus 0.14, surely?
The slope is in an unfortunate scale days per day!
The label is badly formatted also!
The equation is:
y = -3.6773E-04x + 5.4920E+01
Which works out as -6.7days/50 years as you suggest
Didn’t we already know that the trend has been toward warming since the LIA? So what? Does that prove AGW?
Am I wrong or did they just publish in the time period where we know that it went from cold to a little warmer the new rare data showed it really went from damn cold to still kinda cold since it was all icey indeed?????