A few years ago in 2009, I was the first to notice and write about a failure of the instrumentation for one of the satellites used by the National Snow and Ice Data Center (NSIDC) to show Arctic Sea Ice extent. I was told initially by NSIDC scientist Walt Meier that such an observation “wasn’t worth blogging about”. Later, after chastising me, they had to pull the plug on the data. Today, we have what appears to be a similar problem with satellite sea ice measurement. Note the big uptick similar to (but opposite in sign) what happened before in 2009:

There is this small notice on the NSIDC page:
The daily sea ice extent images are currently displaying erroneous data. NSIDC is investigating.
It looks to be a problem with the DMSP F17 satellite.
Makes you wonder how long this has been going on and if the anomalously low readings we’ve seen for awhile are due to a slow sensor degradation.
Time will tell.
Added:
DMI looks even worse:

Added:
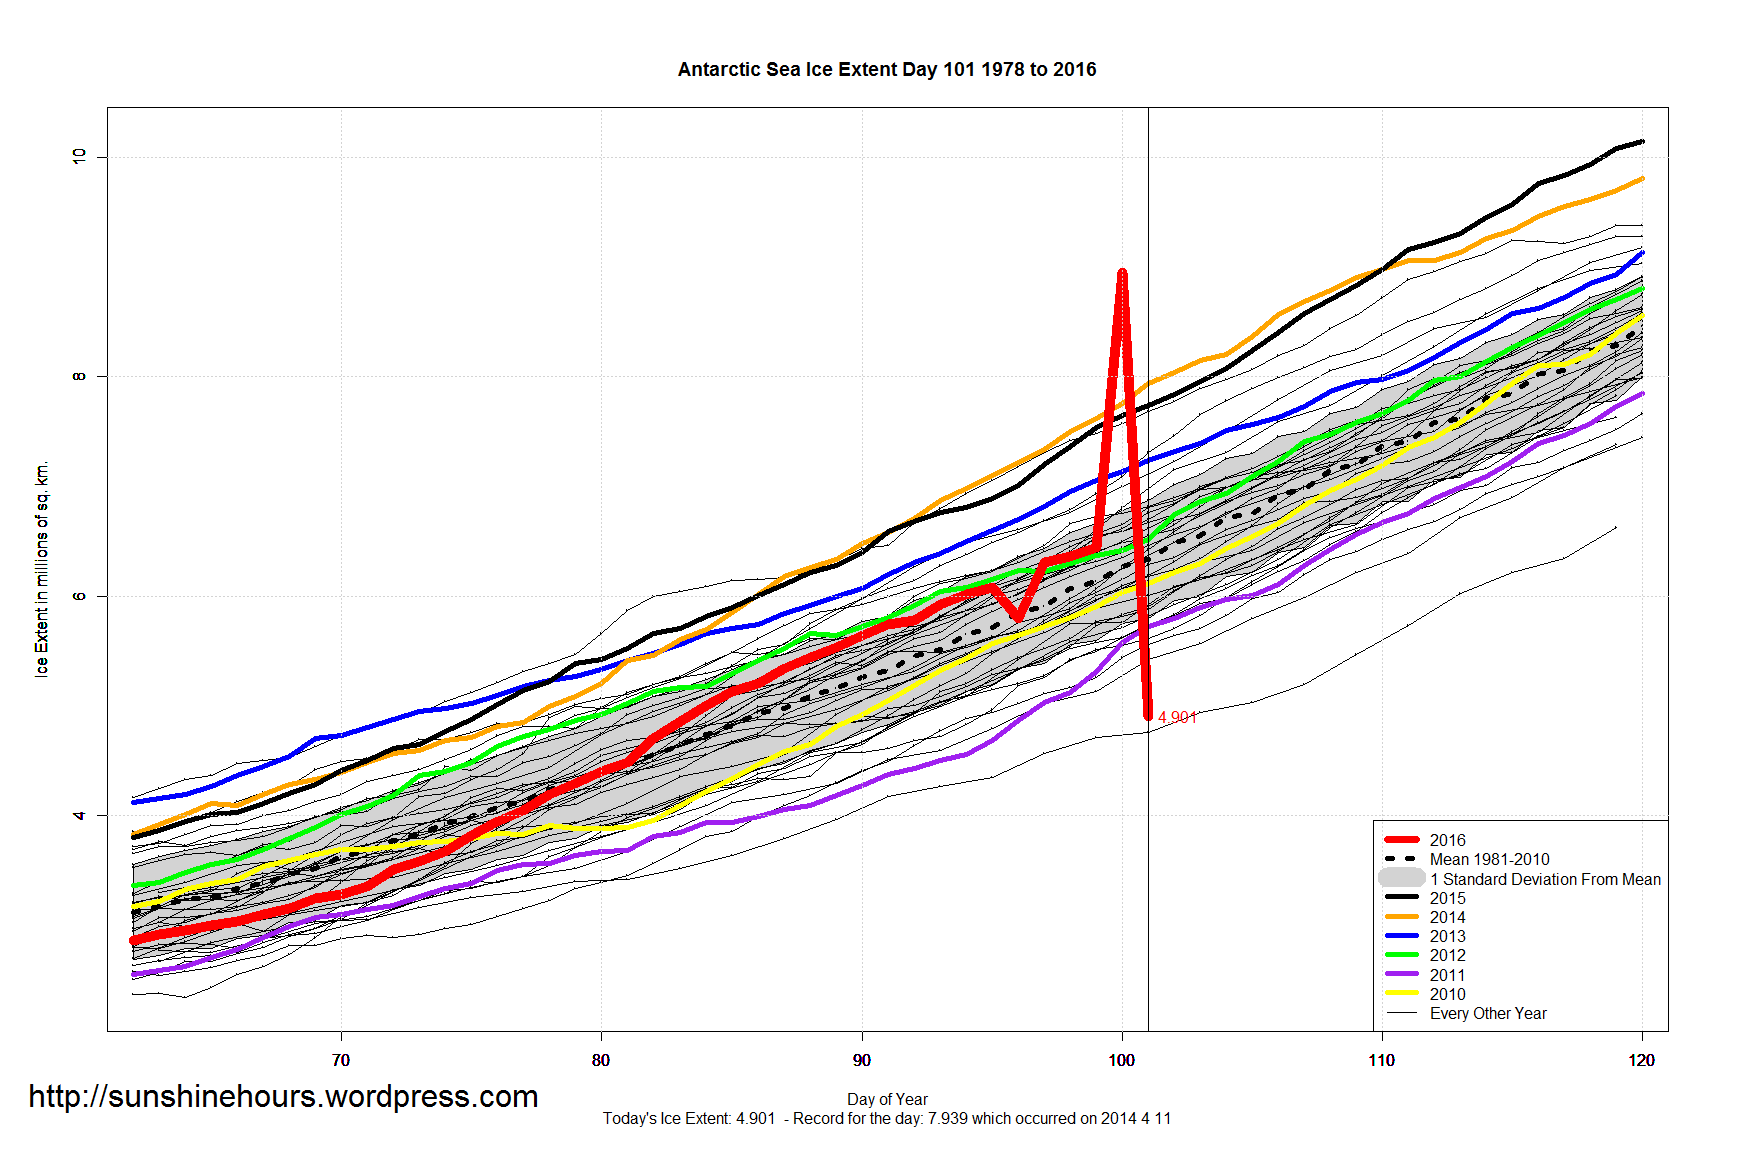
The NSIDC graph for Antarctica has a similar glitch, in the opposite direction.

On the Sea Ice page a lot of the data seems to be stuck on 7th. April.
In the past when there was a downward spike, you often got an “unprecedented” press release. Not so much when there is an upward spike. Of course, the best way to handle it is to not have a press release as it is either an instrument glitch or sometimes wind that is spreading out or compacting the ice.
It was noticed days ago by the crew at Neven’s Arctic Sea Ice Blog
Doesn’t seem to be any post about it here:
http://neven1.typepad.com/
Maybe there’s a comment buried somewhere, but no main story.
It was first mentioned there on April 6th
http://forum.arctic-sea-ice.net/index.php/topic,1457.msg73254.html#msg73254
Look closer!
Both the blog and forum have been talking about the problem, it’s cause and both short as well as long term solutions.
That’s because it’s not worth blogging about, Anthony. 😉
Maybe later when the exact cause is known and it can’t be fixed.
Hmmm, well from your own forum, it seems there’s a bigger problem than you wish to let on:
======================
jdallen
ASIF Upper Class
Posts: 1701
View Profile
Re: 2016 sea ice area and extent data
« Reply #136 on: April 08, 2016, 09:16:56 PM »
BOTHER. Failing instruments with no clear replacement to provide data.
The results the instrument is providing are obviously flawed. Just looking at Worldview suggests that to me.
Never a good time for this, but absolutely one of the worst times it could happen.
=================
Of course I’m sure you’ll tell the world when your ego decides it is a good time to blog about this problem.
A machine that does not work correctly is far worse that not having any machine at all.
At least no machine does no damage to anything, but a malfunctioning machine can burn the house down.
G
Anthony take a look at the Antarctic its taking a nose dive at the exact same time.
at NSIDC
@Nev**
I loved your WAR thread, any chance of a sequel?
Ask him on his own forum please, we aren’t a message service.
Why do those words trigger filters here and what is with the draconian censorship of people that are posting actual science while at the same time taking a blind eye to obvious trollish behavior?
[Reply: Many of the trigger words and phrases are employed by WordPress. Neither Anthony nor anyone moderating here knows all the WordPress trigger words, although it’s not hard to figure out some of them. Regarding your accusation of ‘draconian censorship’, please post examples. Thanks. -mod]
Saul, one word of advice: Either play nice, or spend your time more wisely. This is useless.
Bob Boder April 11, 2016 at 11:27 am
“Anthony take a look at the Antarctic its taking a nose dive at the exact same time.
at NSIDC”
Yes, but that’s just what models have predicted ” as the world gets warmer”. So that data must be correct, It’s just the NH data that needs “correcting”.
I find it funny that Neven thinks this topic about a truck crashing through the ice is “worth blogging about” but a sensor problem that affects the major Arctic ice datasets is not. LOL!
http://neven1.typepad.com/blog/2016/03/giant-metaphor-crashes-through-the-ice.html
Nw
Nevin’s site is worth the occasional visit, because you do get stuff you don’t see at other sites. I have to be thick-skinned as I lurk, because of disparaging comments towards Skeptics, but visiting does help me know where ice is thinner than normal, and where the melting of the sea-ice is ahead of last year’s melt..
 ?w=784&h=455
Also I am always interested in how people are doing up in the Frozen North. This picture of the truck that broke through the Great Slave Lake ice intrigues me. Did the truck get rescued? Did the people in the small town get their heating oil? Some follow-up is needed.
It is during the process of follow-up that I often discover nuggets of Truth that a highly prejudiced site, due to its bias, misses. You’d be surprised how often a prejudiced site prints some news it has cherry-picked, thinking it proves a particular point, which further investigation reveals proves the opposite.
It is the obscure sites that give us an idea of what is actually going on. Last July a community on the coast of Hudson Bay needed heating oil, but the tanker couldn’t get through the ice until an icebreaker showed up.
This bit of trivia was quite valuable to me, because it made me aware certain maps portrayed the water the icebreaker moved through as being “above normal.” This made me ponder whether some ice-water could be warmer than other ice-water.
https://sunriseswansong.wordpress.com/2015/08/13/the-hudson-bay-sea-ice-embarrassment/
Considering the mainstream media is doing such a terrible job of fact-checking, I think we should be thankful for the bloggers who do dredge and dig like old-school reporters, and come up with items we’d see nowhere else. It may be hard to take the “spin” they put on the Truth, but Truth remains Truth, and the more we can get the better off we are. While Nevin’s site may be extremely small potatoes compared to WUWT, it does serve its purpose, and, to be blunt, it contains more Truth about sea-ice in a single day than the New York Times has reported in the last decade.
Most times it is speeding that causes the trucks to crash through the ice. It can be the truck in front of you sped and weakened the ice, leaving you as the hapless victim. Other times it’s just too much weight for the ice thickness in that particular spot.
Isn’t it disingenuous to be questioning what other blogs are or are not posting and doesn’t that leave you wide open to criticism for things you have chosen to ignore. The day this was posted hail the size of baseballs did tens of millions of dollars damage in Texas, the ongoing heat wave in India killed hundreds, the droughts continued to plague south Asia and the weeks old “blowtorch” in the Arctic was especially harsh in Greenland. Nary a mention here of those significant events was made here and you have a right to ignore them since this is your blog. What I question is draconian censorship of polite bloggers who document their assertions but are banned.
Take this old man`s advice and give up this silly blog war, just as you are entitled to your personal version of reality here at WUWT, the targets of your ire are entitled to their views on their personal blogs.
Peace
Links please.
http://www.bbc.com/news/world-asia-35397763
“As an unprecedented heatwave swept across Odisha today, the Naveen Patnaik government ordered closure of all the schools till April 20. The State government’s decision came after mercury soared to 45.8 degree Celsius in Bhubaneswar, its all-time high temperature for the month of April. The heatwave which is sweeping the State since last week, would continue to singe till April 20,” said local Meteorological office. The rising heat has led to increasing number deaths due to sunstroke.”
http://indianexpress.com/article/india/india-news-india/odisha-schools-heatwave-summer-weather-temperature/
Anthony
I tried to throw you a lifeline on the April Fools thread but it was ignored, so it’s deja vu all over again August 2012
. This card carrying skeptic is confused why you chose to ignore the “blowtorch” in the Arctic that has been raging for over two weeks.
Saul from Montreal April 13, 2016 at 7:42 pm
I have never, ever seen this happen on this blog. People have indeed been censored, but for the usual reasons—sock puppetry, continued harassment, or the like.
Finally, EVERY day there is some unusual weather going on somewhere. Perhaps you think that is important. Around here, we see it every day, so no, I’m sorry, but a heat wave in India? Since when is that news?
w.
[Saul, please document what you allege. -mod.]
[Saul, please document what you allege. -mod.]
Catch 22
If past events are typical, my documentation may result in censorship or banishment.
I believe it may be prudent to go back to lurking here and discuss the momentous events in the Arctic elsewhere.
[Reply: this site does not censor any scientific points of view. If you have facts, evidence, science links, or similar science-related information, please feel free to post them. You will never be censored here for posting facts, even if they later turn out to be erroneous. –mod.]
What a surprise! To us? Maybe, not so much to “them” I’ll bet. Time to get out the computer model and make some “adjustments” – – – Hmm, what direction should we go?
One should panic over an artifact of measurement–I remember the old Saturday Night Live routine of Emily Litella “Never Mind”.:-)
Another comment flushed down the drain by silly filter
[Reply: We regularly advise readers to save a copy of their comment until they see it published. -mod]
I now know trigger words that get comments completely vanished without a trace but cannot understand motive.
Jealousy?
Jealously? Hardly, we get more traffic in an hour here than Neven sometimes gets in a month. Your “disappeared without a trace”comment appears above along with my reply.
That is a rather immature argument, what does traffic have to do with anything?
If your moderating a post traffic has everything to do with it. Even a child knows that.
@Saul: Traffic vastly impacts how quickly mods can rescue comments from the auto-filter, as well as how aggressive the auto-filter needs to be to keep mods from being overwhelmed. Trigger words affect the algorithm of the auto-filter; so one just has to deal with the fact the machines are touchy.
..Saul sounds like a 12 year old !
Heavy traffic can delay things even without moderation. Look at the comments on reason.com which has zero moderation. Things get delayed in the queue.
And Saul’s argument is rapidly growing whiskers.
I dunno, how the mods or Anthony, keep up with the pace of this place.
G
PS Thanx Chasmod for being there. et al !
Saul seems to want a ‘safe space’ here.
Traffic could have also been a factor in the truck falling through the ice. You shouldn’t discount it so flippantly. It can have an effect on vehicles, websites and blog moderation.
When metaphors are falling through ice, they’re usually unstoppable.
That is science?
Mean what you say and say what you mean.
There is a problem with the data. Taxpayers pay for it and the bureaucrats appear not to notice. Taxpayers want less cost or better work. You don’t pay $100,000 for a Yugo and feel satisfied.
Try sticking to data or “adjust” your models to accurately hindcast using the actual data.
Hypotheses are adjusted, not observations. NOW do you get why American Taxpayers don’t believe in your hoax?
The question is: At what price would you be satisfied, assuming other choices?
Move the NSIDC to UAH. They do better work.
Not sure why that’s relevant, the failure of a 10 year old satellite sensor doesn’t have anything to do with NSIDC.
It does when they mention it on their page.
http://nsidc.org/arcticseaicenews/2016/04/a-problem-with-the-f17-dmsp-satellite/
The folks here dont even know who controls F17
[Jeeez, Steven, could you possibly become more condescending? DMSP is the Defense Meteorological Satellite Program, which I’ve referenced before here. The program was originally run by the Air Force out of the Offut AFB met center, but now is controlled by NOAA -Anthony]
You will never sell any of your lemons with that attitude, Mosh
Funnily enough I noted a smaller uptick yesterday (or day before) and did wonder why it was there.
It’s not a failure. Ice age just begun.
..As a Canadian, we are not amused !! LOL
Only a couple of years ago the Canadian press ran articles about the demise of local hockey because outdoor skating could not count of good hard ice, or some such thing.
Threatened
So, Marcus, I think you should be thrilled.
Same satellite is being used by CT & OSI and similar effects noted. JAXA uses a different satellite which doesn’t have these problems and was showing agreement with the others prior to the weekend.
The following message is posted on the NSIDC site:
Notice: There are intermittent issues with the incoming DMSP-F17 SSMIS satellite data used to process the Sea Ice Index. We are investigating the problem with our data providers. For questions, contact NSIDC User Services
The false ice can be seen on this image, particularly in the Bering sea.
OSI has already started switching to an alternate sensor.
o Message :
Due to the previously reported problems with one of the channels on SSMIS
onboard DMSP F17, OSI SAF is now working on replacing DMSP F17 with DMSP
F18 in our sea ice products.
Currently, the switch to F18 has been implemented for the ice concentration
product (OSI-401). The product dated 20160410 has been reprocessed and is
available on our FTP server, ftp://osisaf.met.no/prod/ice/conc/ and
ftp://osisaf.met.no/archive/ice/conc/2016/04
The ice edge and type products (OSI-402 and OSI-403) will be updated to use
F18 tomorrow, 2016-04-12.
The ice emissivity product (OSI-404) has been temporary turned off.
Production will be upgraded to F18, with expected implementation 19th
April.
The LR ice drift product (OSI-405) does not use the channel with
calibration problems, but is affected to some extent since it uses the ice
edge product to define areas with ice. This product will be back to nominal
as soon as the ice edge product is updated.
o Comments or Extra information :
We are sorry for the inconvenience these problems might have caused. We
will report on the quality of the products with the new sensor as soon as
more data are available.
More information on http://www.osi-saf.org
Interestingly, the Antarctic Sea Ice extent shows a big downtick.
http://nsidc.org/data/seaice_index/images/daily_images/S_stddev_timeseries.png
wrong graph, but you are correct about the down turn in the Antarctic.
The Antarctic graph segment for the last number of days was, as of yesterday, pointing upward – I checked today and the direction of the segment was, essentially, mirrored vertically. Apparently there is an issue with readings for both poles … (?)
SunshineHours graphs are fun !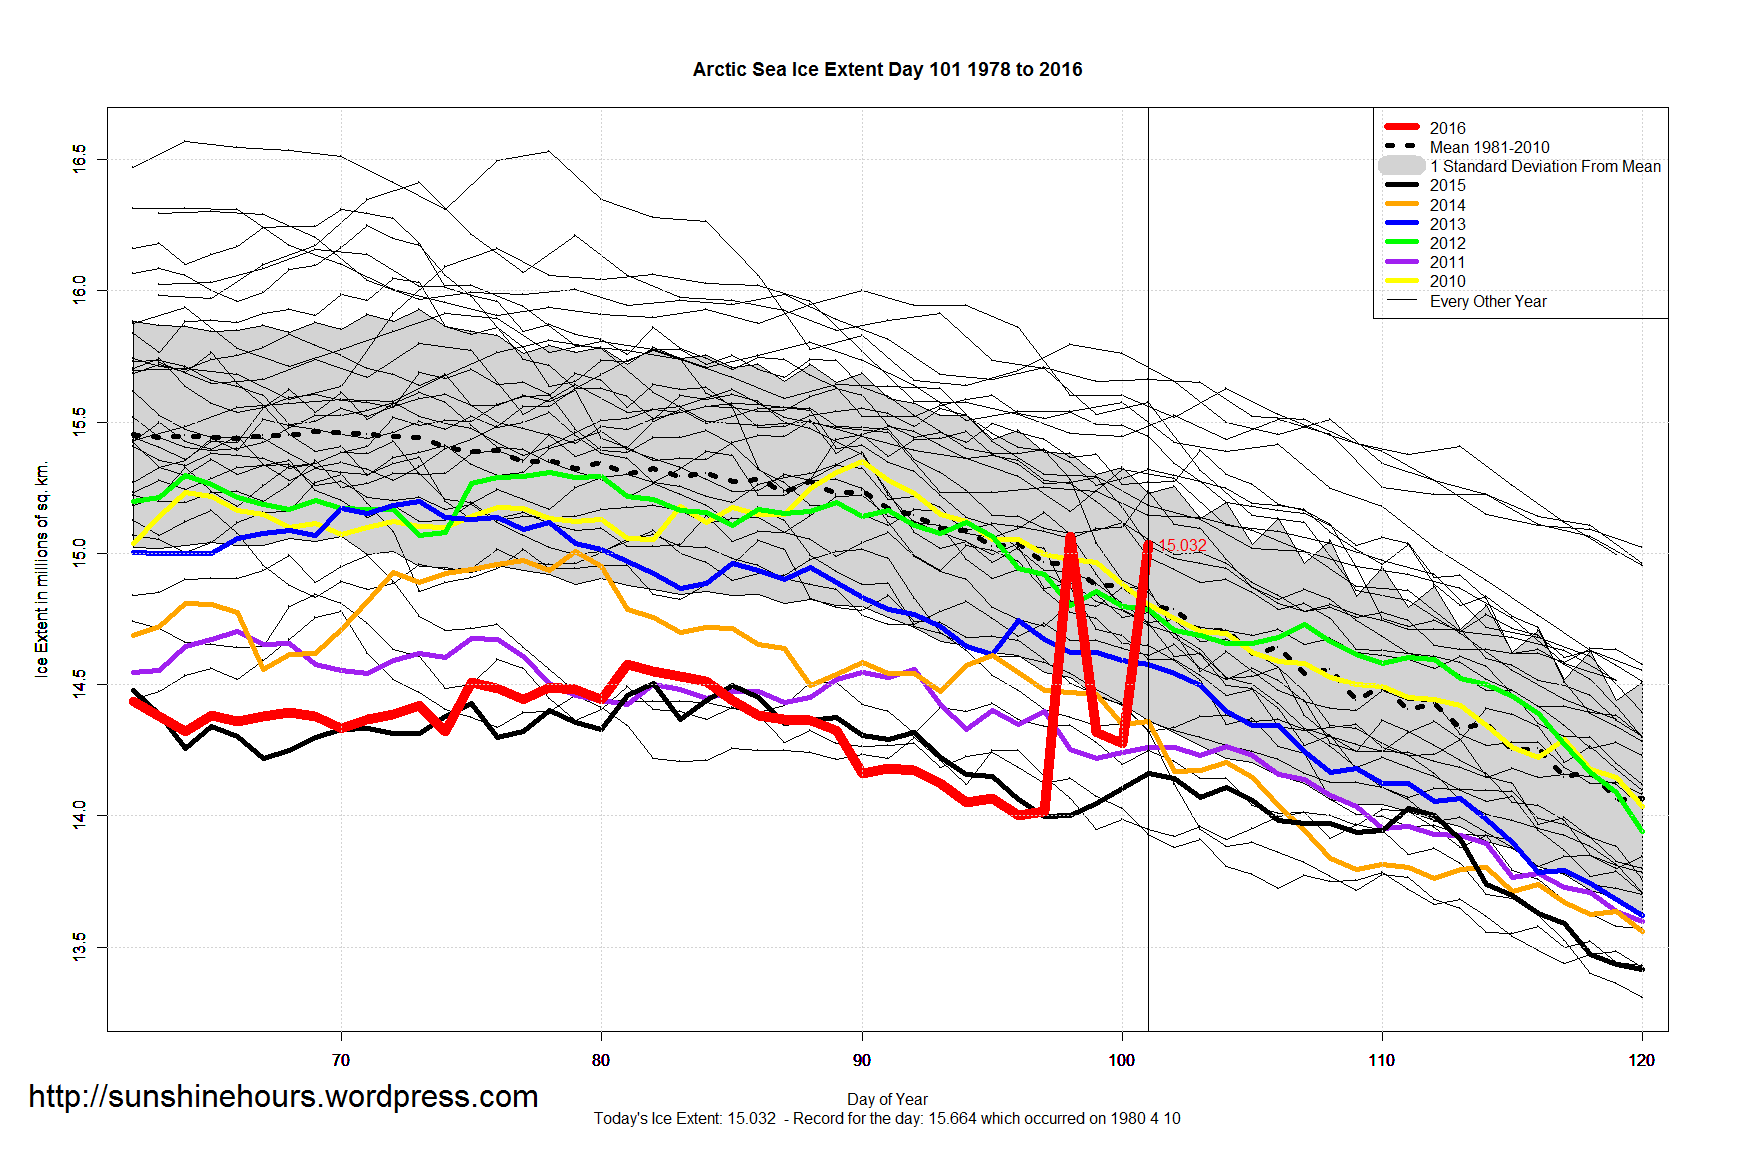
Houston…. we have a …… oh never mind.
I noticed this problem when it first occurred April 7, and now it happens again today in report April 10 ice extents. Here are the NH stats for the last six days from SII (Sea Ice Index) in M km2:
2016 4 5 14.001
2016 4 6 14.016
2016 4 7 15.065
2016 4 8 14.318
2016 4 9 14.274
2016 4 10 15.032
Spikes of 1M km2 at this time of year? I don’t think so. And of course, MASIE shows no such thing. However, SII did successfully align with MASIE on April 8.
Anthony, I commented on the Bob Tisdale article (seaside dwellers in US in peril) just before this one that the free-falling ENSO graph was not updated today for the first time in the many years I have been following it. You don’t suspect an adustment in the works to kill the rapidly coming La Nina, do you? WUWT.
http://www.bom.gov.au/climate/enso/monitoring/nino3_4.png
I think you need to refresh your browser cache.
http://www.bom.gov.au/climate/enso/monitoring/nino3_4.png
Slipstick: It’s weird. you copy the graph as shown on the site, but it pastes differently! Go figure!
http://www.bom.gov.au/climate/enso/indices.shtml?bookmark=nino3.4
What Phil said, plus JAXA provide a glitch free Arctic sea ice extent metric if anyone’s interested:
https://ads.nipr.ac.jp/vishop/vishop-extent.html?N
Method for calculating sea-ice extent
The sea-ice extent is calculated as the areal sum of sea ice covering the ocean where sea-ice concentration (SIC) exceeds a threshold (15% for AMSR-E). SICs are derived from various satellite-borne passive microwave radiometer (PMR) sensors using the algorithm developed and provided by Dr. Comiso of NASA GSFC through a cooperative relationship between NASA and JAXA. The following sensor’s data were used;
• Jan. 1980 ~ Jul. 1987 : SMMR
• Jul. 1987 ~ Jun. 2002 : SSM/I
• Jun. 2002 ~ Oct. 2011 : AMSR-E
• Oct. 2011 ~ Jul. 2012 : WindSat
• Jul. 2012 ~ the present : AMSR2
The black dot seen at the North Pole is an area lacking data where PMR sensors cannot observe the Earth’s surface due to the limit of its observational coverage (i.e., orbit inclination of 98deg. and swath width of 1600km for AMSR-E). Please note that this area is also counted as sea-ice cover in our estimation of sea-ice extent.
In principle, SIC data could have errors of 10% at most, particularly for the area of thin sea ice seen around the edge of sea-ice cover and melted sea ice seen in summer. Also, SIC along coastal lines could also have errors due to sub-pixel contamination of land cover in an instantaneous field of view of PMR data.
Averaging period and the update timing of daily data : In general, sea-ice extent is defined as a temporal average of several days (e.g., five days) in order to eliminate calculation errors due to a lack of data (e.g., for traditional microwave sensors such as SMMR and SSM/I). However, we adopt the average of latest two days (day:N & day:N-1) to achieve rapid data release. Only for the processing of WindSat data (Oct. 4, 2011 to the present) the data of the day before yesterday (day:N-2) is also sometimes used to fill data gaps.
Definition of sea-ice cover (extent and area) : The area of sea-ice cover is often defined in two ways, i.e., sea-ice “extent” and sea-ice “area.” These multiple definitions of sea-ice cover may sometimes confuse data users. The former is defined as the areal sum of sea ice covering the ocean (sea ice + open ocean), whereas the latter “area” definition counts only sea ice covering a fraction of the ocean (sea ice only). Thus, the sea-ice extent is always larger than the sea-ice area. Because of the possible errors in SIC mentioned above, satellite-derived sea-ice concentration can be underestimated, particularly in summer. In such a case, the sea-ice area is more susceptible to errors than the sea-ice extent. Thus, we adopt the definition of sea-ice extent to monitor the variation of the Arctic sea ice on this site.
Method for calculating sea ice thickness and melt ice concentration ratio products
The product of sea ice thickness and the melt pond concentration which is shown in the VISHOP is calculated from AMSR-E and AMSR2 data by using a research algorithm1) developed by K. Tateyama (Kitami Institute of Technology) and others in the Arctic research projects utilizing the IARC-JAXA Information System (IJIS) and satellite imagery (1st – 4th generations). This product is an essentially experimental and research product. This product has the effectiveness in the relative dry freezing seasons such as autumn, winter and spring (September – May), but cannot provide the accurate sea ice thickness in melting wet season (June – August) because the sea ice surface is covered by melt ponds.
This product is opened to the public for the usages of research and validation of algorithms. The Arctic Data archive System (ADS) is not liable for any loss or damage resulting from the use of this data.
Reference
1) Krishfield, R. A., A. Proshutinsky, K.Tateyama, W. J. Williams, E. C. Carmack, F. A. McLaughlin, and M.-L. Timmermans (2014), Deterioration of perennial sea ice in the Beaufort Gyre from 2003to 2012 and its impact on he oceanic freshwater cycle, J. Geophys. Res.Oceans, 119, doi:10.1002/2013JC008999.
Measurements? When did THEY become important?
I want model output, dammit. What does the forecasting say?
Surely you mean what do the entrails say. Chicken Bones? White Bull’s liver? ect
…Ummm, it’s not the White Bulls liver that they use, if you know what I mean !! LOL
“ect”
Chicken bone caught in your throat? 😉
It seems to me the satellite would have a a test and calibration template for the sensors.
> It seems to me the satellite would have a a test and calibration template for the sensors.
Probably does. But satellites are complex devices and things can go wrong in an impressive number of ways — not all of which can/will be detected by built in quality checks. All in all, it amazes me that they work as well as they do.
Another reminder to keep in mind Korzybski’s admonishment…”The map is not the territory”
Glad to see Korzybski cited. I thought he was completely forgotten.
See also the NANSEN data, with a downward spike in ice. But at the ArcticROOS home page there is a clear image showing a swath of “ice” from Bering sea to Japan, http://arctic-roos.org/ . Sure looks like an instrument had a single scan event creating a bad image for a brief time. Also there is a similar patch southeast of Greenland.
Except Walt never claimed it wasnt worth blogging about!!
here is what he wrote
“We’re looking into it. For the moment, we’ve removed the data from the timeseries plot.
You need to remember that this is near real-time data and there can be data dropouts and bad data due to satellite issues. While the processing is automatic, the QC is partly manual. Thus errors do happen from time to time and one shouldn’t draw any dramatic conclusions from recent data.
I’m not sure why you think things like this are worth blogging about. Data is not perfect, especially near real-time data. That’s not news.”
he says, he doesnt know why YOU think it’s worth blogging about.
he doesnt say “Its not
Near real time data wont be perfect. Even after QC it wont be perfect.
Perhaps you want to cast doubt on satellite products. Talk to Roy Spencer.
You basically manufactured a quote.
You also said..
“I have no quarrel with Dr. Meier, as I’ve said he’s been the utmost professional in my dealings with him. But I do have quarrel with an organization that allows such claims to be broadcast, all the while producing a data source that is now regularly scrutinized by the public and the media for the slighest changes. It’s a slippery slope.”
glass houses and all that.
[Well I never said “data was perfect”. Notifying people that data is imperfect is a good thing, don’t you think? It seems though by your and Neven’s viewpoints, even notifying people that there’s a problem with data isn’t worth blogging about. When you run this blog, then you can choose what goes up – Anthony]
“I’m not sure why you think things like this are worth blogging about.”
This implies he thinks it’s not worth blogging about.
Andrew
Sorry Bad Andrew; but that quote is a direct statement that Walt doesn’t think satellite issues are worth blogging about. So much so, that he doesn’t understand why Anthony or anyone would blog about it.
Maybe it is not an actual quote, but it is a clearly stated belief.
ATheoK,
I agree that it’s an expression of the belief that it’s “not worth blogging about”.
Clearly stated, though… could be clearer. Expressed, yes indeed.
Andrew
Steven Mosher April 11, 2016 at 12:33 pm
Thanks, Mosh, really you are really over-reaching here. When a man says
“I’m not sure why you think X is important”
it is a crystal-clear indication that the speaker does NOT think X is important, and he is wondering why you don’t agree.
So yes, Mosh, Walt absolutely claimed it wasn’t worth blogging about!! (I put in the two exclamation marks in your honor).
Best regards,
w.
I’m not sure why Mosh thinks it’s worth coming here to comment on.
I’m amused by some comments that imply that, because of this artifact, the previous measurements by the instrument are somehow in doubt. If a column of the CCD in your digital camera were to fail, leaving a line in the images, would you throw away the pictures taken prior to the failure?
not a good example….LOL
Ah but that’s because we have these two eyeballs to calibrate with. We know what a good picture should look like.
Slipstick April 11, 2016 at 12:37 pm
No … but if I just noticed that for some reason my thermometer is now reading too high, I’d definitely check the historical readings to find out how long it has been going on.
We have no way to know if this has been a gradual decrease followed by a failure, so yes, it’s certainly possible that the previous data is bad. Doesn’t mean it is, but we’d be fools not to check.
w.
Willis – “We have no way to know”
Why not compare the NSIDC’s SSMIS data from F-17 with JAXA’s AMSR2 data from Shizuku? Wouldn’t that do the trick?
Jim from JAXA April 11, 2016 at 1:45 pm
Apologies, Jim, my meaning was clearly not clear … I said:
I meant that just from the bad reading alone, we don’t know if the previous data is bad. Yes, we can check it in the way you suggest and other ways … which is why I said we’d be fools not to check.
w.
Slip, if your instrument fails suddenly, you DON’T assume that it was working just fine before it failed. Quite often, failure is a gradual process, so doing so would be foolhardy at best. Any junior engineer knows that. You get independent confirmation before going forward with a solution. Otherwise, your fix might be putting a bandaid on a bigger problem.
Now, we do have other satellite measurements that support the prior data to within reasonable error, so those concerns did not pan out, but they were founded on very good logic.
There you go! I had a flat tire the other day and assumed the tire was fine and put air in it. Now I’m by the side of the road with a flat tire. What the heck?
“John Harmsworth April 12, 2016 at 2:50 pm”
Electronics do fail gradually and/or suddenly no matter how much insulation and shielding is used. It’s a fact of life.
With regards to tyres, you can fit “run flat” tyres. You still need to fix or replace them, but at least you don’t need any wind in them to get home.
…..Somebody was trying to ” adjust ” the data, but, being a liberal, they ” adjusted
” it he wrong way !! ……….Thanks for that !!
..THE…arrrrggggg….
Too true!
Can’t we just send somebody up there that wears a size 12 1/2 to give it a swift kick? It’s how we repair and recalibrate most things.
..Aha ! You’ve seen me fixing computers, haven’t you ??
http://www.daviddarling.info/images/ball_peen_hammer.jpg
Otherwise known as a technical tap. I use it all the time. 🙂
Also known as the SPIV procedure. A Short Period of Induced Vibration.
At three minutes, et seq, how to start a stalled Bren gun carrier:
Note also a pre-Bond Connery as a comic relief Bren gunner and JFK BiL Lawford as a commando lord who doesn’t know how to handle a rifle. For that matter, Connery’s Bren handling is a little scary as well.
So what the heck is a Sten Gun ?
I encounter it all the time in crossword puzzles; and it never turns out to be Bren Gun.
But it certainly was a Bren gun we played with in school on those days when the school became an army for the day (no ammo for the Bren), or for the 2 inch mortar.
G
The Sten gun was a WWII submachine gun ie pistol caliber, while the Bren was a WWII rifle caliber light machine gun. Aparrt form both being British WWII issue, ther is no connection.
George, STEN was an acronyn, I forget what the ST stood for but the En stood for Enfield which was a weapons factory located in Enfield (same source as in Bren which was from Brno and Enfield).
The Sten was a submachine gun used during WWII and Korea by British troops.
I know Wiki isn’t usually considered reliable, but for something noncontroversial like a Sten, it should suffice:
https://en.wikipedia.org/wiki/Sten
Tom Halla April 11, 2016 at 8:15 pm
The Sten gun was a WWII submachine gun ie pistol caliber, while the Bren was a WWII rifle caliber light machine gun. Aparrt form both being British WWII issue, ther is no connection.
The connection is the ‘en’ in the names, from Enfield the name of the British armaments factory.
Or just turn it off and turn it on again. (Hello, satellite help desk, how may I help?)
Data anomalies like this give me confidence that the data is real. Manufactured data is usually just a bit to “perfect.” I’d rather have real data and deal with the imperfections than data is that is so good it’s fishy.
Well, I think we now know how the CAGW group is going to handle the next downturn in global temps .. turn off the satellites. They can’t really fudge the numbers too much anymore as everyone is looking, so a couple sensor errors or a micro-meteor hit to the solar panels and bingo.. problem solved!!
Apart from the present problem with instruments and/or data recovery, I feel a bit dubious about the 15 percent ice cover numbers. It seems to this casual observer that the area with at least 15% ice could vary over short time spans due to winds breaking up and dispersing a continuous ice sheet, or consolidating a dispersed icepack – without changing the total area of ice, or the total amount of ice.
The Canadian Ice service provides maps with ice density in 10 percent increments from zero to 100%. That being so, I wonder why NOAA can’t do the same thing. A suspiciously sceptical mind might possibly suspect that the NOAA numbers are more susceptible to “adjustment”. They wouldn’t do that, would they?
It’s called sea ice concentration (from which sea ice extent is derived to express total sea ice cover) and there are plenty of maps showing just this.
No, they don’t. They do the same thing every year (sensor reports data, algorithm turns it into concentration maps/data, and so on). No method is perfect, but as long as it is consistent, it allows us to compare years and do long-term trend analysis. Especially if there are multiple sources of data.
That’s why I don’t think this kind of discontinuities, glitches, satellite sensor failures, aren’t all that interesting to blog about. First of all, they’re not a rare occurrence. These things happen several times a year, with trend lines going wonkers on some graph or other. Second, they get fixed. Fortunately for us, there are smart people working on these things. Data (from this source) will continue soon.
Yes, it’s annoying, but not all that interesting really. It’d be interesting if all data sources disappeared at the same time (because of asteroids or Kessler syndrome), or if a data source would disappear forever. I don’t believe that’s the case here.
What is much more interesting, is the current situation with regards to Arctic sea ice. But okay, the melting season hasn’t started in earnest yet, so maybe that’s not something worth blogging about either. For now.
Should have added that the Canadian Ice Service data stops at the boundary of Canadian waters.
DMI daily mean temp chart for 80º N is not updating either.
It’s worse than we thought!!!
I’m sure they will recalibrate it a few days as we’ll see that it’s worse than we thought. The new lowest sea ice maximum will be even lower…..
Seems that they just get the Kepler spacecraft back under control.
It started acting up April 4th that puts it close to the time when the F-17 Sat. started to act up.
Some here have mentioned possible problems with one of the Sats covering the Antarctic.
Makes one wonder. Be interesting to see if any other satellites or spacecraft start to have problems.
most likely Gremlins pesky obnoxious Gremlins.
http://www.foxnews.com/science/2016/04/11/nasa-kepler-emergency-over-spacecraft-now-stable.html
michael
I don’t see how they can get accurate data daily since clouds block the view on a daily basis.
What if someone’s ‘math is wrong’ and is off by a magnitude or more and the transmission from the satellite is good ?
Maybe I should have wrote ‘an order of magnitude’ above.
The Univ. of Bremen’s ice cap thickness image hasn’t updated since April 4th. The day before was missing most of the eastern hemisphere data:
http://www.iup.uni-bremen.de:8084/smos/png/20160403_hvnorth_rfi_l1c.png
Oops – it has filled in the 5th-10th with decent looking data. I copy the latest image for the WUWT sea ice page at https://wattsupwiththat.com/reference-pages/sea-ice-page/ . I’ll let the automated update do its thing tomorrow AM.
Yay, Bremen’s back:
+ cd /home/werme/python/wuwt/bremen
+ python bremen_fetch.py
__main__
Called as main
Opening http://www.iup.uni-bremen.de:8084/smos/png/20160411_hvnorth_rfi_l1c.png
Wrote bremen_hvnorth_latest.png, len 286411 bytes.
+ convert bremen_hvnorth_latest.png -quality 75 bremen_hvnorth_latest.jpg
+ convert bremen_hvnorth_latest.png -quality 75 -geometry 312 bremen_hvnorth_latest_small.jpg
What I hadn’t noticed until tonight is that Cryosphere hasn’t updated since March 27th. I assume it’s unrelated to the satellite problems. I have no idea what the problem is and they usually don’t reply to Emails, so I won’t bother to look into it for a while.
Last image (I’m not sure why the Bremen .png image didn’t display for me above):
http://arctic.atmos.uiuc.edu/cryosphere/IMAGES/ARCHIVE/20160327.jpg
It is a rough year for sea-ice freaks. Three of the four Mass Balance Buoys are down; only 2015F still reports. Two of the six O-buoys bit the dust in the late fall, and two more during the winter, and only O-buoys 13 and 14 remain.
(Don’t tell anyone, but I have a highly suspicious side of me, due to dealing with Climate Scientists, and I was wondering if they were blowing up buoys with drones, because the buoys refuse to see Mark Serreze’s “Death Spiral”.)
Then the Russians have been having a terrible time setting up their blue-ice airstrip for their Borneo base. If that doesn’t pan out we might not get a North Pole Camera this year.
But I can handle all that. I have a toughness and resiliency above the normal standards of internet dweebs.
But messing with my sea-ice extent graphs? That is going too far, I tell you! Too far!
Thx. +1
My knowledge of Arctic sea ice is very limited at best so let me know if I am wrong. NSIDC declared Mar 24 as maximum arctic sea ice. When AW forecasted a cold snap on Apr 4, I thought it would be amusing if NSIDC had to revise the maximum sea ice so I started tracking the Arctic sea ice. I found this website that posts daily satellite images and data for the Arctic (http://www.arctic.io/explorer/). The site doesn’t have specific url for the daily images so I snipped copies to paste here.
http://www.davidsahlstrom.ca/wp-content/uploads/2016/04/Arctic-2016-03-24.png
This is maximum arctic sea ice (Mar 24) and then it receded.
http://www.davidsahlstrom.ca/wp-content/uploads/2016/04/Arctic-2016-03-31.png
Check out the area around Svalbard in the Barents Sea. Broken patches of sea ice to the north.
http://www.davidsahlstrom.ca/wp-content/uploads/2016/04/Arctic-2016-04-07.png
The ice extent started to grow. The broken patches north of Svalbard have started to fill in.
http://www.davidsahlstrom.ca/wp-content/uploads/2016/04/Arctic-2016-04-10.png
The identified sea ice area continues to expand. However yesterday there was no official sea ice extent page posted. But the infrared image is there.
http://www.davidsahlstrom.ca/wp-content/uploads/2016/04/Arctic-2016-04-11.png
The interesting thing is that yesterday’s infrared image has extensive red areas in the Barents Sea between Svalbard and Scandinavia and in Davis Strait.These red ocean areas were not there in the earlier images . This is either the artifact the NSIDC is referring to or there is a resurgence of the arctic sea ice.
More and more evidence is pointing to “a resurgence of the arctic sea ice”.
Of course the Arctic is beginning the melt season, so the increase is only temporary. But, it is interesting how a sudden increase coincides with “equipment problems”…
(Thanks for your research, David.)
Did it start The Day After Tomorrow? OMG!
There has been a very strong Beaufort Gyre for a week now, so, yes, ice is expanding on the Atlantic side. But despite strong winds it still hasn’t quite reached the northern shore of Svalbard yet.
Yes I noticed ice expanding in that area from wind, whilst it was thinning and retreating in other areas.
In making the post above, I made 2 errors. The broken ice area is west of Svalbard and the infrared image is from “today” not “yesterday”.
The arctic sea ice map doesn’t show snow cover but the 2007 one does?
I forget the details, but I concluded that Cryosphere lost its source of snow cover.
NSIDC has temporarily suspended their sea ice product, see here:
http://nsidc.org/arcticseaicenews/2016/04/sensor-on-f-17-experiencing-difficulties-sea-ice-time-series-temporarily-suspended/
Sat problem resolved?
Notice (04/19/2016):
“Daily sea ice concentration updates have improved. On 04/05/2016 a change in the solar panel position to shade the nitrogen tank on board the Defense Meteorological Satellite Program (DMSP) F-17 satellite was made. In doing so, the integrity of the vertically polarized 37 GHz channel (37V) of the Special Sensor Microwave Imager and Sounder (SSMIS) was compromised. This is a primary channel used in the sea ice processing. On 04/13/16 an additional change in the solar panel position was made.This change has improved the problems we were seeing in the 37V GHz channel. The affected daily files from 04/05 – 04/13 have been removed from distribution.”
https://nsidc.org/data/nsidc-0081