
From the University of Washington
Unusually warm oceans can have widespread effects on marine ecosystems. Warm patches off the Pacific Northwest from 2013 to 2015, and a couple of years earlier in the Atlantic Ocean, affected everything from sea lions to fish migration routes to coastal weather.
A University of Washington oceanographer is lead author of a study looking at the history of such features across the Northern Hemisphere. The study was published in March in the journal Geophysical Research Letters.
“We can think of marine heatwaves as the analog to atmospheric heatwaves, except they happen at the sea surface and affect marine ecosystems,” said lead author Hillary Scannell, a UW doctoral student in oceanography. “There are a lot of similarities.”
Land-based heatwaves are becoming more frequent and more intense due to climate change. Scannell and her collaborators’ work suggests this may also be happening in the north Atlantic and Pacific oceans. Their study finds that marine heatwaves have recurred regularly in the past but have become more common since the 1970s, as global warming has become more pronounced.
The new paper looks at the frequency of marine heatwaves in the North Atlantic and the North Pacific since 1950. Scannell did the work as a master’s student at the University of Maine, where she was inspired by the 2012 record-breaking warm waters off New England.
“After that big warming event of 2012 we keyed into it and wanted to know how unusual it was,” Scannell said. The study also analyzes another recent event, the so-called “warm blob” that emerged in 2013 and 2014 off the Pacific Northwest.
The authors analyzed 65 years of ocean surface temperature observations, from 1950 to 2014, and also looked at how these two recent events stack up.
In general, the results show that the larger, more intense and longer-lasting a marine heatwave is, the less frequently it will occur. The study also shows that the two recent events were similar to others seen in the historical record, but got pushed into new territory by the overall warming of the surface oceans.
An event like the northwest Atlantic Ocean marine heatwave, in which an area about the size of the U.S. stayed 2.0 degrees Fahrenheit (1.1 C) above normal for three months, is likely to naturally occur about every five years in the North Atlantic and northwestern Pacific oceans, and more frequently in the northeast Pacific.
The “blob” in the northeast Pacific covered an even larger area, with surface temperatures 2.7 degrees Fahrenheit (1.5 C) above normal for 17 months, and is expected from the record to naturally happen about once every five years off the West Coast.
In the northeast Pacific, the record shows that marine heatwaves are more likely during an El Niño year and when the Pacific Decadal Oscillation brings warmer temperatures off the west coast of North America. So the 2013-15 “blob” likely got an extra kick from a possible transition to the favorable phase of the Pacific Decadal Oscillation, as well as from the overall warming of the ocean.
“The blob was an unfortunate but excellent example of these events,” Scannell said. “As we go into the uncharted waters of a warming climate, we may expect a greater frequency of these marine heatwaves.”
Scannell is also co-author of an earlier study published in February in which the authors define the term “marine heatwave” and specify the duration, temperature change and spatial extent that would meet their criteria. That study was led by researchers in Australia, who were curious about a warm event from 2010 to 2011 in the Indian Ocean.
“We’re working towards a more streamlined definition so we can more easily compare these events when they occur in the future,” Scannell said.
Better understanding of marine heatwaves could help prepare ocean ecosystems and maritime industries. At the UW, Scannell currently works with Michael McPhaden, a UW affiliate professor of oceanography and scientist at the National Oceanic and Atmospheric Administration looking at air-sea interactions along the equator and other factors that might create marine heatwaves.
###
Co-authors on the new paper are Andrew Pershing and Katherine Mills at the Gulf of Maine Research Institute, Michael Alexander at the National Oceanic and Atmospheric Administration and Andrew Thomas at the University of Maine. The study was funded by the National Science Foundation.
Frequency of marine heatwaves in the North Atlantic and North Pacific since 1950
Abstract
Extreme and large-scale warming events in the ocean have been dubbed marine heatwaves, and these have been documented in both the Northern and Southern Hemispheres. This paper examines the intensity, duration, and frequency of positive sea surface temperature anomalies in the North Atlantic and North Pacific Oceans over the period 1950–2014 using an objective definition for marine heatwaves based on their probability of occurrence. Small-area anomalies occur more frequently than large-area anomalies, and this relationship can be characterized by a power law distribution. The relative frequency of large- versus small-area anomalies, represented by the power law slope parameter, is modulated by basin-scale modes of natural climate variability and anthropogenic warming. Findings suggest that the probability of marine heatwaves is a trade-off between size, intensity, and duration and that region specific variability modulates the frequency of these events.
http://onlinelibrary.wiley.com/doi/10.1002/2015GL067308/abstract
Stopped reading when I got to this in the fourth paragraph.
<i.Land-based heatwaves are becoming more frequent and more intense due to climate change.
Yup. I have always wanted to ask one of these guys what the significance they got when they rejected the alternative hypothesis that the change during the 20th century was due to solar effects.
I’d like to ask them what evidence do they have to support the claim that land based heat wavers are more frequent and intense. The actual data shows no such increase.
“””””….. This paper examines the intensity, duration, and frequency of positive sea surface temperature anomalies in the North Atlantic and North Pacific Oceans over the period 1950–2014 using an objective definition for marine heat waves based on their probability of occurrence. …..”””””
So the period of the study is from 1950 to 2014 (whatever study is referred to in this sentence.)
So the probability of occurrence of the heat waves studies is precisely 100% since all of the heat waves studied actually did occur; it’s in the records.
So probability deals with the frequency of events in a large number of tests.
In the case of climate marine heat waves there is only one such occurrence; nothing ever happens twice, so there is nothing to statisticate.
The studied events (presumably) did occur and therefore their probability of occurrence is 100%. And they will never happen again, although other heat wave events may happen from time to time, and they too will be unique never to be repeated weather events.
G
And some education professors are proposing to replace algebra with statistics, in high school mathematics courses. Lord Rutherford, must be spinning in his grave.
Thanks for the heads up.
Yes. Looks like they have their BS, MS, and now their Piled Higher and Deeper degrees…..
BS, More of the Same….it’s still BS….
My undergraduate alma mater, generating worthless PhDs in increasing numbers with a slope approaching Karl-ized temperature plots. It actually is worse than we thought.
I don’t send money anymore.
Exactly, me too. From there on in it all becomes confirmation bias. This woman will never make a scientist – no objectivity.
I didn’t see anything about a statistically significant change over time in the abstract, only that the distribution fit the definition of “random”. If there is a real change in marine surface temperatures over time, there is no such claim in the abstract.
Dave Rubin interviewed Michael Mann to prove global warming exists & is man made. Suggest you ask Rubin to interview someone to present the scientific side. Watch Part 1 here. http://youtu.be/2_Rtr8zET1o
“The authors analyzed 65 years of ocean surface temperature observations, from 1950 to 2014, and also looked at how these two recent events stack up.”
Hummm, did they use adjusted engine intake manifold readings per Karl or just extrapolate them, or perhaps use 1,200 km smoothing?
How much was this grant again?
“Findings suggest that the probability of marine heatwaves is a trade-off between size, intensity, and duration and that region specific variability modulates the frequency of these events.”
translation: one really has to torture the data, stats etc… to extirpate some signal attributable with 97% certainty to human influence… LOL
“Better understanding of marine heatwaves could help prepare ocean ecosystems and maritime industries. At the UW, Scannell currently works with Michael McPhaden, a UW affiliate professor of oceanography and scientist at the National Oceanic and Atmospheric Administration looking at air-sea interactions along the equator and other factors that might create marine heatwaves.”
Among actions contemplated is diversion of air traffic away from the heatwave zone as to avoid GHG saturation.
Do I need /sarc?
What about tracking marine cold waves? There is now a huge cold SST anomaly in the central North Pacific and there has been a smaller one in the North Atlantic for many months.
http://pamola.um.maine.edu/fcst_frames/GFS-025deg/DailySummary/GFS-025deg_WORLD-CED2_SST_anom.jpg
no need fiery orange still outweighs cold blue. that is all we need to know 😉
But the fiery orange will turn cold blue as the El Nino gives way to a La Nina. Then it will be time to return to talking about the California drought, and utterly ignore these maps. /sarc
What we are seeing is the AMO flipping from warm to cold, with the added influence of the “Quiet Sun”. We have no record of ever seeing this before (during the time we have been able to keep decent records) so of course we should expect to see things we haven’t seen before.
It is a pity there is such bias, and such pressure to prove warming is happening. If it wasn’t for that bias, one might be able to look at the records from tree-rings, the ice-caps, and the bottoms of lakes, and get a hint of what happened when the sun got quiet, and the AMO switched from warm to cold, back at the time of the Maunder Minimum. It would only be a hint, as these things never repeat themselves exactly, but it would be better than the BS currently produced.
You might want to look at figure 1 of my paper:
http://benthamopen.com/contents/pdf/TOASCJ/TOASCJ-7-51.pdf
The Open Atmospheric Science Journal, 2013, 7, 51-76 51, pp. 1874-2823/13 2013
Long-Term Lunar Atmospheric Tides in the Southern Hemisphere Ian R.G. Wilson & Nikolay S.Sidorenkov*,
Abstract: The longitudinal shift-and-add method is used to show that there are N=4 standing wave-like patterns in the summer (DJF) mean sea level pressure (MSLP) and sea-surface temperature (SST) anomaly maps of the Southern Hemisphere between 1947 and 1994. The patterns in the MSLP anomaly maps circumnavigate the Earth in 36, 18, and 9 years. This indicates that they are associated with the long-term lunar atmospheric tides that are either being driven by the 18.0 year Saros cycle or the 18.6 year lunar Draconic cycle. In contrast, the N=4 standing wave-like patterns in the SST anomaly maps circumnavigate the Earth once every 36, 18 and 9 years between 1947 and 1970 but then start circumnavigating the Earth once every 20.6 or 10.3 years between 1971 and 1994. The latter circumnavigation times indicate that they are being driven by the lunar Perigee-Syzygy tidal cycle. It is proposed that the different drift rates for the patterns seen in the MSLP and SST anomaly maps between 1971 and 1994 are the result of a reinforcement of the lunar Draconic cycle by the lunar Perigee-Syzygy cycle at the time of Perihelion. It is claimed that this reinforcement is part of a 31/62/93/186 year lunar tidal cycle that produces variations on time scales of 9.3 and 93 years. Finally, an N=4 standing wave-like pattern in the MSLP that circumnavigates the Southern Hemisphere every 18.6 years will naturally produce large extended regions of abnormal atmospheric pressure passing over the semi-permanent South Pacific subtropical high roughly once every ~ 4.5 years. These moving regions of higher/lower than normal atmospheric pressure will increase/decrease the MSLP of this semi-permanent high pressure system, temporarily increasing/reducing the strength of the East-Pacific trade winds. This may led to conditions that preferentially favor the onset of La Nina/El Nino events.
The article reads, “Land-based heatwaves are becoming more frequent and more intense due to climate change.”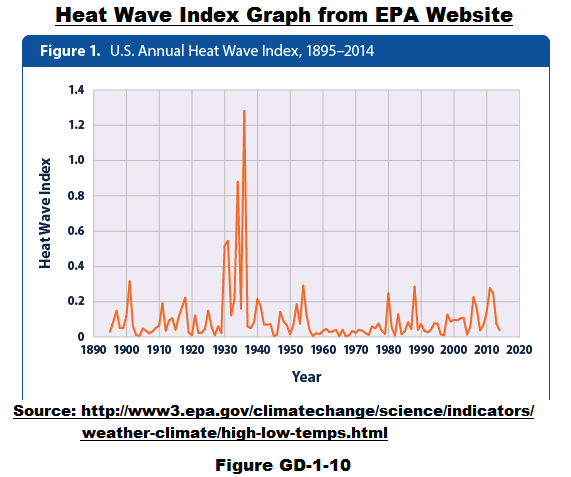
Hmm. As an example, the EPA’s U.S. Heat Wave Index from 1895 to 2014 disagrees with that claim:
Source:
https://www3.epa.gov/climatechange/science/indicators/weather-climate/high-low-temps.html
No no no they started from 1950 not 1895. If they started from 1895 that would have shown the warming during the 20’s, 30’s and early 40’s which would have messed up their grant seeking.
Oops haven’t “fixed, adjusted, tweeked, improved, corrected” that data from the 1930’s yet. It is on the list
Bob:
Why is it that data from a country that occupies 2% of the Globe is so frequently presented here as evidence against warming?
Global warming that is.
Because you trolls use it for opposite reasons,toneb…
Since less than 5% of the earth’s surface comes anywhere close to being adequately monitored.
Toneb
its a hell of a lot better then using data from other regions to fill in regions that aren’t monitored at all to establish warming.
This graph cannot be right! Where is the influence of air-conditioners and SUVs? I demand an immediate grant!
This chart shows the 1930’s as being hotter than all subsequent years. It shows the REAL temperature profile we have been living under all our lives. Or, at least it is a lot closer than NASA and NOAA have it.
This is the kind of chart that should be promoted, not those adulterated NASA/NOAA abominations, which should be ridiculed, not used. Any surface temperature chart that doesn’t have a profile similar to this one, is a BIG LIE.
They say 2015 is the “Hottest Year Evah!”! You couldn’t tell it from this chart.
Thanks for the chart, Bob.
The Warm 1930s occur in so many different data sets.
In the 1950s I had a few spots on my arm that I could see with my eyes. I didn’t really pay much attention to them… Then I began to pay them more and more attention in case it was something bad. Since then, they look the same with my eyes but over the years i got a magnifying glass and then a microscope and really began to pay attention to the spots and found that there are so many more spots and other things I never saw before and can see now, with my focused attention and new tools, it is almost mind boggling.
very good analogy.
Unprecedented.
Yeah, I have lots of those age spots too. But mine keep growing – even without a magnifying glass and microscope!
A little analogy to what many climate scientists are doing these days.
Again, the text scanning machine, filtering published work to copy /paste the wanted new metastudy.
‘The authors analyzed 65 years of ocean surface temperature observations, from 1950 to 2014, and also looked at how these two recent events stack up.’
If it’s not models then MSword and Excel do have some forcfull features.
My dinglish, I know. Forc -> powerfull.
Johann
Noted, but understood. Thanks for commenting. I know I would struggle to comment in a second language.
And a propos of the whole thread, I would prefer a degree warmer to a degree colder.
My garden, too, would agree, were the plants, mosses, animals etc. to have the vote.
And our long-tailed tits are up 44% I a year [RSPB figures, from this morning’s Daily Telegraph].
Auto
Last August and fishing for salmon in the PNW, we used frozen herring for bait. It appeared the salmon preferred a cold lunch versus a hot lunch after passing through the hot “Blob” sitting off the mouth of the Strait of Juan de Fuca. ; )
PS: the humpy run (also called pinks) was quite good and we also did well getting king salmon. If there is any correlation, send us a “Blob” every year.
Thought the piece might be interesting BUT — The fact that there are/were “heat waves” manifesting as warm spots on the ocean surface (there is no reliable data in sufficient detail to show the existence of subsurface warmth – or not) is of interest but ONLY IF the effect of this phenomena is described and related one anomaly to another. Since none of the effects are described the paper is valueless.
I don’t get it. Why the badmouthing of this paper?
The study seems to be quite reasonable, trying to define ocean heat waves in an objective fashion.
These anomalies do have consequences in the biosphere, currently exemplified by a major die-off of sea birds along the west coast. See:
http://www.adn.com/article/20160324/alaskas-massive-seabird-die-spreads-katmai-national-park
It surely makes sense to try to document this phenomenon and to estimate how frequently it occurs.
If the researcher expresses concern that it may happen more often in the future, that does not impinge on the documented past. Certainly there was no claim that there was an increased incidence of these heat waves in the record studied.
Reading comprehension is important to understand the science behind the postingspostings. Here is the statement you claim was not made:
“Land-based heatwaves are becoming more frequent and more intense due to climate change. Scannell and her collaborators’ work suggests this may also be happening in the north Atlantic and Pacific oceans. Their study finds that marine heatwaves have recurred regularly in the past but have become more common since the 1970s, as global warming has become more pronounced.” Also did you miss the intent to mislead by starting in 1959?
1950’s !!!
etudiant
March 30, 2016 at 5:25 pm wrote:
“I don’t get it. Why the badmouthing of this paper?”
Probably because the paper is trying to bring human-caused global warming/climate change into it by claiming, without any evidence, that “Land-based heatwaves are becoming more frequent and more intense due to climate change.”
I think it is the “without any evidence” part that bothers people here.
I like them doing the study, as I am curious about these events, but they could do that without invoking climate change.
Also the statement that ‘this needs further study’…A grasp at more funding for her and colleagues.
Prior to 1990, the data was sparse and after 1990 you have a network then such studies will carry any meaning.
Dr. S. Jeevananda Reddy
“Their study finds that marine heatwaves have recurred regularly in the past but have become more common since the 1970s, as global warming has become more pronounced.” “Land-based heatwaves are becoming more frequent and more intense due to climate change.”
Minus the tail wagging the dog narrative, i.e. AGW, the two quotes above would add up, if the scientists considered the natural variability aspect of climate where seawater energy can directly influence terrestrial temperatures and weather.
“Better understanding of marine heatwaves could help prepare ocean ecosystems and maritime industries.”
Poppycock.
Define “help prepare”.
It’s a meaningless phrase that suggests nothing but whatever is imagined by the reader.
Reminds me of the absurd suggestion from Lubchenco when she claimed a National Climate Service could predict climate 100 years out and help guide public officials on where to locate wind farms and other infrastructure.
Stupid beyond belief.
That’s not that hard, as wind farms locations are primarily defined by geography, which doesn’t change much over 100 years.
Hotter nighttime minimum temps are a sign of a warming climate due to an increase in C02…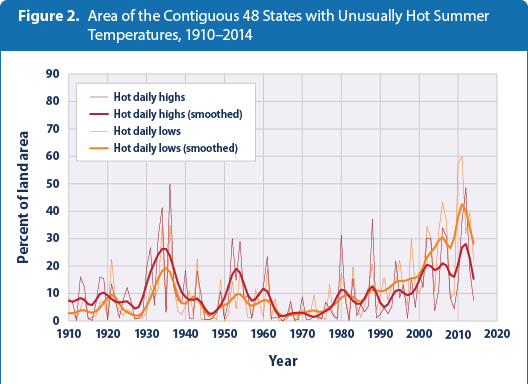
This graph shows the percentage of the land area of the contiguous 48 states with unusually hot daily high and low temperatures during the months of June, July, and August.
Spaatch,
You may not realize it, but Enhanced UHI is a better explanation than incr CO2 forcing for that graph.
It’s that Occam’s razor thing and the scientific method where alternative explanations can’t be dismissed just by belief in the favored paradigm.
“Enhanced UHI is a better explanation”
No it’s not – may I refer you to the BEST study to confirm that.
(Head scientist Richard Muller and former sceptic)
https://en.wikipedia.org/wiki/Berkeley_Earth
From: http://berkeleyearth.org/faq/
“The Urban Heat Island effect is real. Berkeley’s analysis focused on the question of whether this effect biases the global land average. Our UHI paper analyzing this indicates that the urban heat island effect on our global estimate of land temperatures is indistinguishable from zero.”
Doesn’t take much to get you to swallow the propaganda.
Mark W
toneb’s not swallowing he promoting
If you don’t know why UHI is a better mechanism than CO2 forcing, I can explain … if you have an open mind.
So let’s see if I can do some math here.
They say these blob events happen every 5 years. They have 65 years of data, so they have ~65/5 ~= 13 blob events on hand.
They think they can get a statistically significant trend off of 13 data points?
I don’t think so.
Peter
Look for the atmospheric signals driving it, like the deeply negative Arctic Oscillation through March 2013, and the long period of negative North Atlantic Oscillation through summer 2012. It’s the stuff of solar minima.
Is anybody monitoring heat input at the ocean floor from submarine vulcanism? The Juan de Fuca Plate is the most seismically active area of the Northeast Pacific, and the ‘Blob’ seems to be locked in place directly above the north end of it, off the northern end of Vancouver Island.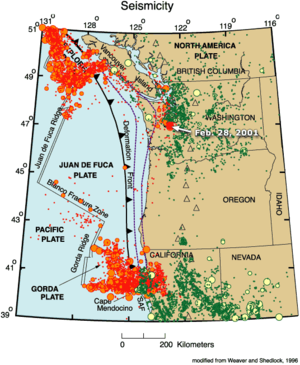
Speaking of sea surface temperatures, this article has completely dissected the latest barrier reef coral bleaching scare: http://themarcusreview.com/2016/03/30/dont-move-or-the-reef-gets-it/
Something I’ve wondered about with respect to The Blob. With Negative PDO, there are two limbs of warm-ish water in the shape of a “<" sign, apex of which is over toward Asia. I wonder if a piece of the Northern part of the limb broke off, got caught up in the current flow, and then impinged against North America. Having such a large mass of warm-ish water at such a high latitude, up against the continent, might have distorted the overall current flow enough to actually cause the mass to become semi-stationary. The disruption might have even destroyed the northern warm limb, causing additional pieces to break free and add to The Blob.
Maybe your blob has something to do with Axial Seamount going off. The volcano is reported to be some 250 miles off the central Oregon coastline. Seems like that would line up pretty nicely to the Blob shown in the article. Perhaps a little research into the area would squelch the marine heat wave theory hmmm?
I forgot my link http://www.pmel.noaa.gov/eoi/axial_site.html