Pacific pattern often forms in advance of hot days in eastern US
From the NATIONAL CENTER FOR ATMOSPHERIC RESEARCH/UNIVERSITY CORPORATION FOR ATMOSPHERIC RESEARCH
BOULDER — The formation of a distinct pattern of sea surface temperatures in the middle of the North Pacific Ocean can predict an increased chance of summertime heat waves in the eastern half of the United States up to 50 days in advance, according to a new study led by a scientist at the National Center for Atmospheric Research (NCAR).
The pattern is a contrast of warmer-than-average water butting up against cooler-than-average seas. When it appears, the odds that extreme heat will strike during a particular week—or even on a particular day—can more than triple, depending on how well-formed the pattern is.
The research is being published in the journal Nature Geoscience.
“Summertime heat waves are among the deadliest weather events, and they can have big impacts on farming, energy use, and other critical aspects of society,” said Karen McKinnon, a postdoctoral researcher at NCAR and the lead author of the study. “If we can give city planners and farmers a heads up that extreme heat is on the way, we might be able to avoid some of the worst consequences.”
The research was largely funded by the National Science Foundation, NCAR’s sponsor. In addition to McKinnon, the research team includes Andrew Rhines, of the University of Washington; Martin Tingley, of Pennsylvania State University; and Peter Huybers, of Harvard University.
A FINGERPRINT ON THE OCEAN
For the study, the scientists divided the country into regions that tend to experience extreme heat at the same time. The scientists then focused on the largest of the resulting blocks: a swath that stretches across much of the Midwest and up the East Coast, encompassing both important agricultural areas and heavily populated cities.

Top: Sea surface temperature anomalies in the mid-latitude Pacific 50 days in advance of June 29, 2012. The pattern inside the green box resembled the Pacific Extreme Pattern, indicating that there would be an increase in the odds of a heat wave in the eastern half of the United States at the end of June. (Image courtesy of Karen McKinnon, NCAR. This image is freely available for media & nonprofit use.)
Bottom: June 29, 2012, was the hottest day of the year in the eastern United States. The hot temperatures in late June and early July were part of an extraordinarily hot summer that saw three heat waves strike the country. (Map courtesy of the National Weather Service’s Weather Prediction Center.)
The research team looked to see if there was a relationship between global sea surface temperature anomalies—waters that are warmer or cooler than average—and extreme heat in the eastern half of the U.S.
Right away, a pattern popped out in the middle of the Pacific, above about 20 degrees North latitude. The scientists found that the particular configuration of ocean water temperatures, which they named the Pacific Extreme Pattern, was not only found when it was already hot in the eastern U.S., but that it tended to form in advance of that heat.
“Whatever mechanisms ultimately leads to the heat wave also leaves a fingerprint of sea surface temperature anomalies behind,” McKinnon said.
IMPROVING SEASONAL FORECASTS
To test how well that fingerprint could predict future heat, the scientists used data collected from 1,613 weather stations across the eastern U.S. between 1982 and 2015, as well as daily sea surface temperatures for the same time period.
The scientists defined extreme heat in the eastern U.S. as a summertime day when the temperature readings from the warmest 5 percent of weather stations in the region were at least 6.5 degrees Celsius (11.7 degrees Fahrenheit) hotter than average. The scientists only looked at extreme heat during that region’s 60 hottest days of the year: June 24 through Aug. 22.
The researchers “hindcasted” each year in the dataset to see if they could retrospectively predict extreme heat events—or lack of those events—during that year’s summer, using only data collected during the other years as a guide.
At 50 days out, the scientists were able to predict an increase in the odds—from about 1 in 6 to about 1 in 4—that a heat wave would strike somewhere in the eastern U.S. during a given week. At 30 days out or closer, the scientists were able to predict an increase in the odds—to better than 1 in 2 for a particularly well-formed pattern—that a heat wave would strike on a particular day.
This new technique could improve existing seasonal forecasts, which do not focus on predicting daily extremes. Seasonal forecasts typically predict whether an entire summer is expected to be warmer than normal, normal, or cooler than normal.
For example, the seasonal forecast issued for the summer of 2012 predicted normal heat for the Northeast and Midwest. But, the summer ended up being especially hot, thanks to three major heat waves that struck in late June, mid-July, and late July.
When the science team used the Pacific Extreme Pattern to hindcast 2012, they were able to determine as early as mid-May that there were increased odds of extremely hot days occurring in late June. The hottest day of the summer of 2012, as measured by the technique used for this study, was June 29, when the warmest 5 percent of weather stations recorded temperatures that were 10.4 degrees Celsius (18.7 degrees Fahrenheit) above average.
“We found that we could go back as far as seven weeks and still predict an increase in the odds of future heat waves,” McKinnon said. “What’s exciting about this is the potential for long-range predictions of individual heat waves that gives society far more notice than current forecasts.”
LOOKING AHEAD
Scientists do not yet know why the fingerprint on sea surface temperatures in the Pacific predicts heat in the eastern U.S. It could be that the sea surface temperatures themselves kick off weather patterns that cause the heat. Or it could be that they are both different results of the same phenomenon, but one does not cause the other.
To learn more about how the two are connected, McKinnon is working with colleagues at NCAR to use sophisticated computer models to try and tease apart what is really happening.
The study’s findings also point toward the possibility that the Pacific Extreme Pattern, or a different oceanic fingerprint, could be used to forecast other weather events far in advance, including cooler-than-average days and extreme rainfall events.
“The results suggest that the state of the mid-latitude ocean may be a previously overlooked source of predictability for summer weather,” McKinnon said.
About the paper
Title: Long-lead predictions of eastern United States hot days from Pacific sea surface temperatures
Authors: Karen McKinnon, Andrew Rhines, Martin Tingley, and Peter Huybers
Journal: Nature Geoscience http://dx.doi.org/10.1038/ngeo2687
Imagine that, the greatest heat sink on planet earth impacts the global temperatures. As I’ve always said, explain what is warming the oceans and you explain what is warming the atmosphere above it…and it ain’t CO2.
“…and it ain’t CO2.”
You’ll never get any Fed gravy with an attitude like that.
So they cherry picked pictures places and things that run along together.
“””””….. The formation of a distinct pattern of sea surface temperatures in the middle of the North Pacific Ocean can predict an increased chance of summertime heat waves in the eastern half of the United States up to 50 days in advance, …..”””””
Lots of avenues of escape from this definitive declaration.
What happens after 50 days; forgive me, I need to be more specific.
What sort of anomalous whatever forming at some location somewhere CAN predict a different chance of seasonal Temperature patterns somewhere else later than 50 days from such formation ??
They do say ” can predict ” No ifandsorebutts about it; it’s gonna happen. It’s only barely made it into spring, and we have already had heat waves in California, and it so happens also in the eastern half of the United States. Just this past weekend, both men and women tennis players were dropping like flies at the Miami Open Tennis tournament.
The Temperature was only 80 deg. F compared to the global norm of 59, so that’s a heat wave, and also the relative humidity was high. A guy from Spain who is supposed to be the best player in the world on dried mud tennis courts gave up after a set and a bit, in which he wasn’t doing so well, and lady from either Sweden or Holland (can’t remember which) gave up after thrashing her Grand slam champion opponent in the first set.
Must have been a heat wave as near as I could tell.
So we are supposed to believe that 50 days later than some anomalous numbers appear; Oh I think I see it. The red patch in the Pacific gets transported shape intact and planted down in Oklahoma and surrounding areas. The water colors aren’t quite the same as the ground colors but they seldom are.
Now all they need is some physical cause and effect linkage that stays intact but only for 50 days. Why does it wait for the earth to revolve 50 times, to move from the Pacific to Oklahoma.
Talk about stretching a yarn ??
G
I was wondering if they had discovered the jet stream, moving warm air from one place to another. Fifty day seems rather long though.
In my humble opinion, Major Climate Change (100ky time scale) is substantially the result of gravitationally induced modulations to the release of internally generated Earthly heat. Maya Tolstoy’s work (Columbia University’s Lamont-Doherty Earth Observatory) bears this out. And if you kindly give this thought process some effort, you’ll see how it is that many i’s-get-dotted & t’s-get-crossed within an evaluation of a broad spectrum of previous climate observations and understanding.
Maya Tolstoy abstract to Geophysical Research Letters “Mid-ocean ridge eruptions as a climate valve”:
Seafloor eruption rates and mantle melting fueling eruptions may be influenced by sea level and crustal loading cycles at scales from fortnightly to 100 kyr. Recent mid-ocean ridge eruptions occur primarily during neap tides and the first 6 months of the year, suggesting sensitivity to minor changes in tidal forcing and orbital eccentricity. An ~100 kyr periodicity in fast-spreading seafloor bathymetry and relatively low present-day eruption rates at a time of high sea level and decreasing orbital eccentricity suggest a longer-term sensitivity to sea level and orbital variations associated with Milankovitch cycles. Seafloor spreading is considered a small but steady contributor of CO2 to climate cycles on the 100 kyr time scale; however, this assumes a consistent short-term eruption rate. Pulsing of seafloor volcanic activity may feed back into climate cycles, possibly contributing to glacial/interglacial cycles, the abrupt end of ice ages, and dominance of the 100 kyr cycle.
Maya Tolstoy TED Talk here: https://www.youtube.com/watch?v=dhMoQrLEJe0
I predict that a strong correlation might be revealed between a plot of the Younger Dryas “fit/start” deglaciation temperature curve an one that plots celestially induced gravitational perturbations (possibly further complicated by a potentially required understanding of constructive interference/stimulation with bulk Earth resonance).
Something useful for a change, i.e. vacation planning
One in six to one in four odds. So 3 out of 4 times there ISN’T a heatwave 50 days later when this magic pattern occurs. 1 in 2 odds 30 days out for a particularly well formed magic pattern. That is a coin toss. Heck of a lot cheaper than NCAR.
Heat wave defined as warmest 5% of stations in the ‘region’ 6.5C greater than the average in the region. Any 5%, not a contiguous 5%. Define heat wave weirdly enough, and NCAR can get as good as a random coin toss prediction. Utterly USELESS drivel. Embarrassingly bad ‘climate science’. Cargo cult bad. Phrenology bad.
But publishable.
“But publishable.”
Damn near anything is publishable in climate “science” except for anything that smacks of clearing CO2 as the cause of warming (real or imagined warming).
So is a horoscope, which is carefully crafted to have greater than 50% probability to describe absolutely anybody at all, and that is all 12 verses describe absolutely anybody at all (well with some disagreements.
One agreement can forgive 13 disagreements.
G
and more importantly , fundable.
“Damn near anything is publishable in climate ‘science'”.
In academia, almost anything is publishable in almost any field. Faculty, even at second and third tier schools, need to produce publications to get tenure and promotion. And serving on the editorial board of a journal can count toward both. So there is a great proliferation of journals, and they need to be filled with articles to justify their existence. Therefore even very poor quality research, or even outright spoofs such as the Sokal hoax, can always find a place to land. https://en.wikipedia.org/wiki/Sokal_affair
I dunno. my impression is that forecasting beyond a couple of weeks is so awful that even a hazy 25% correlation might be a significant improvement. Anybody around here actually know anything about seasonal forecasting and its “success” rate?
What part of the energy cycle don’t the warmest understand? Over 80% of the Suns energy first goes into the oceans and is then released by evaporation into the atmosphere.
CO2 doesn’t play a part in regulating the earths temperature.
Not so.
Maybe 80% of the sun’s energy does go into the oceans at some low cloud times, but it goes far too deep to get released by evaporation. That’s the rub; it goes into the oceans, and doesn’t show its face again for eons.
G
It’s the atmospheric emitted LWIR that promotes evaporation, rather than heat storage.
George, I usually go along with most that you write, but I’m struggling with this (above).
Now I might agree that it’s LWIR from water vapor, but I don’t think CO2 has much of an impact at all.
Perhaps my postscript was too curt.
What it refers to is that downward LWIR from the atmosphere/clouds/GHGs/whatever, being as it is absorbed in the top 5-50 microns of water surface will increase evaporation. Whereas peak solar spectrum energy from the sun, has a 1/e penetration depth of 100 meters, so very little of it is absorbed in the surface layers to cause evaporation.
No I certainly did not mean to imply (I didn’t) that ALL evaporation comes from downward LWIR radiation.
Plenty of it is due to conduction/convection heating of surface waters in shallower areas.
But solar spectrum energy mostly goes into deep storage.
G
George,
First off the net LWIR between the oceans surface and atmosphere is slightly negative, the ocean emits more LWIR than it absorbs, because it is warmer than the atmosphere.
And yes the shortwave energy goes into the oceans but they are in quasi equilibrium and have been for millennia. The ocean only cools via evaporation (the vast majority anyway).
However if what you are claiming is true, that increased downwelling LWIR increases evaporation then the oceans should be cooling, because of more evaporation.
Jinghis, Downwelling LWIR does cool the oceans as it increases evaporation. It is a simple experiment to set up a tank of open water with plenty of air above it for free evaporation, then an infra red lamps emitting IR at the level and frequency of downwelling LWIR from the atmosphere Measure the temperature change of the tank of water. This simple experiment has not been done as it would show that downwelling IR from the atmosphere cools the ocean surface and water is >66% of the surface of the Earth. Hence increased atmospheric CO2 if it causes downwelling IR cools the surface.
Any air movement over the surface will also cool the surface by evaporation and removal of latent heat of evaporation, as anyone climbing out of a swimming pool will know. If air is stationary over a water surface there will be evaporation into the air. Air with some water vapor molecules is lighter than the same volume of dry air as the molecular weight of H2O is less than that of N2 or O2. Therefore, higher humidity air will rise and will draw in lower humidity air;as a breeze of moving air; self starting a convection process.
All this cooling can only be reversed by higher frequency energy penetrating deeper into the water and being absorbed.
[quote] Ian, – Downwelling LWIR does cool the oceans as it increases evaporation. It is a simple experiment to set up a tank of open water with plenty of air above it for free evaporation, then an infra red lamps emitting IR at the level and frequency of downwelling LWIR from the atmosphere Measure the temperature change of the tank of water. This simple experiment has not been done as it would show that downwelling IR from the atmosphere cools the ocean surface and water is >66% of the surface of the Earth. Hence increased atmospheric CO2 if it causes downwelling IR cools the surface. [/unquote]
If you take an IR gun and shoot the surface of the ocean and then horizontally to the horizon you will see that the IR readings are roughly the same. If you then shoot the bottom of a cloud you will see that the IR reading is slightly lower and if you shoot the clear sky you will see that it is dramatically cooler.
The reason your IR experiment has never been done is because it is meaningless, there are no IR sources that are hundreds of degrees warmer than the surface of the ocean. The reality is that the surface of the ocean radiates more IR into the atmosphere than it absorbs, although the net flux is close to zero.
The ocean cools almost exclusively via evaporation, not radiation. Hence there is no extra IR radiation for the CO2 molecules to absorb.
Evidently it is not possible to make a one sentence remark here without inviting an avalanche of “you forgot this”.
No I don’t forget much of anything; but don’t always mention something that is unrelated to some point I am attempting to make.
In particular, I did not intend to say anything at all about LWIR emissions from the ocean.
The subject was solar spectrum energy impinging on the ocean and causing evaporation.
The highest energy part of the solar spectrum goes far too deep to cause (prompt) evaporation. On the other hand downward LWIR from whatever source in the atmosphere, is totally absorbed in just a few microns of the ocean surface.
Sea water absorption coefficient at 3 micron IR wavelength is almost eight orders of magnitude HIGHER than the absorption coefficient at around 500 nm where the solar peak is. (10^4 cm^-1 versus 10^-4 cm^-1).
And it is for this very reason; that sea water is a near total absorber in the 1-100 micron wavelength LWIR range, that the ocean surface acts like a near black body radiator for LWIR emissions at around 10.0 microns.
The deep oceans are visibly black at solar wavelengths (because it propagates deep enough to get absorbed by something down there and not return to the surface as it can in shallow water); but the sea surface, even shallow water is IR black, and so emits a grey body thermal spectrum.
But the evaporation of H2O molecules from the tropical sea surface (25-30 deg. C) is due to the Temperature of the surface water, and NOT due to the incidence of solar spectrum radiant energy at 500 nm peak wavelength. And downward LWIR selectively heats that very surface film which is responsible for evaporation. You don’t get evaporation from 100 metres deep or even from 100 mm deep.
G
The tropical sea surface at 31 deg. C should be emitting grey body radiation at about 485 Wm^-2 at about 10.0 micron peak wavelength.
My comment said nothing about INCREASED downward LWIR from the atmosphere. Simply whatever downward LWIR there is from wherever, whether GHGs or clouds or aerosols or whatever, is in a thermal spectrum from about 5.0 to 80.0 microns wavelength (98% of the energy) and that is absorbed in a layer of water (99%) that is less than 50 microns (2 mils). It doesn’t go any deeper than that. As a result the very surface film (it’s not a film) water molecules can absorb that energy and as a result break free of the surface . Those molecules that escape, comprise the high energy end tail of the Maxwell-Boltzmann kinetic energy distribution curve, so they are (in effect) hotter than the bulk of the surface water.
As a result of the selective evaporation of the highest energy surface molecules, the mean KE of the remaining molecules is lower, and so the very surface Temperature of the water is lower than the bulk water Temperature (near the surface). The extra KE that these ‘hot’ surface molecules carry off with them is in fact what the latent heat of evaporation consists of. It IS the latent heat.
And because only the highest KE molecules escape, the evaporated water vapor, has a higher Temperature than the atmosphere it escapes into so that latent heat will be shared with the air molecules in collisions, so the water vapor rapidly assumes the same Temperature as the near surface atmospheric Temperature. The ascending lighter H2O molecules being carried aloft by convection (water is hotter than surface atmosphere) do NOT maintain a Temperature differential above the atmosphere gases. They quickly thermalize and if they remain close to the water surface, they can easily drop back in, since the (locally) flat water surface is a very desirable condensation substrate.
Once the H2O molecules are transported to the atmosphere away from the surface, they are resistant to condensation even though below the boiling point, because they need a large radius of curvature substrate to condense on. (Internal excess pressure of a water droplet is 2t/r due to surface tension, so small radius droplets cannot form).
Solar UV may result in evaporation because you have high photon energy and somewhat strong absorption, but at around 520 nm the 1/e absorption depth is 100 meters (330 feet).
G
George,
You are missing the fundamental fact that the surface of the ocean emits more and higher energy LW radiation to the atmosphere than the atmosphere above it emits into the ocean.
The Energy for the molecules to evaporate comes from the high energy shortwave radiation from the sun that warms the surface molecules via conduction. Evaporation cools the surface of the water because it is the molecules with the highest energy that make the phase transition.
Water vapor is less dense than the air, thus it rises and is responsible for the Earths weather and temperature.
CO2 doesn’t really matter one way or the other. Downwelling IR doesn’t really matter either, it is the kinetic energy that is doing all the work.
“””””…..
jinghis
March 29, 2016 at 4:36 pm
George,
You are missing the fundamental fact that the surface of the ocean emits more and higher energy LW radiation to the atmosphere than the atmosphere above it emits into the ocean. …..”””””
“””””….. george e. smith
March 29, 2016 at 1:23 pm
The tropical sea surface at 31 deg. C should be emitting grey body radiation at about 485 Wm^-2 at about 10.0 micron peak wavelength. …..”””””
Clearly I am not missing anything; and in particular I am not missing that the tropical ocean surface (in this case specified as being at +31 deg. C emits more LWIR radiation than it received downward from the atmosphere.
I even gave a limiting black body value for the deep water surface LWIR emission. which also is emitted in an upward Lambertian radiation pattern.
The atmosphere on the other hand emits isotropically, so less than half of that emission from a colder body of material is even headed downward toward the ocean surface.
The issue was whether incoming shortwave solar spectrum radiant energy causes (substantial) ocean evaporation, and whether downward LWIR radiant emission from a cooler atmosphere caused any (substantial) ocean warming; rather than causing (prompt) evaporation from a few microns of the ocean surface.
G
George, “It’s the atmospheric emitted LWIR that promotes evaporation, rather than heat storage.”
No it doesn’t, but that is irrelevant to my point.
My point was that evaporation is almost the sole means the ocean has for cooling not radiation.
Evaporation creates packets of less dense air that rise into the atmosphere without warming the atmosphere until the water precipitates out and the packets quit rising.
This process short circuits the wamists radiation only meme.
McKinnon et al is so preliminary and tentative I am suprised it reached print as anything other than a thesis proposal.
The corollary of the discovery that anomalously warm ocean water can be used to predict the occurrence of anomalously warm events on land in the vicinity of the warm ocean water and downwind of the warm ocean water is:
Anomalously cold ocean water will cause there to be anomalously cold events on land in the vicinity of the cold ocean water and downwind of the cold ocean water.
There was and are piles and piles and piles of observations and analysis results which support the assertion that the entire scientific premise of the IPCC reports is incorrect. Not slightly incorrect, completely incorrect.
The long running gig of the cult of CAGW is over. 18 years without warming can be hand waved away with the warming is hiding in the deep ocean, or nah, nah, nah we cannot hear you, or changing the subject by calling all those who question the great cult of CAGW bad, bad, bad deniers.
Global cooling changes everything. The public and media will demand an explanation for scary in your face global cooling.
Big surprise. Cyclic abrupt climate change in the paleo record had and has a physical cause. Solar cycle changes are the cause of cyclic abrupt climate change in the paleo record and were the reason for the warming in the last 150 years.
The solar cycle has been interrupted.
There is a peculiar madness of crowds.
http://www.ospo.noaa.gov/data/sst/anomaly/2016/anomnight.3.28.2016.gif
“Summertime heat waves are among the deadliest weather events”….
Oh really? Right in there among the top 100 “events”, eh?
personally expecting the “Conventions” to be riskier …
hee-hee! +1, Bubba
And I am sure that wintertime cold bursts are also amongst the deadliest weather events. Meaningless words by the authors but included to help with the alarm.
That was the first thing that caught my eye. Yes some people caught in the Urban Heat Traps called cities may have problems with heat waves, but if you want real death, let a place that usually only sees two or three heating days a year hit 10F or so for a week. People drop like flies! COLD KILLS, heat is a matter of shade and water i.e. adaption
Stop the presses! Warm water evaporates faster, water vapor is a greenhouse gas, and prevailing wind direction is west to east.
And the ground rotates fifty times in 50 days or thereabouts. The air doesn’t. Here today, gone tomorrow.
G
This goes hand in hand with willy worms predicting winter, I guess, or my monkey, Raster, throwing darts to predict the stock market.
Or me just flipping a coin which does have at least a 1 in 2 chance of being right.
I can see Pacific ocean temps influencing the strength and location of highs and lows, which in turn determine a lot of the weather. But a 1 in 4 chance of being correct on anything is a losing proposition in my book.
Don’t throw darts at the stock map. Morningstar market indices, all track CO2 better than global Temperature does.
G
The Pacific Extreme Pattern (wow that’s a dumb name) is one region of the Pacific that warms during La Nina events and the Eastern U.S. is typically warmer and dryer during La Nina years.
They’ve discovered a correlation that’s already known, it’s like taking “temperatures are typically higher in the day” and rewording it to “temperatures are typically warmer on the side of the planet facing the sun.”
http://www.srh.noaa.gov/images/abq/cli/features/LaNinaPrecip/ENSOcycle.png
http://www.weather.gov/images/cle/Wx_Events/2011/Precip/ENSO_pic.jpg
I have been claiming this for a while (though to be fair, no dates, etc).


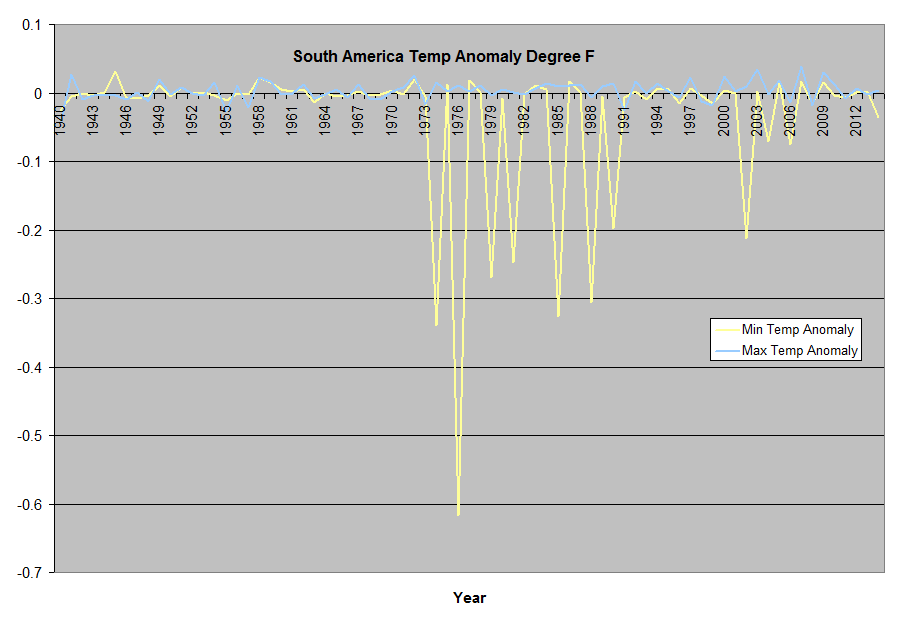


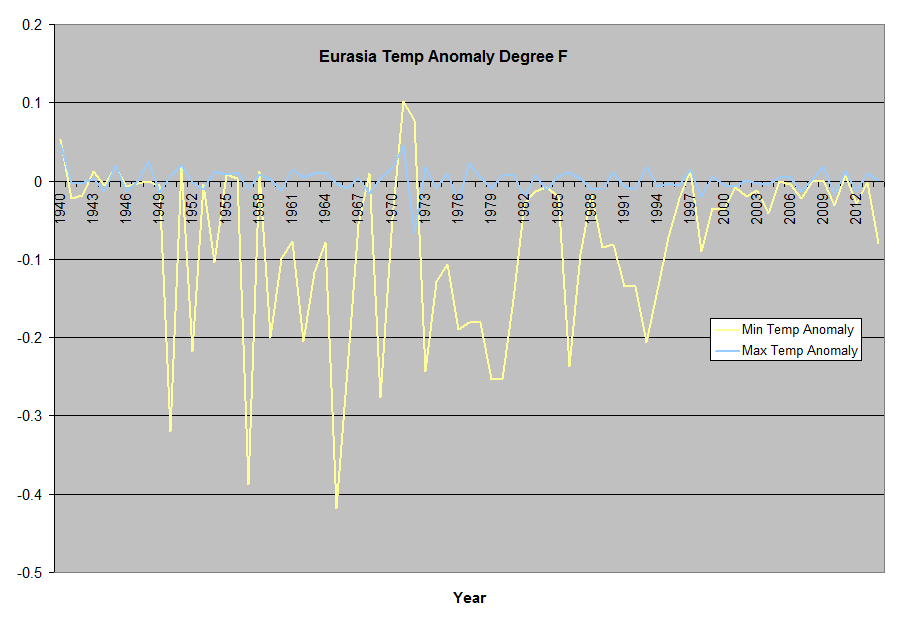


You can see that the surface record is not a global warming trend, but a series of regional swings in Min temps.
Regional annual averaged daily differences.
(Tmin day-1)-(Tmin d-0)=Daily Min Temp Anomaly= MnDiff
(Tmax day-1)-(Tmax d-0)=Daily Max Temp Anomaly= MxDiff
Global Average
US +24.950 to +49.410 Lat: -67 to -124.8 Lon
Notice how many of the same transitions in the global derivative also show up in some of the regional charts, but not others.
Tropics -23.433 to +23.433 Lat
Southpole -66.562 to -90 Lat
Southern Hemisphere -23.433 to -66.562 Lat
South America -23.433 to -66.562 Lat: -30 to +180 Lon
Northpole +66.562 to +90 Lat
Northern Hemisphere +23.433 to +66.562 Lat
Eurasia +24.950 to +49.410 Lat: -08 to +180 Lon
Australia -23.433 to -66.562 Lat: -100 to -180 Lon
Africa -23.433 to -66.562 Lat: -100 to -30 Lon
Basically the entire modern warm period shows up as changes to the derivative of regional min temp records, while Max temp data from the exact same stations shows no change.
See more here https://micro6500blog.wordpress.com/2015/11/18/evidence-against-warming-from-carbon-dioxide/
@ micro 6500, your 1976 low temp anomalies ( Africa, south America and others are eerily in line with the eruptions on Gaudeloupe that lasted for 6 months (5 eruptions).
“Summertime heat waves are among the deadliest weather events, and they can have big impacts on farming, energy use, and other critical aspects of society,” said Karen McKinnon, a postdoctoral researcher at NCAR and the lead author of the study.
The lead author should support thisclaim with data comparing deaths attributable to heat waves vs deaths attributable to fuel poverty during cold periods.
RG, you know full well she cannot. Asking warmunists to be honest and fact driven mightily upsets their safe places.
Of course. It is still worthwhile to point out egregious errors and omissions.
l don’t know about Pacific but there were often blocking highs over Atlantic/europe during the spring of 2012.
During much of March there was blocking highs over or near the UK. Giving us a very warm and dry month. But during April these highs moved into the northern or NW Atlantic giving the UK a cool wet April. Was there a blocking pattern over the mid Pacific during the spring of that year?.
How does a daytime max of between 90 and 100°F in Washington DC in late June (see second image in post) count as extreme weather?
I’d call that a typical summer day in DC.
It is a little early to be that warm, but definitely not unheard of. The summer of 1980 I was at a football camp in NW Maryland hills in June and the heat wave that year was buckling the pavement on the interstate. The radio news readers were all very happy because they had something to fill radio time with that wouldn’t risk their licenses (like some of the talk programs would in the days of the misnamed “Fairness Doctrine”.)
Their results are not correct. The ocean temperatures out there respond to the same planetary scale, atmospheric pattern that causes the heatwave. Correlation is not causation and it will offer no predictability.
” Their results are not correct. The ocean temperatures out there respond to the same planetary scale, atmospheric pattern that causes the heatwave. Correlation is not causation and it will offer no predictability.”
I live @N41, W81, what I see happening here is when the jet stream moves due to changes in ocean surface temps, it changes which side of the jet stream the surface air comes from, either warm tropical air out of the gulf, or cool dry Canadian air this is good for a swing of 10 to 20F.
Yes where the jet streams goes can make all the difference.
The weather in the UK in March of 2012 and 2013 is a tale of the difference in blocking highs. During March 2012 the blocking came up from the Azores. So pushing the jet stream northwards and allowing warm air from the mid Atlantic to flow over the UK. Giving us at times almost summer like weather.
But in March 2013 the blocking was just to the north of the UK. Which kept the jet stream well to the south of the UK. Which allowed cold air to flood down from the NE and give us one of the coldest March on record.
@taxed
This is good example of it shifting twice over head, which was good for a 10-20F swing in temps.
High dew point air is the tropical air, and the low dew point is Canadian air.
This leads me to think that it’s the heat the water vapor in the air mass that determines my outside temp, and me my location average temp is really defined by the ratio of tropical air vs Canadian air.
Co2 might raise the temps of the air masses by some fraction of a degree, but that isn’t why it’s been warm in NE Ohio the last few decades (on average), it’s warm because the ratio changed.
“At 30 days out or closer, the scientists were able to predict an increase in the odds—to better than 1 in 2 for a particularly well-formed pattern—that a heat wave would strike on a particular day.”
OK, not bad, but soil moisture content should be factored into the projection, because the drier the soil, the warmer the air above.
We get heatwaves here in Oklahoma when a high pressure system sits on top of us for weeks at a time, and as it sits there, the temperatures within the area covered by the high pressure system continue to climb and climb and the moisture in the atmosphere falls. The highest temperatures are located right at the center of the high pressure system.
During Fall and Winter, weather systems, highs and lows. travel from West to East across the United States in a fairly short time, a matter of days. But when summer rolls around that pattern starts to change and the progression from West to East slows down and a high pressure system eventually develops usually over the center of the nation.
On some occasions the high pressure center can shift to the East and sit *there*, and then the East gets the real high temperatures, for that year.
The East eventually gets the high temperatures anyway, as the high pressure system moves East over them, but the central part of the nation is where the high pressure likes to park itself during the summer, and where the temperatures usually get the hottest, as a result.
The slower the progression of weather systems from West to East, the hotter it is going to be underneath that slow moving high. This is a very regular, predictable weather pattern. I have seen it for years and years.
The difference between a normal hot summer and an extreme heatwave is the length that high pressure system sits on top of you. Sometimes it will sit there for a Long time.
I noticed that at least for a while, the warm blob in the pacific, had a high pressure zone over it, sort of makes sense, but also the jet stream went around it(north side I think), I would imagine it does the same over one of these high pressure systems, it also would not surprise me that once the jet stream is “pinned”, the jet stream also helps the zone to stay in one place, keeping it hot.
Things happen pretty much as you explained.
The jetstream that usually flows across the U.S., will move north and allow that high pressure center to build over the central U.S. The High Pressure system will also serve to block any potential storm fronts from entering it.
The jetstreams and their movements are the key to all of it.
And the “Pins” that define it’s path, at least for a while.
In Ohio this winter it was very mild from the El Nino, we got a lot of air out of the gulf, last winter the gulf air didn’t get this far North, we had a -22F morning, the ground froze over 2-2.5 foot deep. I built a wood shed the summer before last, and one of the post wasn’t quite the full 36″, and frost heave lifted it an inch or more up.
I think the coming La Nina is likely going to allow the jet stream to run further south this coming winter than the prior winter, I expect it to be pretty cold.
Another case of “discovering” what many old timers have known. And we didnt even need a grant.
Joe – they are going to put you out of business!
> And we didnt even need a grant.
Well go get one anyway. A climate guy without a grant is like a geologist without a rock hammer.
One of my favorite subjects: the oceans. I am one of those who believe that the oceans play the most important role in climate change, that climate is the continuation of the oceans by other means. I think that it’s very important to focus on the oceans, on the impact of our activities over the oceans, some of them influencing the climate in different ways, as presented here: http://oceansgovernclimate.com/.