From NSIDC:
Antarctic sea ice: an update
Antarctic sea ice extent continues to make headlines because it has grown even as much of the globe, and Antarctica itself, is warming. Arctic sea ice, in contrast, is showing a marked decline. Warmer air and ocean waters are bathing both poles, so why does the Antarctic sea ice trend resist decline?

On September 19, 2014, the five-day average of Antarctic sea ice extent reached a maximum record, exceeding 20 million square kilometers for the first time since 1979. The red line shows the average maximum extent from 1979-2014. Credit: NASA’s Scientific Visualization Studio/Cindy Starr
Despite what some might think, high ice extent in Antarctica does not balance out low ice extent in the Arctic. Antarctica is showing strong warming in other areas, and is experiencing the consequences of this warming, such as the dramatic breakups of ice shelves on the Antarctic Peninsula. Yet Antarctic sea ice extent has increased.
The very different geography of each pole is a large factor. The Arctic is a large body of water surrounded by land, while Antarctica is an icy landmass surrounded by ocean, meaning that the ways in which ocean waters, currents, and winds interact with sea ice are very different as well. But why is the Antarctic story less clear to scientists than the Arctic one?
Less land ice, more sea ice?
While scientists expected Arctic sea ice to respond strongly to warming, and knew that the poles might have different patterns of warming, they are still surprised that Antarctic sea ice has generally expanded. This has been especially perplexing to watch in 2012, 2013, and 2014, during which the Antarctic sea ice winter maximum extent set consecutive records.
For a time, researchers thought melt water might be a factor. Warming ocean waters are causing Antarctica’s ice sheets to flow more quickly and churn more ice into the ocean. This ice then melts into the surface water layer that Antarctic sea ice sits in. But this additional melt water is not large enough to explain the changes.
“The scale of the new freshwater input is small compared with snowfall or even rainfall in the Southern Ocean,” said Ted Scambos, senior research scientist at NSIDC. The Antarctic system has always experienced about 2,000 gigatons of melt annually, and the recent increases have only added about 150 gigatons. On top of that, the Southern Ocean annually receives about 20,000 to 40,000 gigatons of precipitation. “Yes, it is warmer, and more of the land ice is melting . . . but it’s not a big effect compared to the area and mass of the sea ice,” Scambos said.
So if more land ice melting is not a major influence on sea ice, what are scientists looking at now?
Gust in the wind

In October 2015, the ozone hole over Antarctica reached a record extent, expanding to 28.2 million square kilometers (10.9 million square miles). Purple and blue colors indicate the least ozone, and yellows and reds indicate more ozone. The lack of atmospheric ozone over Antarctica can lead to turbulent winds, which affect sea ice extent. Data are from the Ozone Monitoring Instrument aboard the NASA Aura satellite. Credit: NASA Ozone Watch
In a recent study, scientists focused on the Antarctic ozone hole. When ozone is present high in the atmosphere, it absorbs sunlight and warms the atmosphere. A large hole in the ozone layer over Antarctica chills the air high above the continent, and sets up a stronger westward circulation. This can drive stronger westerly winds even near the surface. Scientists Paul Holland and Ron Kwok found that under the right conditions, these winds tend to spread sea ice out, away from Antarctica, creating a larger overall extent.
Satellite evidence of the ozone hole dates to 1976, and this timeline matches changes in sea ice, according to Scambos. “There are several lines of evidence suggesting that sea ice was ‘different’ prior to the mid 1970s, and generally a lot more variable,” he said. Although research and models support the connection between ozone loss and sea ice growth in Antarctica, at least over the short term, scientists would like a longer time series. Older satellite data, from some of the first weather imagers ever launched, are being pressed into service again to investigate sea ice conditions in the early 1970s and even the 1960s.
Regional variability
Scientists are also investigating other climatic influences. “Individual areas of Antarctic sea ice are governed by different climate patterns, and each area has its own degree of variability,” Scambos said. “Looking at the different climate patterns and how they have played out over the past several years will be a key step to explaining what is going on.”

Antarctic sea ice, such as this ice covering the Bellingshausen Sea, has been growing in extent even as air and ocean temperatures rise. This photograph was taken during a NASA Operation IceBridge flight on October 13, 2012. Credit: M. Studinger/NASA
For instance, much of West Antarctica’s climate is influenced by the Amundsen Sea Low, a perennial weather system located over the adjacent Bellingshausen and Amundsen Seas. Researcher Marilyn Raphael and her colleagues published a study showing how the system affects wind and sea ice patterns across West Antarctica’s coasts. When the Amundsen Sea Low is strongest, sea ice extent along much of West Antarctica decreases while extent in the nearby Ross Sea increases; a weak phase results in the opposite effect in each sea. Other scientists are investigating how the ozone hole and El Niño patterns interact with the Amundsen Sea Low to induce changes in sea ice. Similarly complex variations influence sea ice extent in other regions around the continent.
Antarctica’s stubborn paradox has proven puzzling. As scientists learn more, they hope to understand what shapes Southern Ocean sea ice. “Five to ten years from now, I think we’ll still be seeing regional variability dominate any global climate change signal,” Scambos said. “We’ll know more about the drivers of regional trends, and also the history of sea ice in Antarctica,” he said. “But I don’t think we’ll see a climate-driven decline until late in the 21st century.”
References
Holland, P. R., and R. Kwok. 2012. Wind-driven trends in Antarctic sea-ice drift. Nature Geoscience, doi:10.1038/NGEO1627.
Raphael, M. N., G. J. Marshall, J. Turner, R. Fogt, D. Schneider, D. A. Dixon, J. S. Hosking, J. M. Jones, and W. R. Hobbs. 2015. The Amundsen Sea Low: Variability, change and impact on Antarctic climate. Bulletin of the American Meteorological Society, doi:10.1175/BAMS-D-14-00018.1.
“Sea ice.” NASA Earth Observatory. Accessed 11 January 2016.
Yeah, so in a super-dee-duper el nino year someone else noticed how fast antarctic sea ice crossed back above average.
I’d be worried too.
but it definitely needs more study.
yes, please turn up the flow on the money pipe from Washington DC, please.
This NSIDC article has more false statements in less time then your average Greenpeace advocate in less time. This one in the first paragraph stands out; ” Warmer air and ocean waters are bathing both poles.”
Sea Ice in Antarctica has likely grown because the southern oceans have cooled, not warmed. Everything else is fluff, based on a false premise.
See above comment. The article starts with a fib.
http://www.ospo.noaa.gov/data/sst/anomaly/2016/anomnight.3.24.2016.gif
but it is still all going to melt late in the 21st century .
David A:
Can I point out that the article mentions “waters”, and not “surface waters”.
The warming has occurred sub-surface.
http://onlinelibrary.wiley.com/doi/10.1002/2014GL060613/abstract
El Nino SST fading off fast now, water off Peru coast finally cooling and Humboldt current flow re-establishing.
NullSchool SST
Jan 12th 2016:
http://earth.nullschool.net/#2016/01/12/0000Z/ocean/surface/currents/overlay=sea_surface_temp_anomaly/orthographic=-112.53,0.12,325
Feb 12th 2016:
http://earth.nullschool.net/#2016/02/12/0000Z/ocean/surface/currents/overlay=sea_surface_temp_anomaly/orthographic=-112.53,0.12,325
March 12th 2016:
http://earth.nullschool.net/#2016/03/12/0000Z/ocean/surface/currents/overlay=sea_surface_temp_anomaly/orthographic=-112.53,0.12,325
March 24th 2016:
http://earth.nullschool.net/#2016/03/24/0000Z/ocean/surface/currents/overlay=sea_surface_temp_anomaly/orthographic=-112.53,0.12,325
Cheer up warmers! Global crisis averted! Hey, if you’re still warm and kicking in 15 to 20 years time you can try to foist another fake CO2 alarmism boogieman on us.
It may have to be global cooling due to CO2 next time. 🙂
No mention here of the subterranean magma under the western ice which us melting the underside of the glacier and dumping fresh water into the Amundsen Sea.
So the ozone hole is responsible for the increase in Antarctic sea ice? Well, why don’t we pump more CFC’s into the atmosphere so sea ice will continue increase? Would this type of geoengineering help mitigate the horrible, awful, terrible, repent for the end is nigh effects of globull warming? 🙂
Maybe I can get a government grant to study that. 🙂
CFCs were banned over 20 years ago. If the :”ozone hole” is still growing, then something else is responsible.
Most likely its the Birkeland Currents running from the south pole that have an effect on ozone. The Earth’s electro-magnetic field HAS been weakening after all….
it’s those evil frost flowers.. we need to study them and find a herbicide that can take them out.. for the children of course..
https://en.wikipedia.org/wiki/Frost_flower_%28sea_ice%29
The reek of cognitive dissonance is strong in the contortions NCIDC performs to bend the observations to the support the politically correct message.
Just looked at Arctic ice and it appears to have taken on a new lease of life. Very late in the season to still be increasing. Even longer than last year which was longer than the average. You can take a look:
http://nsidc.org/data/seaice_index/images/daily_images/N_stddev_timeseries.png
I’m not at all qualified to comment. Maybe someone here could explain what’s happening.
I’m no expert but it looks to me that it is cold and water is still freezing and becoming ice 😉
Appears it may record the margins of the early 2016 El Nino H2O thermal pulse and is now cooling further as the pulse drops away from high mid-latitudes?
Brilliant ! I think you cracked it .
Apply for a professorship in climate science. You are eminently over qualified.
Umnentionable
I think it takes a few years for an ENSO pulse of equatorial warm water to rorate round the Pacific Gyre and reach the Arctic.
Plus unless we vave a convincing La Nina I’m not sure how much of a warm water pulse there will be from 2016. A lot of the heat could just dissipate to space. Being a “Modoki” type el Nino, there was no real engagement if the Bjerknes feedback which pumps warm water poleward after big el Ninos like 1997-1999.
@ belousov March 26, 2016 at 12:22 am
See my reply here (I posted it on the incorrect reply link, appologies):
http://wattsupwiththat.com/2016/03/24/why-does-the-antarctic-sea-ice-trend-resist-decline/comment-page-1/#comment-2175089
15% ice is a highly variable parameter, easily affected by things other than temperature, such as wind and ocean currents. Arctic sea ice was about normal this year except in the Barents region, where unusually strong winds kept the ice more compacted than normal. Perhaps that has reversed or normalized.
Except that at this time of the year, most of the ice is 100% so there
is a much smaller region of 15% ice that can expand or contract
due to wind and sea currents. But, probably enough to cause
the small movement upward recently.
The details are here:
https://rclutz.wordpress.com/2016/03/24/arctic-panic-postponed/
BTW, MASIE dataset from the National Ice Center uses 40% threshold with 4km resolution.
Stunning ice growth in the Arctic yesterday
https://rclutz.wordpress.com/2016/03/25/arctic-upset-alert-march-25/
It seems to me that many of the years this century are making peak ice 2-3 weeks later than the 1981-2000 average.
i seem to remember someone telling me in here it is not cooler winters we need to worry about, but shorter summers . the arctic alarmists better cross their fingers for an indian arctic summer this year.
There is basically a ZERO trend in Arctic sea ice in the last 10 years.
http://realclimatescience.com/wp-content/uploads/2016/03/Screenshot-2016-03-18-at-02.04.51-PM.png
AndyG55
Which data set did you use? NSIDC data shows a continued decline in Arctic sea ice since 2006 (-0.43 million km^2 per decade): http://www.woodfortrees.org/plot/nsidc-seaice-n/from:2006/plot/nsidc-seaice-n/from:2006/trend
cryosphere.. use ALL data, not just the peaks
start from 2006 peak and go to 2016 peak.. trend is POSITIVE 0.0069 Million km² /year
http://arctic.atmos.uiuc.edu/cryosphere/timeseries.anom.1979-2008
A ZERO trend in Arctic sea ice in the last 10 years? Wow!
How do you then explain THAT curve set?
http://polarportal.dk/fileadmin/polarportal/sea/SICE_curve_extent_LA_EN_20160326.png
Bindidon
You do realize that the “zero trend” over any time length is for Arctic sea ice anomalies, don’t you? (You are showing a short period (<5 years) plot of actual sea ice areas, NOT anomlaies – the difference between each day's amount and the established long-term average for that date.)
http://arctic.atmos.uiuc.edu/cryosphere/IMAGES/seaice.anomaly.arctic.png
Overall, you are also incorrect in criticizing the quoted lines : The Arctic sea ice anomaly slowly decreased from its (first-ever satellite high ) at +0.75 Mkm^2 in 1979 when the satellite record began down to zero 20 years later in 1996-1997. After that decline, the arctic sea ice anomaly decreased slightly faster from 1997 through 2006, but -as stated – the arctic sea ice anomaly has NOT changed since 2006-2007. It has oscillated around -1.0 Mkm^2 since 2006-2007 – the ten year period quoted.
And maybe you manage to look at this graph:
http://ocean.dmi.dk/arctic/icecover_30y.uk.php
Bindidon:
And THAT graphic – showing the September monthly value from 1979 through 2015 – shows EXACTLY the same thing you previously (and incorrectly) criticisized. A slow decline from 1979 to 1997, and sharper decline 1997-2006, then a near-steady 10 year period from 2006 through 2015.
Oh. By the way. You do realize that through the period of September’s arctic sea ice minimum extents, there is not enough sunlight across the edge of the arctic sea ice to heat the water substantially, don’t you?
That more heat is lost from each sq meter of sea surface by evaporation, convection and conduction across September that is absorbed from the ever-diminishing sunlight?
That less arctic sea ice ANY day between 1 September and late March seven months later means a cooler Arctic Ocean and a cooler planet?
Oh sorry, RACookPE1978!
I forgot that some people love to explain sea ice rising and temperature cooling for periods as small as possible… simply because they mostly don’t know that the shorter the period, the higher the statistic uncertainty of the computed trend 🙂
A trend over SIX years… what does that mean? That’s the same exercise as if you would try to obtain the temperature trend for RSS3.3 from 2009 till today: 0.139 ±0.747 °C/decade.
That gives you an uncertainty level nearly six times bigger than the trend it is associated to 🙂
And by the way, it’s nice to teach me about trends, but wouldn’t be more fruitful to have a closer look at this danish plot?
You might then discover that there is a twelve month bar on which you may walk with the mouse pointer. And you will see that the trend isn’t valid for september only… look at march!
If the Arctic sea ice extents anomaly is cyclic with a 30 year period, then – Yes! – A six year interval of steady (non-decreasing) sea ice anomalies IS significant. As is a slight decline from a maximum to near-zero, and subsequent decline to a minimum, that may begin increasing back towards what is assumed the assumed nominal “zero anomaly.” We don’t know enough to make a claim for periodicity. Yet.
Now, tell me again why we should fear a negative arctic sea ice anomaly between 2 September and 2 April? Less sea ice means a cooler planet during that period.
More Antarctic sea ice means a cooler planet every month of the year but June and July.
But I don’t fear cooling, RACookPE1978!
Planet warming means for us in Western Europe more and more ice loss on the Greenland inlandsis, and that possibly might result in increasing amounts of unsalted water in the north west Atlantic, what in turn possibly might result in a Gulf Stream shift down to Africa, with huge consequences like siberian winters in France and even in Spain.
Non merci!
Bindidon
So, enforcing economic penalties, artificially high energy costs, and deliberate energy scarities that WILL cause harm to billions each year every year for the next 85 years, and kill millions each year with deliberate poor health, bad water supplies, no transportation, no lights, no power, no refrigeration, no food havesting and storage and shipping and packaging, no sewage treatment, no rails, bridges, or roadways, less irrigation as they starve to death in squalor huddling over dung-fed open fires in huts IS a “mandatory thing” to be enforced. A fate that MUST be created by YOUR fears, but a deadly fate for millions to attempt to reduce CO2 increases that will NOT measurably affect the future global average temperatures by a degree. But your projection of Greenland ice mass loss assumes temperature changes of tens of degrees over a period lasting for nearly 1000 years. But, even then, today’s geology cannot produce the Gulf Stream changes you assume.
Because you fear an imaginary future of imaginary harm extrapolated from a time of glacial ice 5000 feet high over Chicago. Hint: Chicago may be covered in piles of many things supported by many politicians across Chicago for their power and benefit – But 5000 feet of ice is not there. There IS no mass of ice capable of causing that flow.
Oh. By the way. In June 2014, just the “excess” sea ice reflecting heat from the planet around Antarctica was larger than the surface area of Greenland. And nobody noticed. Because it did not fit your narrative, your chosen faith of Luddite-polluted death and misery.
AndyG55, I downloaded that stuff and put all these 13600 records into Excel. I agree: you are right, the trend from Jan 2006 till Dec 2015 is with 0.07 Mkm²/dec really flat.
But… can you tell me why you keep such attention to the one end while leaving the other unmentioned? I run with two time windows over the data, one of 5, one of 10 years, building the trend for each.
And I was not at all surprised to discover that both 1979-1988 and 1980-1999 give us a trend of 0.09/dec.
Is that “unmentionable” ?
What I mean here you can perfectly grasp when you look at
http://psc.apl.uw.edu/wordpress/wp-content/uploads/schweiger/ice_volume/BPIOMASIceVolumeAnomalyCurrentV2.1.png
where volume loss is plotted rather than that of surface (imho by far more relevant: what does an increase of 0.5 Mio km² mean, if it’s no more than 20 cm thick).
You see in this PIOMAS plot a volume increase between 1981 and 1986 which is quite similar to that between 2011 and 2016.
Don’t misunderstand me: I would enjoy all ice on earth keeping as it was 50 years ago.
Sorry: in the comment above one should read: ‘1980-1989’.
[snip – Hunt has been warned repeatedly that his comments and link bombing are not welcome here -mod]
@ belousov March 26, 2016 at 12:22 am
___
I don’t refer to gyre circulation here, I mean warm humid air circulation south to high mid latitude.
The sea ice forms from already cold water that has even colder air above it, that extracts more heat out of the water surface layer, thus triggering ocean surface freezing.
If the air above is instead warmer than the ocean water, then the water surface is not chilled further, it will be very slightly warmed, and sea ice will not form.
The warmer and more humid than normal air from the southern tropics during the thermal El Nino pulse release of water vapor can move south to both warm and trap IR near the surface for longer, thus impacting ice formation rate, slowing it, or even slightly melting it.
That effect take just a few days to occur.
Actually, except for a short time in July, the heat is flowing from the water to the air, not the other way around, and mostly it is latent heat, which is how water freezes. See the graph here:
https://rclutz.wordpress.com/2016/02/10/arctic-not-a-refrigerator/
Imho it is quite a bit early to make assumptions about the extent’s near future.
A simple look at
http://polarportal.dk/fileadmin/polarportal/sea/SICE_curve_extent_LA_EN_20160326.png
might convince you.
Look at the red curve (2012), how it moved up in april as if it would cut the 1979-2000 mean, and where it landed in september 🙂
@ Ron ClutzMarch 27, 2016 at 11:05 am
Don’t confuse theory with observation Ron, during El Ninos the wind patterns thoroughly alter, just look at the observed patterns at that time, from 1st of Feb, 2016.
Feb 1st 2016 sea level winds
http://earth.nullschool.net/#2016/02/01/0000Z/wind/surface/level/orthographic=-139.12,-28.27,325
Feb 1st 2016 700 hPa winds (10,000 ft)
http://earth.nullschool.net/#2016/02/01/0000Z/wind/isobaric/700hPa/orthographic=-139.12,-28.27,325
Feb 1st 2016 Sea level Total Perceptible water
http://earth.nullschool.net/#2016/02/01/0000Z/wind/surface/level/overlay=total_precipitable_water/orthographic=-139.12,-28.27,325
Feb 1st 2016 sea level temp
http://earth.nullschool.net/#2016/02/01/0000Z/wind/surface/level/overlay=temp/orthographic=-139.12,-28.27,325
Polar view Feb 1st 2016 sea level temp from south pole view:
http://earth.nullschool.net/#2016/02/01/0000Z/wind/surface/level/overlay=temp/orthographic=-135.07,-87.08,198
Polar view Feb 1st 2016 Sea level Total Perceptible water
http://earth.nullschool.net/#2016/02/01/0000Z/wind/surface/level/overlay=total_precipitable_water/orthographic=-135.07,-87.08,198
So it’s undeniable that warmer than freezing and also more humid air, was mixing in, between -60S to -70S latitudes, at levels between surface and 10k ft from early February 2016.
Corresponding to the pattern shown in the ice formation being depressed:
http://nsidc.org/data/seaice_index/images/daily_images/N_stddev_timeseries.png
In fact I think this just established that, that is what occurred to Antarctic ice growth, during February 2016.
Feb 2016 response:
http://nsidc.org/data/seaice_index/images/s_anom_hires.png
http://nsidc.org/data/seaice_index/images/n_anom.png
http://nsidc.org/arcticseaicenews/files/2016/03/Figure4_updated.png
Yes unmentionable, you show a bunch of links to Antarctic observations, than tack on an Arctic graph at the end? Arctic temps are still way below freezing, and any warmer air circulating into the area goes immediately up into space.
And yet, this article ends with a stunning statement…
“Five to ten years from now, I think we’ll still be seeing regional variability dominate any global climate change signal,” Scambos said. “We’ll know more about the drivers of regional trends, and also the history of sea ice in Antarctica,” he said. “But I don’t think we’ll see a climate-driven decline until late in the 21st century.”
What’s this…no climate- driven decline yet? Gasp!
Its obviously climate change.
So, in other words, there are still lots of unknown unknowns !!
It’s hard to adjust unknowns
Its the bipolar seesaw in action, negative feedback.
“Warmer air and ocean waters are bathing both poles,”
These people are admirably forthright in confessing that they do not understand what’s going on.
They do reveal a disconcertingly idiosyncratic concept of the South Pole when they declare that it is bathed in warmer air and warmer water.
Perhaps, they have not yet attended the McKibben & Nye course in “Science Communication” and so they don’t realize just how startling this news of the flooding of Antarctica is to people that don’t live there. It wasn’t that long ago that the South Pole was at least 1,300 km away from any seawater.
Nobody predicted that the melting of Antarctic ice would flood that continent without first inundating New York.
They do leave us wondering, also, when they say “warmer”, what it’s warmer than. Surely, water that is warmer than it was previously is not likely now to be frozen.
Bingo, the southern oceans have been cooling. He lied.
Lying requires some mental effort.
I suspect this is bullshit as defined by Frankfurt (2005, 2016). It’s not that it would be untrue, it could be true in some sense, it’s just that the author didn’t care as long as it sounded good.
This is some kind of confused fantasy. Warm air moving over warm water does not create more ice. Water at the ice edge will always be approximately 32 to 33 F. Air temperatures must be low enough to extract heat from the water faster than water from below or farther out can warm it. These people are in denial of some very basic physics.
maybe because the “warm” air is still well below freezing … morons …
Well it’s a frag warmer than the coldest on record to date perhaps, so could be referred to as ‘warmer air’, if you wanted to make it seem as though Antarctica was defrosting instead of undergoing a paradoxical deep freeze that countered with frost-bite evidence everything you’d been claiming for 25 years or so.
I wonder if they’ve begun repairing the summer blizzard induced damage to the hull of the Aurora Australis yet? Maybe they should go down there in winter, as it’s apparently warmer then?
Yeah, and then maybe they should go and set up a sun-lounger and body-board business on the Antarctic Peninsula, because it’s gonna be so damn hot.
But, I won’t be investing… 🙂
Is that the ship that got stuck in warm water?
If 5 or 10 years from now Antarctic sea ice is in retreat and Arctic sea is expanding will The Team claim the southern depletion is due to global warming while the northern expansion is an irrelevant mystery?
+ 10
There is no doubt you are right. But, we have not yet seen an Arctic recovery, just a slowdown in some metrics.
Since 2007, there has been essentially “no change” in Arctic sea ice area anomalies – OR sea ice extents anomalies! The Arctic has been oscillating about -1.0 Mkm^2 for 8 years. The Arctic anomaly has NOT been getting larger, NOT been getting smaller (closer to zero) NOR has it been getting larger.
On the other hand, the Antarctic sea ice anomaly has been increasing since 1992. For the past 11 years, it has exceeded 1.0 Mkm^2, and has been regularly setting new record highs. In May-June_July 2014, the Antarctic sea ice anomaly (at 2.16 Mkm^2) by itself has been GREATER than the entire area of Greenland!
Yes, there have been many repeats of “winds blow the sea ice out (away from the coast) and Global Warming is the increasing Antarctic winds.”
But. Show us the measured data establishing these excuses (er, reasons). Show us the steadily increasing off-shore winds since 1992. Show us the original wind speeds and directions in 1979 through 1992, then the increased wind the past 18 years. Never has been done. May exist. But it has never been shown in public. Only speculated, waved-handed, and used as a throw-away excuse.
In 2015, the Antarctic sea ice anomaly rapidly decreased from +1.2 Mkm^2 down to zero, and remained at zero from September 2015 through March 2016.
Now. If the “winds are increasing” excuse is valid, then “obviously” those winds deceased to near zero in September 2015, and have remained near zero since then. Right? And the off-shore Antarctic winds decreased to near-zero the past 6 months because the Antarctic air temperature anomaly suddenly decreased from its 18 year old “Global Warming High” to its latest 6-month-long “back-to-average” 1850-1976 average, right?
So, what is their “new” excuse?
I really don’t see a statistically significant change in the long term trend yet. If you say there is no change from 2007, then it just becomes “really large change” just before 2007. There are always some random fluctuations, so we haven’t seen anything yet.
If you believe the trend will oscillate, you have possibility to wait for 5-10 years so that it becomes a significant deviation from the linear trend.
Not just a slow down, a ZERO trend since 2006, ..
…exactly what you would expect as the AMO goes through its turning point.
Next….. Arctic sea ice expansion over the next decade or so.
and won’t the AGW scammers be bleating then !!!
http://realclimatescience.com/wp-content/uploads/2016/03/Screenshot-2016-03-18-at-02.04.51-PM.png
“While scientists expected Arctic sea ice to respond strongly to warming…”
The sea ice decline was far faster than supposedly expected, while their models say that more CO2 will increase positive AO/NAO. Increased positive AO/NAO cools the Arctic (and AMO), as we saw mildly 2013/14, and strongly in the mid 1970’s.
http://www.ipcc.ch/publications_and_data/ar4/wg1/en/ch10s10-3-5-6.html
Arctic (and AMO) warming since the mid 1990’s was driven by increased negative NAO, and Arctic and Antarctic sea ice extent diverged from then. Antarctic sea ice extent trend since 1995 is an effective direct indicator of climate forcing levels, and the Arctic sea ice extent trend since 1995 is the inverse. Arctic warming is a negative feedback to reduced forcing of the climate, with -NAO driven increase in atmospheric humidity events into the Arctic, and increased Atlantic flow into the Arctic Ocean during -NAO driven low AMOC events. The warm AMO causes further surface warming effects globally, with drying of continental regions, and lowering atmospheric water vapour altitude. I think it’s largely down to effects of solar wind strength on atmospheric teleconnections:
http://snag.gy/PrMAr.jpg
“Antarctic sea ice extent continues to make headlines because it has grown even as much of the globe, and Antarctica itself, is warming …”.
=================================
Not according to HadCRUT4 it’s not:
http://www.climate4you.com/images/70-90S%20MonthlyAnomaly%20Since2000.gif
Diagram showing area weighted Antarctic (70-90oS) monthly surface air temperature anomalies (HadCRUT4) since January 2000, in relation to the WMO normal period 1961-1990. The thin blue line shows the monthly temperature anomaly, while the thicker red line shows the running 37 month (c.3 yr) average. Last month shown: February 2016. Last diagram update: 6 March 2016 (climate4you).
Chris,
Yes, as a frequent visitor to the WUWT Sea Ice page, I was taken aback by that same statement as well.
Your point is also supported by RSS Southern Polar Temperature Lower Troposphere (TLT) – 1979 to Present
ftp://ftp.ssmi.com/msu/graphics/tlt/plots/rss_ts_channel_tlt_southern%20polar_land_and_sea_v03_3.png
And UAH SoPol …….. NOT WARMING !!!!
http://s19.postimg.org/5ezsuxp9v/UAH_So_Pol.png
And didn’t NASA just say that Antarctic ice mass is presently increasing?
http://wattsupwiththat.com/2015/11/05/yet-another-study-shows-antarctica-gaining-ice-mass-accumulation-highest-we-have-seen-in-the-last-300-years/
Can’t these jokers get their stories straight? If they were a gang of criminals, they couldn’t lie their way out of a jail sentence. Oh, wait…
As Prof Humlum points out at climate4you because of the dryness of the air at the poles that is where any CO2 warming should be most obvious: “… an important enhanced greenhouse surface ‘fingerprint’ is usually considered to be enhanced warming in the polar and sub-polar regions, less warming in the tropics and sub-tropics, and least warming in equatorial regions”.
Good post Chris, so the article was wrong about claiming warmer southern ocean SST (They have cooled) Wrong about claiming the air T has increased. (It has not) Wrong about claiming greater runoff from Antarctica. (Instead it is gaining ice) and discounted the fact that CO2 is supposedly more effective in dry areas.
This is a cleverly written study. They know all of the indicators are not trending toward support for global warming in the Antarctic. My takeaway was it forced them to move the goal posts forward in that no big change will occur until the end of the 21st century. That’s a big move of 75+ years if IIRC.
Chris, Interesting chart. It looks like there is a 3 year temperature change cycle of 0.25c C indicated in it
Antarctic sea ice is pretty average at the moment, so what are the mechanisms to increase extent this SH winter?
http://sunshinehours.net/2016/03/23/sea-ice-extent-global-antarctic-and-arctic-day-82-2016/antarctic_sea_ice_extent_zoomed_2016_day_82_1981-2010/
Post nino cooling and relaxed vortex, more southerly winds and spreading ice.
Let’s check the claim from the Rapahel et al. 2015 paper. Here is their abstract:
A climatological low pressure center means a statistical entity, just like the Azores Anticyclone or the Icelandic Depression. Sure statistically one find more high or low pressure in this area but on the synoptic scale it is not the same meteorological object through time, but a succession of polar air masses descending down and their associated depressions, which satellite observation perfectly individualize and can be mapped. http://www.dwd.de/DE/leistungen/satellit_goes13/satellit_goes13.html?nn=16102
Hence , this reference to THE ASL is truly funny especially when they tried to explain climatic changes invoking meteorological evolution…
Rather than saying the ASL has been deepening in recent decades, it would be truer to the synoptic reality to say like Leroux does that the number of depressions below 980 hPa affecting this region is rising while these depressions are getting deeper. From 1950 to 2000, this evolution was the result of more powerful polar air masses reaching lower latitudes, having more meridian trajectories and thus advecting an increasing quantity of warmer air along the reliefs of the western Antarctica Peninsula.
Thus the warming of the peninsula is a dynamic consequence of the expulsion of colder polar air masses and their associated deeper depressions…
One has to smile at the cart-before-the-horses reasoning here that would see tropical variability control polar air expulsions… Notwithstanding the funnier, seasonal “response to GHGs concentration increases”.
Once again this willful rejection of reality, through the use of a statistical entity instead of using the succession of synoptic objects to explain the meteorological changes leading to the climate evolution observed in a region is one of the tricks to keep the CAGW alive.
It’s of course Raphael et al. 2015…
Living in Australia I check Antarctica on a daily basis.
The word ‘awesome’ has been degraded by over use.
But Antarctica fills me with awe.
Antarctic temps at 60-70 deg S (which is mostly ocean around antarctica) have been FALLING since the start of record.
http://data.remss.com/msu/graphics/TLT/plots/RSS_TS_channel_TLT_Southern%20Polar_Land_And_Sea_v03_3.png
Another graph from Chris Hanley above, shows HADCRUT temps to be near average over the record, while the Jan 2016 temps are BELOW average.
So how do they state that temps are INCREASING?
Easy, it is called “lying”.
Maybe they have been looking at the graph upside down.
I kinda like the deep purple section of the visualization… It reinforces my understanding of the chill….
http://earth.nullschool.net/#current/wind/surface/level/overlay=temp/orthographic=-2.15,-89.28,1218/loc=97.042,-79.479
Alston the extent of the very cold winds is helpful, too.
Water temperatures are also falling around Antarctica.
http://notrickszone.com/2015/07/08/south-polar-ice-age-stations-show-dramatic-antarctic-peninsula-cooling-since-1998-sea-ice-surge/#sthash.mP75e9gC.k1lizoGK.dpbs
http://notrickszone.com/wp-content/uploads/2015/07/Sea-temp-60-70%C2%B0S-300×119.jpg
UAH has the South Polar region cooling for the whole record. See ?w=450
Nice chart, but… what is the scientific relation between TLT (0-8km) and the surfaces?
Look at these 2 pictures you can easily find on Roy Spencer’s blog:
http://www.drroyspencer.com/wp-content/uploads/UAH-LT-vs-CFSv2-Tsfc-Feb-2016-2.jpg
Above you see UAH6.0beta5 data, below you see the NCEP CFSv2 data by Ryan Maue at WeatherBell.com (2m above surfaces).
Do you see the huge differences at the poles (60-90N, 60-90S) ?
And I don’t think that Roy Spencer would ever have published a surface temp chart he wouldn’t trust in!
For Antarctica the NSIDC forgot this paper: http://onlinelibrary.wiley.com/doi/10.1002/2015GL066749/full . It’s the CO2 what leads to cooling at the pole. The higher parts of Antarctica can’t warm due to GHG.
It follows then that the projected sea level rise which is attributed to icecap melt is groundless fear mongering.
Interesting, particularly as at Vostok there is no carbon dioxide in the atmosphere, as it is too cold.
There is carbon dioxide in the atmosphere at Vostok, and water vapour too (admittedly not much)
Experiment aims to get rid of warm bias.
“It’s brand new research and the reason we need to do it is that many climate models have a warm bias in the sea surface temperatures over the Southern Ocean and the reason they have this bias is believed to be due to the wrong sorts of clouds in the models,” Dr Alexander said.
‘John Bally, the regional director of the Bureau of Meteorology, said research like this had not been done in this region of the world.’
ABC News
Trying to keep your job eh , come on just beg like a normal person I’ve seen your science and so it can’t be beneath you to do a bit of grovelling and ass kissing to keep your useless job .
May I suggest another occupation that utilises your skill set to perfection “Fortune teller” all you need is a govt grant for the crystal ball or borrow one from BOM , I hear they have 350 odd spare !
[??? .mod]
I did post this link a couple of days ago.
I only just recently found this paper from Schneider and co-conspirators.
It’s an attempt to reconstruct Antarctic temps from 1800.
The graph that they produce does NOT seem to indicate an overall warming trend.
But then the authors seem to have rejected the evidence of their sense and determined that their findings support an assumption that Antarctica will warm along with the rest of the world.
Anyway, please look at this for me and let me know if you can see how the finding might justify the conclusion. It’s weird.
http://faculty.washington.edu/steig/papers/recent/SchneiderSteigGRL2006.pdf
Weird is right.
Again, for me you have to look at the graphs upside down to reach that conclusion.
But even if they are right, they are talking about a rise of 0.6 of a degree.
That leaves the temperature still a long way below freezing, and so far I am unaware of any circumstance where water melts when below freezing temperature at normal atmospheric pressure.
Hardly any part t of Antarctica went above 0˚C this SUMMER!
And yet they repeat the ‘rapidly warming lie’.
Here in Australia after an unusually cool spring and early summer, a late warm spell triggered the Warmist PR machine and we were bombarded with messages of Thermageddon. Now that it’s gone cool again, they’ve moved quickly on to the Great Barrier Reef and the coral bleaching…it’s bloody relentless!
“Although research and models support the connection between ozone loss and sea ice growth in Antarctica,…” It is as well to remember that the so-called loss’ is because the ozone has been pushed out to the periphery, as can be seen by its increase on the Oct 2015 image in the paper. By January, that peripheral increase has flowed back into the ‘hole’.
The cult of CAGW idiots have no idea what caused the cyclic warming and cooling in the paleo record. The same idiots hence have no idea what caused the warming in the last 200 years. The majority of the warming in the last 150 years has caused by solar cycle changes, not the increase in atmospheric CO2.
The sudden increase in Antarctic sea was caused by the abrupt change in the solar cycle. The very recent sudden increase in solar wind bursts from weird super large coronal holes temporary halted the cooling. The solar coronal holes are starting to dissipate and/or move to high latitude regions on sun where they no longer affect the earth’s climate which explains why there is now high latitude cooling
http://www.ospo.noaa.gov/data/sst/anomaly/2016/anomnight.3.24.2016.gif
P.S. Everything in past happened for a physical reason. When all of the observations are examined as a whole the solution pops out.
In the Northern hemisphere there was an electrical charge imbalanced based phenomenon that caused the blocking highs that caused the temporary warm blob in the Northern Pacific ocean. The electrical charge imbalanced base mechanism explains why there is an eleven year delay in the reduction in the solar cycle and the onset of cooling of the Northern hemisphere in the paleo record.
http://arctic.atmos.uiuc.edu/cryosphere/IMAGES/seaice.anomaly.antarctic.png
Analysis of ice core paleo data in this paper “Does the current global warming signal reflect a natural cycle” shows there have been 342 warming events in the high latitude southern hemisphere. The periodicity of the warming period in the Southern hemisphere is the same as the periodicity of the warming events in the Northern hemisphere. The magnitude of the recent warming event is less than the average of past larger warming events.
The average duration of the 342 warming events in the last 250,000 years is 149 years. Based on that the duration of the current warming event is roughly 200 years, based on the fact that there has suddenly been a weird change to the sun, based on the fact there are solar cycle changes at 23 of the last cyclic warming and cooling events, and based on the fact there is suddenly weird high latitude cooling: supports the assertion that global warming is over and the idiot cult of CAGW will need to explain the unexplained in your face cooling.
http://wattsupwiththat.files.wordpress.com/2012/09/davis-and-taylor-wuwt-submission.pdf
and Antarctica itself, is warming
I stopped reading there!
https://notalotofpeopleknowthat.wordpress.com/2016/02/16/the-antarctic-climate-card/
I wonder how much of it is because they have not found a way, not got around to adjusting the sea ice record record yet like they have changed every other dataset.
Antarctic land temp records, for example, are managed by the UK Met Office which has not shown the propensity to adjust records the way the NCDC has. The focus has been on quality control up-front rather than quality control after the fact / making up adjustment algorithms afterward like the NCDC has done.
Even something like the earlier Ocean SST records were managed by the Met. They appear to have been careful about it even in regards to the infamous bucket adjustment. They literally ran scientific tests all over the world to measure the impact. Now NCDC runs the oceans SST data measurement and they adjust accurate bouy measurements to match inaccurate ship engine intakes. Not too many ship engine intake measurements in the southern ocean around Antarctica given all that ice. Whenever the NCDC comes up with something new, it is to move data toward what the theory expects. They just have less influence around Antarctica.
Four comments.
1.dispersed sea ice extent does show a positive trend in the antarctic but if you take concentration into account this trend becomes much less impressive and likely has no meaningful interpretation beyond random natural variability..
2. an ozone “hole” is not an area with no ozone but with total ozone less than an arbitrary value of 200 DU.
usually, not much less than 200 DU. compare that with the seasonal cycle of mean global total ozone that goes from about 250 DU in the northern winter to 300 DU in the northern summer.
3. the ozone hole over artarctica is a seasonal phenomenon. it forms in the southern spring months of october and november and its extent varies greatly from year to year. there is no ozone hole over antarctica in the southern winter months of june, july, august, or september or in the southern summer months of january, february, march, or april.
4. the importance and relevance of the ozone hole in terms of ozone depletion has been greatly exaggerated. mean global ozone does not show any meaningful trend in total ozone.
Here are some links for the details to support these statements
http://papers.ssrn.com/sol3/papers.cfm?abstract_id=2598152
http://papers.ssrn.com/sol3/papers.cfm?abstract_id=2748016
http://papers.ssrn.com/sol3/papers.cfm?abstract_id=2719537
http://papers.ssrn.com/sol3/papers.cfm?abstract_id=2613333
What is the support for your first statement regarding SHSI concentration?
the concentration data are presented in the paper and also included in the online data archive provided with the paper
How do they have the temerity to say that “warmer air and water are bathing both poles”, (note the suggestive language ‘bathing’), when for the Antarctic the opposite is true?
So climate science is waking up to the fact that changes to the weather patterns longer term have a far more important effect on climate then CO2.
Well who would have thought it!.
The science is settled.
Excerpted from above commentary:
DUH, the only thing Holland and Kwok got correct n the above was their last sentence about the down-slope “winds spreading sea ice out”.
I have at least two thoughts on this, probably more. Antarctica has warmed, gone from what, -60 to -58? You expect melt? when you start looking for a correlation between two things, such as the ozone hole, and ice extent change, you tend to see what you are looking for. You are not actually trying to “discover” through research, you are trying to prove your preconceived belief, and since you are trying to make a “superhero” out of yourself, you will overlook or ignore that which would actually give you enlightenment as to the true relationship, if there is one. If you are looking for “red” in everything, you will see that reddish orange as a form of red and ignore that there is yellow there as well.
Today, so called “climate scientists” are not practicing science, they are practicing selective vision, seeing only what they are looking for, and blinding themselves to the processes that affect what they are researching that doesn’t fit with their preconceived belief set. They are not objective about what they are doing since it would require an open mind and a willingness to “suffer” the “art” of pure science, which is discovery for the joy of discovery, and not a pathway to wealth.
if you only offer grants to look for warming, well we cannot expect people to find anything but warming, even when there is cooling.
Hasn’t the claim that Antarctica is warming been debunked?
Data .. UAH.. South Pole is NOT WARMING
http://s19.postimg.org/gr1vmngvn/UAH_South_P.png
There is a crucial difference between “S Pole” and “Antarctica”.
Just as there is a difference between the Globe (as in AGW) and the USA (2% of the globe).
UAH gives the best data there is for the Antarctica.. (and coincides well with RSS)
NSIDC started with TWO BIG FAT LIES in the first sentence or so. ..
“Antarctica itself, is warming. Arctic sea ice, in contrast, is showing a marked decline.”
The Antarctic IS NOT WARMING… and Arctic sea ice has had ZERO TREND for the last 10 years.
.
Not only isn’t it warming, it’s slowly cooling off after it had slowly warmed up, until the 1970s, but cooling down slowly and steadily ever since.

From oz4caster:
Almost forgot, note that after the 1998 El Nino’s cooling down phase, as elevated atmospheric water vapor precipitated out (thus reducing the heating caused by elevated H20 in the atmosphere which causes the greenhouse warming that’s the real cause of the ‘thermal pulses’ associated with El Ninos), Antarctica’s cooling became much more pronounced.
So … what if it did that … again … hmm?
As I posted to David A up-thread …. it is the “waters” around Antarctica that are warming – sub-surface of SST’s.
False claims don’t cut it, data we have says this:
From:
“South Polar Ice Age: Stations Show “Dramatic” Antarctic Peninsula Cooling Since 1998, Sea Ice Surge”
http://notrickszone.com/2015/07/08/south-polar-ice-age-stations-show-dramatic-antarctic-peninsula-cooling-since-1998-sea-ice-surge/
“0 – 100m ocean temperature plummeting:
Sea temp 60 – 70°S
http://notrickszone.com/wp-content/uploads/2015/07/Sea-temp-60-70%C2%B0S-300×119.jpg
Figure 1 is the upper 100 meters of ocean south of 60°S. There’s been a rapid cooling since about 2007. Negative numbers are used to select latitudes in the Southern Hemisphere. The source is KNMI, link.
Sea ice skyrockets…
SH Sea Ice Extent
http://notrickszone.com/wp-content/uploads/2015/07/Sea-Temp-and-Ice-plot-300×173.jpg
Figure 2 is the Southern Hemisphere sea ice area anomaly. The source is KNMI, link.”
Unmentionable:
Could you explain the 0-100m sea temp anomaly graph please ?
You say it’s for 60-70 deg S
But on the graph it says at the top 60-70N ?
Also the link back to it at KNMI is broken.
Also, this is the current state of SH sea-ice anomaly…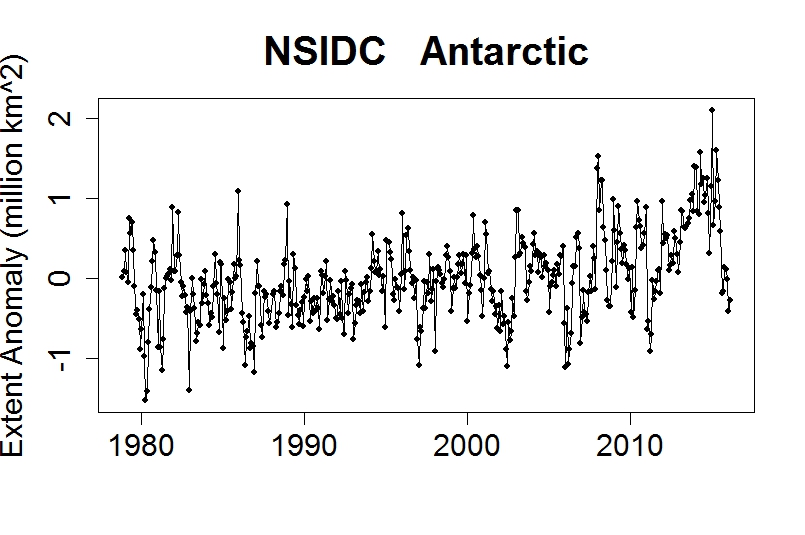
“Also, this is the current state of SH sea-ice anomaly…”
Very obvious upwards trend.. Thanks.
“But on the graph it says at the top 60-70N ?”
Its hard to see, but there is a negative in front of that lot.
Silly way of doing it because its not obvious to less aware person, but graph is correct for 60-70S.
Toneb March 26, 2016 at 12:17 am
As I posted to David A up-thread …. it is the “waters” around Antarctica that are warming – sub-surface of SST’s.
Toneb March 26, 2016 at 10:50 am
Also, this is the current state of SH sea-ice anomaly…
___
‘Toneb’,
Your claim has been refuted, rather than quibble or insinuate the graph is for the northern hemisphere, how about you attempt to substantiate your claim?
“… it is the “waters” around Antarctica that are warming – sub-surface of SST’s. …”,
Are you even going to attempt to substantiate that with data?
{I note you recently (thrice) dodged direct questions and request to substantiate your other unsupported claim about CO2 rise inducing thermal rise in the atmosphere, but that claim is also unsupported by carefully calibrated ground-based IR astronomical instrument’s IR noise delta, over time, from hundreds of professional instruments looking through the atmosphere every night, and don’t measure any noticeable IR change from continuous CO2 rise, even in the 18 year hiatus, where it rose the strongest. One would think you’d be interested in this fact, or rather, disinterested – but apparently not. http://wattsupwiththat.com/2016/03/16/alarmism-cranked-up-to-absurd-level/#comment-2167565 … confirmation bias much?}
I’m afraid you forget to mention that in fact you mention Antarctic’s eastern part… Western Antarctic is warming quite a lot and looses ice since years. Even the totally misunderstood paper of Jay Zwally (and above all the NASA post referring to it) mentions that fact.
http://www.nasa.gov/feature/goddard/nasa-study-mass-gains-of-antarctic-ice-sheet-greater-than-losses
Bindidon March 27, 2016 at 1:34 pm
First, what does that have to do with the topic of actually cooling subsurface waters, from depth of 0 to 100 m, between -60S and -70 South latitude?
Nothing right? Nice deflection. But your own link’s title negates your imputed alarmism about there being a problem with east Antarctic ice ‘melting’, as the title reads:
“NASA Study: Mass Gains of Antarctic Ice Sheet Greater than Losses” Oct. 31, 2015
Gains greater than losses! This is a warming problem, in your view? Maybe the grid data is not given as it’s not a good look?
Antarctica is undergoing a NET rise in ice growth on both land, and sea, at present. Several graphs posted above bear this out, in various ways as measured fact. You understand this means net transfer of water from ocean and atmosphere to ice sheet, on land, right? That Antarctica is NET freezing up and that the steady trend is to slowly conditions since the beginning of the 1980s?
Looks like CO2 does like Antarctica or the southern ocean? Maybe the earth is not so simple as the IPCC aggregated CO2 consensus dross, and its totally useless allegedly ‘climate’ modeling, hmm?
‘ Gains greater than losses! ‘ That’s all?
You remember me french people commenting articles in their newspaper ‘Le Figaro’.
These folks you can separate into two disjunct subsets: those who read articles, and those who comment solely on the base of the articles’ title.
You seem to belong to the latter subset I guess. Have you ever read that NASA page from start to end?
“We’re essentially in agreement with other studies that show an increase in ice discharge in the Antarctic Peninsula and the Thwaites and Pine Island region of West Antarctica,” said Jay Zwally, a glaciologist with NASA Goddard Space Flight Center in Greenbelt, Maryland, and lead author of the study, which was published on Oct. 30 in the Journal of Glaciology. “Our main disagreement is for East Antarctica and the interior of West Antarctica – there, we see an ice gain that exceeds the losses in the other areas.” Zwally added that his team “measured small height changes over large areas, as well as the large changes observed over smaller areas.”
And a few cm below:
But it might only take a few decades for Antarctica’s growth to reverse, according to Zwally. “If the losses of the Antarctic Peninsula and parts of West Antarctica continue to increase at the same rate they’ve been increasing for the last two decades, the losses will catch up with the long-term gain in East Antarctica in 20 or 30 years — I don’t think there will be enough snowfall increase to offset these losses.”
Last not least:
Zwally said that while other scientists have assumed that the gains in elevation seen in East Antarctica are due to recent increases in snow accumulation, his team used meteorological data beginning in 1979 to show that the snowfall in East Antarctica actually decreased by 11 billion tons per year during both the ERS and ICESat periods.
Thus yes: actually everything looks fine for East Antarctic. In 2018 we’ll know more.
P.S.
(1) ‘You understand this means net transfer of water from ocean and atmosphere to ice sheet, on land, right?’
Any paper clearly confirming that?
(2) Who did mention CO2 and IPCC?
Since the “ozone hole” allows more UV radiation to reach the troposphere does the oxygen and nitrogen absorb and thermalize it near the surface? If so Antarctica should receive more Spring heat.
As a psychology major I didn’t realize I would someday wish I remembered what the Physics Prof said.
Radiation, troposphere, polar winter?
John H,
the “ozone hole” DOES NOT allow more UV radiation to reach anything anywhere.
The only reason there is a per se “ozone hole” is the fact that the UV radiation is not entering the atmosphere above Antarctica during the 6 months of wintertime “darkness” because of the tilt of the earth’s axis. The UV creates the ozone, ….. the lack of UV permits the “hole” to form
Not at all, the ozone hole forms in the Antarctic spring when UV returns to the stratosphere above antarctica, during the darkness in the winter the ozone remains approximately constant.
Through August this winter O3 over the pole was about 250 Dobson with a minimum stratospheric temperature of 179K, as the air started to warm the O3 declined to 101 Dobson on Oct 4th.
Clearly the hole forms in sunlight not in darkness!
http://ozonewatch.gsfc.nasa.gov
Sam, thanks, but the hole is in Spring, not Winter. Short days, but days then. What happens to the extra UV that gets through the Stratosphere? Is it absorbed by O2, N2, liquid water or does it just bounce back to space?
Phil, your miseducation of/on the creation and distribution of atmospheric ozone can be “fixed” (re-nurtured) ….. but only if you choose to recognize and accept the factual science as noted below, to wit:
And John H, the per se “ozone hole is in Spring” is also explained in the following.
And pay special attention to the BOLD text because it is of utmost importance.
Ya’ll have a better day tomorrow. Cheers
Samuel C Cogar March 27, 2016 at 5:43 am
Phil, your miseducation of/on the creation and distribution of atmospheric ozone can be “fixed” (re-nurtured) ….. but only if you choose to recognize and accept the factual science as noted below, to wit:
The material you posted has absolutely nothing to do with the formation of the ‘ozone hole’, which is caused by the springtime UV over the pole.
Phil, Solar generated UV is never “over” the pole, ….. either pole, ….. springtime or otherwise.
The closest the Sun’s UV gets to being “over the pole” is the Tropic of Cancer and/or Capricorn.
http://www.solsticebahamas.com/images/Tropic.jpg
Samuel C Cogar March 28, 2016 at 6:09 am
Phil, Solar generated UV is never “over” the pole, ….. either pole, ….. springtime or otherwise.
The closest the Sun’s UV gets to being “over the pole” is the Tropic of Cancer and/or Capricorn.
You have some very strange ideas!
And yet UV is measured on an hourly basis at the S pole.
In fact the Dobsonmeter which is used to measure the total Ozone over the Pole does so by measuring solar UV at two wavelengths there, according to you that is impossible!
When a person uses the word “strange” as an adjective in the context of the above statement …… it highly infers that said person is utterly ignorant about the subject matter that said “ideas” are in reference to.
Samuel C Cogar March 29, 2016 at 5:28 am
You have some very strange ideas!
When a person uses the word “strange” as an adjective in the context of the above statement …… it highly infers that said person is utterly ignorant about the subject matter that said “ideas” are in reference to.
The person who states that the Sun doesn’t shine over the poles is the one who is ‘utterly ignorant’ about the subject. Describing it as a strange idea is a rather mild response.
Phil,
Your “approximately constant,” is actually a slow decline in ozone. While the photo-catalyzed destruction of ozone ramps up with the arrival of sunlight in the early-Spring, it should be noted that it is the presence of the Antarctic polar vortex that blocks ozone from lower latitudes that allows low levels to be reached. Typically, there are regions of high ozone outside the vortex. When the polar vortex breaks up, the air is able to move into the so-called ‘hole’ and restore ‘normal’ conditions. What is going on is creation and destruction simultaneously. It is the polar vortex that unbalances the two processes. One should also note that the early-Spring sunlight has a long slant range and passes through normal ozone concentrations for much of what arrives. Rayleigh scattering also plays a role in the distribution of UV. The ‘hole’ is much less of a danger than is usually claimed.
All that jargon and such, Ice doesn’t melt if it is not warm enough, they are trying to say it’s warm yet ice is not melting.
No matter how convoluted you make it, Ice doesn’t form in a warm environment.
Anyone here want to try creating ice from water from warming the air?
Sometimes the simple answer is the right one. The warming is not where the ice is.
2015 sea ice above 1979 levels, “declining”?
Antarctica is NOT warming. The northern peninsula of Antarctica [4% of total area) is warming. The interior is as cold as ever.
Is it only me or does the actual pole of cold seem to coincide with the magnetic pole? It certainly seems to do so at present in the northern hemisphere? Is this a temporary thing? Or just a temporary coincidence? The magnetic pole moves around pretty quickly…
Almost all ozone (99+%) is caused by Solar EUV. The great climate change is now on; Solar EUV has crashed to 85 sfu [remember, minimum is about 65 sfu; max is about 250 sfu]. It will remain low until the next Solar Cycle peak [Solar Cycle 25] in about 10 years.
Solar EUV measured by the proxy on Earth at Penticton, Canada, is a great indication of Solar Energy reaching the Earth.
SFU:
1) 65 to 100 sfu -> Earth temperature cooling
2) 100 to 120 sfu -> Earth temperature constant
3) 120 up -> Earth temperature warming.
Now we will see what climate change is really about!!
Not true, EUV is below 100nm which is not a major player in ozone production (there’s not much of it anyway). The major production of O3 is in the range 240-160 nm, UV-C.
In any case the Sun produces almost all ozone!
And Lightening “flashes” …. or “flashes” of lightening, …. also create great amounts of ozone.
‘ Why does the Antarctic sea ice trend resist decline? ‘
Wrong question I guess… Better would be to ask:
Why should the Antarctic sea ice trend not resist decline?
Antarctic sea ice gets bigger and bigger around Antarctic’s Eastern part, which is the coldest place on earth with -37 °C average temp.
This repeated discussion about sea ice imho hides the fact that Western Antarctic and the Peninsula really experience warming.
In the UAH6.0betax datasets, we can see that inbetween they fully cover the poles:
http://vortex.nsstc.uah.edu/data/msu/v6.0beta/tlt/uahncdc_lt_6.0beta5.txt
NoPol 60N-90N, SoPol 90S-60S
Isn’t it time for UAH to publish, like Japan’s JMA does for its surface data, a monthly grid of 72×36 cells helping us in better differentiating where it cools and where it warms in the polar regions?
“Antarctica is showing strong warming in other areas, and is experiencing the consequences of this warming, such as the dramatic breakups of ice shelves on the Antarctic Peninsula”… which is on the Pacific Ring of Fire…..
Anomalous hot spots in the ocean, 3 C warmer along this coast indicate one thing to me, and it isn’t CO2.
Why is sea ice increasing? Because increasing ice accumulation on land (which is cooling) is feeding the sea ice or the sea ice isn’t melting as fast (because its cooling).
Either way its cooling.