From NSF and the 66 million year old mud department comes yet another hockey stick making proxy. So far, the reliability of proxies has been questionable at best, and it seems to me they found exactly what they expected to find. They are using climate models to estimate lead/lag times, so the obvious question is, what models and how good are they? They also don’t seem to have an SI with data that I was able to find on the journal page, so verifying the work might be difficult, if not impossible. Here’s a graphic showing the Paleocene–Eocene Thermal Maximum (PETM) for reference:

Humans responsible for carbon release 10 times faster than any event since age of dinosaurs
The earliest measurements of Earth’s climate using thermometers and other tools start in the 1850s.
To look further back in time, scientists investigate air bubbles trapped in ice cores, expanding the scope of climate records to nearly a million years. But to study Earth’s history over millions of years, researchers examine the chemical and biological signatures in deep-sea sediments.
New research published today in the journalNature Geoscience by geoscientist Richard Zeebe of the University of Hawai’i at Manoa and colleagues looks at changes in Earth’s temperature and atmospheric carbon dioxide (CO2) since the end of the age of the dinosaurs. The evidence is in sediment cores retrieved from beneath the seafloor by geologists working aboard the ocean drillship JOIDES Resolution.
“In studying one of the most dramatic episodes of global change since the dinosaurs, the researchers show that we are currently in uncharted territory in the rate carbon is being released into the atmosphere and oceans,” said Candace Major, program director in the National Science Foundation (NSF) Division of Ocean Sciences, which funded the research.
The findings suggest that humans are responsible for releasing carbon about 10 times faster than during any time in the past 66 million years.
The research team developed a new approach and was able to determine the duration of the onset of an important past climate event, the Paleocene-Eocene Thermal Maximum (PETM), 56 million years ago.
“As far as we know, the PETM had the largest carbon release during the past 66 million years,” Zeebe said.
Zeebe and co-authors Andy Ridgwell, of the University of Bristol and University of California, and James Zachos, of the University of California, combined analyses of chemical properties of sediment cores dating back to the PETM with numerical simulations of Earth’s climate and carbon cycle.
The new method allowed them to extract rates of change from a sediment record.
Applied to the PETM, they calculated how fast the carbon was released, how fast Earth’s surface warmed, and what constrained the time scale of the onset, which was across 4,000 years.
The rate of carbon release during the PETM was much smaller than the current input of carbon to the atmosphere from human activities.
Carbon release rates from human sources reached a record high in 2014 of about 37 billion metric tons of CO2. The researchers estimated that the maximum sustained carbon release rate during the PETM was less than four billion metric tons of CO2 per year — about one-tenth the current rate.
“Because our carbon release rate is unprecedented over such a long time period in Earth’s history, it also means that we have effectively entered a ‘no-analogue’ state,” said Zeebe. “This represents a big challenge for projecting future climate change because we have no good comparison from the past.”
Whereas large climate transitions in the past may have been relatively smooth, there is no guarantee for the future, the scientists said. The climate system is non-linear, which means that its response to inputs, such as CO2 emissions, is a complex process involving multiple components.
“If you kick a system very fast, it usually responds differently than if you nudge it slowly but steadily,” Zeebe said. “It is likely that future disruptions of ecosystems will exceed the relatively limited extinctions observed at the PETM.”
The PETM suggests that the consequences of our massive burning of fossil fuels will have much longer-lasting effects, said Zeebe.
“Everyone is focused on what happens by 2100, but that’s only two generations from today,” he said. “It’s very clear that over a longer time scale there will be much bigger changes.”
The scientists are continuing their work on the PETM to study other aspects of the event — for example, determining how severe ocean acidification was during that time and what effect it had on calcifying organisms in the ocean. The results will provide insights about what to expect in the future as Earth’s climate likely continues to warm and oceans keep acidifying.
###
Anthropogenic carbon release rate unprecedented during the past 66 million years
Richard E. Zeebe, Andy Ridgwell & James C. Zachos
Abstract
Carbon release rates from anthropogenic sources reached a record high of ~10 Pg C yr−1 in 2014. Geologic analogues from past transient climate changes could provide invaluable constraints on the response of the climate system to such perturbations, but only if the associated carbon release rates can be reliably reconstructed. The Palaeocene–Eocene Thermal Maximum (PETM) is known at present to have the highest carbon release rates of the past 66 million years, but robust estimates of the initial rate and onset duration are hindered by uncertainties in age models. Here we introduce a new method to extract rates of change from a sedimentary record based on the relative timing of climate and carbon cycle changes, without the need for an age model. We apply this method to stable carbon and oxygen isotope records from the New Jersey shelf using time-series analysis and carbon cycle–climate modelling. We calculate that the initial carbon release during the onset of the PETM occurred over at least 4,000 years. This constrains the maximum sustained PETM carbon release rate to less than 1.1 Pg C yr−1. We conclude that, given currently available records, the present anthropogenic carbon release rate is unprecedented during the past 66 million years. We suggest that such a ‘no-analogue’ state represents a fundamental challenge in constraining future climate projections. Also, future ecosystem disruptions are likely to exceed the relatively limited extinctions observed at the PETM.

Determining the minimum release time.
Maximum lead/lag is based on data records (τdat) and model time lag (τmod) calculated using carbon cycle/climate models GENIE (ref. 12) and LOSCAR (refs 29,30), see text. The intercept of the shortest τmod and τdat yields the minimum onset
http://www.nature.com/ngeo/journal/vaop/ncurrent/full/ngeo2681.html
Surprise, surprise: digging up and burning billions of tons of carbon that took millions of years to bury will rapidly increase atmospheric CO2.
There’s no natural mechanism that can release this much CO2 this quickly, which is why it’s unusual.
..Volcanoes, forest fires, giant meteor hits !
It’d have to be pretty impressive forest fires to keep the forests from regrowing. So they’d have to be worldwide, year after year.
Meteor strikes: plausible, if in great enough numbers and if they repeatedly hit the areas where coal was buried underground. But really, then you’re talking about enough meteors to destroy mountain ranges. That hasn’t happened for billions of years.
Volcanoes? Don’t emit anywhere near as much CO2 as humans. At least, presently, they emit about 2% of the CO2 as human civilization.
And don’t forget human volcanoes, they charge you for CO2 on the way in and on the way out, but lets get back to facts, and forget about political sharks.
My girlfriend is so beautiful, drop dead gorgeous actually, incredibly intelligent, She’s at university for three years now and works in labs, she’s left minded as in caring and sensible when it comes to science, and because she’s in the medical profession she’s very conservative with engineering precision.
If I told her about all this “climate science” stuff she would do that cute thing where she looks at me and says something like “baby… do you want me to make the bad climate science people go away?”
So I’m just back from telling her… it was awesome!! produced lots of CO2, you guys need to get a life lol
Windchaser March 22, 2016 at 1:06 pm
“… Volcanoes? Don’t emit anywhere near as much CO2 as humans. At least, presently, they emit about 2% of the CO2 as human civilization. …”
—
LINKS please.
Heres my first link on the subject.
http://www.scientificamerican.com/article/earthtalks-volcanoes-or-humans/
But it’s pretty obvious from the increasing CO2 concentration.
I meant an actual paper, like this:
http://volcanoes.usgs.gov/vsc/file_mngr/file-154/Gerlach-2011-EOS_AGU.pdf
“LINKS please.”
http://hvo.wr.usgs.gov/volcanowatch/archive/2007/07_02_15.html
Also just examine the CO2 keeling curves that are available.
Do you see any evidence of huge spikes after a notable volcanic eruption … say like Pinatubo?
http://www.planetforlife.com/images/keeling2.gif
http://geography.about.com/od/globalproblemsandissues/a/pinatubo.htm
Actually, there is, and it is thought to have caused the Permian extinction. Siberian traps are a massive flood basalt event. Not only volcanic CO2 for at least 40,000 years, but ignited the massive Siberian coal seams there. The resulting distinctive coal fly ash is found in Fossil Chinese lake sediments dated to the event geologically.
Right. And that was 250 million years ago.
So: that was pretty unusual, too.
And then there are the Deccan Traps, associated with the Cretaceous extinction (possibly caused by the Chixlub impact, possibly independent).
Well rather than discussing diverse possible causes and ages, let’s just look at the graphics presented by the authors and their readings of them.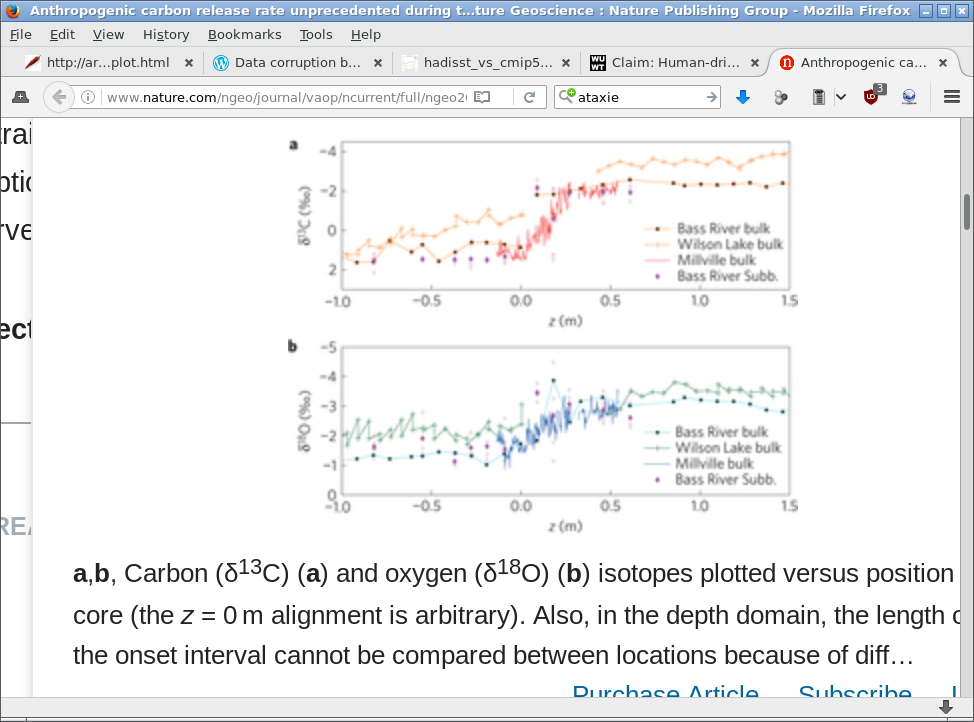


Firstly the event they analyse goes from 0.15 to 0.4m in their mud core. That’s 35cm of mud or just over one foot, to which they attribute a period of 4000 years.
I don’t know how thin they can slice their salami but it looks like they got about 100 data points in that period. Of course since the journal provided awefully blurred previews and the authors provide no data we are guessing but that means that they have data intervals of the order of 50y. So the first problem is that they are comparing annual changes from 2015 human emissions to a 50y climate record. That Marcat et al all over again. Apple meet orange …
The second problem is that they are averaging the whole 4000y transition, finding the average rate of change and still comparing it to annual human emissions. Apple meet box of oranges….
Now if we look at their graph around 0.3m level there is a very large step change. This is also refplected in their dO18 record so it appears to be a climate event not a glitch in the dC13 data.
The size of that step change is about half the magnitude of the 4000y rise… in one data interval. On the basis of 100 data points, that rate of change is 50x their average for the whole period. So if they calculate that recent human emissions are about 10x faster then the average 4000y rise that event at 0.3m was about 5 time faster than current emissions. t
So the fundamental claim of the paper that this is “unprecedented” and that we are in “uncharted” territory is totally contrary to what their data actually shows.
I’m tempted to call this unprecedented BS. but sadly it’s not. This is the same as Marotzke & Forster 2015, who derived a graph showing that the rate of change of temp in models divided into two groups for the most recent period. ( End of their fig 3b below).
They claimed that there was no “trace” that more sensitive models were producing a greater divergence but when their analysis showed there were in fact two groups they failed to notice and failed to identify whether these were those with a higher sensitivity.
I suppose that the deminsted mental factulites of these “scientists” could be but shown to be correlated with the rising level of emissions. More funding will be needed to research this issue further.
The idea that a spike of CO2 caused the Permian event is debatable. The Permian based on the best available information (e.g. Geocarb III) by and large resembled the present. That is, it was quite cold (the only cooler periods being the “Snowball Earth” period during the Archaeozoic, and possibly the present. The atmosphere was also severely depleted of CO2 compared to the earlier periods of the Paleozoic just as the present is severely depleted compared to the peak values of the Mesozoic. The Paleozoic is the geological epoch when most coal and oil was deposited. That means that the biological component of the environment withdrew carbon from the atmosphere much faster than natural, non-biological emissions could replace it.
The current available carbon levels are just barely keeping even with the withdrawal rates caused by sequestration processes which bury organic matter or leave on the ocean floor. Satellite imagery has demonstrated that during the last decades desert areas have significantly “greened,” supporting more vegetation than present at the beginning of the satellite era. The best explanation offered has been that additional carbon is the reason. Evidence from the late Pleistocene suggests that the planet was considerably drier and dustier compared to the present. While the common explanation for why Permian geology exhibits such extensive evidence of continental deserts is that the shear scale of the Pangaia landmass created extreme continental climate conditions in the interior of the continent, the similarity between that period and the present also allows for the argument that depleted reserves of biologically available carbon were at least partially to blame, especially considering the satellite evidence of increased plant life in arid regions at present.
Complete f*****g HorseHockey. C.O.M.P.L.E.T.E.
Nobody even KNOWS how much CO2 the oceans take in and let out each year.
The SLOP – the PART man KNOWS he doesn’t KNOW – is BIGGER than ALL MANKIND’S CO2 emissions COMBINED.
The yearly uptake of plants worldwide is prodigious next to all mankind’s production.
The bombastic perception that using fire for a – couple hundred years is even a DENT in CO2
is why the people teaching you this low grade perception are eager school standards don’t rise.
So you can be shown how to put the collar and lock around your own neck, then be left alone without worry you’re going to do any actual thinking.
Exactly. I was thinking only a fool rushes to defend the indefensible. You beat me to it. He couldn’t have been more wrong if he was a plant by real scientists, to get people to examine the global warming scam’s stunningly unscientific basis.
Here’s a quick ”is he even sane?” check on Windchaser’s understanding of what’s discussed here:
Windchaser
you are chasing really the wind, can’t help your self can you.
First rule of thumb in what you may call science…..long term data of million of year with a perhaps a resolution of millennia scale can not be compared with very short term data of around a century with a year scale resolution or at most decadal, really incompatible for any analyses unless deception and conning considered.
So please consider the rubbish you rely on with your claims
It really means nothing at all…unless you are a die hard AGWer, in which case it will be the very needed shot for you addiction……
Excellent point.
Aren’t emissions <1/20th of natural sources now?
Haven't the Chinese admitted that carbon accounting is a bit of a joke?
http://joannenova.com.au/2015/08/carbon-accounting-error-reduces-chinas-emissions-tally-by-twice-australias-entire-output/
Is the resolution of these proxies really 4 000 years (the depth for the 60M years analysis is 2.5 m so about .04mm per 1000 years)? Even if true, you don't know that the larger release of CO2 didn't happen over 10 times shorter period and so still bigger than the recent release.
And we are all aware how models are tweaked with little revision unless it gives an unwanted result.
This is exactly correct and the authors absolutely knew they were doing an end run around the truth. That’s why they his behind the “as far as we can tell” caveat. They abuse the truth like they’re lawyers.
About 250 Myr ago, the Siberia Traps volcano shield formation released an estimated 30,000 to 40,000 billion tons of CO2 (versus annual release of 30 to 40 billion tons by modern humans). Changed the atmospheric CO2 from an estimated 2000 to 8000 ppm.
@ Windchaser
Climate Fail.
Natural mechanisms release more CO2 than this, every single year.
Over five times as much as humans do.
Do you never think to check your facts before writing?
leo,
Nature takes more than its own release back, every single year. So its net contribution to the rise of CO2 is negative…
“There’s no natural mechanism that can release this much CO2 this quickly, which is why it’s unusual.”
Meaningless hyperbole
The ocean exchanges multiple times our yearly output per year alone, without soil respiration and things like Termites which also outproduce humanity 10 fold.
Stop lying, dear lord, another clown
See any article on the Siberian Traps for an example of CO2 release that dwarfs any possible human efforts.
How about the sub-continent of India breaking off Antarctica and drifting north to slam into Asia, raising the world’s highest mountains? Did that make any sort of blip in their graphs?
How about the island of Guam capsizing?
Very funny. But I’m not talking about the blink of an eye. I’m talking about continental drift, and the fact that the collision of India with Asia is “fast” in geological terms, and all the carbon along coastlines had to get crunched, exposed, and released.
There is a big fashion among health food junkies to use pink Himalayan salt, which was thrust up by the collision. (I know about it because my daughter is always experimenting on me.) There are also jewels up in those mountains. And fossil sea shells. But you never hear anything about the oil and gas deposits. Where do you suppose they went?
I’m no authority. I’m just curious as to whether there is any sort of blip in the graph.
Actually it “broke off” Africa. Madagascar is one the fragments left behind.
Another interesting note is that India’s “broken-off” side, that I assume wouldn’t have had much of a continental shelf, swung around and was the side that rammed into Asia, which I would assume did have an ancient continental shelf loaded with deposits of fossil fuels.
I am basically full of questions about the collision, for I have never found a study about the resultant geology (perhaps because so much of it is now uplifted above 20,000 feet.)
. Volcanoes: we do not even remotely have a clue as to how many active volcanoes there are under the surface of the worlds oceans.
. Forest fires: if you do not live in a region where extensive fires occur, you’ve no idea how much mass a forest gives up in smoke.
. Other unaccounted for natural sources – and there are a lot.
Then of course there is the fact that all “fossil carbon” carbon started out in the atmosphere, was fixed by plants and buried by geological processes (well there may be some abiogenic oil around, but the available evidence doesn’t support that there is very much). Evidence from mass extinction events – the Permian is the most striking – and interludes shows that the planetary “natural” sources – volcanoes, etc., – cannot keep pace with the rate at which plants fix carbon and are then buried before the carbon can return to circulation. More importantly, following the Permian event, the planetary free carbon recovery during the late Triassic (IIRC) only reached a level about half that present at the beginning of the Phanerozoic, and has been steadily declining since. If you doubt this, look up Geocarb III and some basic historical geology texts.
The LONG term effects of life on this planet are extinctions, unless carbon is returned to circulate – which permits green plants to continue employing carbon and water to fix solar energy. Also, humanity IS a “natural” mechanism for freeing carbon and dropping its energy state to where plants can once again use it, unless of course you imagine that humans are “unnatural” in some fashion, which begs so many, many questions.
News flash.
There weren’t any humans 66 million years ago.
But just a minor snag to the thesis.
G
…Humans were releasing CO2 66 million years ago ?? These people really should be locked up in a looney bin, for their own safety and ours !
Exactly.
Paging the 66 million year old man….
Now what was the name of those recurring lava fields that apparently nearly gassed life on earth??
The precision of these claims is directly comparable to ,”Just make stuff up”.
….and take away the keys to their SUVs!!!
There must have been times in Earth’s history where the “carbon release rate” was negative. Cambrian era, perhaps?
Throughout most of the Phanerozoic the net carbon flux has been negative.
Except that it isn’t possible to directly compare atmospheric measurements with ice core measurements because it takes many decades before snow compacts into its separate layers from which encapsulated CO2 can be extracted. Major oops.
“Except that it isn’t possible to directly compare atmospheric measurements with ice core measurements because it takes many decades before snow compacts into its separate layers from which encapsulated CO2 can be extracted. Major oops.”
Indeed – I concur that that is a “major oops” ….
From:
http://phys.org/news/2016-03-human-carbon-unprecedented-million-years.html?utm_source=menu&utm_medium=link&utm_campaign=item-menu
Zeebe and co-authors Andy Ridgwell (University of Bristol/ University of California) and James Zachos (University of California) combined analyses of chemical properties of PETM sediment cores with numerical simulations of Earth’s climate and carbon cycle. Their new method allows them to extract rates of change from a sediment record without the need for an actual sediment age model. Applied to the PETM, they calculated how fast the carbon was released, how fast Earth’s surface warmed, and constrained the time scale of the onset, which was at least 4,000 years.
Would be passing strange if they had discovered ice that was 10’s of millions of years old, as ….
“The oldest continuous ice core records to date extend 123,000 years in Greenland and 800,000 years in Antarctica.”
https://www.bas.ac.uk/data/our-data/publication/ice-cores-and-climate-change/
Yes, Toneb, the proxy comes from 2.5 m of sediment. The CO2 levels were 1600±20ppm (at least) then and 4000 years corresponds to 0.16mm of sediment. CO2 levels “are” rising at 2ppm/year at the moment so that means they based the conclusion on a measure of 0.1% of the maximum response with a >1% uncertainty, in <0.2mm of sediment (using a model designed by a shill).
I'm a little more difficult to convince.
How does your point speak to my comment? I stated that current measured atmospheric CO2 emission rates cannot be tacked onto encapsulated CO2 ice core measurements to extend the ice core record to the current date, and that this comment of mine has nothing to do with models?
If you wish to reply to my comment, reply to it and stay on topic. If you wish to add something new and unrelated to my comment choose another reply button, not mine.
Toneb when you’re doing Michael Mann’s shoes,
do you ever look over his shoulder to see him tweet to little boys that he has a Nobel Prize just like Jerry Sanduski’?
“Toneb when you’re doing Michael Mann’s shoes,”
Bless – If all else fails denigrate the messenger eh?
““Toneb when you’re doing Michael Mann’s shoes,”
Bless – If all else fails denigrate the messenger eh?
”
Willfully ignores his idol is a proven liar and delusional and utterly egotistical.
“Willfully ignores his idol is a proven liar and delusional and utterly egotistical.”
QED.
PS: That’ll like “his Lordship” then.
Do you understand that it’s possible to express contempt for you without expecting that to speak to your argument at all?
On this point I agree with Tony. If you have criticism of Tony’s comment to my comment, speak to that. Otherwise take your off-topic ad homonym comments off my reply button. They are not valued by me in the least.
The most evident problem in the explanation offered in Tony’s link is that it refers to a carbon “cycle.” Carbon with one significant exception in geological history follows a declining pattern. The “cycle,” if that is what you want to call it, leaks. The paper doesn’t address the full spectrum of information concerning carbon and carbon “cycles” available in the geological record. The PETM is not comparable with the present. The end of the Permian is. The end of Permian was the termination of a long decline in available carbon, and experienced atmospheric carbon and temperatures similar to the present. Following the Permian atmospheric carbon recovered to roughly half early Phanerozoic levels before beginning the second long slide toward the present extremely low levels. The PETM is about midway down that decline. If the authors had attempted to compare the carbon recovery following the Permian extinction with the present it might actually mean something. Otherwise the article merely appears to be an excuse to use the word “unprecedented.”
And just how recent is the top end of that 800,000 year old continuous ice core ??
g
Pamela,
Depends of the snow accumulation rate. The Law Dome ice cores have an ice equivalent snow accumulation of ~1.2 meters/year and are fully closed after 40 years, where the average gas age is only 7 years older than in the atmosphere with an average distribution of around 10 years. If you compare the CO2 in the bubbles with direct measurements at the South Pole, there is a nice overlap of ~20 years (1960-1980):
http://www.ferdinand-engelbeen.be/klimaat/klim_img/law_dome_overlap.jpg
Then you have a lot of different ice cores with different accumulation rates, which overlap each other, all showing similar CO2 levels for similar average age, going back to 800,000 years, be it with decreasing resolution, the longer the time span covered. Despite that, the current increase of CO2 over the past 160 years would be visible in every ice core, even the ones with the worst resolution…
Thanks for the reply. Interesting indeed. You will like the following article.
https://www.researchgate.net/profile/Theo_Jenk/publication/260722324_A_revised_1000_year_atmospheric_13C-CO2_record_from_Law_Dome_and_South_Pole_Antarctica/links/02e7e53abd1c7e027b000000.pdf
In addition, Dr. Spencer did some pretty amazing analysis that I have yet to see more fully explored. If C13 is going down because of increasing anthropogenic emissions, it should demonstrate a steady fall relative to increasing CO2. However, when detrended, the measured ups and downs of both isotopes follows an interesting path that appears related to SST and the ENSO drivers of SST.
http://wattsupwiththat.com/2008/01/28/spencer-pt2-more-co2-peculiarities-the-c13c12-isotope-ratio/
Yep, and it’s the rapid rise in temps due to the rapid rise in C02…ain’t no time for adaptation at this rate.
..OMG !!!….. 1 degree in 100 years…I’m melllllting !!!!!
Can’t let this go by. CO2 being the cause of temperature rise is an assumption not fact. Correlation does not equate to causation. Causation cannot be established because the methods used to arrive at CO2 causing any temperature rise cannot be verified and are thus worthless against the null hypothesis of natural variation.
“Can’t let this go by. CO2 being the cause of temperature rise is an assumption not fact. ”
Instead of hand-waving – you could actually investigate why that statement is wrong.
If you wish to enlighten yourself this is a good place to start….
https://www.aip.org/history/climate/co2.htm
Toneb needs to remember papers are not facts in theoretical fields, they are best guesses
“Toneb needs to remember papers are not facts in theoretical fields, they are best guesses”
Mark needs to remember that there are guess and “best” guesses.
The scientific veracity of the GHE due to anthro CO2 is (according to the IPCC AR5)….
“It is extremely likely [95 percent confidence] more than half of the observed increase in global average surface temperature from 1951 to 2010 was caused by the anthropogenic increase in greenhouse gas concentrations and other anthropogenic forcings together.”
Which is taken in science as more or less certain.
BTW: even relativity is not 100% certain – and nothing in life is – we just have to go with what is “reasonable” just like in a court of law too.
First point: CO2 as a driver is a model, which is neither a fact nor evidence for or against an AGW hypothesis. A model is designed to test an observation’s inner workings. Current models have well-known limitations WRT CO2 being the primary driver, something Tony is well aware of.
Second point: Because the models test a future scenario, we cannot currently take them to be evidence that we have figured this all out. For good or ill, we must wait for quite some time after Tony and the rest of us have passed on from old age.
Toneb says:
Instead of hand-waving…
The entire CO2=DAGW conjecture is based on hand waving. All of it.
Wake me when you can produce an empirical, testable measurement quantifying AGW. Because so far, all you’ve done is wave your hands.
And please, enough with the stupid appeal to the IPCC’s ‘authority’. They’re a bought and paid for clique of propagandists, and anyone who takes their pronouncements at face value is a credulous fool.
dbstealey:
“Toneb says:
Instead of hand-waving…
The entire CO2=DAGW conjecture is based on hand waving. All of it.”
I would suggest that thousands of research scientists coming to the same conclusion based on observation/measurement and applying empirical science known of for ~150 years (GHE theory) is very far from “hand-waving”.
There is a utility called “Google scholar”
And there you will find much “anti-hand-waving” (to coin a phrase).
That you do not look for it does not mean it is not there my friend.
Toneb,
“Hand waving” was in response to your reply to Pierre D M, who wrote: CO2 being the cause of temperature rise is an assumption not fact.
You labeled that “hand waving”. But in fact, it’s the truth. CO2=GW is an assumption. A conjecture. An opinion (which I happen to agree with).
But until someone produces empirical, testable measurements quantifying that conjecture, it will remain a conjecture. It becomes a hypothesis when it is able to make repeated, accurate predictions — something in common with all hypotheses, theories, and laws. They all must be capable of making accurate predictions.
CO2=GW (or CO2=AGW, etc.) has never been quantified with measurements that are acceptable across the board; to scientists and engineers on all sides of the ”dangerous manmade global warming’ debate. We know that the recent rise in CO2 has not caused the endlessly predicted global warming. That fact falsifies the CO2=AGW conjecture. It has failed. That parrot is no more. It’s dead, Jim.
Maybe ‘hand waving’ is too strong. It was too strong in your response to Pierre D M, too. His statement was entirely accurate. Speaking for myself, I understand enough of radiative physics to accept that CO2 causes some global warming. However, almost all of the warming effect happened within the first few dozen ppm. Adding more CO2 to the current ≈400 ppm has no measurable effect. We could add another 100 or 200 ppm, and still not be able to measure any resulting global warming. If you extrapolate from current CO2 levels, you will see that any future warming due to CO2 will be too minuscule to measure:
Your appeal to authority argument might have some validity — if global T had kept pace with the rise in CO2. But it didn’t, so there is something seriously wrong with the CO2=AGW conjecture. If Climate Science™ was real science, that conjecture would be discarded; those who proposed it would get together with their colleagues and skeptical scientists, and they would try to figure out why that conjecture has failed so badly. Instead, they dig in their heels, and insist that CO2=AGW is still valid. They are like a six year old with chocolate and crumbs on his face, insisting that he wasn’t in the cookie jar.
Skeptical scientists (the only honest kind of scientists) are on the right side of the argument. Because the ultimate Authority — Planet Earth — is demonstrating very clearly that there is something fatally wrong with the CO2=AGW conjecture.
Toneb
March 23, 2016 at 10:01 am
I would suggest that thousands of research scientists coming to the same conclusion based on observation/measurement and applying empirical science known of for ~150 years (GHE theory) is very far from “hand-waving”.
—————————-
Hello Toneb.
First can you point me to any actual GHE theory by some link or what ever so I can check it up before I can argue about it!?
When it comes to the AGW which can not be considered as an hypothesis and requires more than just that assumed theory of GHE to prove it as possible, I can tell you that it does not matter what number of research scientists involved in reaching or coming to a conclusion, as that not the requirement of a thesis to be proven or considered as highly probable in any scientific manner, does not make it real if is not compatible with reality and in contradiction with it.
And when it comes to observation/measurement and applying of empirical science the most “sinister” “hand-waving” done by the researchers and scientist involved is that of the half time residence of the CO2 in atmosphere.
It is at ~5 years half time as per observation/measurement and empirical science.
No any real reasons or excuses for that “hand waiving” unless considering that it completely in conjunction with reality it proves that ARF and AGW are not compatible with each other, where AGW is a none existence and the ARF does not even make it to be really sensed by the system let alone having a measured effect on it.
The 5years half time means at most that in the last ~10 years or the last ~20years the Anthropogenic emissions of CO2 consist as only ~ 1/4 of the CO2 concentration acceleration, which in it’s own is very little as per numbers involved………..and the most that could be claimed about the warming, in which ever case of the last 10 years or the last 20 years, the Anthropogenic emissions consist only for 1/4 of the acceleration of the warming for the period in the question, ether the last 10 or 2o years………
A wait and await and await for it,,,,,, 1/4 of 0(zero) is still 0 (zero)….that is what the acceleration of the warming has being during the last 20 years.
Do you see any AGW there, because I can not, no matter how much I try and how sympathetic I may try to be to your claim or that of all these other scientist guys (or girls) you mention.
The other “sinister” side effect of that unreasonable-unjustifiable “hand waiving” is that we “hand wave” at the possibility of a better assessment of the overall yearly CO2 emission quantity in total and the yearly total quantity of CO2 sink, which will have helped and aided towards of a better understanding of the Atmosphere and the climate and climate change.
Not even a try in that direction, because it seems to be too threatening to the GHE “theory” you mention and most probably a very clear debunking of the AGW hypothesis.
Keep it in mind that the GHE “theory” you seem to rely so much on, does not by default proves the AGW, EVEN IN THE CASE OF THAT THEORY BEEN A PROPER ONE and considered as highly possible or correct, which actually by the all looks of it is not even a proper theory and highly faulty and contradictory and paradoxical at given points of reason..
cheers
Well I would say that in a very large number of trial scenarios maybe 95% of them might be caused by anthropogenic forcings.
Only problem that causes is that so far as we know, history has only happened once, not zillions of times, so the laws of probability can’t actually predict anything other than the frequency in the event of many repetitions of the experiment.
Remember we only have evidence of what has already happened and it only happened once that we know of.
G
DB, can you provide a source for that graph you posted showing the effect of a 20ppm increase in CO2 on atmospheric temp? I’ve never seen it before and I’d like to read more about it, it appears very convincing.
whiten writes:
[blockquote]When it comes to the AGW which can not be considered as an hypothesis and requires more than just that assumed theory of GHE to prove it as possible, I can tell you that it does not matter what number of research scientists involved in reaching or coming to a conclusion[/blockquote]
My favorite rejoinder to that “argument” is to remind people science isn’t democratic; regardless of the number of folks you believe a given premise is true, it needs proof. At one time thousands of scientists “believed” the sun orbited the Earth, but one man with a telescope proved them all wrong. It’s the nature of science.
and I’ve forgotten how to do block quotes in WordPress again…
Toneb,
There is a theoretical base for a temperature rise due to increased CO2, based on practical, line by line spectral analyses used in Hitran (from the US Army) for a “standard atmosphere” of temperature, clouds, etc…
That gives some ~1°C increase in temperature for a CO2 doubling. So far so good. No harm done, good for plant life on earth.
Climate models assume a lot of positive feedbacks (like water vapor, less clouds), which are at least questionable – as not observed – which gets them to 3°C and more. That was mainly based on the rapid warming over 1976-2000. but that rapid warming ended in the “pause” since then.
In reality we have huge short term variability from ENSO and Pinatubo, huge decadal variability in increase (1910-1945, 1976-2000) and flat/decline (1945-1975 and 2000-2013), where there was no effect at all from CO2 before 1950 and maybe some effect after 1950, but widely within the natural noise. How do you explain no temperature increase 2000-2013 with record increase and levels of CO2?
Thus humans as cause of the temperature increase may be true by internal IPCC vote, but by far not measurable in the real world…
Seth,
Given you’re lack of knowledge/understanding of topic I don’t know it’s going to be beneficial to reply. Here’s a post in another current thread that turns hard crusty delusion-complexes, like yours, into more flush-friendly nugget aggregations, so you don’t get so backed-up at the other end.
http://wattsupwiththat.com/2016/03/22/climate-change-is-improving-french-wine-quality/comment-page-1/#comment-2172591
Hail Mary
‘Unprecedented’ in 66 million years? But humans in their various forms have only been around for two million years according to geneticists. Who gets the blame for the other 64 million? I think we’re being framed.
Huh? You’re asking who gets the blame for not releasing much carbon in the last 66 million years?
Uhhh.. no one, I guess. The same as no one gets the blame for the other things that didn’t happen. Because they didn’t happen.
Precisely.
I see what you did there Bill 🙂
May I deconstruct the ’66 million year’ nonsense? Thank you:
Why pick 66 million years? Could it be because prior to that point in time, CO2 had risen just as fast as recently?
Furthermore, CO2 has been at least 15X higher in the past, without ever triggering runaway global warming — or any global warming in most cases. At times when CO2 was very high the planet was in a major stadial; an Ice Age. And vice-versa.
I just love it when the alarmist crowd tries to argue that old CO2 canard. It is ridiculously easy to refute. Fun, too. ☺
dbstealey:
“I just love it when the alarmist crowd tries to argue that old CO2 canard. It is ridiculously easy to refute. Fun, too. ☺”
Yep that is what dunning-kruger does for someone.
PS: just when did “CO2 15X higher not cause GW” ?
Would it be hundreds of millions of years ago (Late Ordovician era, some 444 million ya) when the Sun produced less radiation?
You do know that a younger star is cooler?
FYI:
“During the Ordovician, it would have been several percent dimmer according to established nuclear models of main sequence stars. Surprisingly, this raises the CO2 threshold for glaciation to a staggering 3000 ppmv or so. This also explains (along with the logarithmic forcing effect of CO2) why a runaway greenhouse didn’t occur: with a dimmer sun, high CO2 is necessary to stop the Earth freezing over.”
Did the planet have a higher albedo?
So that the high GHG content was necessary to counter the reduced TSI.
What was the continental configuration (ocean current transport of heat).
Like I’ve said to you before merely hand-waving such as this is not science my friend – and as you clearly know far more than all the experts you must have a source for your superior knowledge (?)
Unless of course you’ve done some original research yourself.
But then I don’t see you even linking to them, least of all the Nobel on your mantle-piece.
In short you cannot condense GW down to a single factor over 100’s millenia, and compare uncritically. Apples and pears.
Oh, and yes it IS ridiculously easy – I’ll leave the “fun” to you however.
I find it dispiriting that ignorance can be so easily maintained by hubris.
Toneb,
Planet Earth is laughing at you, and at your silly belief that CO2 is the ‘control knob’ of global T.
All set to give them the result they wanted: unprecedented?
Oh, come on. We’re digging up and burning carbon that’s been buried for millions of years, in massive amounts. What would you expect to happen?
…CO2 makes up o.o4 % of the atmosphere and 90% of that is NATURAL !! Hardly MASSIVE anything !!
Suuuurrre. It’s just a massive coincidence that atmospheric CO2 increased significantly right as humans started digging it up and burning gigatonnes of it.
@Windchaser
*sigh* And what’s the record resolution at 66 million years vs the last 4,000? Or last 100? You can hide a lot of variability in an ancient proxy; Marcott found this out to his regret. And, 66 million years ago the pCO2 was about 1,500 ppm.
NOTHING. CHEMISTRY is a PROPORTIONATE SCIENCE. The amount of carbon dioxide man contributes to the carbon cycle which does NOT influence climate – is MINIMAL.
I WOULD expect brainsless chicken-little types who can’t count, to act the way you are.
And you are doing it. And when you do this it is proof you’re a politics not a scientific commenter
I
Windchaser: “We’re digging up and burning carbon that’s been buried for millions of years, in massive amounts.”
Yes, so what?
Marcus:
“CO2 makes up o.o4 % of the atmosphere and 90% of that is NATURAL !! Hardly MASSIVE anything !!”
That old chestnut is getting a bit tired.
Since 99%+ of the atmosphere (~21% ~O2, 78% N2, Ar ~1%) is transparent to terrestrial LWIR…
https://en.wikipedia.org/wiki/Atmosphere_of_Earth
….. then that 0.04% actually a very sig proportion.
And beside the magnitude of a substance is no indicator of it’s effect – try putting 0.04% of cyanide in a water solution and drink it for instance (no offence intended).
Or turning to the atmosphere – did you know that ….
If all the ozone in the atmosphere was compressed into its solid phase, spread evenly over the surface of the planet, it would form a layer almost exactly 4.0 microns thick, and such a layer would be 1/10 the thickness of a human hair.
This quantity of ozone is what prevents the Earth from being sterilised by ultraviolet radiation.
Toneb: March 23, 2016 at 10:27 am
“99%+ of the atmosphere (~21% ~O2, 78% N2, Ar ~1%) is transparent to terrestrial LWIR…
https://en.wikipedia.org/wiki/Atmosphere_of_Earth”
——————-
O2 has 336 spectral lines in IR – it IS NOT transparent.
http://spec.jpl.nasa.gov/ftp/pub/catalog/c032002.cat
The JPL catalogue has no entries for N2 or Ar.
http://spec.jpl.nasa.gov/ftp/pub/catalog/catdir.html
Obviously that data is being supressed.
Sleepalot:
“O2 has 336 spectral lines in IR – it IS NOT transparent.”
Nope – like I said – it is to terrestrial IR.
That has a wavelength of 8 and 14 µm.
O2 has absorption bands between ~0.6 and 1.6 microns
https://en.wikipedia.org/wiki/Infrared_window
http://irina.eas.gatech.edu/EAS8803_Fall2009/Lec6.pdf
Well it also happens to be just 800 years after the mediaeval warm period, and 800 years is about the average warming to CO2 increase delay based on the ice core histories.
Ergo, the present CO2 increase may be just the normal delay from warming to natural CO2 emissions from say the oceans.
G
Well, frankly, Windchaser, I would expect that if you are right about the insulating effects of CO2, then there is reallyu no other option but what does indeed appear to be happening, right now:
“The possible explanation as to why we are still in an interglacial relates to the early anthropogenic hypothesis of Ruddiman (2003, 2005). According to that hypothesis, the anomalous increase of CO2 and CH4 concentrations in the atmosphere as observed in mid- to late Holocene ice-cores results from anthropogenic deforestation and rice irrigation, which started in the early Neolithic at 8000 and 5000 yr BP, respectively. Ruddiman proposes that these early human greenhouse gas emissions prevented the inception of an overdue glacial that otherwise would have already started.”
conclude Muller and Pross (2007) http://folk.uib.no/abo007/share/papers/eemian_and_lgi/mueller_pross07.qsr.pdf
or,
“We will illustrate our case with reference to a debate currently taking place in the circle of Quaternary climate scientists. The climate history of the past few million years is characterised by repeated transitions between `cold’ (glacial) and `warm’ (interglacial) climates. The first modern men were hunting mammoth during the last glacial era. This era culminated around 20,000 years ago [3] and then declined rapidly. By 9,000 years ago climate was close to the modern one. The current interglacial, called the Holocene, should now be coming to an end, when compared to previous interglacials, yet clearly it is not. The debate is about when to expect the next glacial inception, setting aside human activities, which may well have perturbed natural cycles.”
Crucifix, M. and J. Rougier, 2009, On the use of simple dynamical systems for climate predictions: A Bayesian prediction of the next glacial inception, Published in Eur. Phys. J. Spec. Topics, 174, 11-31 (2009)
http://arxiv.org/pdf/0906.3625.pdf
or even this tasty little recent morsel:
“The situation is completely different for a CO2 concentration of 240 p.p.m., which is close to that observed at the end of MIS19. In this case all four model versions simulate rapid ice growth several thousands of years before the present and large ice sheets exist already at the present time (Extended Data Fig. 1). This means that the Earth system would already be well on the way towards a new glacial state if the pre-industrial CO2 level had been merely 40 p.p.m. lower than it was during the late Holocene, which is consistent with previous results.”
Paywalled here: http://www.nature.com/nature/journal/v529/n7585/abs/nature16494.html
I mean there really just isn’t anything quite like having such a natural fly land in your climate change soup!
“carbon cycle–climate modelling”
The first question has to be who validated these models and how was it done? I suspect they were never actually validated, in which case the entire study resolves to… junk science.
Oh please. If anything risk of extinction should be reduced if increasing atmospheric CO2 is the only variable. More plants, more food for herbivores and omnivores. That should also provide a food increase for carnivores.
They keep pretending that CO2 is some magic potion, Jack’s magic beans. Able to take us where we have never been before. Offering a path for some climate giant to travel to Earth and grind all our bones into flour to make bread.
Fe Fi Fo Fum,studies like these are extra dumb.
Ownage. There are so many arguments against CO2 driven weather association the only thing that keeps it in the news is people banning people for saying it’s not true.
…. who is paying to produce this shite?
In this case US taxpayers via NSF according to the paper.
I agree–1C in one hundred years BFD.
I accessed and read the SI. (1) The sediment core has really poor time resolution 56 million years ago. See figures S3 and S4. Of course it does, because of things like variation in sedimentation rate and bioturbation. So impossible to assert any comparison to 20th century; the resolution simply is not there, something no amount of dodgy novel statistics can fix. (2) the conclusions rely on two ocean carbon cycle models, Genie and Loscar. These were fed conclusions from (1) based on the exceptionally dodgy novel statistics described in part one of the SI. The two models don’t do a good job with the present ocean carbon sink in general, let alone for this specific location, never mind comditions that might have prevailed 56 million years ago. Equivalent to the regional downscaling problem in GCMs. Figure S5 is a dead give away on that added complication.
All in all more junk paleoclimate. This time, obvious junk given a moments thought about the sediment core and what they are trying to assert.
If you cannot support your hypothesis with the historical record, just rewrite the record. It is commonplace now.
This is such bs research “if” the purpose of the research is to elevate the relevance of GCM’s, which this paper appears to project. This should scream the irrelevance of atmospheric CO2 on temperature and the complete failure of using atmospheric CO2 dominated models in connection to changes in global temperatures.
“Because our carbon release rate is unprecedented over such a long time period in Earth’s history, it also means that we have effectively entered a ‘no-analogue’ state,” said Zeebe. “This represents a big challenge for projecting future climate change because we have no good comparison from the past.”
If CO2 is relevant in the fluctuation of global temperatures, then that statement may be true, but it’s obvious that it’s a false statement. The earth should be boiling over under an “unprecedented” regime since 1950. Time to scrap the IPCC modeling failure and rethink the problem…..
–The rate of carbon release during the PETM was much smaller than the current input of carbon to the atmosphere from human activities.–
If true, then this provides evidence that the warmth during PETM was not caused by CO2.
Now, global CO2 was higher during PETM, but if rate of increase in CO2 was lower than present, then
that increase in CO2 did not increase temperature during that period.
Or for most of last 500 million years global CO2 levels have been much higher than present CO2 levels.
Or during last 50 million years geological factors have lowered CO2 levels to dangerously low levels- as low as 180 ppm. And plants can’t live at 150 ppm CO2. Or since life has existed for billion of years, CO2 levels could not have lowered below 150 ppm. Ie we are here, our times has had CO2 as low as 180 ppm, therefore we living in one of lowest levels of global CO2.
The theory of Greenhouse Effect, suggests that doubling of CO2 increase temperature by X.
So increasing 180 ppm to 360 causing an X increase, which same as 360 to 720 ppm.
So if baseline is around 720 ppm one needs increase to 1440 ppm to get same amount of warming as
180 to 360 ppm. And we have had since increase and it has not been related to warmer temperature.
Or our warming from the last glacier period was rapid and unrelated to CO2 levels increasing.
Nor does 360 ppm of global CO2 prevent us from returning to a glacial period.
One might argue that if we had a very high level of global CO2, it would prevent us from eventually returning to glacial period, but past record show that 360 ppm is not enough.
Or the record shows that rising CO2 level *Follow* warming periods and do not prevent cooling periods.
We also know that higher human emission cause less increase in global CO2 levels- so if nature adding
less CO2, then is looks like the higher CO2 was simply caused by a warmed world rather than a world warmed by increasing amounts of emission of CO2.
Everybody stop it! Just stop this nonsense.
To date, there is no credible, empirical, replicated study that demonstrates CO2 has any significant effect on global atmospheric temperature. NONE. If you disagree, cite the specific study, chapter and verse.
Computer models don’t count – they do not produce measured data. Arguments from “consensus” don’t count – consensus is immaterial in science.
It is far more likely that CO2 change is a CONSEQUENCE of temperature change, rather than the reverse. That’s what the ice-core data show. CO2 has increased by about 15% in the last two decades and yet global temperatures (satellite) are unchanged. QED. CO2 cannot be the big control knob on climate.
CO2 is the tail, not the dog. Period.
+100
Don’t be silly. It’s all that fossil fuel we dug up and burnt is what caused the rise in C02. Not to mention land clearing, agriculture etc
spaatch, that is an assumption, that the CO2 is man, temp CO2 and emissions have risen.
unfortunately no one has proved beyond doubt which is the leading element, history evidences temperature being the driver of CO2, not the other way around but as of yet, this has not been proven, neither has the claim that CO2 is driving temp.
Please come back to reality, if anyone had proven anything beyond significant doubt, there would be no disagreement as such, however much you delude yourselves with the genetic fallacy
http://newscenter.lbl.gov/2015/02/25/co2-greenhouse-effect-increase/
http://www.nature.com/nature/journal/v519/n7543/full/nature14240.html
The above describe direct measurement of the incoming and outgoing radiation of the Globe at various wavelengths over a decade, and show that it is directly due to more CO2.
One tenth (0.1) of a Watt of forcing per 10 ppm increase. This is less than the calculated amount.
Oh, here is the recent warming satellite data:
http://www.drroyspencer.com/2016/03/uah-v6-global-temperature-update-for-feb-2016-0-83-deg-c-new-record/#comment-211617
Pretty much, the argument that is causes net cooling rather than warming and is more convincing and doesn’t involve screaming about weather, notice that, it was all about climate, now they talk of nothing but weather
And it just happens to be 800 years since the mediaeval warm period. So CO2 should now be going up just from that warming.
G
Whether correct, repeatable or even reasonable, a paper published just last year in Nature claims there is in fact empirical evidence CO2 causes warming in the wild:
http://www.nature.com/nature/journal/v519/n7543/full/nature14240.html
Honestly, after reading only the abstract (I refuse to pay for papers that were written using tax money) I don’t think it holds water. I’d very much like to hear other opinions on it. I won’t say anything more, I really would like unvarnished opinions.
The overall health of C3 plants is probably better than any time in the past 66 million years as well.
The report of this in Science Magazine (http://www.sciencemag.org/news/2016/03/relatively-slow-greenhouse-injections-triggered-ancient-hothouse?et_rid=17049947&et_cid=356350) indicates that Zeebe et al used just one sample: “To estimate the rate of those ancient carbon inputs, Zeebe and his colleagues used data from a 24-centimeter piece of sediment core retrieved from a borehole in New Jersey. The section, a mixture of sands, clays, and silts that were deposited in a shallow offshore sea, is thought to span the PETM carbon injection period.”
But “traditional radiometric dating techniques aren’t precise enough to determine the exact ages of the sediments and therefore how fast carbon was being released.”
So “the researchers developed an alternative way to estimate that input rate, based on measurements of carbon and oxygen isotopes at dozens of different spots containing carbonate within the sediment core. Carbon has two stable (nonradiogenic) isotopes: abundant carbon-12 atoms and trace amounts of carbon-13. Living things have a preference for the lighter carbon-12, and so carbon emissions from organic sources like fossil fuels are relatively depleted in carbon-13. Similarly, ocean temperatures modulate which oxygen isotope—lighter oxygen-16 or heavier oxygen-18—creatures will use to build their carbonate shells. Ultimately, the carbon isotopes in the sediments point to organic carbon inputs that lead to increasing atmospheric temperatures, whereas the oxygen isotopes are a proxy for changing ocean temperatures.”
Others will be more able than I to say whether this is more than just plausible. The next paragraph is revealing: “Carbon added to the atmosphere doesn’t immediately translate to warmer temperatures in the ocean; there is a time-lag of hundreds of years between the injection of atmospheric carbon and the later warming of the ocean. But Zeebe and his colleagues didn’t find such a lag between the carbon and the oxygen isotopes.”
Three points strike me: (1) the work is based extremely limited information; (2) because the results from the limited data was not conclusive, they hunted around for some other information to support the conclusion they were hoping to find; (3) the statement about a carbon dioxide/temperature lag directly contradicts the late found from some ice-core analyses.
It appears (I would be happy to be corrected) that they used modelling to ascertain the length of the time period (4,000 years). If that is the case I would be most reluctant to draw such a conclusion: we all know that models are only as good as the assumptions which underlie them and do not constitute evidence.
Yes they did. See upthread. And their novel time series statistics are beyond dodgy. No independent method validation, mathematically or statistically. The SI novel method justification arguements are all qualitative author expectations based one what their novel method said the sediment core said.
In other words a self serving paper from someone studying to become some kind of administrator in natural sciences, and he/she/they are setting themselves up a deeply committed ”belief” proof series
showing they ”believe” and will be god d****ed if the scientific method or laws of physics are going to be getting in the way of their ”belief” the laws of chemistry don’t work and that ”the main thing about science, is that nothing can be proved. ”
Yes – the field which declared the definition of science is that ”it can’t be proved.”
Drilling for headlines
It’s just all those ” numerical stimulations ” at work …..(8<)) !
Heh heh they got us with this one and it is true ! We also have more ball point pens and cars than 66 million years ago and don’t get me started on the massive increase in stupid reports .
And it only took a few years to really do some economic damage….
Europol issues organized crime threat assessment focusing on cybercrime, hacking, money laundering and drugs
http://www.duhaimelaw.com/2013/03/21/europol-issues-organized-crime-thre…
4. Economic Crimes
In the EU, the VAT-specific crime, the so-called ‘missing trader intra community (“MTIC“) fraud’ also known as ‘carousel’ fraud, results in billions of Euros of tax losses to governments annually. MTIC fraud involves charging and retaining VAT from sales but not reporting or remitting it to tax authorities. Vast networks of MTIC fraud rings apparently operate in all parts of the EU and are becoming an increasing economic problem for governments.
Also of concern is the increase in advance fee fraud, a scheme whereby consumers are asked to pay in advance for goods or services over the Internet that are never provided. The advent of the Internet means that cybercriminals can operate remotely and far distances from the victims.
Interestingly, SOCTA noted the emergence of economic fraud cases exploiting electricity and gas markets following a scheme targeting carbon credit trading. Apparently, 90% of carbon trading credits in the EU in recent years were driven by fraud.
Organized crime groups such as the Cosa Nostra, Camorra and Ndrangheta are reported in the SOCTA as being heavily involved in renewable energy (wind and solar) and waste management businesses all over the EU which are used to launder funds.
With respect to renewable energy, the involvement of organized crime commences at the financing of infrastructure and continues to operating wind farms and solar energy companies. The generous EU subsidies, tax credits and tariff fees are attractive to organized crime because it means ultimately that the government is funding organized criminal activities.
“The generous EU subsidies, tax credits and tariff fees are attractive to organized crime because it means ultimately that the government is funding organized criminal activities.”
John, government is an organized criminal activity. It always has been. C.M. Kornbluth wrote a tongue in cheek overview back in the 40’s (or 50’s, can’t be sure). John Brunner wrote a book on the subject. It’s not a new idea.
Doubtless, much more time and funding will be required to address all of the questions and uncertainties.
That’s an AVERAGE over 4000 years due to lack of resolution in the proxies. It says nothing about happened in 10 or 100 year intervals. I could take the 10PG/year anthropogenic release rate for the last 50 years and divided that by 4000/50 and get 0.125Pg C/year. Doesn’t look so bad, does it.
Peter
Yeah, and humans are responsible for more CO emitted, waste excreted, and oxygen inhaled, all at that same rate.
This is truly from the “Department if Duh.”
Human population 15 thousand years ago was about 5 million, and just a wee bit before the industrial revolution.
So it’s no surprise that cave-dwelling knuckledraggers were not putting significant amounts of C02 into the atmosphere.
Gawd.
Furthermore, we still don’t have the foggiest idea what the climate sensitivity to CO2 is!
If it’s <1.1C per doubling then no big deal. This was about what Lewis and Curry measured from IPCC data.
So is lots of CO2 a bad thing, or more plant food for a burgeoning population?
Only time will tell.
I am sure others have calculated values to be between 0 -0.3.
This whole thing has degenerated into farce. Now we need a study to say it isn’t so, hotly followed by a study which proves the refutation wasn’t worldwide.
Didn’t the oceans contain any dissolved CO2 prior to any previous temperature upturns? Has uniformitarianism been declared completely archaic?
All mammalians perhaps and condemned in mass by association
This just in: Humans are most likely responsible for the large increase of CO2, perhaps even at an “unprecedented” rate, causing a massive, shocking even, greening of the planet. Horrors! Guilty as charged.
We humans should be ashamed.
A speculation that depends on observations far outside of a scientific frame of reference filling a secular demand for god-proxies.
Just-so stories: masquerading as science since 1859.
Better stories, and likely truer:
We are not going to be releasing CO2 at the current rates for another 4,000 years (as happened in the PETM or the 20,000 years the same authors said it took in their previous publications). We will have run out oil and coal long, long before then.
This is completely a moot point paper.
The PETM Carbon release was likely from volcanism which occured as the north Atlantic unzipped. The UK split away from Greenland basically exactly where Iceland is today. The split probably extended far into the Arctic ocean fairly rapidly and very large volcanoes resulted. They are mostly at the bottom the north Atlantic right now so there is not much direct evidence for how big they were.
didn’t we peak in 2,000; haven’t we already run out….
“Humans responsible for carbon release 10 times faster than any event since age of dinosaurs”
And the plants are truly grateful. They were beginning to worry about low CO2 levels.
The Earth was covered in forests before we cut em down when C02 was 280ppm. The plants were doing just fine back then…
Sahara, Antarctica, Gobi, Atacama, Nullarbor, Arabia?
More fantasies that you can vacate the laws of chemistry through magical thinking on your part.
Plants do better in more CO2.
By definition they weren’t doing as well.
You have a huge problem in your attempted defenses of your church’s teachings: your illiteracy regarding the laws of atmospheric chemistry.
The Earth has never been “covered” in forests. Primary production effectively shuts down if CO2 levels hit around 180 ppm. Botanical, satellite, geological and paleontological evidence all show that plants respond positively to higher CO2 levels see for instance :
https://www.sciencedaily.com/releases/2013/07/130708103521.htm
Among other things plants use water more efficiently. A small number of efforts have been made to show that more CO2 is bad for plants, but not particularly successfully. After all, that tree in your yard consist of nothing but CO2, water, sunshine, and minute traces of minerals.
In North America there far more trees now than at any time in the historic past (i.e. since about 1500 CE). I have read estimates of an order of magnitude more trees in the present. The additional forestation has immensely increased the problem of catastrophic forest fires in the western US. One example of simple empirical evidence is a set of historic and modern photographs of Yosemite. The increase in forest cover following the establishment of the park is pronounced. This is due in a large part to the attempts to suppress fires. Now we are dealing with the legacy attempting to reduce the intensity and extent of fires through controlled burns, but the results are a drop in the bucket compared to the accumulated fuel load.
The premise of the article is faulty – It is worthless to discuss only the anthropomorphic RELEASE of CO2 without, at the same time, addressing the normal reabsorbtion paths. This is true whether or not CO2 can be shown to have any detectable effect on any aspect of climate.
Yah, OMG, my eyes: the blurb from University of Hawaii’s Zeebe, in HawaiiNewsNow today, ” … “The CO2 in the atmosphere essentially puts a blanket around the earth. The more CO2 you put in the atmosphere, it means essentially the higher the surface temperature of the planet will be,” Zeebe said. …” Sheesh: musta been all that AlGore training.
Whoopee. So now we are at 400 ppm CO2, compared to thousands way back when. It is a good thing, since CO2 is our ally, producing wood, food and fiber, which in turn produces O2, which, conveniently, we breathe. You go, mankind! If not for you, this blue green orb might just become a dead sphere.
The rate of change in atmos CO2 not correlated with the rate of emissions
http://papers.ssrn.com/sol3/papers.cfm?abstract_id=2642639
and the rate of warming also not correlated with the rate of emissions
http://papers.ssrn.com/sol3/papers.cfm?abstract_id=2662870
The claimed correlation between cumulative emissions and surface temp is spurious
http://papers.ssrn.com/sol3/papers.cfm?abstract_id=2725743
The bottom line is that we don’t know natural flows well enough to do carbon accounting at a precision needed to detect the presence of fossil fuel emissions. The IPCC carbon budget ignores these uncertainties.and creates a fictitious account that balances exactly.
http://papers.ssrn.com/sol3/papers.cfm?abstract_id=2654191
So, early man released the first anthropogenic gases by firing up wood fending themselves off from hungry T-Rex dinosaurs 66 million years ago. Apparently creationism is a valid theory for climate scientists.
Do we know how much Carbondioxid is released with a vulcanic erruption?
As we have seen, erruptions are either explosive and/or have long lasting active lava flow.
To my knowledge we don’t have that data!
Common sense is that the amount of gas released is very large and different with each erruption and location!
One of the models Zachos has been working on. Don’t know if it is the one used in this current paper.
http://www.es.ucsc.edu/~jzachos/pubs/Lauretano_etal_2016.pdf
Obviously to the very same extent that “Human-driven carbon release rate unprecedented in past 66 million years” is true,, so is Human-driven carbon release rate unprecedented in past 4.5 Billion years.
Unnnnnnnnnnnnnnnnnnnnnnnnnnnnnnnnnnprrrrrrrrrrrrrrrrrrrrrrrrrrecedennnnnnnnnnnnnnnnnnnted in 66 milllllllllllllllllllllllllllllllllllllllllllllllllllllllllllionnnnnnnnnnnnnnnnnnn yearrrrrrrrrrrrrrrrrrrrrrrrrrrrrrs!
Bruce Atwood March 22, 2016 at 5:52 pm
Oh, here is the recent warming satellite data:
http://www.drroyspencer.com/2016/03/uah-v6-global-temperature-update-for-feb-2016-0-83-deg-c-new-record/#comment-211617
sorry if I’m out of line
michael
Look at the massive long warming Before the PETM, ony after said warming, and not preceding it, did the warming culminate in the PETM. The PETM resolved itself as well, both the warming and its resolution were entirely natural. Further only about half of the PETM can be explained by c02 if you assume IPCC numbers.
Do we know what caused the PETM “pulse”? I’d suggest the Deccan Traps.
Get with the program – Hansen wasn’t the author of the paper being discussed. It’s these guys..
Richard E. Zeebe, Andy Ridgwell & James C. Zachos
Anthropogenic carbon release rate unprecedented during the past 66 million years
http://sci-hub.io/10.1038/ngeo2681
Sober up vapid. Somewhere between Hansen telling you “Magic makes the sky hot” and you believing it,
you showed up holding birdcage liner up like a torch of illumination.
To your thermodynamically befuddled, ”Magic Made The Sky Hot” head.
“The findings suggest that humans are responsible for releasing carbon about 10 times faster than during any time in the past 66 million years.”
This argument MAY be true, but for it to have any importance it would need to demonstrate a rational relationship between CO2 and temperature. So far, the only rational relationship is the utter dependence of CO2 on temperature as we descended into the current ice age.
Before this decent, with much higher CO2 levels, there is no discernible relationship.
We have lots more work to do. Nothing in this realm is certain. We need to find the inflection point(s) between discernible relationships and none.
Never in the last 66 million years have humans emitted as much CO2 as they have in the last 200 years.
Please bear in mind that the genus Homo is only about 2 million years old. The “twin towers” of geological CO2 production from about 120 to 80 million years ago may well have equaled current human efforts.
DonK31, do you base your statement on ice core evidence tacked on with current atmospheric levels? If so, you are using an apple and an orange to make your case. Ice core specialists have yet to determine whether or not directly measured atmospheric CO2 levels are muted as bubbles of the stuff become entrapped in ice core layers, which takes several decades, possibly hundreds, to happen. We don’t have old enough direct atmospheric CO2 measurements to compare with layered ice core CO2 analysis. It may be that current atmospheric amounts are at levels previously identified in the ice core record during warm interstadials. That also means that we could be at a normal warming interstadial peak which will be followed by a normal jagged drop to the normally longer stadial cold period, an oscillation that is ubiquitous in our current Pleistocene age.
gymnosperm,
I am wondering for some time why the CO2 levels were so high during the Cretaceous at the same time that there were no reversals in the earth’s magnetic field. Something to do with continental drift / mantel plume / CO2 releases which are driven (in part?) by the geomagnetic field?
And the day we think we control CO2 emissions Lake Toba or Yellowstone goes boom, and we can start all over again.
Don’t forget a nice big Carrington event which would throw Western civilization back to the stone age.
When one plots the simple annual % change in human Co2 emissions from 1966 (BP Statistical Review is source of CO2 emissions) versus the plot of annual % change of atmospheric CO2 levels, it is rather difficult to surmise that human emissions are in any way driving change rates in the atmosphere over the last 5 decades.
Using Excel, the r-squared between the two plots is significantly abysmal: http://www.c3headlines.com/2015/07/climate-factcheck-co2-emissions-growth-has-no-impact-on-atmospheric-co2-growth.html
Combined with this study’s ‘4,000-year resolution’ thingy, one can conclude that the speculative conclusions by the authors and media are in reality just more fact-less absurdities that press release science has become addicted to.
The modern rise in the atmospheric concentration of carbon dioxide doesn’t even break out of the Cenozoic noise level… Cenozoic CO2 (older is to the left).[/caption]
[caption id="attachment_138417" align="alignnone" width="800"]
The proxy data lack sufficient resolution to say anything definitive about millennial scale rates of change, much less century-scale.
“The findings suggest that humans are responsible for releasing carbon about 10 times faster than during any time in the past 66 million years.”
Ten times? Is that all? There are 7.3 billion people now so even if there were 7.3 million humans 66 million years ago ( probably closer to 7.3 thousand) then per person we are releasing 1/1000th (or 1/1,000,000th as much). What’s the problem?
Modern humans are thought to have evolved less than half a million years ago and the first examples of the genus Homo dates to about 2.8 million years ago. 66 Million years ago there were no hominins of any description and the nearest thing to a primate was a creature which is believed to have looked more like a modern squirrel.
The estimates I have seen is that the human population reached 100,000 about 200,000 years ago.
” Claim: Human-driven carbon release rate unprecedented in past 66 million years ” Excuse me, but how can this possibly be true? Look at the graph below, the Keeling curve. Every year the slope of increase is at least 10 times the average increase in CO23 as shown by the main graph. So are the authors implying that in the NH Winterts that man produces ten times as much CO2 as is adsorbes/removed/disapears during the NH Summers? Or am I confused. What is causing this rapid Increase and equally rapid decrease?
http://www.planetforlife.com/images/keeling2.gif
The NH seasons:
Global atmospheric CO2 increases during the NH Autumn Winter and decrease during the NH spring/ summer.
Regarding their analysis of past CO2 emissions: they suffer from the low-pass filter problem.
This is the first thing to look for in any trend. or rise-and-fall, analyses like these. It is over. They have no good accounting for this.
If the past includes one data point per 100 years, then they only get to include one data point for the 1800s, the 1900s, and 2000s. Ten teams working overtime could not figure out the CO2 variance of the last century given a foot of mud.
You need some reliable way of “modeling” or adding back in the peaks and troughs that are missed across 66 gaztrillion years when examining one data point for each one hundred fipillion years.
Same, same.
It just proves that God finally realized that evolving termites to help prevent CO2 from being sequestered was not enough, another creature was needed to dig it back out of the ground and put it back into the air where it belongs.
Laughed out loud. While the voracity of the comment leaves much undiscussed, the frivolity of it clears the air of much puffery, including my own.
TonyB
‘Would it be hundreds of millions of years ago (Late Ordovician era, some 444 million ya) when the Sun produced less radiation?
You do know that a younger star is cooler?’
_________
A younger star?
4300 million ys minus 444 million?
You’re laughing behind the door.
Johann:
“A younger star?
4300 million ys minus 444 million?
You’re laughing behind the door.”
No – just quoting science (Standard solar model) …..
http://arxiv.org/pdf/1204.4449.pdf
Around 4% less TSI reaching Earth during that epoch which equates to ~54 W/m^2 or ~13 W/m^2 at TOA.
Current best est for a x2 of CO2 (280 to 560ppm) is 3.7W/m^2
double again to 1120 = 7.4
again 2240 = 11.1
again 4480 = 14.8 W/m^2
Get the drift?
The relationship is logarithmic …
Delta(F) = 5.35 ln(Co2 ratio)
http://scienceofdoom.com/2010/02/19/co2-an-insignificant-trace-gas-part-seven-the-boring-numbers/
So even ignoring other differences between the planet ~440mya then a younger Sun *could* be countered by atmosph CO2 concentration of ~3000ppm.
Not good, TonyB good.
Toneb March 24, 2016 at 4:30 am
“… when the Sun produced less radiation?…”
The real problem with that is that the planet has not warmed correspondingly as it should have given the increase in solar energy output proposed. This fact was one of those observations that resulted in James Lovelock advancing the original Gaia hypothesis. He wanted to explain why the planet was not much warmer now than it was when life appears.
The planet is considerably cooler now than it was during the Cambrian (peak Phanerozoic CO2) and during the Late Triassic peak which might seem to support CO2 as a driver, but the available geological data seems to show a boundary that boundary temperature (ca. 20 C) the planet does not exceed. More over, the best estimates accepted by most geologists place the peak RC02 in the Paleozoic at 26 times present regardless of CO2 levels. The peak following the Permian extinction, during the Late Triassic about 160 to 170 million years ago was about 10 times present levels. The reality is that the planet has not experienced CO2 levels as low the present, OR temperatures this cool since the end of the Permian. Biological and geological processes withdraw carbon from circulation faster than natural sources other than human “fossil” fuel use can replace it. At the end of the Permian the extinctions allowed a partial recovery of available carbon, less than half the Cambrian levels, and the long term trend since then is again downward, possibly excluding the burning of fossil fuels. The changes in atmospheric CO2 can be influenced by too many confounding factors to be as glibly certain as AGW theorists prefer to present themselves, so although you might logically expect that isotope ratios would be influenced by burning fossil fuels, just how does carbon uptake by various unknown and potential carbon sinks influence things, and how would simple changes in insolation (clouds) affect ocean temperatures and thus CO2 in the atmosphere? So, as an alternative suggestion consisder that far more than staving off the next glacial, your SUV just might be staving off the next Permian-level extinction event.