Climate researchers have published a new paper this week in the journal Nature Climate Change that acknowledges there has been a global warming slowdown from 2000-2014. Their research shows a hiatus did indeed occur and continued into the 21st century, contradicting another study last June that said the hiatus was just an artifact that “vanishes when biases in temperature data are corrected.” This is not the first time activists have tried to hide the hiatus by using dodgy methods. –Thomas Richard, The Examiner, 24 February 2016

…
An apparent slowing in the rise of global temperatures at the beginning of the twenty-first century, which is not explained by climate models, was referred to as a “hiatus” or a “pause” when first observed several years ago. Climate-change sceptics have used this as evidence that global warming has stopped. But in June last year, a study in Science claimed that the hiatus was just an artefact which vanishes when biases in temperature data are corrected. Now a prominent group of researchers is countering that claim, arguing in Nature Climate Change that even after correcting these biases the slowdown was real.
“There is this mismatch between what the climate models are producing and what the observations are showing,” says lead author John Fyfe, a climate modeller at the Canadian Centre for Climate Modelling and Analysis in Victoria, British Columbia. “We can’t ignore it.”
…
Ups and downs
The debate revolves in part around statistics on temperature trends. The study1 that questioned the existence of the slowdown corrected known biases in the surface temperature record maintained by the US National Oceanic and Atmospheric Administration (NOAA), such as differences in temperature readings from ships and buoys. This effectively increased the warming recorded, and the researchers also extended the record to include 2014, which set a new record high for average temperatures.
That work, led by Thomas Karl, director of NOAA’s National Centers for Environmental Information in Asheville, North Carolina, calculated the rate of global warming between 1950 and 1999 as being 0.113 °C per decade, similar to the 0.116 °C a decade calculated for 2000–14. This, Karl said, meant that an assessment done by the influential Intergovernmental Panel on Climate Change in 20133 showing that warming had slowed was no longer valid.
Fyfe and his colleagues argue2 that Karl’s approach was biased by a period of relatively flat temperatures that extended from the 1950s into the early 1970s. Greenhouse-gas emissions were lower then, and emissions of industrial pollutants such as sulphate aerosols were cooling the planet by reflecting sunlight back into space. Fyfe says that his calculations show that the planet warmed at 0.170 °C per decade from 1972 to 2001, which is significantly higher than the warming of 0.113 °C per decade he calculates for 2000–14.
Fyfe says that the advantage of this approach is that it takes account of events that affect decadal temperature trends. For instance, researchers have found that climate models underestimated the cooling effect of volcanic eruption and overestimated the heating from solar radiation at the beginning of the twenty-first century4. Other researchers are investigating variability in the Pacific Ocean, including a measure of sea surface temperatures known as the Pacific Decadal Oscillation (PDO)5. All these things can affect the climate, and mask the longer-term warming trend.
Bumps and wiggles
Susan Solomon, a climatologist at the Massachusetts Institute of Technology in Cambridge, says that Fyfe’s framework helps to put twenty-first-century trends into perspective, and clearly indicates that the rate of warming slowed down at a time when greenhouse-gas emissions were rising dramatically.
–Jeff Tollefson, Nature, 24 February 2016
Why is that the media doesn’t pick this up? (yes, sarcastic oxymoronic question)
I find it interesting that the caveat/excuse/party line is always given and cannot just refute the scam: “Fyfe uses the term “slowdown” rather than “hiatus” and stresses that it does not in any way undermine global-warming theory.”
Slowdown implies trend continues.
Hiatus implies trend continues.
Pause implies trend continues.
A market consolidates. There is no implication of future movement up or down; because nobody knows. That is how investment consultants talk, they only use loaded words if they are selling you an idea. The market has ‘topped’ if they want you to sell. The market has ‘paused’ if they want you to buy.
The trend is your friend, this trend is thousands of years old, so i would still bet that the trend ultimately continues, but the warmists are picking the tag words and even we digest them. This language is being hand fed to us and we are eating it up.
To continue the analogy; if I showed you a 5 minute wheat chart and told you you have to buy, it is going to $40.00/bushel in 100 years, would you do it? ‘Your children’s future depends on it.”
That is how we are making government policy, using your money.
Using 30 years of data on 20,000 cycles is beyond stupid.
“20,000 year cycles”
Did you know that 87% of statistics on the internet are made up…including this one.
Winnipeg Boy – Not made up at all.
From the Google: How long is an interglacial period?
Approximately every 100,000 years Earth’s climate warms up temporarily. These warm periods, called interglacial periods, appear to last approximately 15,000 to 20,000 years before regressing back to a cold ice age climate.
Don’t you mean 97%?
It is always 97%.
Menicholas
No.
Not ‘always 97%’ . . .
100% the science is settled.
Always. We are told.
Auto – with, Mods, please note, a teaspoon or twelve of sarcasm.
Yeah – outright Sarcasm.
So there!
It’s not the global warming theory that’s of concern; it’s the lack of global warming reality, that isn’t being noticed.
g
“If it bleeds, it leads”…still hasn’t changed in the media since I was writing for the local rag back in the 80s. Then, it was: try to fill up the spaces between the car dealership ads. Now, its clickbait, usually an unpaid intern (barely) re-writing a press release from Greenpeace or the WWF.
Well the problem I have with my local NEWS (talk) radio station, is that they have about three news items each day, max.
They play about 8 ads for rubbish, then they tell their three news stories; ‘ Trump sweeps to a major win in Nevada. ‘ (do they have 8 congressional districts); ‘ Hillary (prenamed for Sir Edmund ) triumphs big in Nevada, wins all three coin tosses.’ ‘ Obummer to close Gitmo; bring mohammedan pals to the USA. ‘ Then a break for 8 more ads of rubbish.
I like the tax lawyer ads. ‘ If you haven’t filed a tax return in years, we can get it settled for you for pennies on the dollar. Don’t have the money to pay the taxes, we can get it cut to ribbons ‘ ( How do the Lawyer get paid; and by whom; mebbe by the IRS ? )
Those three news stories will be rebroadcast every half hour, interspersed with the 8 ads. the radio station staff read the ads, and allegedly they use the product or service. How much are they paid to say they use the service ?
Total bunch of lying scam artists.
g
The global warming hiatus hiatus has ended.
Does it mean that the temperature is warmer now, than it was before it was as warm as it is now?
There’s always a higher altitude at the top of the hill.
G
The infamous Chris Mooney has: https://www.washingtonpost.com/news/energy-environment/wp/2016/02/24/top-scientists-insist-global-warming-really-did-slow-down-in-the-2000s/
Looks like the EPA is moving on the telling depressed small towns and cities how they can achieve Smart economic growth. http://www.epa.gov/sites/production/files/2016-01/documents/small_town_econ_dev_tool_010516.pdf
Transportation for one. Just ask for more federal money, I guess, like they do.
‘Pointless government regulation had nothing to do with it…’
Thanks for the link – that document is hilarious 🙂
(for me – not living in the United States and not paying a cent for it.)
” researchers have found that climate models underestimated the cooling effect of volcanic eruption and overestimated the heating from solar radiation at the beginning of the twenty-first century4. Other researchers are investigating variability in the Pacific Ocean”
Still floundering around looking for excuses. When will they get their thick heads around the reality that CO2 radiative functions need to be knocked back at least 50% in the models? When will they graduate from their high school conception of CO2 physics?
When will they get their thick heads around the fact that radiative forcing is no good. The Earth’s atmosphere isn’t an onion, unlike the extremely strange planet their models are made for. If you want to know what happens on Earth, you need to understand that convection makes the atmosphere and oceans work.
Well if they stuck to high school physics of CO2 they’d do a lot better. The real “basic laws of physics” CO2 forcing is about 50% or what they are currently using, which is pretty much doubled by supposed positive feedbacks which are nothing but gestimated “parameters”.
What do you mean 50% Mike? Since when did a trace amount of CO2 and it’s properties control the planets temperature and overpower all other gases?
UV, Xrays and other frequencies effect hydrogen, nitrogen, oxygen and argon in a much greater way in variability as to swamp CO2.
CO2 has no influence over the planets current composition of gases, it plays no role in earths temperature variability, CO2 is not even 1% of earths atmosphere yet it is touted as having supernatural properties, show me the experimental results that show adding 1% CO2 to a nitrogen and oxygen atmosphere can change the natural variability of temperature in that atmosphere, show me the results that prove the artifcial atmosphere will not cool or warm naturally…
Mike: “Well if they stuck to high school physics of CO2 they’d do a lot better.”
There are PhDs aplenty who believe that CO2, on net, cools the planet rather than warms it. Using only HS physics (and thermodynamics) many of them easily show that CO2 does not do what the “team” claims it does. But it will be a long, long time before the CO2 delusion is over and we can get back to reality. (the “team” deals in some sort of mythical world of make believe)
As a side note; notice that the whole CAGW scare is based on only the anthropogenic CO2 released. That would be, on a yearly basis, approximately 4% of the trace gas in the atmosphere that is itself only 0.04% (400 parts per million). If CO2 were really the “climate control knob” then CO2 would have to be a “magic molecule” indeed.
~ Mark
How shocking that this group of climate deniers has its paper published in a legitimate journal! What will become of climate science when NOAA is challenged? Did no one read the memo? The science is settled.
This paper’s coauthors include Michael E Mann and Benjamin D Santer who I doubt would self-identify as “deniers”.
I wonder if Mann will now sue. I wonder if the “slowdown” is acceptable to him since it still implies warming. I wonder how he feels about the lead author talking about the paper and data in this way.
Gavin is not impressed…
‘…Gavin Schmidt, a climate activist and a director at NASA’s Goddard Institute for Space Studies, said it’s a “tired discussion and nothing more than academic bickering.” He adds, “A little bit of turf-protecting and self-promotion I think is the most parsimonious explanation. Not that there’s anything wrong with that”…’
I love the last episode being lifted from “Seinfeld” (possibly very unintentionally), considering that GISS has an office literally a few doors away from the restaurant façade used to represent the Monk’s coffeshop frequented on the show.
So Karl et al is wrong even after altering buoy’s to match ship cooling water intakes? I would think the real probem is reconciling Karl with RSS and UAH.
The real problem is all these folks are studiously neglecting systematic measurement error. The surface temperature record isn’t known to better than ±0.5 C, and more likely no better than ±1 C.
Even RSS and UAH are probably not more accurate than ±0.3 C.
All of global warming studies are like arguments among theologians. None of them know what they’re talking about.
Pat Frank:
Yes! Well said! Hear, hear!
Richard
Exactly!
One gets the impression that the entire field of “climate science” is based on data processing – analysis artifacts and gross underestimation of systematic errors.
“Climate science” not only strains credibility but tosses it in the blender and hits the purée button.
But statistics can “fix” this. The old precision vs accuracy thing again.
Finally. What justifies reporting all these global temperature measurements to 3 decimal places? I haven’t been able to find at NASA nor at NOAA what is the uncertainty in their temperature measurements, but I suspect that it is a lot closer to +/-1 degree C than it is to +/-0.001 degree C. That means that all these papers and headlines about this month or year being warmer that last year are just a bunch of BS. What they should be saying is no significant change.
PiperPaul, I’ve yet to encounter the climate modeler that understands or respects the distinction between precision and accuracy; and I’ve encountered plenty. They dismiss it with contempt.
I’ve read most of the surface temperature papers, too. They all assume all error is random. Earlier papers don’t mention systematic error. John Kennedy’s (UKMet) 2014 review mentions it, but then assumes that it is all random and averages away. I’ve exchanged emails with John. He doesn’t budge.
All of Climatology has become “Global Warming Studies” suitable for inclusion in a Humanities Cultural Studies Curriculum. The entire field lives off false precision.
I like Richard Lindzen’s remark that it’s just a “statistical residue”.
@ Dick Burkel February 24, 2016 at 1:16 pm.
Allow me to refer you to my “Climate Sanity: GISTEMP’s Overconfidence Intervals”.
http://www.elcore.net/ClimateSanity/GISTEMPsOverconfidenceIntervals.html
Karl says 0.116°C/decade and Fyfe says 0.113°C/decade for 2000-2014. This is not a Hiatus in the warming. The difference is because the earlier times were warming even faster according to Fyfe.
Let’s see…
*it was warming 0.113-116C/decade with “low emissions” and high aerosol cooling from 1950-1972 (but how many nuclear bombs and tests occurring?)
*then we banned aerosols and it warmed at .017C from 1972-2001 with lessening aerosols and increasing emissions
*then with massive emissions and no “cooling eruptions or aerosols” from 2001-2014 back to .0113-0.116C/decade?
That certainly is a slow down after an increase. And human emissions are supposed to be causing increasing warming, not slowing it down…which is why the models didn’t anticipate it.
Now, either way, if the globe was warming at 0.113-0.116C/decade in 1950 and was just beginning to reflect human influence and is warming today at 0.113-0.116C/decade with 65 years of increasing human influence non stop since then, the AGW theory has a problem. Either some unknown cooling mechanism exists that is overwhelming the “scientifically expected/calculated” effects of increased atmospheric CO2, OR there has been a miscalculation/false expectation regarding the effects of increasing atmospheric CO2…or maybe both.
Of course the Global Warming Hiatus is real.
If it wasn’t, the UK’s prestigious University of Exeter would have no need to hire a Research Fellow at £41k pa (~$60k) plus generous holiday allowances plus pension to research it:
https://jobs.exeter.ac.uk/hrpr_webrecruitment/wrd/run/ETREC107GF.open?VACANCY_ID=694759EE7x&WVID=3817591jNg&LANG=USA
The closing date is a month away – so send in your cv.
Of further interest in the Job Description:
fudge squared
Check out the list of authors. It includes one Michael E (Piltdown) Mann. Has he abandoned ‘The Cause’, or is he up to something devious yet again?
” … or is he up to something devious yet again?”
He only does devious.
Isn’t it obvious? There are a whole bunch of nervous rent seekers looking down under and muttering to themselves, “Uh oh. Maybe we should cool the whole ‘we’ve got this all figured out’ meme”.
A couple days ago I just finished reading how January 2016 was the hottest EVER! The disconnect just amazes me. Meanwhile, I wonder if Lake Superior is getting ready to freeze over again.
http://www.slate.com/blogs/bad_astronomy/2016/02/17/january_2016_was_the_hottest_january_on_record.html
Lake Superior won’t freeze this year, the cooling started too late in the season, due to the El Nino impact. But the water is not unusually warm in Lakes Superior or Michigan, and I suspect that we’ll have another moderate summer in the Upper Great Lakes, and the potential for a fast cool-down next November and December.
So, Climate Central took the opportunity to go “wall to wall” reporting dramatic sea level rise. It was picked up everywhere! New York City and Washington, DC were again under water. Oh, the humanity.
Tell us, the unwashed how the acceleration happened during the “pause”? Maybe, could it be that, sea levels are not correlated to CO2?
Oh my!
‘Oh, the humanity.’ Nice touch. 😉
That quote conjures up images of CAGW going down like the Hindenburg. How ironic that GW would go down in flames, all the while proponents shrieking “Oh the humanity”.
I just looked at the authors of that study. Say what??
That really is a riddle to me. Authors:
John C. Fyfe, Gerald A. Meehl, Matthew H. England, Michael E. Mann, Benjamin D. Santer, Gregory M. Flato, Ed Hawkins, Nathan P. Gillett, Shang-Ping Xie, Yu Kosaka & Neil C. Swart
These are the exact same people who introduced the word “Hiatus” when the warming slowed down to an almost standstill. Rather than let ANY skeptics even suggest that perhaps it had stopped, they declared it a “Hiatus” a “Pause” because in their minds, SURELY, it was not just going to pick back up again, but it was going escalate like crazy. Now, because it hasn’t intensified despite the every increasing amounts of CO2 being put into the air by humans, they are looking like idiots, laughing stocks, and no matter what Lewandowsky and Cook do….people are NOT buying into their propaganda.
So what now? 1)-deny that there ever was a slowdown at all. Enter Karl et al. Nope, we fixed the numbers, see…we’re still right….we were just more wrong in the past than we thought….
Nope. No dice. Polls among the public and scientists still dropping in terms of believing in AGW. More bloggers and more Joe Public math and science people are learning their tricks and how to read scientific papers published online and shucky darn…they are finding the errors in the math AND the methods even faster today than they have in the past-AND making sure others find out about it faster too.
2)-admit that there HAS BEEN a slowdown. Enter Frye et al AND get people like Michael Mann to sign on to it so that it appears like everyone is on the same page now-activist scientists AND other non-activist scientists. Try to close that growing RIFT in the AGW leaning to Pro-AGW side of things. Give a little ground…so that they can declare unity going forward and make it appear as though they have taken a good hard look at the models and the data and sure enough…it needs a little tweaking. Not MUCH mind you, just a little, and they will get right on that so that the NEXT IPCC report or US Gov report, or whatever is next-gets viewed as more correct than ever! Throw Karl et al 2015 under the bus….(which they think skeptics will love)….while waving what appears to be a white flag that might help regain some of the credibility they have lost.
But see…they have another problem. They redefined “global warming” to mean “man made global warming”. They tried to eliminate/ignore natural warming and natural climate change because any argument including the word “natural” or “past history” or “Earth’s trends” undermines their agenda. So they have convinced believers that ALL of the current “global warming” or “climate change” is HUMAN caused. When they say global warming…they mean HUMAN warming, not natural warming, or nature plus human…just human.
SO…..uh oh….if global warming is slowing down, or has slowed down, now idiot people will think that MAN MADE warming is slowing down. That the BAD, CONTROLLABLE/EVIL/REGULATE-ABLE stuff is slowing down…because we’ve created the environment in which Earth’s natural warming between glacial periods STOPPED in 1950 and human warming started and was set to become hotter than it has ever been by 2020!! And it looks like that might NOT actually happen and people are catching on. They go outside. They don’t see the signs of imminent doom beginning that all of those climate scientists predicted would have already started all over the world! They start to realize that they might very well look incredibly foolish.
If they could convince us that the planet was undermining them personally, I actually believe they might try to. But they look bad….really bad….and very, very wrong at the moment. So I suspect that they are taking one or two steps back…to look reasonable perhaps?…and hoping that everyone will forget that THEY brought the word Hiatus and Pause into current talking points, and accepting the word slowdown again….a word reasonable skeptics have always used or accepted. But just like the “satellites aren’t trustworthy” video, this will throw others under the bus and cause even MORE fracturing and division within the “scientific community”. Its like they just never really think their actions through to every possible, or even the most obvious, outcomes and see how damaging they will end up being. To them. To science. To their precious theory. It’s like one of them says “What if we…..(insert idea that will surely exonerate us and convert skeptics…except that we’re so far removed from the average person that it will most likely backfire horribly)” and the others all pile on with glee.
And the more desperate and self defeating they become, the more I love every minute of it. 🙂
Aphan:
Yes! And to support your points I add that the most recent IPCC Report (AR5) said the same as you say about the “Hiatus”.
Box 9.2 on page 769 of Chapter 9 of IPCC the AR5 Working Group 1 (i.e. the most recent IPCC so-called science report) is here and says
GMST trend is global mean surface temperature trend.
A “hiatus” is a stop.
And this was published three years ago by the IPCC in that is tasked to provide information supportive of the AGW hypothesis. The “Hiatus” continues and is now longer than 18 years.
Richard
Aphan….satellites aren’t trustworthy; Argo buoys not trustworthy, but the adjusted and homogenized land station records are trustworthy. Wonder how man believers know they are being played.
But, if they didn’t model this particular pause, then they’re just modelling random crap.
They only needed the “Pause” to disappear long enough for the Paris talks to finish.
+1
If it won’t fit, use a bigger hammer!
Read the paper:
‘A point of agreement we have with Lewandowsky et al.26 concerns the unfortunate way in which the recent changes have been framed in terms of GMST having “’stalled’, ‘stopped’, ‘paused’, or entered a ‘hiatus’”.’
They refer to it as a slowdown.
They are the ones who brought the words “stalled”, “paused” and “hiatus” into our current lexicon to counteract the use of words like stopped, or halted. But even though stalled and paused and hiatus are words that strongly imply the “return to a previous state” of something-they actually think that the public viewed those words and thought “Oh….it’s over. No more man made warming”. So they once again employ a propaganda tactic…just change the terminology-to “slowdown”-and THAT will manipulate the public into thinking about things slowing down and speeding up…but never pausing or stalling. We’ll appear more trustworthy for appearing to “rebutt” the Karl et al 2015 paper, and skeptics will view us as being more on their side than we really are.
Hello….climate scientists? It’s NOT your communication problem…that is really the problem. It’s YOUR THEORY. You can make up names and methods and terrors and everything else you want to….but its your data and your methods that PROVE that your theory is flawed at best, and flat out wrong at worst. Why else would you hide it, or hold it back from publication, or put your court cases against others on HOLD for years when they counter sue in order to SEE it? Joining up with clowns like Lewandowsky and Cook only makes you look like idiots in both the science AND communications departments. And so does quoting them in any scientific paper you want people to take seriously.
Aphan says:
“Hello….climate scientists? It’s NOT your communication problem…that is really the problem. It’s YOUR THEORY. You can make up names and methods and terrors and everything else you want to….but its your data and your methods that PROVE that your theory is flawed at best, and flat out wrong at worst. Why else would you hide it, or hold it back from publication, or put your court cases against others on HOLD for years when they counter sue in order to SEE it? Joining up with clowns like Lewandowsky and Cook only makes you look like idiots in both the science AND communications departments. And so does quoting them in any scientific paper you want people to take seriously.”
And that has to be the paragraph of the century so far.
It captures the idiocy of the warmist position perfectly. Oh, if only it had come off my pen.
The most neutral term is “plateaued”
The old “distinction without a difference”.
Or, as my dad would have it, picking the fly poop out of the pepper.
Closest thing you’re going to see to a white flag from this crew.
This was one of the points that Anthony and I raised on the day Karl et al (2015) was published:
https://bobtisdale.wordpress.com/2015/06/04/noaancdcs-new-pause-buster-paper-a-laughable-attempt-to-create-warming-by-adjusting-past-data/
That’s exactly what I thought when I read the press release this morning and it certainly isn’t the first nor last time that skeptics beat them to the punch and get no recognition.
You can almost predict what rational climate research will be published 6-12 months from now by reading this site.
You have called Science on Demand . .
This service is brought to you by the team at Global Climate Science™ Policy Defenders.
We’re from the Government and we’re here to help you.
All our operators are busy at the moment but your call is important to us.
If you’d like to hear this message again, press 1.
If you’d like to hear from our Climate Science Communicator, press 2.
If you’d like to hear from our Climate Psychology Communicator, press 3.
If you’d like to see the data, press 4, and a message will be sent to one of our consultants.
For all other enquiries, press 1.
Norway Rat says:
They refer to it as a slowdown.
Satellite data, corroborated by radiosonde balloon data, shows that global warming stopped.
To quote Chico Marx: “Who are you gonna believe, me or your own eyes?”
“Satellite data, corroborated by radiosonde balloon data, shows that global warming stopped.”
Radiosonde data certainly doesn’t say that. Here is part of Christy’s Senate graph. No stoppage there:
http://www.moyhu.org.s3.amazonaws.com/2016/2/christy.png
Compared with NASA/GISS, it’s just about a perfect correlation.☺
Nick, what is the trend on that tiny little slice of a graph that you don’t want to show the rest of?….cause, if you put a trend on just what you showed….it looks like it’s still cooling.
LOL on you.
“it looks like it’s still cooling.”
The segment shows from 1997 to 2015. The horizontal lines are at 0.2°C intervals. so the radiosonde record rose about 0.3°C while allegedly “stopped” for 18 years. You can see the complete plot here.
Nick Stokes,
There was a temporary divergence, but it’s back to a good correlation again. When radiosondes are launched, there’s no telling exactly where they will go. But even with that small and temporary divergence, it’s clear that global warming stopped many years ago.
If the alarmist scientists followed the Scientific Method, they would acknowledge that their CO2=AGW conjecture has been falsified, then go back and formulate a new hypothesis to explain what’s happening, because observations show that their old hypothesis was wrong. That’s how the Scientific Method works: falsifiability and testability are necessary. But in Climate Science™ those necessary elements are ignored.
Instead, the alarmist scientists insist that their original hypothesis was correct. No amount of real world evidence can make them follow the Scientific Method, as they should.
See what happens when enormous piles of money are dangled in front of climate scientists? They react just like any other group that contains a dishonest element: the group obeys Grisham’s Law, and the crooked ones force the honest ones out. Scientists have been trained with grant funds like Pavlov’s dogs were trained with dog biscuits.
The bottom line is this: the endless predictions warning of runaway global warming and all kinds of climate catastrophes were wrong. It only takes being wrong once, but there are literally hundreds of examples. So now the whole debate is based on politics, not on science. Climate alarmism has a thin veneer of science on top, but that’s only for the general public. The fact is that the ‘dangerous manmade global warming’ scare has turned into a hoax, and easy grant money is the reason.
That money does not go to scientists who point out that what we’re observing is consistent with natural climate variability. As we see in countless articles here and elsewhere, a large part of the scientific establishment is now angling for a share of that taxpayer loot — and as pointed out by many others, they won’t get much if any of that grant money if the’re honest, and point out that the rise in CO2 (by only one (1) part in 10,000, over a century) is a non-problem. On balance the added CO2 has been a net benefit, with no observed downside.
“There was a temporary divergence”
So global warming stopped, except when it stopped stopping.
You’re a deceitful and [snip], Mr. Stokes.
You may be related to Sir George Stokes, but it’s a good thing he’s not around to see how you bastardize science and math for the sake of being a [snip] internet gatekeeper for your cause.
[snipped for language, per site policy -mod]
Michael Jankowski,
I think many of us have trouble not violating site policy on profanity when we think of the troll named Nick “anything to defend the team” Stokes.
The data is presented in 5 year running averages, so since it was cool before and after the 1998 El Nino the spike is lost. It is therefore correct to say that based on a 5 year running average of the satellite data there is a small increase since 1997. It is also correct to say that if a La Nina follows the current El Nino as most people expect then the 5 year averages will diminish the current 2015 spike.
When is a pause, faux-pause, slowdown, hiatus, not a pause, faux -……..etc. ?
It’s all in the hair splitting..;-)
This is hair-splitting: ‘Pause’, ‘hiatus’, ‘plateau’, etc., etc.
Fact: global warming stopped many years ago. Thus, the endless parsing, hair-splitting, and refusal to face reality by the climate alarmist cult.
Quite right, db: We surely reached a peak. If we didn’t (as per Stokes), then when will we? How will we know? The thing is, history definitely shows that climate rises and falls – falls being the operative word. So when will the likes of Stokes admit that climate is falling? Will Mann, having tried to hide the decline, now try to hide the pause?
On my earlier article here:
http://wattsupwiththat.com/2015/07/08/is-noaas-hiatus-gone-now-includes-may-data/
I said:
“By this definition, even NOAA shows a hiatus since the recent ratio for 1975 to 2000 versus 2000 to 2015 is 1.717/1.143 or 1.50 so the preceding period has a slope that is 50% more than the latest slope.”
So WUWT readers were told this long ago.
Acknowledgement of a hiatus can be nothing more than a defensive posture to keep the gravy train rolling. Think of these two future scenarios: 1) Be allied with the group that claims that the hiatus doesn’t exist, and lose both credibility and funding if / when the hiatus continues or temps drop, 2) Claim the hiatus does exist, (supported by facts), without arguing specifically against AGW, and leave your options open.
Two more in that cartoon and you would have had The Last Supper, Josh ;o)
Really?
Exclusive: New York asks SEC to force climate vote onto Exxon proxy
http://www.reuters.com/article/us-exxon-mobil-shareholders-exclusive-idU…
Doesn’t the SEC have REAL ISSUES to deal with outside of this and watching porn?
What we need is an ensemble of global circulation models we could use to model the climate of the climate debate. Then the warmists could point to the computer models as ‘reasons’ why their viewpoints are so divergent. 😉
If they are using their own Canadian model, need we remind them that it is the one which always runs hottest and should have been chucked out long ago?
Thomas Karl, director of NOAA’s National Centers for Environmental Information – this man did not get to the level of director without towing the company line, no matter the truth. He provided the customer with what they want. NOAA’s company line is determined by who their biggest customer/boss is and that be the Obama administration.
Only a fool would believe anything that comes out of government at the Federal level. Sad but true at this point in our nation.
” Fyfe says that his calculations show that the planet warmed at 0.170 °C per decade from 1972 to 2001, which is significantly higher than the warming of 0.113 °C per decade he calculates for 2000–14″
A lot of bugger-all is still bugger-all. What a waste of time and money, arguing over a few hundreds of one degree.
Who is the “we”?
There has been plenty of “we” that have NOT been ignoring the glaring mis-matches. Is he admitting there is a certain “we” that has been consistently and purposely ignoring the obvious? We can’t ignore that either.
Hey, the first step in recovery is admitting that you have a problem. I’m just SHOCKED that Mickey Mann signed on to a paper with someone who openly admits that what the climate is doing is NOT what the models say it SHOULD be doing, and that it can’t be ignored. Maybe he means the WE on the AGW side…THEY can’t ignore it anymore.
As 2 sides battle over whether the hiatus exists or not because a group of humans has defined the perfect temperature and CO2 level for the atmosphere and planet……..as being those levels when humans began burning fossil fuels……..the planet continues to green up, most life does well and many measures of extreme weather have decreased(from the decrease in the meridional temp contrast/gradient…..meteorology 101).
Massive, irrefutable benefits to life from the increase in CO2 and modest increase in global temperatures(warming the coldest places the most) are ignored, while global computer model climate projections that support the extreme versions of the speculative theory are treated like gospel.
Isolated weather extremes(that have happened before) get all the weighting, while the good weather gets zero weighting.
Climate change/scientific studies show that life like ticks, mosquitoes, bacteria, viruses and weeds will all thrive while good life, like bees, crops, butterflies, polar bears and humans will all suffer greatly.
Interesting how these creatures/life would all know what their role will be in obeying this newly discovered universal law “Bad things do better, Good things do worse”, when carbon dioxide goes up and our planet warms a bit.
Especially since the effects of warming and increasing CO2 has been universally beneficial to almost all life in the past and cooling/lower CO2 has caused great adversity/hardship.
So far, it appears that the word has not been passed on to life yet because the good creatures are still thriving as the planet continues to green up.
Mike Maguire,
Correctomundo, that’s it exactly. And it applies to just abouut every alarmist argument. They’ve taken the most wrong, easiest to falsify side of the argument.
But they can’t back down now, no matter what Planet Earth is telling everyone. If they did, they would be admitting that the hated skeptics were right all along.
So they lie about it, because they hate skeptics more than the truth…
DB-did you mean “They hate skeptics more than they love the truth”? Because it works either way. LOL 🙂
Aphan…. I think he meant to say it just that way. It perfectly captures the important issue.
So they lie about it, because they hate skeptics more than the truth…
=====================
what they hate most of all is to be shown to be wrong. being wrong doesn’t bother them. it is someone else standing up and pointing out where they are wrong. that is what they fear the most. being made to look stupid for having gotten things wrong.
It continues to green up as long as we can keep output going. What will happen after global population hits the inflection point a few years from now? And I doubt in today’s “bottom line” world anyone will promote less energy efficiency, all green considerations aside. As sure as “peak BTUs” will happen, you can bet that the AGW term will eventually have a negative derivative after a lag time. Then what?
models say it should be ~1/2 degree warmer….is it?
…..fail
It’s amazing how long it took them to discover the impacts of the smoothed PDO signal. I don’t think they even needed to discredit AGW in order to accept it. The real test will be what happens when PDO flips again. But of course, if there is something even lower frequency that flips negative, the pause may become truly multidecadal and maybe more.
It’s worse than we think for the warmistas, all the models say warming is to be ACCELERATING and were clearly not seeing that in global measurement data. This ACCELERATED warming occurs only in the imaginary/pseudo-data generated by climate models.
Global warming has virtually stopped.
Sun Spot says
“Global warming has virtually stopped.”
Mmmm…. this would say otherwise
https://en.wikipedia.org/wiki/Global_warming#/media/File:Global_Temperature_Anomaly.svg
And this
http://arctic.atmos.uiuc.edu/cryosphere/arctic.sea.ice.interactive.html
Oh and this
this would say otherwise
=================
what you have shown is political manipulation. growing up we heard how back communism was. the evils of Stalin re-writing history.
Yet here we are, with NOAA/NASA changing the past in the official temperature series.
Fundamental to accounting and auditing is the notion that you CANNOT and MUST NOT change the past. If you do, it is fraud.
It is the present that you must adjust. if an error was made in the past, you correct it today. you do not alter history, no matter how inconvenient.
We have hundreds of years of experience in the correct way to keep records. Fundamental to these principles is the single underlying rule. You do not tamper with history.
Simon,
Your links are nonsense. The “projected” temperatures never happen.
If you visit the real world, you will see that.
Fred
“Fundamental to accounting and auditing is the notion that you CANNOT and MUST NOT change the past. If you do, it is fraud.”
I think I see your problem. You are on the wrong blog. This is for people interested in climate. Accounting blogs are more boring…. maybe because they don’t correct known past errors which is entirely sensible in the quest to achieve the most accurate record of the past. You may not like the changes, because they are making it increasing hard for you to push your head into the sand, but they are reasonable. And, as has been pointed out many times (see Nick Stokes work) here, the effect of the adjustments in to minimise the warming. So you lose both ways.
DB says
“Your links are nonsense. The “projected” temperatures never happen.”
These are up to date/current/have happened…. they are not projections at all. Keep up DB.
Even the IPCC in its AR5 conceded slowing warming (despite rising CO2). Judith Curry’s written testimony to US Senate:
“Recent hiatus in surface warming and discrepancies with climate models
“The IPCC AR5 notes the lack of surface warming since 1998:
“[T]he rate of warming over the past 15 years (1998–2012) [is] 0.05 [–0.05 to +0.15] °C
per decade which is smaller than the rate calculated since 1951 (1951–2012) [of] 0.12 [0.08
to 0.14] °C per decade.” (AR5 SPM)”
https://curryja.files.wordpress.com/2014/01/curry-senatetestimony-2014-final.pdf
All these people deserve one another… I can imagine the blood pressures rising.
The new paper from Fyfe is not surprising. He previously published that the 117 CMIP5 model runs do NOT replicate actual temperatures from 1992-2012, and the difference is very significant. Same paper also said warming from 1998-2012 (HadCRUT4) not significantly different from zero. Fyfe et. al. Overestimated global warming last 20 years, NCC 3: 767-769 (2013). Here he does something similar, knocking Karl rather than CMIP5.
What IS surprising is his list of co-authors. I suspect the blowback from Karl is creating a great disturbance in the warmunist force. Somebody in that authors list probably knows what the whistleblowers inside NOAA told Rep. Smith’s Congressional Oversight Science subcommittee, which occaisioned the subpoena which occaisioned NOAA contempt of congress. So the heavies decided to get out of the target area. No other explanation for Mann, who as late as 2014 in his Scientific American article False Hope explicitly said yhere was no pause, showing using ‘unique’ (that is, none of the official datasets) that there was only what his figure labeled a faux pause. Essay Unsettling Science covered this in detail. McIntyre showed that Mann’s temperature data in his SciAm figure was ‘unique’.
Fyfe, Santer and several others were also authors on this paper.
http://www.nature.com/ngeo/journal/v7/n3/full/ngeo2098.html
This is a paper that created a 23 year long pause in satellite data once corrected for ENSO and volcanoes. So, these folks know that the satellite data shows no warming for a long time.
http://www.nature.com/ngeo/journal/v7/n3/images/ngeo2098-f1.jpg
How do they reconcile the difference between satellites and surface data? I suspect they simply ignore the problem and hope no one mentions it.
Or they might come out with a video trying to discredit the satellite data.
Oops..too late.
They “reconcile” it by realising that TLT is not the surface and that UAH and RSS have continually *altered* their algorithm — so the record is not a homogenised one.
Also the cooling stratosphere has a bias on the MSU/AMSU.
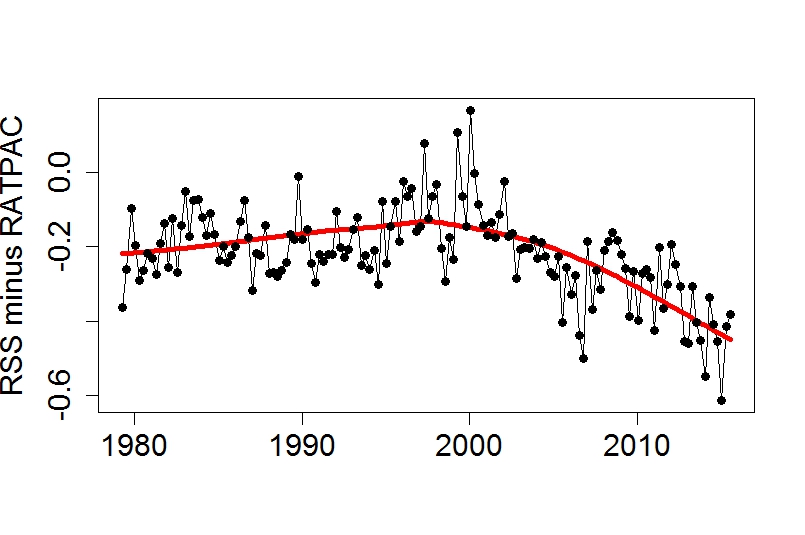
Add to that the fact that RSS has diverged from the RS RATPAC data since around 2000 (when the new AMSU aboard MOAA15 came online.
Before 2000 good match – after thousands of land thermometers wrong.
That’s a reasonable interpretation?
Imagine how that is possible. There might be other explanations. How about satellite calibration?”
your hockey stick is upside down.
This is good stuff. Can someone suggest a reason why, if the climate models so neatly model the cooling effects of past volcanic eruptions, why they never contain any future volcanoes?
(Hint: it’s a rhetorical question)
The Pause; It’s here, it’s clear, get used to it.
Over the next couple years as temperatures start to ease DOWNWARD ( in the reality of satellite data , anyway)…..
…. I hope the likes of Nick and Mosh will stick around to face their due humiliation. 🙂
Its only this drawn out El Nino ocean cooling event that has been holding temperatures level.
Judging by the current SST trend in the Pacific
http://weather.unisys.com/surface/sst_anom.gif
they will no doubt soon be readjusting the SST baselines – again.
Then they’ll all be gushing – again – about another anthropologenic hottest year evah!
Of course, Mann has stated ““The temporary slowdown in no way implies that human-caused warming has ceased or slowed down,” Mann said. “It was temporarily masked by natural factors.””
The hallmark of a cult. Nothing can dissuade them from their Beliefs. In their (computer model) world, only Mankind can cause warming, not nature. But, nature can mask it.
The paper is also trying to take the position that the oceans ate their warming.
Scientific American also has an article on this paper.
http://www.scientificamerican.com/article/global-warming-hiatus-debate-flares-up-again/
Gavin Schmidt is quoted near the end as being tired of the discussion.
I’ll bet he is.
Gavin Schmidt is quoted near the end as being tired of the discussion.
=============
the truth goes on forever, a lie always has an end.
You can only say “The sky is falling!” so many times before the people all notice it hasn’t fallen YET–and cease paying any attention to your squawking.
“An apparent slowing in the rise of global temperatures at the beginning of the twenty-first century, which is not explained by climate models, was referred to as a “hiatus” or a “pause” when first observed several years ago. Climate-change sceptics have used this as evidence that global warming has stopped.”
I would rather say that the pause proves that United Nations climate panel IPCC does not have a proper understanding of the issue at hand. The idea that the statements by IPCC can be trusted on these matters has been falsified.
When little boys like Gavin and Mikey cry wolf too often, they eventually get eaten by the wolf, and nobody notices…or cares ! Woof !
It ain’t a “hiatus” or even a “pause” until it starts going up again. If it goes back down, then it is a peak or a plateau.
Let’s see what happens first before we start giving it names that define it.
These researchers claim that there is no hiatus in warming, but if there is then it’s all the fault of the Pinatubo eruption, or more specifically additional volcanic aerosols emitted since 1991.
http://www.nature.com/ngeo/journal/v7/n3/full/ngeo2098.html
Apparently we are living in extremely volcanic times.
But it seems the frequency of [observed] eruptions has been constant since 1945
https://www.metabunk.org/debunked-significant-increase-in-volcano-eruptions.t6225/
The global average temperature trend consists of [1] natural variability [this includes irregular intra-annual and intra-seasonal variations] — 60-year cycle since 1880 withthe sine curve varying between +0.3 and -0.3 oC; and [2] trend. Trend consists of [2a] greenhouse effect and [2b] non-greenhouse effect. Greenhouse affect consists of [2ai] anthropogenic greenhouse effect, known as global warming and [2aii] other forcings. Non-greenhouse effect consists of [2bi] urban heat-island effect and [2bii] rural cold-island effect. Under human induced effects come: 2ai & 2b. IPCC noted the contribution of [2a] is more than half and contribution of [2b] is less than half — a qualitative definition. In the global average temperature on the land: [2bi] is over emphasised as the met network was concentrated in urban areas and [2bii] is under emphasised as the met network was sparsely distributed. Thus [2b] is over emphasised in the global avrage temperature anomaly. In addition to this the new entry is “filth” that changes the surface reflectivity and obsorption capacity of surface [land & oceans]. This creates the cooling effect, this is not accounted in the global average temperature anomaly. Also, general circulation patterns create advective addition.
Also, atmosphere has more than enough greenhouse gases that transform energy in to temperature and thus global warming is a misnomer only. After rectifying the adjustments made to data — lowering the past and moving upward the current data –, the trend part will be insignificant.
The combined effect of all these factors is, no change for the last around 19 years and will continue in future. This is reflected in satellite and balloon data series.
Dr. S. Jeevananda Reddy
Give thanks for “the pause” and clouds. A Limerick.
The cause for the Climate change pause:
The CO2 increase; because
there’s more clouds in the sky
make more snow, that is why
the climate is stable. Applause! http://lenbilen.com/2016/02/24/4697/
Anthony – I knew their claim was a fake from the start. This is not the first time they have faked global temperature. Last time it was just like the present time – an attempt to suppress the existence of a hiatus. Unfortunately, they were successful and their false warming is still part of the official temperature curve. The hiatus I speak of lasted for 18 years and is the one in the eighties and nineties that is shown as Figure 15 in my book “What Warming?” What they did was to over-write it with a non-existent “late twentieth century” warming and make that fake warming official. It is still part of their official temperature curve after 18 years of creating false impressions of global warming history. I discovered this hiatus in 2008 while studying satellite temperature curves and realized it was missing in ground-based temperature records from GISS, HadCRUT3, and NCDC. Later it turned out that all three had been computer processed and the computer had left identical temperature noise peaks in all three publicly available data-sets. Why this triple play? Most likely to eliminate a disagreement with the new fake official temperature curve they had just created. I kept pointing to this situation in comments and even put a warning about it into the preface of my book when it came out. It was completely ignored. Checking contemporaneous NASA records shows that the eighties and the nineties did not have any warming before 1997 and might even have had a slight negative slope. On October 29th you printed an article of mine that brought out these facts. To my surprise Bob Tisdale immediately jumped on me with an accusation that I had made it all up. He first opined that “In reality, Arno, what you have presented in this post is garbage.” And then he follows it up with this libel; “Arno, it is good to see you up to your old tricks of misrepresenting data.” This calls for a public apology. He is going all out to defend the existence of the fake warming dreamed up by global warming activists As far as misrepresenting data goes, the graph he shows as a justification, allegedly showing satellite data, has nothing whatsoever to do with present or past satellite temperature. That is easy to see by comparing it with any recent monthly temperature curve from UAH or RSS. This being the case, use of this bogus graph by Tisdale qualifies it as his ”…old tricks of misrepresenting data.”
in terms of AGW it does not matter whether there is a pause or whether there is not a pause if it cannot be shown that warming is related to emissions
http://papers.ssrn.com/sol3/papers.cfm?abstract_id=2725743
As long as there are upward slopes the general public will believe warming. They don’t know of the importance of time. relative values, margins of error, and the influence of x-y scales over slope. Nor do they want to know. Nothing much will change until slopes start to descend. We have to be so patient and spend the time while waiting on such things as forcings, researching feed back mechanisms, and more accurate measurement. Oh for a Chrystal ball. 🙂
I contest the frequent modelers’ claims that manmade aerosols cause the global cooling that occurred from ~1940 to 1975. This aerosol data was fabricated to force the climate models to hindcast the global cooling that occurred from 1940 to 1975, and is used to allow a greatly inflated model input value for climate sensitivity to atmospheric CO2 (ECS).
The climate models cited by the IPCC typically use ECS values far above 1C, which must assume strong positive feedbacks for which there is no evidence. If anything, feedbacks are negative and ECS is less than 1C. This is the key reason why the IPCC’s climate models greatly over-predict global warming, imo.
Some history on this subject follows:
http://wattsupwiththat.com/2009/06/27/new-paper-global-dimming-and-brightening-a-review/#comment-151040
Allan MacRae (03:23:07) 28/06/2009 [excerpt]
Repeating Hoyt : “In none of these studies were any long-term trends found in aerosols, although volcanic events show up quite clearly.”
___________________________
Here is an email just received from Douglas Hoyt [in 2009 – my comments in square brackets]:
It [aerosol numbers used in climate models] comes from the modelling work of Charlson where total aerosol optical depth is modeled as being proportional to industrial activity.
[For example, the 1992 paper in Science by Charlson, Hansen et al]
http://www.sciencemag.org/cgi/content/abstract/255/5043/423
or [the 2000 letter report to James Baker from Hansen and Ramaswamy]
http://74.125.95.132/search?q=cache:DjVCJ3s0PeYJ:www-nacip.ucsd.edu/Ltr-Baker.pdf+%22aerosol+optical+depth%22+time+dependence&cd=4&hl=en&ct=clnk&gl=us
where it says [para 2 of covering letter] “aerosols are not measured with an accuracy that allows determination of even the sign of annual or decadal trends of aerosol climate forcing.”
Let’s turn the question on its head and ask to see the raw measurements of atmospheric transmission that support Charlson.
Hint: There aren’t any, as the statement from the workshop above confirms.
__________________________
IN SUMMARY
There are actual measurements by Hoyt and others that show NO trends in atmospheric aerosols, but volcanic events are clearly evident.
So Charlson, Hansen et al ignored these inconvenient aerosol measurements and “cooked up” (fabricated) aerosol data that forced their climate models to better conform to the global cooling that was observed pre~1975.
Voila! Their models could hindcast (model the past) better using this fabricated aerosol data, and therefore must predict the future with accuracy. (NOT)
That is the evidence of fabrication of the aerosol data used in climate models that (falsely) predict catastrophic humanmade global warming.
And we are going to spend trillions and cripple our Western economies based on this fabrication of false data, this model cooking, this nonsense?
*************************************************
Allan MacRae
September 28, 2015 at 10:34 am
More from Doug Hoyt in 2006:
http://wattsupwiththat.com/2009/03/02/cooler-heads-at-noaa-coming-around-to-natural-variability/#comments
[excerpt]
Answer: Probably no. Please see Douglas Hoyt’s post below. He is the same D.V. Hoyt who authored/co-authored the four papers referenced below.
http://www.climateaudit.org/?p=755
Douglas Hoyt:
July 22nd, 2006 at 5:37 am
Measurements of aerosols did not begin in the 1970s. There were measurements before then, but not so well organized. However, there were a number of pyrheliometric measurements made and it is possible to extract aerosol information from them by the method described in:
Hoyt, D. V., 1979. The apparent atmospheric transmission using the pyrheliometric ratioing techniques. Appl. Optics, 18, 2530-2531.
The pyrheliometric ratioing technique is very insensitive to any changes in calibration of the instruments and very sensitive to aerosol changes.
Here are three papers using the technique:
Hoyt, D. V. and C. Frohlich, 1983. Atmospheric transmission at Davos, Switzerland, 1909-1979. Climatic Change, 5, 61-72.
Hoyt, D. V., C. P. Turner, and R. D. Evans, 1980. Trends in atmospheric transmission at three locations in the United States from 1940 to 1977. Mon. Wea. Rev., 108, 1430-1439.
Hoyt, D. V., 1979. Pyrheliometric and circumsolar sky radiation measurements by the Smithsonian Astrophysical Observatory from 1923 to 1954. Tellus, 31, 217-229.
In none of these studies were any long-term trends found in aerosols, although volcanic events show up quite clearly. There are other studies from Belgium, Ireland, and Hawaii that reach the same conclusions. It is significant that Davos shows no trend whereas the IPCC models show it in the area where the greatest changes in aerosols were occurring.
There are earlier aerosol studies by Hand and in other in Monthly Weather Review going back to the 1880s and these studies also show no trends.
So when MacRae (#321) says: “I suspect that both the climate computer models and the input assumptions are not only inadequate, but in some cases key data is completely fabricated – for example, the alleged aerosol data that forces models to show cooling from ~1940 to ~1975. Isn’t it true that there was little or no quality aerosol data collected during 1940-1975, and the modelers simply invented data to force their models to history-match; then they claimed that their models actually reproduced past climate change quite well; and then they claimed they could therefore understand climate systems well enough to confidently predict future catastrophic warming?”, he close to the truth.
_____________________________________________________________________________
Douglas Hoyt:
July 22nd, 2006 at 10:37 am
Re #328
“Are you the same D.V. Hoyt who wrote the three referenced papers?” Yes.
“Can you please briefly describe the pyrheliometric technique, and how the historic data samples are obtained?”
The technique uses pyrheliometers to look at the sun on clear days. Measurements are made at air mass 5, 4, 3, and 2. The ratios 4/5, 3/4, and 2/3 are found and averaged. The number gives a relative measure of atmospheric transmission and is insensitive to water vapor amount, ozone, solar extraterrestrial irradiance changes, etc. It is also insensitive to any changes in the calibration of the instruments. The ratioing minimizes the spurious responses leaving only the responses to aerosols.
I have data for about 30 locations worldwide going back to the turn of the century. Preliminary analysis shows no trend anywhere, except maybe Japan. There is no funding to do complete checks.
The alarmists are all in a panzy?
I wonder what the repercussions of this paper will be? Will the global warming establishment take this lying down, or will they try and vilify and discredit the authors?
If it does not get any play in the newspapers and other main-stream media, then why even address it? They will want to avoid the Streisand effect.
Will the global warming establishment take this lying down
=================
reminds me of the schoolmarm that wouldn’t stand for any hanky panky. If there was any fooling around to be had, she wanted it lying down.
My post of early this morning has apparently disappeared. I’ll shorten it here:
I reject as false the frequent modellers’ claims that manmade aerosols cause the global cooling that occurred from ~1940 to 1975. This aerosol data was fabricated to force the climate models to hindcast the global cooling that occurred from 1940 to 1975, and is used to allow a greatly inflated model input value for climate sensitivity to atmospheric CO2 (ECS).
The climate models cited by the IPCC typically use ECS values that are inflated far above 1C, which must assume strong positive feedbacks for which there is NO evidence. If anything, feedbacks are negative and ECS is less than 1C. This is one key reason why the IPCC’s climate models greatly over-predict global warming.
Some history on this fabricated aerosol data follows:
http://wattsupwiththat.com/2009/06/27/new-paper-global-dimming-and-brightening-a-review/#comment-151040
More from Douglas Hoyt in 2006:
http://wattsupwiththat.com/2009/03/02/cooler-heads-at-noaa-coming-around-to-natural-variability/#comments
Regards to all, Allan
What happens if air with -1°C flows across ice? Nothing, it remains solid.
But what happens if the air has +1°C? The ice will melt and takes the heat from the air, leaving this air colder than before. So, as long as the mean temperature of the air flowing to the arctic was lower than 0°C the ice was stable. But now often this is not so. The icecap at the pole is melting faster and faster, cooling down the air. This is the main reason, that the mean temperature of the globe is not rising so fast as expected.
What will happen when all ice surrounding the pole is molten? The temperature will go up faster than ever.
Please wait for it 10 or 15 years. But then all your arguing will be in vain.
The trend in the temperature is never a straight line. It is the overlay of a straight line and some cycles with different time scales and amplitudes. So it is easy to find times the temperature is just not rising, and some years later this temperature rise is much faster than before. So climate change can not be detected by looking at a timespan of 10 years, the scope must be much longer. Compare the temperature with data 100 years ago.
For heaven’s sake.
So, the current “debate over climate science” is between two camps:
Karl et al, who believe that 66 years of ever increasing levels of CO2 in the atmosphere have had ZERO effect on “global warming” rates,
And the challengers, who back Fyfe’s claim that 66 years of ever increasing levels of CO2 in the atmosphere have had less than ZERO effect on “global warming” rates.
Cool.
Literally.
I would like some help in my preparation of material for my warmy friends and family. At the moment I am met with emotional distress and horror plus some suggestions that maybe I should not be instructing in a green forum any longer. I feel my green credentials are fine as they are based on the facts as I know them and now I have been made aware of the hoax I am also keen to share this as and when appropriate. This site with the sarcasm and occasional clear right wing bias is no good for the group of people I need to talk to so could anyone list some suitable sites/resources/videos useful to factually instruct without judging the green philosophy? Thank you for your help.
Luma-
I feel your communication/ credibility skills could use some work. For example, insulting the integrity of a specific group of people and THEN asking them to help you find more “suitable” people makes you appear to be illogical, irrational, and socially inept all at once. If the people you “need to talk to” are so sensitive to their own personal philosophies that they can’t view/read/or endure any criticisms of them from people who do not share those philosophies, then I highly doubt that you, or anyone else, is going to be able to make much of an impact upon them. Especially considering the fact that you aren’t capable of finding sources that you consider to be “suitable” on your own. No one believes in a “guide” or “instructor” that hasn’t actually made the journey first, themselves.
Ouch.
In fairness to Luma, though, when I first looked around while trying to make up my mind about AGW, I found WUWT confusing, too, precisely because it is so open – science and politics, sense and nonsense all freely intermixed. Climate Audit runs a tighter ship with less scope for political bloviation, but at the same time the discourse tends to be more dry and technical.
I would tell any listeners that they should simply ignore politics – AGW should be evaluated based on truth or untruth, not based on political affinities. Yes, sceptics are conservatives more often than not, but there is absolutely no contradiction between being a sceptic and at the same time supporting environmental protection or free healthcare and education.
actually when you read the “about the author” part i think that most AGW publicity screamers may still learn from him with their massive carbon print.
when you read the critics about “green” solutions” here it are well founded critics. I for example have also a lot of criticism on renewable energy, but am certainly not against the idea (in fact it IS the future energy source we should take), but the way it is done now is really not the way it should be done.
Renewable energy is still in it’s development. It’s not ready yet to replace our current power plants for the energy our civilization requires, that’s a clear cut fact. Even if it would be ready, the power grids are not ready yet for a complete “green energy source”. Simple example of what i mean with this: if all houses here in Belgium would have solar panels and a small windmill and it would all be running, our power grid would blow to pieces each time there is much wind and/or much sun (in 2015 it even did almost happen when we had a very sunny july).
Also when there is no wind, wind turbines do require energy from the power grid in order to keep them going. (this i know from a guy that works for the off shore belgian wind park) These moments are rare but they do occur.
At this very moment renewable energy is still in it’s late infancy and needs more development to be also durable (i call a life span of 20 years for a wind turbine not a durable solution). We’re better off in developing this further instead of “rushing these sources into the power grid”, to find then still some “child diseases” in them, or a power grid that can’t handle the peaks, while a steadier more researched study and pre development of the power grid structure would prevent this.
I see four steps that would make this transition smooth and without problems, but these would only work in a long term planning:
1 first prepare the power grid for these very fluctuating energy sources
2 provide a technology to actually store power for the moments there is not enough power generated
3 while performing steps 1 and 2, develop efficient solar panels and windmills, tidal power plants and biomass electric plants from scratch instead of converting existing power plants into green, but very inefficient power plants.
4 with steps 1,2 and 3 done, build it and the switch to renewable energy would go fine.
finally: make renewable energy accessible for everyone. here in Belgium it’s not interesting anymore to have solar panels: we have to pay for the power they generate in excess so in fact when you try to unload the environment, you got taxed for it, because you distribute your generated power onto the power grid.
so in the actual stages, is it about “saving climate” or is it about “saving wallets”? To me it smells at this moment more like “saving wallets” then saving climate
and finally when you load a climate and energy debate with “left and right politics” you ain’t gonna get nowhere. you have to stay above that paradigm and work with facts.
Think about it this way: all the money spent for this climate debate and to the IPCC is lost money for a non pollutant gas. If all this spent money was used to, for example, clean all the plastic waste in the oceans, our oceans would have been clean again.
then at least one serious environmental issue would have been actively dealt with.
ever thought about that?
What I continue to find compelling (even more so with this latest report confirming the pause in GW – w/ Michael Mann’s name on it ), is that during the period between 1950 – 2014, some 64 years, during which the consensus supports the view that there is a human footprint on global temperature (AGW), we’ve only experienced some 29 years (using 1950 as the starting date) of significant warming. Even then, only some the warming is believed to be caused by anthropogenic greenhouse gases.
29 out of 64 years. Less than 1/2.
And, as CO2 continues to rise, there is less and less GW.
The new paper does not corroborate a pause or hiatus. From the study:
A warming slowdown is thus clear in observations; it is also clear that it has been a ‘slowdown’, not a ‘stop’.