UPDATE: 2/25/16 DMI offers an explanation and an apology here
One of the graphs we have had on the WUWT sea ice page has been the DMI graph showing 30% concentration of sea ice extent, there has been a widening divergence between the two Arctic sea ice extent graphs produced by DMI. WUWT reader David Burton writes:
Until a few days ago, Denmark’s Meteorologiske Institut (DMI) graphed Arctic sea ice extent two ways. They had a graph comparing the current year to the preceding ten years’ “30%+ concentration” Arctic sea ice extent, with coastal zones masked out, by graphing each year in a different color on the same horizontal timescale.
They also had (and still have) a graph comparing the current year to the preceding four years’ “15%+ concentration” Arctic sea ice extent (and I don’t know how they handle coastal zones in that version). In both graphs, the current (partial) year is plotted with a heavier black line.
Until a few days ago, depending on which graph you choose, you could “prove” that Arctic sea ice extent is either the highest (in the “30%+” graph) that it’s been in the last eleven years, or the lowest (in the “15%+” graph) that it’s been in the last five years.
On 2016-02-18 DMI discontinued the “30%+ concentration” version, which showed high recent ice extents.


This is how DMI describe their 30% graph data:
Total sea ice extent on the northern hemisphere since 2005. The ice extent values are calculated from the ice type data from the Ocean and Sea Ice, Satellite Application Facility (OSISAF), where areas with ice concentration higher than 30% are classified as ice.
The total area of sea ice is the sum of First Year Ice (FYI), Multi Year Ice (MYI) and the area of ambiguous ice types, from the OSISAF ice type product. However, the total estimated ice area is underestimated due to unclassified coastal regions where mixed land/sea pixels confuse the applied ice type algorithm. The shown sea ice extent values are therefore recommended be used qualitatively in relation to ice extent values from other years shown in the figure.
Compare the description of the other DMI graph of sea-ice extent at 15% concentration:
Total sea ice extent on the northern hemisphere during the past years, including climate mean; plus/minus 1 standard deviation. The ice extent values are calculated from the ice type data from the Ocean and Sea Ice, Satellite Application Facility (OSISAF), where areas with ice concentration higher than 15% are classified as ice.
The total area of sea ice is the sum of First Year Ice (FYI), Multi Year Ice (MYI) and the area of ambiguous ice types, from the OSISAF ice type product. The total sea ice extent can differ slightly from other sea ice extent estimates. Possible differences between this sea ice extent estimate and others are most likely caused by differences in algorithms and definitions.
Paul Homewood notes on his blog:
Now there may be good reasons for this difference, and it must be pointed out that DMI has never stated that there is any problem with the 30% version, or reason to doubt it.
Assuming both are right, we have a situation where there may be less ice in coastal regions and/or less 15% ice, but more of the 30% concentration. Given the fact that some of the mixed land/sea pixels can confuse the algorithm, there is good reason to think the 30% version is actually more reliable.
But the real problem is that DMI has now withdrawn their 30% graph, offering this explanation:
I have removed the old sea ice extent graphics and the new graphics (http://ocean.dmi.dk/arctic/icecover.php) is now our one and only official sea ice extent.
When I introduced the new graphics I also announced that the old graphics would be removed after some time – and now is the time, sorry.
I spend too much time explaining the differences and it was quite confusing for many – so, I decided to remove the old graphics. However, all the data are available here http://osisaf.met.no/p/ if you would like do the plotting your selves.
The link for the data which they offer is not of any use to laymen, so effectively the DMI has withdrawn this data from the public eye. Now, when the old link is clicked, we get this:

There has been so much skulduggery going on in the climate establishment in recent years that it is hard to avoid the conclusion that this graph has been withdrawn simply because it gives the “wrong” results. I may be being harsh, but if DMI wants to avoid these sort of accusations, the answer is imply to restore the graph, whether convenient or not.
I would tend to agree.
There is clearly no equipment failure, nor computing failure, it’s simply the person in charge of the product has become irritated at having to explain the differences with the 15% graph to the public. Instead of simply creating an explanation page to link in the 30% graph page, he simply disappeared it to make his job easier. That’s some really lazy science, and does not serve the public interest, something DMI is tasked to do by their own mission statement:
Mission and vision
Mission
We create and communicate knowledge about weather, climate and seas for the benefit of society.
Vision
We are a world-class meteorological institute. We help citizens, public authorities and private companies to transform knowledge into safety and growth.
Whether it is “skullduggery” or not as Homewood notes, climate science has this continuing habit of not showing adverse results, something Steve McIntyre has noted on more than one occasion through the years.
Since we are still learning about sea ice trends, factors, and effects (unless you are one of those who think the science is settled and nothing more to learn) it seems to me that this graph offers an important insight into change in the Arctic that can’t be seen [elsewhere], that may be a precursor to change at the 15% concentration level.
Given their mission statement, I think DMI should restore the graph. For those that agree, you can contact them at: kontakt@info.dmi.dk If you do email them, please be respectful and cordial; accusations, rants, and anger won’t really mesh with them wanting to cooperate with the public.
UPDATE: The typical haters, such as Neven Acropolis, are making claims in comments that I see this as some sort of “conspiracy”. I do not and any such claim is false and political in nature. I see this as nothing more than a DMI employee who has become annoyed at having to answer questions about the 30% graph, and made a decision to pull it, something supported by the DMI reply email posted by Paul Homewood. In that email DMI doesn’t explain why they’ve chosen to remove it and only make the 15% graph official, only that they have.
WUWT readers may recall that once before I was accused of making conspiratorial thinking when NSIDC’s graph went wonky, even NSIDC told me it “wasn’t worth blogging about” only to have egg on their faces days later when it was clear the satellite data had failed, and it was the result of the instrument on the spacecraft, something I alluded to. That pretty well silenced those people, but of course they never apologized for it.
Given that the DMI 30% graph is made from the same satellite data as the 15% graph, people such as Neven will have a very hard time claiming that somehow the the 30% graph is flawed, and the 15% graph is not. There’s no separate satellite instrument to capture 15% vs. 30%, as that is done in post processing, so we can rule out equipment failure as an issue.
As I noted, Steve McIntyre has shown through the years that there is a tendency in climate science to not publish adverse data and/or results that are inconsistent with conclusions of papers and institutional outlooks. This may be one of those times, or it may simply be a grumpy product manager who is tired of answering questions about it. Hopefully DMI will clarify their position and give a credible explanation as to why they have removed it.
UPDATE2: Commenter “pethefin” notes that DMI has an entire page dedicated to the use of the 30% concentration value that is still operational:

Source: http://ocean.dmi.dk/arctic/climatology_v2/extent.uk.php
The continuation of 30% product types like this by DMI makes it pretty hard for some people to credibly claim that somehow the 30% graph that was removed was flawed where the 15% graph made from the same satellite data is not.
In reality it looks like we hit maximum ice coverage a few weeks early and abnormally low. It’s going to be a difficult one to explain away. http://nsidc.org/data/seaice_index/images/daily_images/N_stddev_timeseries.png
Compare to 1974 ? Difficult ?
Sea ice extent depend a lot upon how spread out it is. Sea ice area is more relevant to estimation of sea ice volume ( which is what we probably really want ) and feedbacks relating to open sea that is exposed.
Sea ice area 2015 was on a par with 2006. That is the inconvenient truth that the DMI 30% was also showing.
http://climategrog.files.wordpress.com/2015/12/ct_ice_area_short_anom_nh_2015_final.png
https://climategrog.wordpress.com/2013/09/16/on-identifying-inter-decadal-variation-in-nh-sea-ice/
Gareth, Its really no big deal anyway, there was an article on WUWT last year or so, showing an inverse relationship between max and min. Meaning, if lets say a winter had a minimum extent, that following had a growth over the previous year in summer minimum extent. If you look at all these, ‘sky is falling’ January temps, you see this huge RED blob over the Arctic. If sea Ice is as low as the satellites say, I believe we are witnessing an absolute hemorrhaging of Ocean Heat Content in the Arctic due to the fact the insulating blanket of ice is just not there.
What does this mean, who actually knows, we shall see. We are currently heading towards a solar minimum during a exceptional low solar cycle. El Nino, has spent a tremendous amount of Heat content in the tropical Pacific. Does this all add to a very cold year next year? We shall see!
brian wrote, “If sea Ice is as low as the satellites say, I believe we are witnessing an absolute hemorrhaging of Ocean Heat Content in the Arctic due to the fact the insulating blanket of ice is just not there.”
Agreed. That’s one of the negative climate feedbacks which are very rarely mentioned, but help to regulate the Earth’s temperature, and attenuate the effect of climate forcings.
W/r/t ENSO, the historical record strongly suggests that the current strong El Nino will end this summer, and La Nina (cool) conditions will follow for two years or so. In fact, NOAA’s weekly ENSO status report (Feb. 22 edition) predicts, “El Niño conditions are present… A transition to ENSO-neutral is likely during late Northern Hemisphere spring or early summer 2016, with a possible transition to La Niña conditions during the fall.” (p.3)
Although Solar Cycle 24 has been very low in terms of sunspot activity; it has actually exceeded SS23 in terms of Top of the Atmosphere, Total Solar Irradiance as displayed on the SORCE web site. This throws into question the whole Sunspot/TSI proxy for past solar cycles. http://lasp.colorado.edu/data/sorce/total_solar_irradiance_plots/images/tim_level3_tsi_24hour_640x480.png
It’s not at all difficult to explain or even important.
1) Arctic maximum sea ice extent is mostly on account of the sea ice variability in the Barents Sea.
2) The Barents Sea ice variability is on account of the Atlantic Multidecadal Oscillation Index (AMO), showing positive correlation and a clear causation.
3) The AMO is currently positive and is contributing to the decrease in sea ice extent in the Barents Sea.
4) Estimated sea ice extent itself is highly dependent on the interpretation.
Given these facts, the Arctic Sea Ice apocalypse has been cancelled.
I thought the AMO had peaked a year or two back and was on the way down. Did it change course?
I simply cannot believe the Ice-pocalypse is cancelled. Once I get my tax return, I am going to put a kayak on layaway at the sporting goods store, and plan my kayak trip to the North Pole. The real North Pole – not that magnetic one. The real one with the penguins and all.
Then you all will not be laughing anymore about the disappearing Arctic Ice. -please post any groupon for kayaks – my money is a little tight this year.
@TheLastDemocrat: may be you can team up with Prof Christmas Turkey to share funding. You can do a census of the penguin population and prove they’ve all been killed by global warming and chaniging habitat !
Actually, MASIE shows an average year is in progress, and peak ice extent is not yet established. BTW, MASIE has 4 km resolution and a 40% threshold for counting a grid cell as ice. I is regarded even by NSIDC as more accurate at this time of the year,
https://rclutz.wordpress.com/2016/02/18/icy-arctic-mid-february/
http://www7320.nrlssc.navy.mil/hycomARC/navo/arcticsstnowcast.gif
Notice how several areas of estimated sea ice max in 1979 coincide with areas that are currently between 0 to -2 degrees C (probably patchy ice and slush), e.g. area north of Iceland. It makes me wonder how much has actually changed in the Arctic if the difference between sea ice in 1979 and now hinges on the interpretation on whether vast areas covered in more or less than 15% ice.
From the chart of currents in the Arctic it looks like they are pushing the pack together, which of course leads to smaller extent. Ice thickness, however, looks to be quite healthy meaning that the summer melt may proceed slower than normal.
No, Gareth, no reason to say that. Both poles are now rising, see Cryosphere, and likely will bump along for a while yet. Whiile some very interesting things may start to happen….
You seriously can’t be claiming that maximum ice coverage has been reached early based on that.
It certainly looks like that, and even if I am wrong, with only a couple of weeks of potential freezing left, it is highly unlikely to reach an average, or even get anywhere near. The next week should be very informative. I’d like to be wrong, but sometime we cannot ignore issues of obvious concern.
No Gareth. look at the other years. There are similar dips and rebounds. I’m not predicting the opposite.
I note that when ice coverage is high, it tends to get a lot of coverage here, when it is low various rationales are put forward. If scepticism regarding climate change is to be taken seriously, you have to address all situations with equal attention.
Gareth-
Let’s say that the region we are measuring is 10 million square kilometers. (nice round number) One year the maximum is 9.5 million sqkm is covered with sea ice completely….no ocean to be seen whatsoever inside of that one big sheet (but .5 million sq kms of water outside of it) That would register as a 9.5 million sqkm “extent”. The next year however, there is the same amount of sea ice, only it breaks up and floats further out into the ocean…doesn’t stay in one solid sheet or place. That year the sea ice is the EXACT same amount (9.5 million sqkms) but it spread out more…to the whole 10 million sqkms! The second year’s “sea ice extent” would be larger/greater/higher than the previous year, but the actual amount of sea ice would be exactly the same.
Most people don’t go announcing that we’ve reached maximum ice extent until the actual ice extent starts breaking even or falling. And what if it is low this year? What is considered “normal”? To the NSIDC where your link leads to, that appears to be the years 1981-2010. Is that 20 year period “the norm”? The “average” for the Arctic on planet earth? What if we stepped back in time and found that the ice “extent” for 1981-2010 was an anomaly? Or part of an anomaly? What if “normal/average” for the sea ice extent over the Arctic region over time is actually 5 million square kilometers?
It’s not necessary to explain away anything. All human kind can currently do is measure stuff and say “hey look….greater than, smaller than, or right on…since we started taking measurements”. And then take all kinds of wild guesses as to why the current measurements might be different than the past ones.
Aphan says: “To the NSIDC where your link leads to, that appears to be the years 1981-2010. Is that 20 year period “the norm””

…
Aphan is mathematically challenged.
..
1981-2010 is not 20 years.
[We appear to have a scammer here, two comments placed 10 minutes apart, one from Nigeria, the other from France. A disposable email address too
– further replies go to the bit bucket -mod]
Opps! My brain was saying 29 years and my hands were typing 30 for a combo of 20 years. (left brain and right brain are constantly at war) Thank you mod for the benefit of the doubt. 🙂
Aphan, taking your example a bit further. In each case the sea ice area should be the same. If the ice broke up so every pixel had 20% ice (and 80% open water) the 30% extent would be zero, since no pixel has more than 30% ice. Imagine further that each pixel was 1km2. The 15% extent would be huge, about 50MKm2, since instead of 9.5m pixels with 100% ice, we would have about 50 million pixels with 20% ice, each one counted within the 15% sea ice extent.
This shows us that breaking up the ice increases 15% extent and reduces 30% extent. Last year the 15% and 30% were non-exceptional. If we try to imagine a physical situation that would lead the 15% to be at a low and the 30% ice to be at a high for the time of year (since satellite records began), then we would require a large area of 15% ice to have become compacted to above 30%, compared to last year. Since the 30% graph was not only depicting a record high for the time of year, but a large increase on previous figures, we are looking for something quite exceptional in the packing of the ice. This is not observed.
Anthony, the answer is simple: The old graph is highly, highly likely incorrect. There is no conspiracy.
Neven Acropolis (assuming that’s your real name). Show me one place there’s the word “conspiracy” in this post. Yet, you use the word where I have not. Stop making stuff up just to support your clear hatred of me and WUWT as illustrated in your constant derogatory comments elsewhere (yes people send them to me). Shame on you.
“The old graph is highly, highly likely incorrect.”
Then show us where DMI has made this claim that the science behind a 30% concentration graph is flawed, but somehow the 15% concentration graph take from the very same satellite data is not.
I think you are just simply projecting your own bias onto what you think might be true, but isn’t actually supported by the science.
Then there’s the email from DMI that Paul Homewood posted that says clearly that the person got tired of answering questions about it and thus removed it.
Your ridiculous claim doesn’t hold water (or ice for that matter).
A commenter at my site named named “geran” got this comment from DMI.:
“I have removed the old sea ice extent graphics and the new graphics (http://ocean.dmi.dk/arctic/icecover.php) is now our one and only official sea ice extent.
When I introduced the new graphics I also announced that the old graphics would be removed after some time – and now is the time, sorry.
I spend too much time explaining the differences and it was quit confusing for many – so, I decided to remove the old graphics. However, all the data are available here http://osisaf.met.no/p/ if you would like do the plotting your selves.
Best regards
Ulrik
Kundeservice/Customer Service
DMI “
Thanks Caleb, for that reference, I’ll update the post to reflect that.
excellant
[snip – after your claim of “conspiracy ideation” (see the screencap upthread) I’m not obligated to provide you a forum here until you post my update explaining that I don’t believe there is one on your blog in it’s entirety. I’m happy to entertain valid comments about the science, but I am not obligated to take abuse from you – Anthony]
Neven really is a piece of work. like most of these Lewandowsky inspired haters, he immediately seizes on “conspiracy ideation” at his blog:

Anthony, I’m confused. Your screen capture of Neven’s post shows the text “sprinkled with some suggestive conspiracy ideation,” which you object to. A key word there is “suggestive”. I would certainly consider this passage to be suggesting a conspiracy:
“There has been so much skulduggery going on in the climate establishment in recent years that it is hard to avoid the conclusion that this graph has been withdrawn simply because it gives the ‘wrong’ results.”
Perhaps it’s not an outright accusation of a conspiracy, but I would say it is suggestive of one. Now, I would like to get to the bottom of exactly why this graph has been discontinued just as much as anyone here. Maybe I will be dismissed as a tone troll, but I do not agree with immediately jumping to suggestions of nefarious intent simply because a graph has been discontinued.
As evidence against such nefarious intent, I would ask why this DMI employee would continue to post the chart (and even warn that it would be discontinued far in advance) if his goal was to hide inconvenient data?
Soooo…
Who has a website that can be the new “source” for the 30% plot and update it regularly. I don’t, but I’ll bet someone here has the ability to maintain this plot. All the data are still available!
The plot can continue to live on, can’t it? Should we just resign ourselves to the fact that DMI won’t play with us anymore and cry about it or just whine about “skulduggery”? What am I missing here?
The AGW group was already calling the graph erroneous and anyone using it liars. That’s not going to be any worse if someone who is a skeptic or luke-warmer plots it and refers it back to the actual satellite data.
Neven is is also the kind of bigot who removes content from his site that does not fit his hysterical world view. Like most alarmists, he pretends to be having a scientific discussion but only accepts the “science” that agrees with his alarmism.
Since it seems that just one guy is doing all the work and calling the shots at DMI’s website, it can hardly be a ‘conspiracy’. But there is a conspiracy of intent with all these alarmists who select what “science” is acceptable and what evidence is not to be seen.
That is not an organised conspiracy, just normal human bias and political activism. The antithesis of science, masquerading as science.
“The old graph is highly, highly likely incorrect.”
Then show us where DMI has made this claim
Here it is:
“However, the total estimated ice area is underestimated due to unclassified coastal regions where mixed land/sea pixels confuse the applied ice type algorithm.”
Seaice1, since you seem to have connections with the DMI, would you try to explain why the DMI under another graph:
http://ocean.dmi.dk/arctic/climatology_v2/frzbrkowd_mean.uk.php
under heading “Days of open water”
says that
“The number of days of open waters for a given point is defined as the interval between the sea ice concentration falling from greater than 30% to less than, and remaining so for at least 5 days, until the ice concentration again climbs to above 30%, and stays so for at least 5 days”
In other words, defines 15 % sea ice coverage to be open waters? Which is it?
And before you jump to explanations, rather similar definitions by the DMI are found under the same webpage under “Freeze-up dates” and “Break-up dates”.
Seaice1, here are the other definitions by the DMI:
Under “Break-up date” they say that
“The break-up date for a given point is defined as the date where the sea ice concentration falls from above to below 30% and remains so for at least 5 days”.
Interesting, considering the decision to follow 15 % ice coverage instead of 30 % in the future. So from now on the DMI want’s us to follow, in their own words, broken-up sea ice, instead of the perennial sea-ice.
Under “Freeze-up date” they say:
“The freeze-up date for a given point is defined as the date where the sea ice concentration climbs from below to above 30% and remains so for at least 5 days”.
All this is becoming very unbecoming for the DMI.
seaice1 says
February 23, 2016 at 2:03 am
“The old graph is highly, highly likely incorrect.”
Then show us where DMI has made this claim
Here it is:
“However, the total estimated ice area is underestimated due to unclassified coastal regions where mixed land/sea pixels confuse the applied ice type algorithm.”
================================================================
So seaice1, they are not saying it is incorrect at all for the area it covers. Since DMI always stated the the inaccurate “confused” costal areas were masked, they are not stating the 30 percent graphic is incorrect are they? They are saying they exclude an area of costal regions that confuse, (read makes inaccurate) the ice type algorithm Thus the non masked 15% graphic is inaccurate or “confused” correct? and the 30 percent graphic is “underestimated”. yet accurate for the area covered. So why discontinue a accurate 30 percent graphic? Currently there is about 500,000 sq. kilometers of above the mean 30 percent ice. If that ice was instead moved out into the below 15 percent area, how much larger would the 15 percent ice be?
Clearly the charts combined give a more accurate picture, there is more ice now, but it is more concentrated.
If you disagree say why?
Pathefin –
I really don’t understand the problem you are having.
For the purposes of determining sea ice extent:
15% sea ice extent counts the total area of every pixel with at least 15% ice in it.
30% sea ice extent counts the total area of every pixel with at least 30% ice in it.
For the purposes of determining “open water” a pixel must have less than 30% ice cover for more than 5 days.
So it would seem that pixel might be counted as both open water and included in the 15% sea ice extent. I don’t see any problem with this since we are measuring different things for different purposes. For the purposes of microscopy, an object is big if it above a few microns. For the purposes of shipping it is small if it is less than a meter. The definition of when a pixel is counted as ice covered or not is somewhat arbitrary. As long as we are consitent I don’t think it matters (within limits).
Incidentally, for the purposes of determining sea ice area, a pixel with 15% ice is measured as 0.15 x pixel area. The ratio of area to extend gives a measure of how “broken” the ice edge is.
David A.
I realise now that Neven did not mean the same thing that I pointed out, but it does seem that “underestimated” is approximately the same as “innaccurate”. You are correct, the DMI make the measurement “accurate” by specifying that the measument is not actually sea ice extent, but some sub-set of sea ice extent with the coastal areas removed. So we can say that it is accurate only if we include the caveat that it is not really measuring sea ice extent.
It is also likely that the displayed 30% graph is innacurate for the end of 2015 and 2016, but not for the same reason.
As Pathefin shows below, the thick black line used to slowly rises above the rest, and then continue above the rest into 2016. This happened after the DMI announced that they were to discontinue the 30% graph. The most likely explanation is that the simply stopped maintaining it, and it drifted off. When the published the “final” graph they did some QC on the 2015 data, and the unexplainable rise disappeared. Why is this the most likely explanation? Because it is very very hard to explain 30% ice at a maximum and 15% ice at a minimum.
“Currently there is about 500,000 sq. kilometers of above the mean 30 percent ice.”
How do you know this?
“If that ice was instead moved out into the below 15 percent area, how much larger would the 15 percent ice be?”
Not sure what you are getting at here. Imagine a pixel that was just included in the 30% extent, that is, 30% of the area was ice covered. This pixel would also have more than 15%, so the 15% extent would be the same as the 30%. If we now spread this out evenly, we would have 2 pixels with 15% ice. The 30% extent would be zero. By spreading out the ice we increase the 15% extent and reduce the 30% extent.
If we were to suppose that both graphs are correct, then 30% extent is higher than ever, and 15% is smaller than ever. It is very difficult to see how this could possibly be the case. One possible explanation is that the ice has become more compact, but that is not happening, as shown by other data, such as ice area.
Brian (at 2:51pm, 2/22/16):
1. You are confused because you need to read the post more carefully. The quote you attribute to Anthony is Paul Homewood’s.
And Homewood’s suspicions are highly logical, given the history of the AGW community, thus:
2. You are confused because you have so little knowledge of the past 10 years (and more, really) of the AGWer’s data shenanigans (proven, not merely suggested).
Conclusion: Brian. You have some reading to do.
Best wishes for a profitable learning experience!
Janice
Janice, I did not attribute that quote to Anthony. I simply said it was suggestive of a conspiracy. You will note that Neven’s post did not attribute it to Anthony either, rather saying this post is “sprinkled with some suggestive conspiracy ideation”. Regardless of who the conspiracy ideation is attributed to, it is indeed suggested in this post. Perhaps it is you who needs a more careful reading.
“Conspiracy ideation”? OOOOOhhh you sound so Lewandowsky there! Paranoid, irrational, and completely inept at observing and interpreting human behavior accurately/honestly/objectively.
“A conspiracy theory is an explanatory or speculative hypothesis suggesting that two or more persons or an organization have conspired to cause or to cover up, through secret planning and deliberate action, an event or situation typically regarded as illegal or harmful.”(wiki)
Suspicious is defined as “causing doubt, questionable, wary, skeptical, apprehensive”. Certain behaviors are NORMALLY looked upon as “suspicious”. If I see something suspicious, and I report it or bring it to other people’s attention, that makes me doubtful, wary, apprehensive of that particular event. In order for YOU to even begin to credibly INSINUATE that anyone here MIGHT be a conspiracy theorist, you have to provide evidence to support that the person in question has behaved in a manner that meets all of the criteria in the most universal definition of that term. Not what YOU say it means. Not what you THINK someone else is acting like.
YOU CANNOT READ MINDS. And slapping irrational, cognitively biased labels on other people because you THINK poorly of them, is always going to make YOU look irrational and cognitively biased. Period.
Anthony, FWIW, I noticed the discrepancy appear last fall and then saw the graph disappear shortly after, maybe 2 weeks or so of the discrepancy appearing. Being a cynical old soul, I’ve been waiting for another shoe to drop. The timing could, of course be coincidental. But it was an awfully inconvenient data series for the narrative.
Aphan, is your comment addressed to me? I am not the only one here who sees suggestions of conspiracy ideation. Consider this comment: http://wattsupwiththat.com/2016/02/22/dmi-disappears-an-inconvenient-sea-ice-graph/#comment-2150858 or this one: http://wattsupwiththat.com/2016/02/22/dmi-disappears-an-inconvenient-sea-ice-graph/#comment-2151133. They both meet the definition you posted, as they involve covert direction or pressure from large organizations.
I’m simply pointing out that I think claims of nefarious intent are a bit premature in this case. If you’re going to promote such claims (especially in the title), you shouldn’t be surprised if conspiracy ideation accusations are made. Others here have expressed similar thoughts.
seaice1 says, ” So we can say that it is accurate only if we include the caveat that it is not really measuring sea ice extent.”
===========================================================
No, it is specifically measuring sea ice extent in a given area excluding the “confused” costal zone, so is actually more accurate. You then make up, whole cloth, from your own private conjecture an ad-hoc reason why the data DMI regularly updated for ten years is wrong. DMI has not said anything of the kind. 15% ice is 85% water, open ocean, and disparate weather and wind pattern move it around easier. This is how one storm can easily reduce or extend area in low sea ice conditions. Of course it can at times be more compact.
There has been so much skulduggery going on in the climate establishment this is just par for the CAUSE!
Conspiracy theorist Neven.Its all the same to you people.Conspiracy all the way down.
Last animation before it was discontinued I he seen
https://twitter.com/KiryeNet/status/700372283357941760
Let’s see when the DMI discontinues these charts as well since they are also using the 30 % coverage:
http://ocean.dmi.dk/arctic/climatology_v2/extent.uk.php
This claims >30% extent :
The Cryosphere Today
Compare Daily Sea Ice
Left panel date: Right panel date:
Historic snow cover data not displayed on these images. Sea ice concentrations less than 30% are not displayed in these images. Snow cover data is displayed only for most recent dates.
return to The Cryosphere Today
second is cryosphere.today.no.date.available.image.jpg
http://igloo.atmos.uiuc.edu/cgi-bin/test/print.sh?fm=01&fd=01&fy=2007
The graph i get for http://ocean.dmi.dk/arctic/climatology_v2/extent.uk.php only goes to 2014.
Lee, yes but I would assume that those graphs would not be updated automatically but e.g. once year since they necessitate calculation of the 5, 50 and 95 percentile for each month. In other words, there´s no need to hurry to a conclusion.
Perhaps the removed graph was an inconvenient truth.
It was F. Ross. The 30% graph would get used to show that sea ice coverage WAS increasing because the graph made it easy to see and demonstrate that areas with more than 30% ice to water ratio were GROWING in number. But every time a skeptic used that graph as evidence to back up their claims, someone on the AGW side would post the 15% graph and say “LIAR” because that graph, while looking similar, makes it appear as if there is LESS sea ice, rather than more. I cannot tell you how many times I directed people fighting about the graphs back to that website and said “Look…READ the descriptions to the left of the graphs….they both display DIFFERENT measurements and they are BOTH probably accurate.”
Almost without fail, the AGW supporter in the discussion would then call me “a liar”, or tell me that they “both COULD NOT be correct”, or after the site started declaring that they were going to discontinue the 30% graph they would say “Well OBVIOUSLY the 30% graph wasn’t as accurate so they are going to stop presenting it”….or something along those lines. It was maddening. And I’m sure if regular commenters on the web were taking flak for it, the site owner was probably getting hate mail daily for it.
Rather than standing up and clarifying the two better, or making a bright red note on the 30% graph that said something like “Hey idiots…the graphs measure two different ice/water contents and are both right” (except in more polite terms) I personally believe that the guy who runs the site just took the easy way out and discontinued the 30% graph. No conspiracy. Just laziness or weariness from the constant nagging from anyone who disliked the fact that the graph even existed. Either way, it’s a sad day when scientific information has to be withdrawn because someone else doesn’t LIKE it.
Perhaps. I haven’t kept track, but it seems to me that each time one of these incidents occurs, it seems to always favor the alarmist side. But since I haven’t kept track, I may be suffering from just noticing when it is a blatant change which would add to my unsupported bias. On the other hand, if the mistakes went both ways 50/50, I’d be much more inclined to give stuff such as this the benefit of the doubt. I also acknowledge that even with 100% past alarmist incidents, this one could still be explained by something other than conspiracy. A sample size of one does not a good statistical analysis make. So lets watch and see what happens.
If anyone has kept track of which side the mistakes seem to favor, that would be nice to know.
I have posted the 15% plot in response to several posters here. I have never called anyone posting the 30% graph a liar.
“Well OBVIOUSLY the 30% graph wasn’t as accurate so they are going to stop presenting it”….
More likely that after they decided to discontinue it it became less accurate. They simply stopped maintaining a discontinued product.
Why did they decide to discontinue it? I think the clue is in the descriptions. The 30% plot: “However, the total estimated ice area is underestimated due to unclassified coastal regions where mixed land/sea pixels confuse the applied ice type algorithm. The shown sea ice extent values are therefore recommended be used qualitatively in relation to ice extent values from other years shown in the figure.”
So they decided to discontinue the plot that used an algorithm that was confused by mixed coastal pixels. “Less accurate” seems to be a reasonable way to put this, but not the words used by DMI. They announced this, and said that it would continue to appear for a while. During this period the results appear to drift, probably as the product was not being maintained. You will see the thick black line slowly wandering upwards towards the end of 2015. In the final plot, they appear to have applied some maintenence. The 2015 plot on the final graph no longer wanders above the rest.
Seems a very simple explanation.
A much less likely explanation is that 30% sea ice was the highest ever, whilst the 15% sea ice awas the lowest ever. This is not supported by any other evidence.
seaice1 says
February 23, 2016 at 2:03 am
“The old graph is highly, highly likely incorrect.”
Then show us where DMI has made this claim
Here it is:
“However, the total estimated ice area is underestimated due to unclassified coastal regions where mixed land/sea pixels confuse the applied ice type algorithm.”
================================================================
So seaice1, they are not saying it is incorrect at all for the area it covers. Since DMI always stated the the inaccurate “confused” costal areas were masked, they are not stating the 30 percent graphic is incorrect are they? They are saying they exclude an area of costal regions that confuse, (read makes inaccurate) the ice type algorithm Thus the non masked 15% graphic is inaccurate or “confused” correct? and the 30 percent graphic is “underestimated”. yet accurate for the area covered. So why discontinue a accurate 30 percent graphic? Currently there is about 500,000 sq. kilometers of above the mean 30 percent ice. If that ice was instead moved out into the below 15 percent area, how much larger would the 15 percent ice be?
Clearly the charts combined give a more accurate picture, there is more ice now, but it is more concentrated.
The DMI not only discontinued the 30 % coverage graph, they also totally removed the beginning of 2016, and reinterpreted the data for fall 2015, which made the rise since fall 2015 disappear. No explanation were given. Just compare what they show now with this:
http://web.archive.org/web/20160217095707/http://ocean.dmi.dk/arctic/plots/icecover/icecover_current.png
Mod! Check out this article. It explains the problem with “Climate Science”
http://quillette.com/2016/02/15/the-unbearable-asymmetry-of-bullshit/
“In other words, science is flawed. And scientists are people too. While it is true that most scientists — at least the ones I know and work with — are hell-bent on getting things right, they are not therefore immune from human foibles. If they want to keep their jobs, at least, they must contend with a perverse “publish or perish” incentive structure that tends to reward flashy findings and high-volume “productivity” over painstaking, reliable research. On top of that, they have reputations to defend, egos to protect, and grants to pursue. They get tired. They get overwhelmed. They don’t always check their references, or even read what they cite. They have cognitive and emotional limitations, not to mention biases, like everyone else.”
Pethefin I think you´ve nailed them. The way to handle this is to write to Danish newspapers and advise government officials. The danes do not like corruption, fraud ect.
What!?
They love it, if it is profitable.
Sea ice extent, either 15% or 30% is not as useful in climate change research as sea ice area. Area of exposed water is a factor in calculating sink rates and radiation rates. Extent area is more variable than area because of wind effects. It is useful in ship navigation.
I prefer to look at the fine print, but I didn’t work on “climate change”. Looking at a yearly plot seems to be a waste of time if one is trying to understand what may be going on.
My interest in this topic came about when I was working on projects to estimate the feasibility of navigating through the Northern Sea Route. We were interested in trends, and looked carefully at spots like the Kara Gate. So I’m fairly familiar with the area (I even had the pleasure of walking on the sea ice off Arctic Russia).
It seems to me the open water is mainly in the Barents, the Pechora and a bit in the Kara. And when there’s open water like that snow fall increases over surrounding areas. So this may be a feedback, which tends to increase the overall thickness and mass of the ice field.
So if you want to guess at what’s happening focus on the Barents, check ice thickness, and figure out what that ice will do from March to September. I don’t think the ice mass or extent has peaked.
The ice in the Laptev and Wast Siberian Seas seems thicker this year.
The graphs showed measurements of sea ice. Whether those are useful in climate change research or not, is up to the researcher. Whether or not that researcher is calculating sink rates or radiation rates or snow cone rates is irrelevant to the actual measurements.
“Sea ice area” and “sea ice extent” are pretty much interchangeable terms unless specified. When people state there are 3 million miles of sea ice somewhere, that does NOT mean it’s floating around in one solid piece. It means that collectively, in that region, at a given time, there was enough sea ice to cover 3 million square miles. An “area” in which the sea ice to water ratio is 30% or HIGHER means the sea ice is more concentrated in that “area” than it is in another “area” in which the sea ice to water ratio is 30% or LOWER.
“Sea Ice” by definition means ice actually free floating in the oceans. Period. It’s not glacial ice extending out over the water, or ice “shelves” that are half on land and half in water…so we can assume that there are going to be areas of exposed water around it, and that those areas are ALSO “variable because of wind effects” and melting and sinking etc.
““Sea ice area” and “sea ice extent” are pretty much interchangeable terms unless specified.”
Not quite. Sea ice extent will always be greater than sea ice area. For 15% extent, every pixel that has at least 15% ice is counted as “ice” – that is, the area of the pixel is added to the extent. It does not mean that there is 15% ice in the “area” under question, but in the individual pixel.
For area, a 15% covered pixel will be counted as 0.15 x pixel area.
The “area” is physically more meaningful but requires a great deal more processing, and hence is more prone to error. For example, when melt water sits on top of ice it is may be incorrectly counted as water.
15% is 15%. 15% of a pixel is then translated into millions of square kilometers in which there is 15% sea ice. The charts do not show measurements in millions of square pixels. The chart linked to by Gareth in the first response-from the NSIDC states at the top- “Arctic Sea Ice Extent- (area of ocean with at least 15% sea ice)” so it does in FACT mean “that there is 15% ice in the “area” under question” and NOT an individual pixel.
Yes, sea ice extent IS greater than sea ice area, but charting actual “sea ice area” is nearly impossible as sea ice changes day to day, melts, breaks up, forms again, clumps together etc. How on earth could you possibly know if you were measuring the same chunk of ice over and over again, or missing it entirely? So I don’t know of any organization that publishes charts of actual “sea ice area.” (I know a lot that publish charts of land ice area…but that’s because it doesn’t tend to move around a lot) Do you? Which is why when people say “sea ice area” they more than likely mean “sea ice extent” or the extent of areas in which there is X% of sea ice because actual sea ice area isn’t ever really measured or quantified as such.
[The University of Illinois provides a daily Arctic and Antarctic sea ice area record, and a sea ice anomaly record and plots, available back to 1979. See the WUWT links list at the bottom of the WUWT Sea Ice page. .mod]
Here is one.
http://arctic.atmos.uiuc.edu/cryosphere/arctic.sea.ice.interactive.html
Current area is 12.6 MKm2, compared to over 14 mKm2 fro 15% area. This time last year it was 13.0 MKm2.
This — lack of accurate information — is how you end up on the “ship of fools.” If I recall correctly, there are at least two cruises planned for later in the summer through the Northwest Passage. Assuming the 30% chart was correct, these cruises will run into serious ice issues, and the passengers could be held up for considerable period of time. On the other hand, if the 15% chart is correct, then the cruise passengers don’t have to worry too much, especially because the cruise ships will have an ice breaker escort.
The two charts do not conflict. As a ship move north it will encounter less 15 percent ice then normal. As it goes through the 15 percent plus area it will slowly encounter less concentration then normal, then average concentration, then more concentration then normal, about 500,000 sq K of greater then normal 30 percent plus coverage. There is not less ice.
” that may be a precursor to change at the 15% concentration level.”
The 30% graph may have predictive value of ice accumulation trends? Is this a commonly held opinion among we skeptics?
No, it is simply my observation.
That’s ok in my book. Informed opinions are the beginning of inquiry and scientific debate. Thxs.
And the good observation is one of a number of options. All things involving meteorology involve looking at a number of options, and trying to figure out which is most likely to occur. You would have to be strangely limited to only consider one option (such as, for example, only considering CO2).
I have seen meteorological events when every other run of a model creates a big storm up the east coast, but they alternate with runs that show storms that never get big and meekly drift out to sea. 50% say one thing, and 50% say another. I think it may have to do with a Strange Attractor (from Chaos Theory) which produces a graph like a figure eight. In any case, it is most definitely a situation where a meteorologist must consider more than one option.
And in such cases most of the data going into the initial run of a model is reliable. Sea-ice is different. It is very hard to be sure the data is reliable up where it is pitch dark, there is cloud cover, and winds howl with temperatures of minus forty, and nobody lives within a thousand miles. The guys working to get that data are pretty amazing, and we have little idea of the hassles they experience.
Personally I think certain people involved on the political side, who coin terms such as “arctic death spiral”, are not worth the time of day and are best left nameless. However the other guys working on increasing our understanding of arctic sea-ice do have class, and I always do my best to be very polite when asking questions. I have often received polite and lengthy replies, which is sort of wonderful, considering I’m basically a nobody.
The least they could do is try to backcast the new version for 10 years…….
But then trying to show coastal….will show less
In their defense, they’ve been saying for years that the 30% graph would be available for a while. I’m surprised they kept it around this long.
I’m disinclined to view this as anything more than what they’ve said all along that they would do.
The reason it is an issue is because of the adjustment to the 2015 plot, which makes it look suspicious to those of us who have followed this graph for years. We all knew it was going to disappear at some point, but we also know where that plot was headed.
Just want to clearify that I am not the famous Finnish Meteorologist also, coincidentally, named Timo Puhakka.
Who would have thought the there could be two of us with this name?
So, Timo, you are the Arctic version of the Corsican Twins? 🙂
“Who would have thought the there could be two of us with this name?”
I really must say, the world just keeps getting peculiarer and peculiarer, don’t it?
“Who would have thought the there could be two of us with this name?”
That happens off and on here because there’s a site pest who is an identity thief. He steals the ID’s of legitimate commenters, and posts under their hames.
Thoroughly dishonest, no? But that’s the alarmist crowd for you.
I could be an “Arctic version of a Corsican Twin”, unbeknownst to me, but I am definitely not dishonest.
A few years ago someone contacted me thinking I was a Dutch soap actor, because our names were the same.
You seem to be very familiar with this… Has the greater than 30% concentration always shown increased extent or is this a recent phenomenon?
It’s recent. Almost all the references use the 15% threshold. If you’re looking to see another view, there is this:
http://arctic-roos.org/observations/ice-area-and-extent-in-arctic
The 30% concentration chart was said to be discontinued because it UNDERESTIMATED sea ice content, not that it showed increased extent. If you only qualify areas in which there is more than 30% sea ice, as “ice”, then you are missing every other area in which there is less than 30% sea ice, but still ice. So most charting by organizations is done using at least 15% sea ice as the threshold for “ice”.
The DMI people said that they masked out the coastal regions because the algorithms they used had a hard time differentiating between “snow/ice” on the coast, and ice in the water=sea ice. Sea ice that has formed against the coast, or moved up against it, might NOT be measured because it looks like snow covered land and vice versa…they might measure snow covered land as actual sea ice. I think that makes perfect sense.
BUT….masking out the coastal regions means you automatically SUBTRACT measurable area from your sea ice data to err on the side of caution. But for some weird reason, their 30% charts don’t look “underestimated” at all…they look like they show MORE sea ice…or increased extent….rather than their claimed underestimations.
Aphan, I took what DMI said it to mean that they underestimated the 30 percent extent because they did not include costal areas that had at least 30 percent ice, thus there was always areas near the coast not included, but their graphic was more accurate because it did not confuse the data, and the area masked was consistent.
“But for some weird reason, their 30% charts don’t look “underestimated” at all…they look like they show MORE sea ice…or increased extent….rather than their claimed underestimations.”
The 30% graph shows about 11mkm2. The 15% shows over 14Mkm2. The area shows about 13Mkm2. The 30% certainly looks to be an underestimate.
I thought I made it clear in the end paragraphs that I’m not suggesting any conspiracy, simply that person in charge of the product got annoyed with having to answer questions and removed the product from public view. If that constitutes a “conspiracy” then it’s a conspiracy of one.
Anthony made it very clear, Mr. Martinez,
.
To ignore the possibility of malfeasance (as opposed to mere misfeasance) would be silly and naïve, given the historical record of the AGW community’s actions. So what if some of the science realists have suspicions about the motives of the AGWers? Those suspicions are logical, given the facts.
Their “theory” (what exactly is it, anyway? that some of the science realists are suspicious?) is meaningless anyway — and also, who CARES what some wackdoo thinks (or says)? The FACTS are the key. The facts are what Anthony’s post is about. Just ignore the name-callers.
Rest easy, Mr. Martinez. We skeptics can be bold for truth!
Janice
#(:))
P.S. Here is a thread I just happened to be reading this morning which (and it discusses just one of many such incidents) makes Paul Homewood’s suspicions highly rational:
http://wattsupwiththat.com/2008/12/13/something-is-rotten-in-norway-500000-sq-km-of-sea-ice-disappears-overnight/
Hi Janice.
Lawrence,
Wackadoos are going to do what wackadoos DO! It doesn’t matter if Anthony posted a clear, rational, completely evidence based study or his opinion after a long day, a migraine headache, and 5 beers…the reason they are wackadoos is because they will use either one to their advantage if they choose to. They might have to twist/spin/manipulate one more than the other to get what they want out of it, but a determined wackadoo doesn’t mind the extra challenge. Some of them seem to THRIVE on it.
The most hilarious/ironic thing in the world is a wackadoo screaming that people who believe in conspiracy theories are insane, not to be trusted, nutjobs….while alternatively screaming that there is a Big Oil-Think Tank conspiracy going on!!! It’s breathtakingly hypocritical but a genuine wackadoo just cannot see it for some reason. I always wonder why they think entirely rational and reasonable to declare that people like Anthony and Paul and others are being “paid” by big oil, or are part of some VAST conspiracy to kill the planet for money and greed, but aren’t rational, or reasonable enough to even pause to consider that if it was possible to keep such a massive “greed” conspiracy a secret….then it would be even MORE possible (easier) to keep a much smaller “green” conspiracy a secret. And if a scientist can be “bought”…then he’ll sell his soul to either side for the right price.
They undermine their own arguments and credibility every time they speak. So let them speak.
Hi, Paul! 🙂
maybe they could just make the graph and send it to WUWT every month to be posted
this is where questions are not an inconvenience
This happened the same day the 2015 line crossed over the 2014 line and only 14 days befor the Paris summit.
This made the rounds recently, It is a survey of climate scientists that reveals how the do not talk about uncertainty to journalists to protect the integrity of science from the deniers. It is much like what seems to be happening here. A simple choice to hide the conflicting data in order to reduce conflict.
http://pus.sagepub.com/content/25/1/61.abstract
What is so sad here is, ‘controversy’ is exactly what ‘science’ is all about. The debate about data and incoming information, the past, the present and the future.
Amazing that its all hands on deck to justify the unjustifiable. The 30% estimates are not wrong. The reasons for not continuing to post the plot are not convincing.
It is dishonest to put forward 10% sea-ice extents as proof of unnatural warming and ignore the 30% data. To then remove it from the debate altogether is not to reduce conflict, its to stop people like you gagging on spin.
I would expect the folks at the DMI are taking heat from somewhere.
Do they have an equivalent to the USA FOIA?
I certainly would be interested in seeing emails.
Funny how these types of change only happen when it results in the warmists direction.
DayHay: wouldn’t it be interesting to see all the emails that called for an explanation of differences and caused the closing of this data. That would be the source of the “heat” and probably explain the decision.
Yes, they should have removed the non costal masked and in their own words “confused” 15 percent chart.
I think the squeaky wheel alarmists got the grease.
It’s pretty obvious to this dude that with so much at stake things like this must be done to preserve the enormity of the cause and all who are dependent upon it.
Who wants to see an institutional collapse and a whole lot of careers ruined.
Not DMI or any of their friends.
The only way 1000s of people avoid embarrassment, shame and the consequences that follow is to prevent it from happening.
Coming clean is not an option. No matter what.
A 15% ice metric means 85% of the sensor pixel is open seawater. So the area is much greater than fast ice, or 85% ice with some leads, … It is the arbitrary edge, and can be greatly affected by wind, waves, and currents. I wonder what a historical 50% metric would show?
And its not as if the winds up there haven’t been all over the place this year, with the wobbly jet stream and all !
ocean current changes as well andy. fram export increased i believe and the cooling in the north east atlantic surface temps will be driving surface current changes.
“The Northern Lights have seen queer sights,. But the queerest they ever did see..” (to commandeer Canada’s iconic Yukon poet) is the disappearance of land snow cover from the Cryosphere Today Arctic Sea Ice satellite view. “Arctic Sea Ice Concentration – Same Date Compared With 2007” with the current verdant green of all northern Russia, contrasts sharply with the snow covered vastness of 9 years ago.
http://wermenh.com/wuwt/cryo_compare.jpg
And to think we all laughed when the little troll from Seattle, J@i M1tchell, used to scream (yes, scream) at us: “Keep your eyes on the Arctic, people!!”
Looks like we had better!
@ Betapug, 10:10 am. I don’t know where you and how you put that together but just looking out my window there is snow every where I can see ( western Canada.)
I am in Vancouver and can see plenty of snow across the inlet. My concern is how (or who) disappeared it at Cryosphere whose comparison page which is at the WUWT Sea Ice links.
Want to see the snow cover on land?
The US National Ice Center Naval Ice Center posts a set of maps showing the daily snow and ice cover.
Northern Hemisphere Snow & Ice Chart Mon Feb 22 2016
30 yr graph removed because of too many irritating inquiries. I suggest everyone submit irritating inquiries requesting why the 30 yr was removed and see if the logic holds, ie; graph returned because of too many requests for explanations of deletion. public
+1
GET IT RIGHT 🙂
You have to go to their site and fill out a form. Using the e-mail address given returns this:
Lingchi – death by a thousand cuts. Also often referred to as slow slicing.
This should really become a shorthand name for the step-by-step introduction of minuscule and often seemingly trivial bias, the adoption of preferential techniques and data sources and data adjustments.
The dismissal of, rejection of, reanalysis of, querying only of inconvenient consensus rejecting data or conclusions.
Slice by slice, we move only in the direction of the death of science.
Unidirectional, irreversible, preferentially motivated bias. It just keeps adding and adding to the heap of delusion and the blind-panic and mass hysteria of the guilty and worried rich liberals and their identity seeking politically active arts and humanities miseducated kids.
Meanwhile simple non-adjusted data sets fail to indicate the presence of any notable acceleration in the post glaciation trends. Simple reliable long term data such as sea level gauges or precipitation trends don’t reveal the imagined nightmare of apocalyptic accelerated change.
For that we need to mix and match heaps of disconnected methodologies, computer models, nonsensical interpretation of “magical” proxies, unproven and unjustified assumptions and the deep-seated convictions of numerous highly paid psychotic fantasists.
The results of such “reinterpretation” are nicely illustrated here:
https://rclutz.wordpress.com/2016/02/22/sea-level-rise-just-the-facts/
the AGW’ers are willing to let science go in order to save their pet theory.
Ha ha, yes, and now I have discovered that according to the best scientists, the total lack of acceleration can be explained by the fact that the anthropogenic effects – CANCEL OUT!!!! (sarc)
“The reconstructions account for the observation that the rate of GMSLR was not much larger during the last 50 years than during the twentieth century as a whole, despite the increasing anthropogenic forcing. Semiempirical methods for projecting GMSLR depend on the existence of a relationship between global climate change and the rate of GMSLR, but the implication of the authors’ closure of the budget is that such a relationship is weak or absent during the twentieth century.”
Seriously though, what’s up with that? http://nrl.northumbria.ac.uk/13070/
Looking at the rate at which the El Niño is fading and the PDO and NAO are turning colder, coupled with the sun trying to take a nap, and fading magnetic fields of both the sun and earth, any change at the poles is possible. Not only does the data back to 1974 suggest the range of melting and freezing of the Arctic is larger than admitted by the CAGW side, but the 1960s photographic data suggest there were large holes and thin ice near the North Pole during winter months. While checking this I saw that there is at least one WUWT article noting the same thing.
email sent as follows:
“Please could you restore the 30% product since it may be telling us something that the 15% product is missing.
It could well be that some climate factor causes the two products to diverge or converge naturally at different times as a result of other changes in the climate system.
Yours faithfully,”
Very prompt reply as follows:
“Hej Stephen
Vi har indført nye procedurer for henvendelser til DMI. Din henvendelse er derfor ikke registreret hos os.
Vi henviser dig derfor til at skrive til os via vores kontaktformular på:
http://www.dmi.dk/om-dmi/dmi-paa-nettet/kontakt-dmi/kontaktformular/
Vi ser frem til at betjene dig.
Med venlig hilsen
DMI
Kundeservice”
Which I don’t understand but suspect he is pointing me to the data so that I can do it myself.
Beyond my time and capability, unfortunately.
Any takers?
Smth like:
“Hi Stephen,
We have introduced new procedures for requests to DMI. Your request is therefor not registered with us.
We therefore point out to you to write to us through our contact form at:
We are looking forward to serve you.
With friendly greetings,
DMI
Client service”
Your welcome!
Just a hunch, but I have a feeling Willis will rise to the occasion.
I spent a fair amount of time yesterday scanning Tony Heller’s https://stevengoddard.wordpress.com/ looking for an apoplectic post about the removal of that graph. So far, I haven’t seen one, have I missed an unprecedented change of heart?
Hi Stephen,
We have introduced new procedures for submissions to DMI. Your inquiry is therefore not registered with us.
We refer you to write to us via our contact form at:
http://www.dmi.dk/om-dmi-dmi-on-net/contact-dmi/contact form/
We look forward to serving you.
With best regards
DMI
Customer Service
That explains the fast response – automatically generated.
You may need …
Venligst kunne du gendanne 30% produktet, da det kan være at fortælle os noget der mangler 15% produktet.
Det kan godt være, at nogle klima faktor forårsager de to produkter, der afviger eller konvergere naturligvis på forskellige tidspunkter som følge af andre ændringer i klimasystemet.
Med venlig hilsen,
Thank you, Stephen Wilde, AJB, and Wagen.
I used the link in AJB’s comment: http://wattsupwiththat.com/2016/02/22/dmi-disappears-an-inconvenient-sea-ice-graph/#comment-2150916
to:
1. Click on the link in the “Page not found” page
2. Click on “English” in upper right of DMI page that appeared
3. Click on “Kontakt”
4. Scroll down to “English, General Questions”
5. Filled out contact form completely (you may only need to fill in your e mail address – I wanted them to know I am very much a real person)
6. Clicked “Send” at lower left of Contact Form
Result: e mail sent to me with these contents (edited for brevity and privacy by me – heh, Mr. Wilde, they are getting back to you by the 6th of March, me, meh, I’m on the second roster, apparently, lol – oh, and, YES, DMI, I DO consider my inquiry “relevant” (smile)):
******************************
COOL! They “look forward” to assisting me!
#(:))
Yes Janice,
You are one more person requesting stuff that takes time away from their day-to-day job. 😉
Keep it going!
Stephen, the link is to a form to fill out for contacts to DMI. It includes a link for English users.
Duly resubmitted using the correct form for English users.
Acknowledgment received which suggests a response by 6th March.
Thanks to AJB and jens u anderson
Dear Anthony,
You might want to include the link AJB provided in her/her comment: http://wattsupwiththat.com/2016/02/22/dmi-disappears-an-inconvenient-sea-ice-graph/#comment-2150916, for, by clicking on “in English” at top of first page, the result is a response from DMI in English.
(see my notes in my comment here: http://wattsupwiththat.com/2016/02/22/dmi-disappears-an-inconvenient-sea-ice-graph/comment-page-1/#comment-2151061 for what I did to get English contact form and response – I hope DMI gets so many queries that they grease THIS squeaky wheel, that of “show us the data product,” instead!)
Janice
[snip wildly off-topic -mod]
We’re being asked to spend trillions and drastically change our lifestyles, but hey, it’s too much trouble to maintain one graph!
I had been wondering about the 30% v. 15% graphs. A table giving 0-10%, 11-20%, etc. ice areas. might clarify the situation.
And if land-sea pixels are the most difficutlt measurements, then why not just remove them and report on only sea pixels? I find it hard to believe that ice % right at the shores is what CC should be concerned with.
Your second observation is why on the 30% graph, coastal pixels were masked out. On 15% ice/ 85% water, the coastal pixel problem essentially solves itself.
Just read up on MASIE. Only available from 2006, but higher resolution (4Km) and higher ice concentration 40%. H/t Ron Clutz. They get the higher resolution than microwave alone because integrate visual signals also whenever seasonally possible. And are more accurate during the thaw season since not fooled by standing meltwater. Problem was illustrated in essay Northwest Passage.
To me it seems logical that the Arctic is freezing harder and that the area of 30% ice is expanding, while the area of 15% ice beyond it is extending farther but not as much as the 30% is, so the 15% figure will drop a little. Is this possibly what is going on?
I noticed that the DMI 30% chart was running high but thought it was probably just poor processing, maybe by a new trainee. They always said they would shut down the 30% chart at some point, so no surprise that they did. If the 30% ice were actually so large, then I’d expect a slow melt this coming summer, but my own expectation is that we’re heading for a grand minimum this year, to be followed in future years by recovery as the Sun cools. So it’s in the pudding, as usual.
They’ve had it for years, why shut it down rather than fix it if in fact it were a problem? They still maintain a climatology page based on the 30% value.
What changed is that DMI signed onto OSISAF (which is linked on the center of the DMI page) a few years ago which is a European consortium to process satellite & other data. Now DMI doesn’t have to do its own work anymore, they can use OSISAF’s. Mind you, OSISAF has taken on board much of the Danish expertise (as well as a heavily Norwegian contingent) but not the 30% concentration — they’ve standardized on 15% like everyone else. I quite liked the DMI 30% chart, thought it the most reliable one (except when they visibly ran off the rails periodically), but they did seem to lose their bearings in the last 3 months — probably deliberately to diminish its audience and so facilitate the planned shutdown.
If you ratio the 30% and the 15% data you have a measure of compaction. Not a bad thing to do and you know where the data is.
NZ Willy, you might be right or not. What remains puzzeling is the adjustements the the DMI made to the fall 2015 rise without any explanation. I have followed the 30 graph for a long time and have never noticed any similar reinterpretation for such a long period. Climate scientists can thank themselves (Climategate etc.) for people being skeptical. A simple scientific explanation of why the reinterpretation was necessary would suffice, accompanied with an explanation of how such need for interpretation affects their methodology concerning their other products.
Heh, this reminds me of Richard Feynman’s story of how he got silver electroplating onto plastic working, so his employer marketed silver-plated pens etc. The competition were impressed by the products (since the silver hadn’t started peeling off yet) and concluded that Feynman’s employer must have a large laboratory with 10-20 skilled scientists developing the technology — so they abandoned trying to compete against that. But actually it was just Feynman by himself. So here you are looking for DMI’s scientific methodology and the scientific explanations thereof, but it looks from Caleb’s posting above that the 30% DMI graph was likely being produced by “Ulrik” all by himself, in a process mixing art and science. What’s the Danish for “Science? Wha?”.
World governance based on lies will only get you a revolution at some point in time when folks catch on. I hope to see it in my lifetime.
..Anybody read Danish ? This the reply I got back !
Vi har indført nye procedurer for henvendelser til DMI. Din henvendelse er derfor ikke registreret hos os.
Vi henviser dig derfor til at skrive til os via vores kontaktformular på:
http://www.dmi.dk/om-dmi/dmi-paa-nettet/kontakt-dmi/kontaktformular/
Vi ser frem til at betjene dig.
Med venlig hilsen
DMI
Kundeservice
…Funny thing is, I got the reply within 2 minutes, so it is either automated or somebody doesn’t have much to do !
Try google translate,
or look up a few posts 😉
..Never mind, the answer is supplied above, thanks !! ( hey, I was busy typing ! ) LOL
I’m happy to entertain valid comments about the science
Well, I hope you pay attention to my valid comments about the science, because you’re making an ass of yourself. And I’m writing this, knowing that you probably won’t post this comment.
[Well, Neven, you are making an even bigger ass of yourself by not acknowledging that you’ve improperly labeled me without cause, and apparently are refusing to post my update on your blog stating I don’t think there is any conspiracy at all. This will be your defining moment. What will it be? Truth or your comfort zone of hate? Until you post that update in entirety in your blog post, you’ll have no forum here – Anthony]
In the comment section I have posted your statement that you haven’t said there is a conspiracy, even though we both know that you clearly alluded to it by using words as ‘inconvenient’, ‘skullduggery’ and ‘withdrawn because wrong results’.
When will you inform your readers of the fact that the old, discontinued, uncorrected DMI SIE-30% graph is most probably incorrect? And that Global sea ice minimum records have been broken, and the Arctic sea ice maximum could very well follow suit? Never, right?
In the meantime I’ll let you know that I posted a link to your blog post so that people can make up their own minds, but so far you have failed to return the courtesy, even though you explicitly name me in your blog post, and I have refrained from posting multiple links to my blog to reference the points I make.
I challenge you to post this comment, if you dare.
“DMI SIE-30% graph is most probably incorrect?”
You have absolutely ZERO proof of that baseless assumption.
I challenge you to make it clear in the main body of the post, as I requested. I’m betting you won’t, because it’s outside of your comfort zone to admit you’ve improperly and derogatorily labeled me.
You want the courtesy of a link when you’ve done that? Fix your own problems first.
Do that and we’ll talk, otherwise don’t post here again.
[snip – no posting here until you fix the body of your post to include my update stating I don’t believe there’s any conspiracy – Anthony]
“There has been so much skulduggery going on in the climate establishment in recent years that it is hard to avoid the conclusion that this graph has been withdrawn simply because it gives the “wrong” results.”
“I would tend to agree.”
So you are saying you are tending to agree with “so much skulduggery going on in the climate establishment” therefore a graph is withdrawn.
You do seem to imply that something nefarious is going on in climate science circles.
Assuming bad faith implies ulterior motives.
Dear Wagen,
Your Danish is apparently first rate, but your English needs a little work.
The phrase, “I would tend to agree,” has what is known in English grammar as a logically implied “understood” or “silent” qualifying phrase. Since you did not realize that, here it is: “I would tend to agree, {however, I am not concluding this at this time.}”
And, even IF Anthony DID think there was likely an ulterior motive, SO WHAT? That is (if you are familiar with the historical record of the AGWists activities) a logical conclusion.
Time to get our eyes off your overworked, sophomoric, diversionary tactic and on back onto the ball: the facts about Arctic sea ice extent and why a popular, clear, presentation of them was removed from DMI’s website.
Janice
Oh, boy, for you, an English-not-first-language speaker, I’d better post this: “… and
onback onto.”Wasn’t skullduggery Paul Homewood’s word?
Wasn’t Paul asking for clarification from DMI while maintaining that he was trying not to be harsh?
why not just let him post Anthony I got banned from his forum for refusing to take his sites extreme position, apparently disagreeing is moaning like a princess. even when you are asking for explanation.
Idont think he would last for long here just like any other ardent believer on either side of the argument.
I thought your policy was not to moderate, so that we can see the blindness of belief.
I would be miffed if he doesnt post your full comments on his site but there again where are the numbers, that go to his site and read his blog………..or in other words why do you care.
Neven says, “When will you inform your readers of the FACT that the old, discontinued, uncorrected DMI SIE-30% graph is most probably incorrect?
============================================================================
The DMI web site says the 30 percent graphic masks off what they describe as “confused” costal zones, so in fact they are clearly stating that the 30 percent region they are showing is more accurate. No wonder you blog alone Neven, when your definition of “fact” is so confused.
I don’t own my own Climate Blog, so perhaps it’s easy for me to say – but I’d rather see comments from a wide range of competing views, rather than having somebody banned for vociferously pushing different ideas. If they write rubbish, there are plenty of people here to belittle them, without having to ban them, and it also provides entertainment for us (mostly) armchair viewers.
nevenA to me it looks like you can’t read. Nowhere in this article did anthony use the words you say he uses. he quotes Paul homewood who indeed uses these words.
i also followed the DMI 30% graph for years just because it is a good “overall graph”. Of course it can’t be compared with the 15% ones or it doesn’t say anything about extend, it says something when you compare the years of only this graph with each other. I didn’t see the graph going that positive for years. then to see it adjusted at such big rate does also spark an alarm bell
unless DMI accounts for this largest adjustment i have seen in the 5 years i observed their graph, i also tend to agree “something is going on”. it’s bizarre to see the graph suddenly break the 10 year average on the high side just before it got discontinued.
I personally don’t think the discontinuing is the issue. that was announced for years. It had to come one day. but the last and biggest adjustment i have seen is the oddity here.
do i blindly believe skullduggery is being applied? No As long as the DMI doesn’t give any reasons i would keep an open mind and give them “the benefits of the doubt” but i am surely tending to agree something “unconvenient” is being hidden by this last (and biggest) adjustment.
Thus the title is spot on without making accusations, it is based on facts that were visible till 18/02. Unless the DMI will give information about their adjustments made this is a correct way to title this. WUWT is known to place updates and change the title or even strikethrough parts of articles when a valid answer proves any author wrong.
a lot of other climate related sites (pro or contra CAGW) i visit still have to learn from this
Anthony, If you don’t believe its a conspiracy, and don’t want to imply that it is, maybe you should change the title of the post? “DMI disappears an inconvenient sea ice graph” sounds exactly like you are accusing DMI of removing the graph because they don’t like the results..
[No, “neven” didn’t like the title at Paul Homewood’s blog where the word was “hidden”, so there is doubt anything would satisfy the whining and accusations. Even if the title was changed, they would likely complain about that too. -mod]
And furthermore, surely “disappear” is an intransitive verb, so the title doesn’t make sense anyway?
Speaking of “not showing adverse results”, it should be noted that Paul Homewood still hasn’t updated his blog’s monthly ‘global surface temperature’ page with January 2016 data. These days Paul’s blog only updates the satellite data (or at least it did). The surface data went out the window shortly after it started showing warming.
Have the satellite data sets befallen the same fate?
I’ll point out this comment to him. He may simply have not gotten around to it yet. I sometimes miss my own self-imposed deadlines too.
I suspect the recent increase was a processing issue and not worth dealing with on a product that they had already decided to drop based on the issues that they had with the masking. This year the 30% graphic is showing about 3million sq km below the 15 % graph compared with 4 million last year which seems improbable. According to the 30% graphs this year’s value is about 1 million sq km more than last year, while the 15% graph is about half a million less than last year, doesn’t seem likely. The DMI 15% data is comparable with other satellite measures so the discrepancy is more likely in the 30% graph.
That may very well be, but why would an organization that has provided a climatology comparison page based on 30% data for years suddenly decide not to fix it, and leave the climatology page (which has years of data) an orhpan.
They provided something unique, that apparently had value to climatology because of that effort. Why stop it?
Taking them at face value, the problems with the near shore masking issues were more easily solved by going to a 15% metric which the other sources use. They’d made the decision to drop this product before this divergence occurred, seems more likely due to no longer paying attention to that metric. Arctic sea ice is at all-time lows at present, unlikely that the 30% graph is the only one that is right.
” Arctic sea ice is at all-time lows at present,”
That is an absolute load of twaddle and a total MIS-REPRESENTATION of reality..
There is plenty of evidence showing that Arctic sea ice is actually still rather high compared to the rest of the Holocene , even up to the MWP. During the first 3/4 of the Holocene , there was often regular periods of ZERO summer sea ice.
The ONLY reason the Arctic sea ice level is still so HIGH is because we are still trying to RECOVER from the COLDEST period of the last 10,000 years.. ie the LIA.
Paul Homewood currently has a great series of links about this very FACT.
https://notalotofpeopleknowthat.wordpress.com/2016/02/22/how-the-arctic-climate-has-changed-since-the-mwp/
Here is one of the charts he uses.
These people claim to be using concentrations of greater than 30%
http://igloo.atmos.uiuc.edu/cgi-bin/test/print.sh?fm=01&fd=01&fy=2007
AndyG55 February 22, 2016 at 12:47 pm
” Arctic sea ice is at all-time lows at present,”
That is an absolute load of twaddle and a total MIS-REPRESENTATION of reality..
There is plenty of evidence showing that Arctic sea ice is actually still rather high compared to the rest of the Holocene , even up to the MWP. During the first 3/4 of the Holocene , there was often regular periods of ZERO summer sea ice.
The ONLY reason the Arctic sea ice level is still so HIGH is because we are still trying to RECOVER from the COLDEST period of the last 10,000 years.. ie the LIA.
Paul Homewood currently has a great series of links about this very FACT.
https://notalotofpeopleknowthat.wordpress.com/2016/02/22/how-the-arctic-climate-has-changed-since-the-mwp/
The first graph Homewood show is wrong and doesn’t show the last 165yrs of data! The graph you show here is useless since the axis legend is unreadable, but in any case appears to show today comparable with the MWP.
However, the discussion here is centered on satellite sea ice data which was what I was referring to, for this time of year we are currently at a record low sea ice extent, it’s even possible that the record low maximum could be set this year.
Phil.
The sun is just barely above the horizon up north, and there is no energy to be absorbed nor reflected yet from the sun until about 1 April. Thus, since energy is lost FASTER from an open sea than from a sea covered by sea ice all the many months between 1 Sept and 30 March 15, does not the absence of Arctic sea ice mean a cooler planet seven months of the year?
Phil. You do realise there is satellite data from 1975, when ice was much lower?
“useless since the axis legend is unreadable”
Your incompetence doesn’t interest me. !
And yes I know you would like to rest your junk science just on the tiny period of time of the satellite record, while ignoring the longer history.. That is ALL the AGW farce is capable of doing.
The longer history absolutely destroys their histrionics and their BASELESS hypothesis.
AndyG55 February 23, 2016 at 3:11 am
“useless since the axis legend is unreadable”
Your incompetence doesn’t interest me. !
Not my incompetence, the incompetence of whoever scanned that image, Homewood?
The vertical axis is so blurred that it’s unreadable, I don’t know why you chose it.
Phil, get it right.
“The DMI 15% data is comparable with other satellite measures”
The DMI 15% data is compiled from satellite data, not comparable with. The data is compared with other measures which all use the same algorithm for a 15% estimate so they are all the same. Fantastic observation.
The problem is the 15% and 30% estimates use different algorithms on the same data.
Hence 15% estimates underestimate and 30% overestimate. Even Neven could understand that logic.
But he won’t.
Phil.February 22, 2016 at 11:52 am
“The DMI 15% data is comparable with other satellite measures so the discrepancy is more likely in the 30% graph.”
Get it right.
The DMI 15% data is compiled from satellite data, not comparable with it.
All 15% data sets use the same algorithms, that is why they match so well.
DMI used the same algorithms for their 15% product.
The DMI 30% data uses a different algorithm on the same data.
Obviously one underestimates and one overestimates when you have a choice of 2.
MASIE, a different product, shows much more ice and agrees with the 30%
By your “logic” 30% must be correct because it agrees with another comparison whereas 15% does not.
angech February 22, 2016 at 4:29 pm
Phil.February 22, 2016 at 11:52 am
“The DMI 15% data is comparable with other satellite measures so the discrepancy is more likely in the 30% graph.”
Get it right.
The DMI 15% data is compiled from satellite data, not comparable with it.
All 15% data sets use the same algorithms, that is why they match so well.
DMI used the same algorithms for their 15% product.
I guess you don’t understand what ‘other’ means?
Actually they use different algorithms, NASA Team, Bootstrap, Artist, Norsex for instance.
They also use different satellite data, JAXA uses AMSR2 data from their satellite, NSIDC uses SSMIS, DMI uses OSI SAF data from SSMIS.
The DMI 30% data uses a different algorithm on the same data.
Obviously one underestimates and one overestimates when you have a choice of 2.
MASIE, a different product, shows much more ice and agrees with the 30%
MASIE shows 14.9 million, NSIDC 14.2 million, JAXA 13.6 million, DMI (15%) ~14.5 million, DMI(30%) ~ 11.5 million.
By your “logic” 30% must be correct because it agrees with another comparison whereas 15% does not.
I think not.
“I think not.”
Ahh…. your first correct statement… well done. !!!
AndyG55 February 23, 2016 at 3:12 am
“I think not.”
Ahh…. your first correct statement… well done. !!!
Your reading comprehension not so good. Perhaps you should check the originating websites where you’ll find that different algorithms are used and some different satellites.
The statement that “MASIE, a different product, shows much more ice and agrees with the 30%” is clearly nonsense: MASIE shows 14.9 million, whereas DMI(30%) shows ~ 11.5 million.
lee February 23, 2016 at 2:42 am
Phil. You do realise there is satellite data from 1975, when ice was much lower?
Yes from about 1972, much lower than when? Certainly not lower than now.
ftp://sidads.colorado.edu/pub/DATASETS/nsidc0192_seaice_trends_climo/total-ice-area-extent/esmr-smmr-ssmi-merged/gsfc.nasateam.month.extent.1972-2002.n
Phil. Interesting data. However the IPCC map of Arctic Ice shows a discrepancy of ~0.9m km^2 for the average between 1975 and 1990, which is not reflected in the data in your reference.
https://www.ipcc.ch/ipccreports/far/wg_I/ipcc_far_wg_I_chapter_07.pdf fig 7.20 p224 or p30 of the pdf.
Can someone make a request for the code used to generate the graphs? I’m assuming it should be a fairly self contained program. With that the graphs could be regenerated from the data and maybe some additional graphs and figures generated as well.
Seems a little counter intuitive that >15% ice extent would be less than the >30% extent. It would be nice for DMI to give an explanation for the difference,
The 15% value is about 14.5 million vs the 30% value at about 11.5 million.
There is around 4-5 million km² approximate difference.
Also remember where the warm land blob from December was (northern Russia)
Also remember that the jet stream is all over the place at the moment.
It is quite conceivable that there is large area of this dubious 15% sea ice gone missing, possibly piled up towards the heavier ice.
The Adjustoscene comith.
OMG, Seriously ?????
… All that has happened is they didn’t change the line colour! WAKE UP!!!
No it does not.
I think that you are misreading the graph.
If you look at the plot, on the right hand side, 01/11 and 01/12 this is the data going through November and December 2015 culminating at just above the 10 million mark on 31st December 2015.
If you look at the left hand side of the plot, you will see 01/01 and 01/02. The lower dark black line (ie, the line starting below the 10 million mark) is January and February 2015. The dark black line that starts at the extreme left at just above the 10 million mark (ie., the second higher black line) is the 2016 plot. It covers January through to mid February 2016. You will note how the higher black line on the extreme left hand side of the graph follows on from the December 2015 figure.
So in short, the left hand side has two black lines, which cover different years. The lower is January 2105 onwards, The higher is January 2016 and culminates around mid February 2016 when DMI pulled the plot.
As AndyG55 says, it is a colour coding issue, not an issue of having different values for the same data.
The continuous black line running throughout the entirety of 2015 should no longer appear as a black line but should appear as a coloured line since it is no longer the current year, and forms part of the historical data for the years 2005 to 2015. What colour it should be given is anyone’s preference.
The higher black line should be in black since it is the start of the current 2016 data, and covers the period as from 1st January 2016 through to 17th February 2016.
Re the controversial dropping of the 30% concentration graphic, it will be interesting to see how the 15% graphic changes over the next couple of years as the Northern Atlantic and Northern Pacific sea surface temperatures start to drop. This drop will follow the current “flipping” of the PDO and NADO from the “warm” to “cool” phase). One would expect annual melt-back in sea ice at the extremities of the sea ice pack to lessen as the ocean temperatures drop – in which case the 15% graphic will start to drift back up.
Concerning the replenishment of the Arctic ice pack itself, it would be interesting to know what impact persistent jet contrails are having on multi-year sea ice. These have increased and broadened markedly over the past couple of decades in response to increased polar route traffic between North America and SE Asia.
And DMI’s Arctic sea ice extent data product will end up being this:
Here ya go, folks! Arctic Sea Ice TODAY.
AW writes: “UPDATE2: Commenter “pethefin” notes that DMI has an entire page dedicated to the use of the 30% concentration value that is still operational:”
If one bothers to read the chart or visit the page you’ll notice that it only goes through 2014. I.e., the data for the 30% chart you’re displaying in the UPDATE does *not* include current data. Hmmmm … maybe because they discontinued the 30% product in 2015?
I would hardly call data that only goes through 2014 “still operational.”
As Walt Meier has said “… there is generally automatic quality control done to make sure the final results are accurate and consistent. If such QC is not done, a lot of incorrect values can occur. I suspect that since the older version was no longer supported, the QC wasn’t being watched and something went wrong that they didn’t bother to fix (or maybe didn’t even notice) because the new 15% version is the official DMI output.”
Why not just admit that the graph was no longer supported, began being filled with errors, and was therefor deemed no longer worth keeping around? Oh, but then you wouldn’t be able to slander climate scientists with statements like: “There has been so much skulduggery going on in the climate establishment in recent years that it is hard to avoid the conclusion that this graph has been withdrawn simply because it gives the “wrong” results.”
Sheesh, has it occurred to you that fixing errors are exactly what these paper are paid to do in their line of work? Imagine if all science took this approach. “oh, it has errors, and we don’t want to take the effort to fix it, so lets just discontinue it, especially since we get so many questions about it”.
That’s not science, it’s laziness. Something you seem to embrace with your comment.
The page is still operational, and that is what I referred to. If the 30% data set (and plot) has errors, why keep it in one section but discard it elsewhere? That doesn’t wash with the flawed data explanation.
Lazy thinking indeed, on many levels.
This graph http://ocean.dmi.dk/arctic/climatology_v2/stats_mean.uk.php
most likely is updated only once a year, after analysis of the previous year, in other words, let’s be patient.
Then there is even a third graph by the DMI that also uses the 30 % coverage
http://ocean.dmi.dk/arctic/climatology_v2/extent.uk.php
which presumably also is updated once a year, unless they discontinue that too.
Is this Neven using a sock puppet?
He quotes Walt Meier and down below brings up conspiracy theories.
Style of writing is similar to Neven as well but ???
Silly me, it was Neven’s sook puppet Kevin O’Neill, not his sock puppet
Posted at WUWT – let’s see if it goes through:
oneillsinwisconsin February 22, 2016 at 2:51 pm
AW writes: “UPDATE2: Commenter “pethefin” notes that DMI has an entire page dedicated to the use of the 30% concentration value that is still operational:”
I used Walt’s email reply to Jim, but didn’t link anything in the comment so that AW couldn’t use it as an excuse to snip.
Posted by: Kevin O’Neill | February 22, 2016 at 23:59
For me its 100% certain that the plot was removed due to political pressure from WMO.IPCC probably members of the Danish government, Mann. the team ect …just look at the graph below carefully what sticks out? They have removed both 2015 and 2016 graphs, its a dead giveaway, even from the removed graph. I really don’t get how “skeptics” get scr#### continually by the AGW team. LOL
http://ocean.dmi.dk/arctic/plots/icecover/icecover_current.png
Examine the horizontal scale, do you see what is different from the now defunct graph?
Paul Homewood blog
” Lawrence Martin permalink February 21, 2016 8:23 pm
[SNIP] Lawrence Please stop this ridiculous trolling.”
Wow! The horizontal represents months, not days. The numbers go from the 1st day of the first month (01/01) through the 1st day of the twelfth month (01/12).
TPGazer
You are right, that is what I get for not wearing glasses… the new graph uses months on horizontal axis and I jumped to an erroneous conclusion , Sorry
Poor Lawrence again proves he is … not… very,,,, bright !!!
Eliza, the DMI did not remove 2015, they reinterpreted the fall 2015 and picked a color almost identical to 2008 to depict it. As a result, it is almost impossible to follow the 2015 trend. Not to mention the truly interesting questions of why the reinterpretation was deemed necessary. They did remove the beginning of 2016, I wonder why since they could have reinterpreted that too and use yet another color to depict it?
2015 and 2016 ice plots
DMI is no longer a credible scientific entity.
The 2015 plot is not the same as the one that had been there, I(n fact I do not believe it is a 2015 plot check it out
I think that you are right.
In the plot that remains, 2015 has been coloured purple and 31st December 2015 is well below the 10 million mark.
If one looks at the plot that was up on 17th February 2016, the plot for 1st January 2015 through to 17th February 2016 was black. On 31st December 2015. the black line was touching the 10 million mark.
The black plot on the removed graph does not appear to be the same as the purple 2015 plot on the graph that still remains.
WUWT?
I consider that DMI should be asked to clarify.
They reinterpreted the data, as has become very usual in climate science. However, the choice of color in the graph for 2015 could have been more informative since the color that they for some reason chose is almost identical to the color of 2008. And of course, a scientific explanation for all of this is missing entirely.
Reblogged this on gottadobetterthanthis and commented:
–
There is no room for lethargy in science. There is no excuse for giving up in aggravation. That is the nature of it.
Painstaking effort against relentless aggravation and disappointment of expectations is the lot of all truthseekers.
Mr Martinez is a warmist friend of Jim Hunt and conspiracy theorist Neven.
Handle with care!
jim hunt is a nice man. he is going to pay £1000 to my favourite charity in 2022 in line with our arctic sea ice bet 🙂
Hey, bit chilly, we had a bet almost lined up, but the threads got old. Are you still interested? We would only have to wait until Sept 2018.
Eliza writes:
This is simple conspiracy ideation and absolutely nutters. Some sites will ban you for spouting such nonsense. It would take tens of thousands of people to be on it. And you haven’t a shred of evidence to back you up. 100% certain – LOL. Yep, zero possibility you’re wrong. Case closed.
..” . It would take tens of thousands of people to be on it ” ?…Ummm…it took ONE person to cancel it ! D’oh !
+1
While one cant be 100% certain that it was political influence, one cant as such be 100% certain it wasn’t
Ironically you are criticizing the absolute statement whilst going all absolute yourself at the other end of the scale.
What do you call it when you can contradict yourself and not notice..
Paul Homewood blog
” Lawrence Martin permalink February 21, 2016 8:23 pm
[SNIP] Lawrence Please stop this ridiculous trolling.”
I made a simple comment to the DMI
“I miss the 30% sea ice graph. If it was so much trouble to explain why not compromise and publish one graph with 22 1/2% sea ice?
Why not get rid of the, in their own words, “confused” 15% chart.
janice once again highlights why i love her posting style !
The
datafur is still there…http://commentpics.in/wp-content/uploads/2015/02/1781.jpg
DMI Scientist
*****************************
Thank you, so much.
#(:))
Whether it is old or new, it is clear that Arctic ice extent summer minimum was reached in 2012 and returning back as per the 60-year cycle.
Dr. S. Jeevananda Reddy
The 15% ice edge was because it was a rather obvious edge that a computer could find as opposed to all the other %’s, which computers could find but not easily. (Do you really think it’s exactly 15%? Wrong.) The 30% does not reliably correlate with the 15% edge, so which one do you believe? I’ll go with the one the computer can see as opposed to the one that is consistent with your hypothesis.
the computer sees nothing. the sooner modern day scientists realise a computer is an inanimate object incapable of anything without human input the better. we might actually see some science being done instead of “computer says” nonsense.
algorithms are human attempts to solve complex problems quickly. in climate related matters all they churn out are loose estimates of reality, usually with large but undeclared error bars.
The problem with the DMI 30 graph is not limited too the fact that it disappeared, there are lots a unanswered scientific question related to the graph:
– no scientific reason was ever given for the discontinuation at the very moment when the index was showing unexpected results,
– no explanation was given for why they completely removed the index for the beginning of 2016 at the very moment when the index had reached/tied the 10-year-high, a month earlier than the previous record, why not keep reinterpret it too and use a different color for it in the graph?
– no explanation was given for why they reinterpreted the data for 2015 so that the remarkable rise since fall 2015 disappeared:
– was the measurement method suddenly “wrong”? If yes, what adjustments were made and why and when were they made? Why was the method considered to be “wrong”? Does such a reconsideration of their methodology have an effect on the history of this product or their other products? If no, why not?
– was the measurement equipment suddenly malfunctioning?
etc.
pethefin , i would urge you to send your questions to the dmi themselves . in all correspondence i have had with them they have never failed to answer any query. nice people to deal with ,and the people answering the questions are fully aware of the political vs reality disconnect in the climate information industry. try them, i am sure you will be pleasantly surprised.
“no scientific reason was ever given for the discontinuation at the very moment when the index was showing unexpected results,”
It is possible, even reasonable, that the index started showing unexpected results because it was discontinued, and was not being maintained.
Put this tohether with the fact that all other data shows low sea ice extent and the obvious conclusion is that the 30% graph had gone wrong.
Of course that is fully possible that the graph was wrong although they discontinued it after the fact, not before. In any case, a simple scientific explanation would suffice.
On the other hand why discontinue the 30 % coverage when most of their other sea ice graph build on it? And most of all, when the DMI define open water in the following manner:
“The number of days of open waters for a given point is defined as the interval between the sea ice concentration falling from greater than 30% to less than, and remaining so for at least 5 days, until the ice concentration again climbs to above 30%, and stays so for at least 5 days”
see http://ocean.dmi.dk/arctic/climatology_v2/frzbrkowd_mean.uk.php
How can they at the same time say that we should follow 15 % coverage as the measure of sea-ice. Which is it? Open waters of sea-ice worthy of our attention? Any thoughts?
There is no reason why they should not use different definitions for different purposes. There is no “absolute” definition of open water or sea ice extent. As long as you are consistent within each category and define what you are doing there is no problem.
Thanks for you view, now we know that you are not fond of why-questions. Good to know so that I won’t waste more time.
The more you dig, the more you find. The DMI has even a third page where the 30 % coverage is being used:
http://ocean.dmi.dk/arctic/climatology_v2/stats_mean.uk.php
This one would actually be very interesting if the DMI would provide more detailed analysis on annual basis rather than the periods 1978-2014 and 2004-2014. An annual analysis of this data would easily explain any differences between the 15 and 30 % products of the DMI.
Now, will the discontinue this too?
Sorry, I mistakenly attached wrong url, this is the correct one:
http://ocean.dmi.dk/arctic/climatology_v2/extent.uk.php
for the third graph
I’ll take that back, the first url was correct, my browser was having a bad day.
Yet another DMI graph where 30 % concentration is being used:
http://ocean.dmi.dk/arctic/climatology_v2/frzbrkowd_mean.uk.php
This time they say that “The break-up date for a given point is defined as the date where the sea ice concentration falls from above to below 30% and remains so for at least 5 days”. Interesting, considering the decision to follow 15 % ice coverage instead of 30 % in the future. So from now on the DMI want’s us to follow, in their own words, broken-up sea ice, instead of the perennial sea-ice.
And of course, there’s yet another:
http://ocean.dmi.dk/arctic/climatology_v2/frzbrkowd_mean.uk.php
Which explains that “The freeze-up date for a given point is defined as the date where the sea ice concentration climbs from below to above 30% and remains so for at least 5 days”. Should we laugh at all of this or not?
The gift that keeps giving:
http://ocean.dmi.dk/arctic/climatology_v2/frzbrkowd_mean.uk.php
“The number of days of open waters for a given point is defined as the interval between the sea ice concentration falling from greater than 30% to less than, and remaining so for at least 5 days, until the ice concentration again climbs to above 30%, and stays so for at least 5 days”
So the DMI 15 % sea-ice coverage is measuring open water as sea ice? 🙂
Sorry, the links did not work. Click on the first and then choose:
– break-up date
– freeze-up date
– days of open water
I have read a bit of uproar about how “people were misusing the 30% ice extent” a while back, it seems that after about a year of this chart becoming commonly used was a problem rather than the existence of the chart.
Over the past 3 to 4 months I’ve seen the chart referenced when dealing with such nonsense as Guardn and NYT articles and twitter accounts like that doom sayer Carol Davenport.
I would imagine there was some pressure on DMI to stop the “Misuse” of this chart as it was “being used for denial”.
Such thinking is not conspiratorial in nature, it is simply a fact that one side of this debate will use “peer” pressure as much the same way as it has abused “peer” review.
But lets not fester, smile and remember the President of the Sierra club said “The Hiatus” is a reference to the 1940s” while he caressed Exxon $$ lining the inside of his pockets
Just like the MWP, when something is misused, it must be “dealt a mortal blow”
Or simply “reinterpreted”:
https://rclutz.wordpress.com/2016/02/22/sea-level-rise-just-the-facts/
It hard to read that when they get to CO2 vs Sea Level rise as there is no system in which they can be correlated. They can’t be superposed, they can’t get the two are not part of a linear system.
They create that link with language.
Big fan of linguistics and how language has become weaponised, this is more of the same garbage
So I half read it, should have read it all before replying, silly me.So I read it all. D’Oh
Noted the lack of funding for GRASP a more accurate measurement of sea level rise.
Surely both are stupid as normally one rounds up or down at 50%. Only areas with more than 50% ice should rationally on normal rounding methods be considered ice in non climate related science.
We really do need scientists to have to sign a declaration of ethical conduct as all science is now tainted with the criminality of just a few narrow branches of it. I use criminality in a maybe strictly legal or not sense. I regard it as blatant fraud changing data that has previously stated to be beyond question when used subsequently to extort money from another person. This declaration of beyond question to any normal person would mean the data was no longer able to be modified or parts selectively eliminated without deliberate intent to defraud since that misdirection was known would be used to extort money against the persons wishes.
If they were to eliminate either data set they should have eliminated the 15% as it is further from the 50% they should have been using.
Well it appears they have become world class, since the world standard in climate science is classed by deceit and fraudulent adjustment of data previously claimed to beyond question. To my mind as an engineer means beyond question means beyond any FURTHER questioning as it stands up to any external questions satisfactorily and all those questions have been answered to everyone’s satisfaction. Nothing is literally beyond question as there is always the simple questions of “Is this true?” “Can you prove it to me?”
I would recommend watching the DVD “Shattered Glass”. In particular watch the interview where he uses every single word except lies to describe his fabricated stories.Climate science is the same story but with him not being discovered until too late so the attitude where the story matters not truth has become the institutional norm.
In that NevenA screencap, he calls the WUWT-crowd “climate risk deniers“.
I believe this is a fairly new one. “Climate risk denier” generates only 39 hits on Google, “climate risk denialism” no more than 2.
Hateful as it is, you have to admit that it’s a clever amendment to “climate denier” or “climate change denier”.
I have been waiting for this, since it’s the only credible way to go, although they still need to drop the denier-crap. Climate-risk-averse would be a lot better but they would then have figure out what it really means. The alarmists, like the IPCC, have still trouble understanding how to count probabilities, so not likely that they will be able to up their game.
Well, as for any scientist, if you don’t want to answer a question, don’t. I ask people lots of questions they never answer. It is not a burden if you don’t answer.
Pethefin: Just for the record, watch all the DMI 30% graphs ect be eliminated within the next few days/weeks! It is not a credible institution any more. Well I ain’t using their graphs no more! LOL
If someone keeps ALL the 30% files, It will make a great story in the Danish press for future use!
There always the wayback machine:
http://archive.org/web/
The DMI has some work ahead of them in order to the their story straight:
As I pointed out above, there are three more DMI graphs where 30 % concentration is being used:
http://ocean.dmi.dk/arctic/climatology_v2/frzbrkowd_mean.uk.php
Under “Break-up date”
they say that “The break-up date for a given point is defined as the date where the sea ice concentration falls from above to below 30% and remains so for at least 5 days”.
Interesting, considering the decision to follow 15 % ice coverage instead of 30 % in the future. So from now on the DMI want’s us to follow, in their own words, broken-up sea ice, instead of the perennial sea-ice.
Under “Freeze-up date” they say:
Which explains that “The freeze-up date for a given point is defined as the date where the sea ice concentration climbs from below to above 30% and remains so for at least 5 days”.
And under “Days of open water” they say:
“The number of days of open waters for a given point is defined as the interval between the sea ice concentration falling from greater than 30% to less than, and remaining so for at least 5 days, until the ice concentration again climbs to above 30%, and stays so for at least 5 days”
So the DMI 15 % sea-ice coverage is measuring open water as sea ice, in their own words? Why?
Never-ending-story, two more DMI sets of charts with similar definitions:
http://ocean.dmi.dk/arctic/climatology_v2/frzbrkowd_trend.uk.php
http://ocean.dmi.dk/arctic/climatology_v2/frzbrkowd_std.uk.php
i think they are still doing everything they were before. they just decided not to show the 30% extent graph anymore due to the number of queries they had to answer on the issue. they do not have limitless resources and my understanding is there are only a few people in the team this involves.
i also have a funny feeling the more vitriolic emails they receive come from the alarmist side .
I fully agree with your assumptions.
This is a rare sight showing sea ice on the northern Iceland coast and sea ice covering the whole southern Greenland. There is even sea ice trying to form south of Svalbard so it looks like the first signs of the cooler North Atlantic starting to influence the sea ice further NE.
http://ocean.dmi.dk/satellite/plots/satsst.arc.d-00.png
What happens when these ocean changes cause the 15% sea-ice coverage to show more increasing sea ice in future, will there be a sudden switch back to 30%? The agenda is very strong with science last place, so who knows?
The difference between the two really only shows that the Arctic sea ice melt over the recent past hasn’t been much below 15% or the 30% sea-ice coverage would trend similar.
“…..sea ice covering the whole southern Greenland.”
To be more accurate I mean the whole southern Greenland bordering the North Atlantic coast.
The ice around Greenland will grow.
http://earth.nullschool.net/#2016/02/27/1200Z/wind/isobaric/70hPa/orthographic=-12.99,60.77,300
Matt G February 23, 2016 at 3:20 am
This is a rare sight showing sea ice on the northern Iceland coast
Doesn’t actually exist, probably clouds. Not shown on any other satellite sea ice map, more damning not on the Modis photo either.
http://rapidfire.sci.gsfc.nasa.gov/cgi-bin/imagery/single.cgi?image=crefl2_143.A2016054135500-2016054140000.2km.jpg
Shows small areas of sea ice around the coast at times that are at least 20% sea ice concentration. Nothing smaller than this is detected with this technique so despite clouds maybe hiding thin sea ice, it still supports scattered sea ice around Iceland at times recently on the northern and western coasts.
http://www.vedur.is/vedur/sjovedur/vedurtungl/hafis_thettleiki/
Your new website shows no sea ice on the northern Iceland coast. The DMI satellite map you showed before now only shows one patch of ‘sea Ice’ right where there is now cloud.
http://rapidfire.sci.gsfc.nasa.gov/cgi-bin/imagery/single.cgi?image=crefl1_143.A2016056132500-2016056133000.2km.jpg
Only showed temporary ice flows as sea temperatures recently off the northern coast are not cold enough to maintain them.
Where do they get the base satellite data? It would be trivial to generate the charts. The state of the art is so far beyond this now.
Hi Anthony: I have watched the Danmark site for a number of years. Since 2012 Danmark has said they were changing to the 15% method. It would seem they did it for standardization. I presented this huge anomaly on the 30% ice versus the 15% stating that something very interesting and unusual was going on in the part of the Arctic Ocean that is within the Islands (think Fram Straight), on Accuweather last week. That it couldn’t possibly be as warm across the whole Arctic Ocean when they have no way to measure it. I got completely blown off and in a derogatory way told that I didn’t have the experience to perceive what I saw. My comments were how standardization can lead to the loss of resolution, (In this case the 30% Sea Ice Anomaly).
Charles
The cryosphere only shows sea ice concentrations 30%+ and backs DMI 30%+, that the sea ice was higher in January 2016 than January 2015.
There was less sea ice in 2016 than 2015 around Svalbard across to Siberia, but this is made up slightly with slight gains around the Labrador sea and Greenland. The big difference during 2016 that more than makes up for less ice in the other region is the significant increase in sea ice around eastern Siberia.
http://igloo.atmos.uiuc.edu/cgi-bin/test/print.sh?fm=01&fd=03&fy=2015&sm=01&sd=03&sy=2016
http://igloo.atmos.uiuc.edu/cgi-bin/test/print.sh?fm=01&fd=16&fy=2015&sm=01&sd=16&sy=2016
http://igloo.atmos.uiuc.edu/cgi-bin/test/print.sh?fm=01&fd=30&fy=2015&sm=01&sd=30&sy=2016
Summary
The 30%+ sea ice concentrations show increase in sea ice on both data sources (cyropsphere and DMI) over the past year for January. Only the 15%+ sea ice concentrations don’t show this increase, therefore the conclusion of removing the 30% DMI from public display is down to cherry picking what is or not shown. There is no indication that the data has suddenly become incorrect and the agenda above science continues from so called scientists. The simple reason why the increased trend has occurred has been down to significant gains in Eastern Siberia over the month.
why is it so hard to realise that the DMI long since gave up doing proper quality control of the 30% data.
As I understand it there are not many of them and they likely just have more pressing jobs.
They said ages ago that the 30% would be going and, I suspect, that they just let a “bug” develop and continue in the data.
They seem to have corrected it as they closed it down.
The 15% now conforms with all other data centres and like them shows a relentless fall is ice extent.
Right, so since most of their other sea ice graphs (at least four other sets of graph on their webpage as I have explained above) are build on the 30 % coverage, will they toss them all?
How do you explain the same thing shown in the cryopshere? Have they got more pressing things to do too and let this so called bug develop? Sea ice off eastern Siberia has greatly increased this winter compared to last.
The 15%+ sea ice extent when it is only around 20% sea ice registers as no increase in ice extent. When this increases to 30%+ this represents an increase in sea ice extent for the 30%+ sea ice extent data. This is the only reason for the difference between 15%+ and 30%+ data sets and has nothing to do with a bug.
They haven’t “disappeared” the 30% graph, they’ve corrected it up to the end of 2015.
If you look at the most recent version (pale purple line on the 3rd picture in Anthony’s post), you can see the data goes all the way to the end of 2015. If you compare it to the version on the broken graph (black line in the 1st picture), you can see they start to diverge around the 1st of November.
It looks like they’ve sorted out the bug, corrected the data up to the end of 2015, and then officially retired the graph. Anyone wanting to witter on about 30% versus 15% or any other such special pleading in order to pretend the earlier version wasn’t bugged needs to account for why the final validated version of the 30% graph now shows 2015 as being no different from the rest of the pack right up until the end of December.
[you are certainly entitled to hold that opinion, but none of that explains well. Why “fix it” only to retire it. that is counterproductive -mod]
The 30% changed graph on the 3rd figure for 2015 still shows the highest sea ice extent there for any December month, but the new divergence occurs well before November comparing different versions.
For example the minimum summer ice extent on figure 3 for 2015 was above 4 M km2, where as figure one shows it to be below 4 M km2. Generally the new color and fit is very poor for 2015 and can’t been seen for most of the plot.
The 30% cyopsphere for January 2016 shows sea ice greater than 2015, whereas the 15% shows this to be lower than 2015 for DMI also. The 30% sea ice extent for December 2015 is the highest since at least 2005 because there is more ice above 30% than 15% during this period. Discontinuing just because of this turn around is poor indeed.
The 30% chart is more honest, because it eliminates much of the scattered patches of sea ice, while giving more weight to older, thicker ice.
They prefer using the 15% chart because they can show the effect of wind, waves, and currents on the more sparse patches of sea ice:
http://www.john-daly.com/polar/pack%20ice.jpg
db-“eliminates much of the scattered patches of sea ice, while giving more weight to older, thicker ice.”
This does not mean “more honest”. You are describing a particular bias.
‘seaice’, your confirmation bias is showing. Using 30% is more honest, because it eliminates the spurious readings from scattered bergs and patches like the pic shows.
This is an honest chart:
http://oi65.tinypic.com/2hoegko.jpg
sea ice levels look inverse to the AMO
“There has been so much skulduggery going on in the climate establishment in recent years that it is hard to avoid the conclusion that this graph has been withdrawn simply because it gives the “wrong” results.”
Nothing like a good conspiracy theory!
The only “skulduggery” going on has been from climate change deniers.
Harry T,
Why would you criticize your side in this debate? You are a ‘climate change denier’.
You’re part of the same crowd that believed Michael Mann’s erasing of the MWP and the LIA.
Mann claimed there was no climate change until human CO2 emissions came along. Just look at his bogus chart; you’ll see — you climate change denier, you.
HT,
If you think the world is going to warm to levels dangerous enough to humans well being than highlight it now with scientific evidence using the scientific method. Failure to do so shows your claims are as false as the very statement you claim. There was no warming in the temperature data sets until they were altered recently because they had failed to warm. The planet since 1998 only warms when adjustments are altered to the data, not the planet actually showing the same control warming.
Matt G.
And I did not even mention catastrophe.
You just keep right on denying. I do not mind if people back the wrong horse, it means more winnings for me.
“You just keep right on denying. I do not mind if people back the wrong horse, it means more winnings for me.”
This makes no sense. If you believe that deniers are “backing the wrong horse”, and global warming continues to dangerous levels, then what winnings do you get “more” of? Isn’t the whole idea that the world will spiral into death, destruction, and starvation etc….which I guess you could want MORE of….if you’re a sicko. Or perhaps you’ll be some kind of economic pirate and make it big on charging $50 for a bottle of water or $100 for a carrot or something along those lines….which also makes you a sicko.
So….either you are just a troll that makes no sense, or you are attempting to use some very lame reverse psychology, or you’re a sicko. Which is it? 🙂
HT,
Without catastrophe, the alarmist crowd has no scare for extracting taxpayer loot. Without a threatened catastrophe, all you’re arguing about is natural climate variability.
Where are your ‘winnings’? You’ve backed a losing horse, as Planet Earth is demonstrating. There’s nothing either unusual, or unprecedented happening — much as you wish there was.
Denying what? If you mean we going to get global temperatures to rise around 3c – 5c by 2100 due to humans, then I am proud to say it is nonsense.
People have already commented on this, but without castrophe there is no need for urgent action to cut back down on CO2 levels. It is the very thing why this issue has cropped up since the 1980’s and what has happened so far I predicted back in the 1990’s before the strong El Nino in 1997/98. Ie There has been nothing to worry about and very little evidence that any divergence has occurred from natural cycles.
Aphan.
“This makes no sense. If you believe that deniers are “backing the wrong horse”, and global warming continues to dangerous levels, then what winnings do you get “more” of?”
I get the bragging rights to say I was right.
Harry-
HT-“I get the bragging rights to say I was right.”
Winner winner, chicken dinner! What are you….12? I’ll make sure you get a bullhorn and a place on high ground (if you are right) so you can gloat for all to see and hear ok?
HT-“Climate change deniers astound me. They talk a lot but do not actually read the scientific research that has been done.”
Have you? Because you don’t seem to understand the difference between a published scientific paper, and “evidence”.
HT- “Check out the latest charts on sea level, they do indeed show an accelerating trend in the rise of sea level.”
Compared to what time frame? Sea levels have been both much higher than they are now, AND much lower, all without human influence. So what exactly does changing sea levels prove other than that sea levels are always changing?
HT- “If you think this was not a prediction of AGW, then you have to use the scientific method to suggest an alternate explanation and why it fits the results of the experiment better.”
What experiment? AGW people keep telling us that there is only one Earth and so they cannot actually “conduct” real experiments to prove their theories. Sounds like you know of some. Please share. Otherwise, any 12 year old geography student could have predicted that sea levels will probably rise until the next glaciation period begins, and then they’ll probably start falling again.
HT-“To answer your question (which I shouldn’t have to), global mean temperatures will increase as the CO2 concentration in the atmosphere increases. If you do not believe it is increasing, I suggest you go look at the Keeling Curve website.”
CO2 concentrations are increasing…at least that’s what “they” tell us. Yep. Correct. But global mean temperatures were increasing on their own, before human CO2 began increasing, you know that right? And empirical data and proxies prove that there is nothing abnormal or unprecedented in either the amount of, or speed of, the current warming. It’s happened before, many times, and without human CO2 influence. Now…in order for AGW theorists to demonstrate that ALL of the current warming since 1950 is related to human emissions alone, or even mostly, they MUST demonstrate that the naturally occurring warming/changing/fluctuating climate of the planet STOPPED or would have reversed in 1950 and become cooling, had it not been for the increase in CO2 in the atmosphere. But they can’t really do that can they?
Of course if they could, we’d all owe human CO2 a huge debt of gratitude for saving the human race (and many species of animals, fish, birds, and various flora and fauna) from descending into the death, plague, suffering and starvation that comes with glacial periods.
Here’s a good place to start on sea levels for you-
http://www.sealevel.info/papers.html#dn
Matt G.
“Denying what? If you mean we going to get global temperatures to rise around 3c – 5c by 2100 due to humans, then I am proud to say it is nonsense.”
Well the global mean temperature has already risen 1C above pre-industrial. It’s only a matter of time before it goes up another 1C, then another. Each 1C rise is going to be more expensive to fix than the previous 1C.
The sea level rise on it’s own is enough to justify urgent action. The US Navy is already making contingency plans to mitigate the effect of sea level rise on it’s infrastructure.
Matt G.
“There was no warming in the temperature data sets until they were altered recently because they had failed to warm. The planet since 1998 only warms when adjustments are altered to the data, not the planet actually showing the same control warming.”
Well you are proving my point about conspiracy theories. Lecturing me about the scientific method is disingenuous if you are relying on conspiracies to falsify scientific research.
Harm to humans? Do you agree that rising sea levels are harmful?
OK a hypothesis about AGW is the resulting global warming will cause sea levels to rise. Check out the latest charts on sea level, they do indeed show an accelerating trend in the rise of sea level. If you think this was not a prediction of AGW, then you have to use the scientific method to suggest an alternate explanation and why it fits the results of the experiment better.
HT:
You say
No and No.
Global mean temperature anomally is said to have risen by ~0.8°C since the industrial revolution but nobody really knows.
Global mean temperature rises by 3.8°C from June to January (and falls by 3.8°C from January to June) each year and nobody notices.
A global mean temperature rise of of 3.8°C provides nothing to “fix” and, therefore, there would need to be much evidence for credibility to be given to a claim that 1°C would require a “fix”.
Richard
Harry Twinotter,
Why is the rate of warming going to increase to support the suggestion you have made? The end of the 21st century is now around 84 years away and the rough 1 c (0.7c-0.8c) rise occurred during a longer period than this. This has also been exaggerated by changing the difference between now and the 1930’s and 1940’s. It wasn’t to do with human emissions at all for the majority of it because they didn’t start rising significantly until after World War 2. Yet this significant rise in CO2 made no difference to global temperatures between the 1940’s and 1970’s. Like it has made no difference this century and just a short period of warming between the 1980’s and 1990’s doesn’t justify your claims at all. There is no scientific evidence the rate of warming will increase, whether or not what contributions have caused it natural and man-made.
Regarding the sea level rise (exaggerated again) which it still only around 2mm-3mm a year and that results in roughly a 210 mm rise by the end of the century.
Why does 21 cm rise even if this continues by the end of the century need urgent action?
Matt G.
“There is no scientific evidence the rate of warming will increase, whether or not what contributions have caused it natural and man-made.”
Climate change deniers astound me. They talk a lot but do not actually read the scientific research that has been done.
To answer your question (which I shouldn’t have to), global mean temperatures will increase as the CO2 concentration in the atmosphere increases. If you do not believe it is increasing, I suggest you go look at the Keeling Curve website.
You did not read my response either – go see the bit where I say the increase in sea level rise is accelerating.
HT,
“There was no warming in the temperature data sets until they were altered recently because they had failed to warm. The planet since 1998 only warms when adjustments are altered to the data, not the planet actually showing the same control warming.”
I’m not proving your point at all that comes down to your ignorance and the denying of the pause is just down to this very recent adjustments to data. Since when is the data been altered to show this a conspiracy, when that is what happened and is a FACT.
Harry Twinotter ,
Please look up what the rate of warming means.
Thanks.
Over the long term the rate of sea level rise has been decreasing.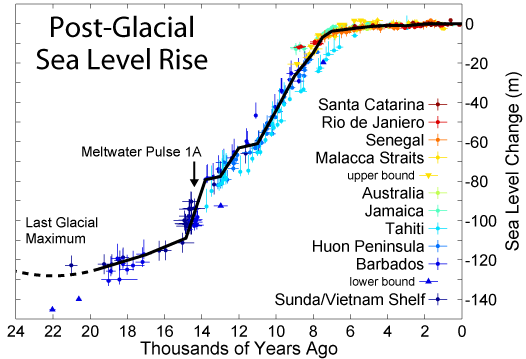
Eli Rabett
February 22, 2016 at 3:14 pm
If you ratio the 30% and the 15% data you have a measure of compaction. Not a bad thing to do and you know where the data is.
*******************************************************************************************************************
If I understand correctly, the 30% ice coverage figure excludes the coastal areas and is therefore smaller than the area used to look for 15% ice coverage. Without knowing how large the area excluded is and the total area used in the 30% graph there is no way of making a sensible comparison of ratios.
By the way, the reason for them saying that the 30% figure may be an underestimate is, that there may/or may not be, 30% ice in the excluded coastal areas – they are not confident of their ability to distinguish it close to land. The chances are that there probably are some pockets of 30% ice that are therefore not counted, thereby creating an underestimate.
SteveT
DMI explains what happened in the reality based universe, it’s time to quit the conspiracy ideation and move on to real issues and not some weird alternate reality (WAR),
http://bit.ly/20WU4EC
“DMI has removed the old sea ice extent graph to focus the attention on the new graph that is based on data from an improved algorithm.
However, the removal of the old sea ice extent graph was done at an unfortunate time, namely, during a period where it seemed that the new and old ice extent plots disagreed (see figure 1). Naturally this has led to discussion among our dedicated followers, about the “true” ice extent. The apparent elevated sea ice extent in the data from the old extent algorithm was an artifact, caused by a new and higher resolution coast mask.
Because of the deprecated status of the old plot in the past year, DMI has not been monitoring these irregularities. The old plot should, of cause, have been removed when the mask was replaced. DMI apologizes for the confusion and inconvenience this has caused.”
Lawrence Martinez,
Do you take that explanation at face value? I don’t.
I remain a skeptic, because in every similar example the end result always goes in the direction of greater alarmism.
Believe their explanation if you want, but appears to be too convenient and self-serving, especially since they don’t post their before and after algorithms. I’m way past “Trust us” when it comes to these adjustments.
It appears that the comment above was held up in moderation.
Thank you in advance
http://bit.ly/20WU4EC
An explation from DMI
Sea Ice extent – explanation on an appearent divergence between algorithms.
“DMI has removed the old sea ice extent graph to focus the attention on the new graph that is based on data from an improved algorithm.
However, the removal of the old sea ice extent graph was done at an unfortunate time, namely, during a period where it seemed that the new and old ice extent plots disagreed (see figure 1). Naturally this has led to discussion among our dedicated followers, about the “true” ice extent. The apparent elevated sea ice extent in the data from the old extent algorithm was an artifact, caused by a new and higher resolution coast mask.
Because of the deprecated status of the old plot in the past year, DMI has not been monitoring these irregularities. The old plot should, of cause, have been removed when the mask was replaced. DMI apologizes for the confusion and inconvenience this has caused.”
Time for an update/ correction/ clarification
http://ocean.dmi.dk/arctic/iceextent_disagreement_is_an_artifact.uk.php
Here’s the chart they’re trying to censor:
http://oi65.tinypic.com/2hoegko.jpg
That chart has visible errors. First of all, there is no data indicated 2016. Secondly there is a black line showing 2015 data which has dual values between the beginning of the year and the middle of February.
DBS
What is the point you”re trying to make, are you accusing DMI of commiting malevolent conduct?
Matthew Marler and Lawrence Maritnez,
What part of “Here’s the chart they’re trying to censor” can’t you understand?
Please stop deflecting long enough to explain why they couldn’t leave that chart up, so readers can make up their own minds. And it would be helpful if they posted their before and after algorithms. Or do you think we should trust whatever they say?
And Matthew, I had no trouble understanding that chart. Your ‘no data’ is the fault of DMI, no? But that isn’t important; aparently what they don’t want people to see is the rise in Arctic ice from 2015 – 2016. That is what they seem to be interested in hiding.
@Lawrewnce: they could put any suspicions to rest by simply posting the original chart, with their before/after algorithms. Does it not seem suspicious that every change made seems to promotee the alarmist narrative? What are the odds of that?
” explain why they couldn’t leave that chart up”
…
Did it ever cross your mind that the reason they took the chart down is BECAUSE OF THE ERRORS IT HAS? (see my post above)
[snip – let’s stop with the accusations, we all know you aren’t here to do anything but hurl invective -Anthony]
Matthew Weaver-
“That chart has visible errors. First of all, there is no data indicated 2016. Secondly there is a black line showing 2015 data which has dual values between the beginning of the year and the middle of February.”
Oh my word. Do you see the date at the bottom? It “indicates” Wed Feb 17 2016. The short black line (which should be a different color)….is for 2016…and only goes to the middle of February because….the 17th WAS the middle of February…2016.
MW-“Did it ever cross your mind that the reason they took the chart down is BECAUSE OF THE ERRORS IT HAS? (see my post above)”
Did it ever cross your mind that they never said or declared that the chart was WRONG? It was a chart that measured 30% sea ice…and was therefore a one of a kind chart because all others measure 15% sea ice. But the charts looks almost exactly the same and apparently the people who frequent their site are (in general) STUPID. It sounds like there was a significant number of people who paid no attention to the actual numbers on the left axis of BOTH charts and kept getting confused. If they knew how to read charts, they would have realized on their own (without needing someone at DMI to walk them through it personally) that January numbers on the 30% chart start at a whole different number of million square miles than the January numbers on the 15% chart does!
They must have thought that people were smarter than they actually are, and left BOTH charts up along WITH detailed descriptions of what was going on/being measured in both charts, during the transition period to a one chart (15% sea ice) system using a new algorithm. They did indeed post a warning on their site last year under the 30% chart saying that they were going to discontinue it soon, in favor of a one chart system that more closely matches all of the other 15% charts out there. But they never, EVER, not then, and not now, have ever stated that the 30% chart-or the data in it- was incorrect, had errors in it, was inaccurate, or false.
So MW-why WOULD it cross anyone’s mind that they took the chart down “because of the errors it had”?
The two charts showing the difference between 2015 and 2016 are hardly any different in progression than the cyopshere I linked to before. (30% extent)
http://ocean.dmi.dk/arctic/iceextent_error/fig2_rightleft.jpg
They both show significant increased sea ice in eastern Siberia and slight losses on western Siberian side. Sight gains around Greenland and Labrador sea.