UPDATE: I’ve crossed out the entire discussion of the top of the atmosphere energy imbalance and removed the illustration. See the note at the beginning of that heading.
# # #
An illustration in the paper Riser et al. (2016) Fifteen years of ocean observations with the global Argo array (.pdf copy here.) raised a couple of comments recently at my blog ClimateObservations. My thanks to bloggers Michael Spurrier and Dave Fair for pointing me to the new paper about the ARGO program.
ABSTRACT
The abstract of Riser et al. (2016) reads like an infomercial:
More than 90% of the heat energy accumulation in the climate system between 1971 and the present has been in the ocean. Thus, the ocean plays a crucial role in determining the climate of the planet. Observing the oceans is problematic even under the most favourable of conditions. Historically, shipboard ocean sampling has left vast expanses, particularly in the Southern Ocean, unobserved for long periods of time. Within the past 15 years, with the advent of the global Argo array of profiling floats, it has become possible to sample the upper 2,000 m of the ocean globally and uniformly in space and time. The primary goal of Argo is to create a systematic global network of profiling floats that can be integrated with other elements of the Global Ocean Observing System. The network provides freely available temperature and salinity data from the upper 2,000 m of the ocean with global coverage. The data are available within 24 hours of collection for use in a broad range of applications that focus on examining climate-relevant variability on seasonal to decadal timescales, multidecadal climate change, improved initialization of coupled ocean–atmosphere climate models and constraining ocean analysis and forecasting systems.
FIGURE 5 FROM RISER ET AL.
I’ve included Figure 5 from Riser et al. (2016) as my Figure 1.

Figure 1
The caption cites two references. Reference 27 is Roemmich et al. (2015) Unabated planetary warming and its anatomy since 2006, which is an ARGO array-based paper. And reference 42 is Levitus et al. (2012) World ocean heat content and thermosteric sea level change (0–2,000 m), 1955–2010., which is the paper that supports the ocean heat content data from the NOAA National Oceanographic Data Center (NODC). Basically, for their Figure 5, Riser et al. overlaid the (black, red and blue) curves of the ARGO-based ocean heat content data (0-2000 meters) for 2006-2014 atop the corresponding long-term pentadal data from the NODC (purple curve), and then claimed victory because the two datasets showed similar warming rates.
Riser et al. (2016) states (my boldface):
In Fig. 5 the Argo-only plots (inset) are only for the years 2006–2014, the period when global coverage from Argo exists. So these short plots are overlaid on a plot of heat content estimates for 0–2,000 m depth for the period 1955–201042. The Argo estimates show a very similar trend. This is a crucial result in making an assessment of the ocean’s role in climate change, one that would have probably been impossible before Argo.
Oddly, Riser et al. (2016) do not list the trend values and their uncertainties for the ARGO-based data so we can’t compare them to the NODC data over any timeframe. I’ll let you speculate about that. But for the period where they overlap, the ARGO data and the NODC data should show similar trends. The NODC uses ARGO-based data for their ocean heat content estimates.
Let’s zoom in on the inset graph of the ARGO-based data included in Figure 5 from Riser et al. (2016), my Figure 2.

Figure 2
Obviously, based on the ARGO floats, the vast majority of the ocean heat uptake for the depths of 0-2000 meters has taken place in the extratropics of the Southern Hemisphere (60S-20S/black curve) for the period of 2006-2014. Riser et al. (2016) acknowledge this in the text (my boldface):
The data have also allowed temporal spatial variations in ocean heat content to be discerned40, suggesting that most of the increase in heat content in the past decade has occurred in the Southern Ocean (which was poorly sampled before Argo); it has also been noted41 that ENSO variability in the tropical Pacific has for now somewhat obscured the global increase in sea surface temperature.
The NOAA/NODC ocean heat content for the same depths and timeframe also shows the additional ocean heat uptake in the extratropics of the Southern Hemisphere. See my Figure 3. The NODC ocean heat content data being presented are available from the KNMI Climate Explorer.

Figure 3
You’ll note in Figure 2 that Riser et al have presented the data in units of Joules*10^22, while for Figure 3 I’ve used the NODC data at the KNMI Climate Explorer, which are presented in Gigajoules per square meter (GJ/m^2). That’s of no concern here, because Riser et al. did not present the trend values and their uncertainties. So let’s simply look at whether the trend lines are positive or negative.
Curiously, for the same period and depths, the NODC data (Figure 3) are showing warming of the extratropics of the Northern Hemisphere comparable to the tropics, while the ARGO data (Figure 2) show a slight cooling in the Northern Hemisphere. With NOAA’s history of manipulating ocean surface temperature data to create warming, many readers will not find that surprising.
CLIMATE MODEL-BASED TOA ENERGY IMBALANCE CANNOT EXPLAIN HEAT UPTAKE IN THE EXTRATROPICS OF THE SOUTHERN HEMISPHERE
UPDATE: In my haste to provide a graph of top of the atmosphere energy imbalance that was easy to visually compare to ocean heat uptake, I converted the energy imbalances for the three regions to anomalies. That was a mistake. The modeled tropical energy imbalance at the top of the atmosphere is positive, while the modeled energy imbalances in the extratropics of both hemispheres are negative values. So I’ve crossed out the remainder of the discussion of energy imbalances and deleted that graph. Thanks to Nicholas Schroeder for the reminder here.
The climate model-based ocean heat uptake is often calculated by the climate science community from the modeled energy imbalance at the top of the atmosphere. See Chapter 1.24 – A Rough Calculation of the Amount of Missing Heat…A Critical Issue from my free ebook On Global Warming and the Illusion of Control – Part 1 (25MB .pdf).
Figure 4 presents the climate model-simulated energy imbalance at top of the atmosphere (TOA), based on the CMIP5 climate models with the RCP6.0 forcings, for the period of 2006-2014. Climate models show the greatest increase in the TOA energy imbalance in the tropics. And you’ll note the models are also showing a higher increase in extratropics of the Northern Hemisphere than the extratropics of the Southern Hemisphere. One might conclude from the disparities in relative trends between Figures 3 and 4 that naturally occurring ocean processes are responsible for the additional ocean heat uptake of the extratropics of the Southern Hemisphere.
Figure 4
The top of the atmosphere energy imbalance is calculated by subtracting the modeled Outgoing Shortwave Radiation (rsut) and Outgoing Longwave Radiation (rlut) from Incident Shortwave Radiation (rsdt). The acronyms are the nomenclature found at the Monthly CMIP5 scenario runs webpage at the KNMI Climate Explorer. I’ve presented the top of the atmosphere energy imbalance in anomaly form to highlight the trends.
We already know that climate models cannot simulate the spatial patterns of the warming of the surfaces of the global oceans. See the recent post Climate Models Are NOT Simulating Earth’s Climate – Part 1. If the models cannot explain where and when the oceans warm at the surface, is it safe to assume the models do not properly simulate the warming of the oceans to depth?
CLOSING
I’ve only addressed a small portion of Riser et al. (2016) in this post. Feel free to comment on additional portions that I’ve overlooked.
Riser et al. (2016) claim the agreement between the ARGO-based ocean heat content data and the NODC data is important. But they failed to present those trends and their uncertainties. Regardless, the NODC uses ARGO-based data so the NODC and ARGO-based data should agree where they overlap. Not too surprising: the NODC show a noticeable ocean heat uptake for the extratropics of the Northern Hemisphere (20N-60N) for the period of 2006-2014, while the ARGO data show a slight heat loss.
The climate model-simulated energy imbalance at the top of the atmosphere cannot explain the extra ocean heat uptake in the extratropics of the Southern Hemisphere as shown by the ARGO-based data. The simulated energy imbalance for the tropics shows the highest increase while the imbalance for the extratropics of the Southern Hemisphere is lowest. Thus, the additional ocean heat uptake in the extratropics of the Southern Hemisphere must be due to ocean processes.
Sadly, climate models fail to properly simulate the spatial patterns of warming of ocean surfaces. Can the climate models used by the IPCC for their 5th Assessment Report explain the extra ocean heat uptake in the extratropics of the Southern Hemisphere as shown by the ARGO-based data for the period of 2006-2014 or explain the relative lack of ocean heat uptake in the tropics and extratropics of the Northern Hemisphere during the ARGO era? Unfortunately, the outputs of the climate model-simulated ocean heat uptake for the CMIP3- and CMIP5-archived models are not available in easy-to-use form.
This paper shows peer review doesn’t mean much. Either this is pointing out the disconnect by stealth – a thing done in a McCarthy era – or journals have a desperate need for material to publish, and can’t be too picky.
Bob,
Thanks for another interesting and informative post!
Are these difference between the warming trends significant? Is the overall ocean warming trend significant?
See the trend in degrees in NOAA website’s current graph of Yearly Vertically Averaged Temperature Anomaly 0-2000 meters with error bars (±2*S.E.). Very tiny error bars. Reference period is 1955–2006.
Levitus 2012 says the uncertainty in estimates of warming in the top 2,000 meters of the world ocean during 1955-2010 is 0.09°C ±0.007°C (±2 S.E.). That translates to 24.0 ±1.9 x 10²² Joules (±2 S.E.). That margin of error is reassuring — an order of magnitude smaller than the temperature change. But is that plausible for measurements of such a large area over 55 years?
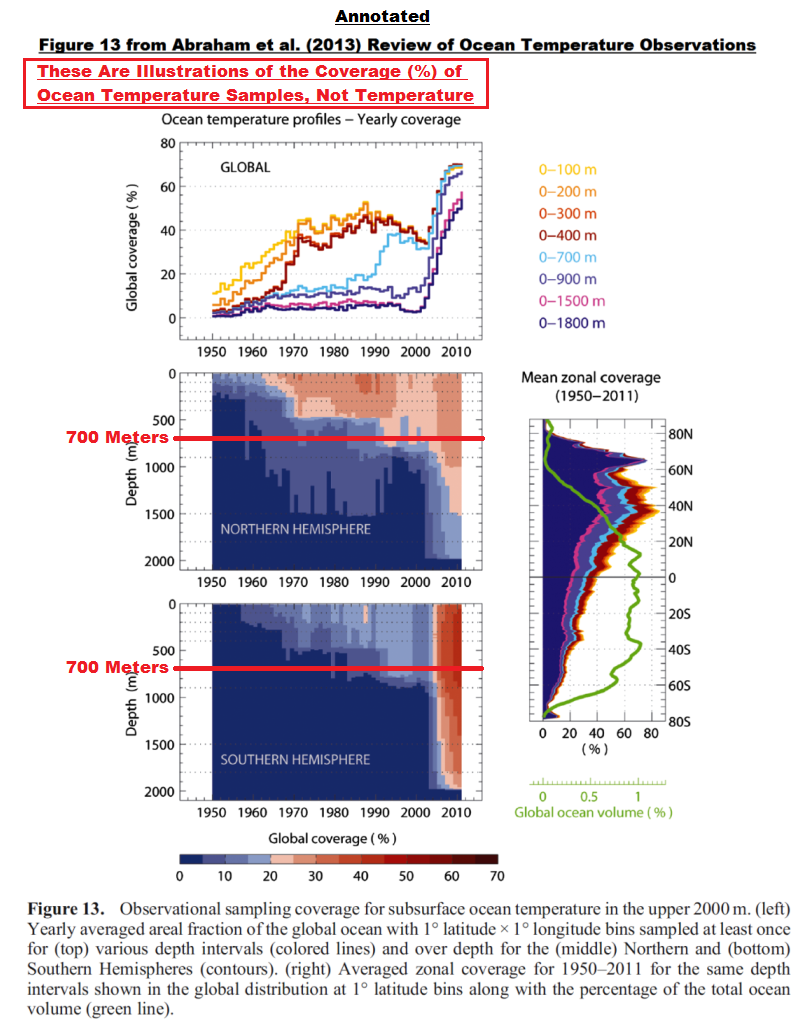
Abraham 2013 lists the sources of error in detail. It’s a long list, including the range of technology used (the ARGO data became reliable only in 2005), the vast area of the ocean (in three dimensions), and its complex spacial distribution of warming both vertically and horizontally (e.g., the warming in the various oceans ranges from 0.04 to 0.19°C).
For more details see How accurate are climate scientists’ findings? Look at ocean warming..
This data coverage animation and chart make a mockery of the accuracy claims by Levitus
Andy,
It is not my field, but fwiw I agree. They seem to be almost self-rebuttal.
Here is an interesting dispersion study (model) that shows why it takes so long for things like the blob to disappear – this shows the Fukishima radiation flowing across the Pacific then moving south along the California current and north along the Alaskan current along with dispersion over 5 years. A while back, Bob Tisdale posted a video showing the development of the “Blob” that appeared to take 5 years for warm water from the Western Pacific to evolve into the warm blob in the Eastern Pacific. At that time I guessed that it would take 5 years for the blob to dissipate. This study suggests a cycle time of 10 to 15 years, perhaps more, for surface waters from Japan to hit the west coast of North America and return. Kelvin waves seem to travel much faster so I don’t know how much the surface currents and deep water transitions have in common. The dispersion of the radioactivity is interesting but not surprising.
http://www.theweathernetwork.com/us/news/articles/scientists-use-fukushima-radiation-plume-to-track-ocean-currents/43260/
NOTE: This is a MODEL based on measuring arrival of radioactivity off the west coast of North America.
https://youtu.be/6Qqd-6N6kjY
Less than 5% global coverage below 700m before 2004, and less than 20% above 700m.
And this guys is claiming an accuracy of +/-0.007C
ROFLMAO !!!
What sort of hallucinogenic mushrooms was the guy on ?
Something does not make sense. I do not mean karlized SST. It could simply be evidence of sampling error, as although Argo is a vast improvement over trade route biased depth varying ship inlet water temps, the oceans are vaster and still undersampled. And as Editor’s graphic shows, in the ARGO era (post sensor transition uptick) we are talking a small fraction of 0.1C delta T. ARGO measures temperature, not heat petajoules.
The oceans warm mainly via short wave radiation penetrating the first tens of meters, the euphotic zone where photosynthesis takes place. That is because the thermal mass of water is about 1000x air. They cool mainly by evaporation from the surface as downwelling IR cannot penetrate beyong it. Latent heat of evaporation is released into the atmosphere via water vapor. Over the ARGO era, the net balance should be about static because none of three satellite global temperature records show statistically meaningful atmospheric warming. That is what ARGO finds in the tropics and NH extratropics.
The Webster et. al. paper (IIRC 2014) showed that the albedo of the SH is remarkably similar to the NH, and that this observed equality has remained so for several years. That means the ocean warming surface reaching sunlight is about the same in both hemispheres.
So there are two reasons why the extratropical SH oceans should be similar to extratropical NH oceans net net; that is, not materially warming in the ARGO era. Yet ARGO says they are.
I have a very hard time buying Balmaseda and Trenberth’s explanation that the pause’s ‘missing heat’ is hiding in the deep oceans. There is no thermodynamic mechanism. I have an even harder time believing only in the extratropical SH oceans.
An advantage of using anomalies, instead of real variable values, is you can make something out of practically nothing.
If you plot real global Temperatures, (K) instead of global Temperature anomalies, you get the same inconsequential nothing as these ocean heat anomaly numbers.
Same cause for both, seems to be the explanation.
G
There are lots of ways of converting between joules and watts/m2. 1.0 joules = 1.0 watt/m2/second.
How many seconds in a year? How many square meters are the oceans or the entire earth surface.
1.0 W/m2/year/earth surface = 1.62 10^22 joules
1.0 W/m2/year/ocean surface = 1.13 10^22 joules
Basically, the 60S-20S ocean is absorbing most of the energy that is being absorbed. But it is only about 0.4 W/m2/year compared to what the human anthro forcing is supposed to be this year of 2.26 W/m2/year.
So, most of what is getting absorbed is going into the oceans and into the southern oceans, but this is still a a very small amount compared to what is supposed to be showing up. Where is the rest going (or was it even there in the first place).
Note that joules absorbed are actually converted from measuring the ocean temperature first. It is the temperature that is being measured by the Argo floats. The joules are calculated based on the temperature change.
Each 0.001C in the entire 2000 metre ocean volume equates to 0.3 10^22 joules.
—————
Also note that the top-of-the-atmosphere energy imbalance is more-or-less assumed to be whatever is going to into the oceans. The satellites and the models can’t make the numbers work so they just default to the ocean heat uptake (0.65 W/m2/year – plus a tiny 0.0235 W/m2/year in atmosphere surface ice-melt heat uptake) and say that is the energy imbalance.
And 0,65 W/m2 happens to be equal to the cloud feedback effect.(WGI;AR5;Chapter 7)
“Figure 7.10 | Cloud feedback parameters as predicted by GCMs for responses to CO2 increase including rapid adjustments. Total feedback shown at left, with centre light- shaded section showing components attributable to clouds in specific height ranges (see Section 7.2.1.1), and right dark-shaded panel those attributable to specific cloud property changes where available.”
(Values on the vertical axis must be multiplied with 0,85 K which is the increase in surface temperature since preindustrial times).
More in my post here: Without cloud feedback there would be no global warming!
GJ/m^2 and W/m^2 are not the same. GJ is energy, watts is power, energy over time. Can’t really compare them. 3,412 Btu = 1 kWh, 3,600 kJ = 1 kWh.
Nicholas Schroeder, I agree that the two metrics (GJ/m^2 and W/m^2) are not the same. In fact, in hindsight I should not have converted the top of the atmosphere energy imbalance to anomalies, because the tropical TOA energy imbalance is positive, while the two extratropical energy imbalances are negative.
Nicholas Schroeder, I’ve removed (crossed out) the discussion of the top of the atmosphere energy imbalance. It was an erroneous last-minute addition. Thanks for catching it.
Does anybody believe, that infrared radition which can enter only a small fraction of a millimeter of surface of the ocean, can heat the whole ocean?
Does anyone believe that a stove element, that cannot enter a saucepan *at all* can heat the whole saucepan? Yep. If you can heat one side of something, conduction, convection, and stirring (currents) can take care of the rest. How much and how fast is another matter.
Not a good analogy. Surely heat created by down welling IR in the top 1 mm of the sea will immediately re dissipated by evaporation and conduction.
Try using a gold mirror to reflect that stove element heat down onto the surface of that water in the pot.
g
The saw tooth profiles indicates that the time frame of 8 years is far too short to provide any conclusion. At one point the tropics show an abrupt reduction in temperature from max to min for the period in just 18 months. The SH shows 2 rapid increases of half the range within 18 months. Is it possible for actual mean sea temperature to change at this rate? I have not done the physics but given the volume of water involved I very much doubt it.
These rapid variations look to be the margin of error. As yet the trends cannot be taken seriously. Give it another 20 years
Very nice observation. ARGO is random drifting. That guarantees clustering/undersampling that shifts with time. We know there are large (and deep) warm and cool currents in the oceans. Over/under sampling changes in them explains the variation you point out. Given the ocean’s enormous thermal mass, it is very unlikely the overall changes at anything like the depicted rates.
Over/under sampling changes in them explains the variation you point out.
==================
what if the swing in energy content 20s-60s is real? it cannot be due to CO2, because the rest of the ARGO ocean temps are flat. so what is causing the warming?
is it, heaven forbid, something natural? do the climate model predictions show anything like this, or is it yet another failed prediction by the climate models?
And where is tge discussion regarding undersea volcanoes, where the depth creates so much pressure that the water superheats to 400C without turning to steam. No IR downwelling or back radiation there. The ocean trumps the air on every energy metric.
The measurements of ocean temp below 300ft before argo are not believable let alone after. I have long wondered if the drifting nature of the buoys produces all kinds of problems. However, my biggest problem is with the assumption that there was no similar heating in the past at these depths. Given that there is no known way the mid-ocean 1000-3000ft could be warmed from CO2 in the mid-atmosphere that I have heard from anyone even the proponents of this theory the most logical first guess would be that this is a condition that is frequently happening and to determine cause. It is illogical to assume that something we just did in the last 20 years is unique in history to cause this. There are numerous possible reasons for periodic heating in this layer of the ocean including the evidence of a 60 year PDO/AMO cycle which must have corresponding levels of heat. There are ocean fissures and there are biological and chemical cycles as well as potentially other causes.
My blog talks about this: https://logiclogiclogic.wordpress.com/2016/02/18/another-big-failure-in-climate-science-underwater-volcanoes/
The assumption that CO2 has something to do with the current warming in this layer of the ocean is not shown. The data does not support this as a unique event. Is it not obvious that something must cause the 60 year cycle in PDO/AMO. The amount of energy is roughly about the amount in the lower ocean being stored. We are clearly in a pause similar to the 1945-1975 period. I have a feeling if we were running argo in 1945-1960 we would see an identical pattern in the same place in the ocean.
The energy from CO2 lost during this period needs to be explained for sure. Possibly it is some of the energy we’ve found but the lack of energy at the surface 1000 feet argues against a cause of the heat below 1000 feet being from CO2 unless there is some elevator which pulls all this CO2 energy down without heating the intermediate layer I find this thermodynamically an impossible explanation. So, we are left that the CO2 energy must have escaped probably through cloud cover changes. I have seen several articles that say in fact cloud cover has decreased and humidity is down both of which could lead to more radiated energy to space.
The more I look at figure 1 the more I think the ARGO data *doesn’t* match the NOAA data. It’s just that the placement of it creates the *illusion* of agreement. There isn’t enough there for the eye to bother about matching slopes, so we simply register “in the same place”.
the ARGO data *doesn’t* match the NOAA data
=====================
agreed. it is an apples to oranges sleight of hand trick. The ARGO data is split into 3 groups, while the NOAA data remains as a single group.
The fuzziness of the 3 groups is then used to hide the poorness of the fit, due to the nature of the mark 1 eyeball to find a pattern where none exists.
This is another case of crackpot science. Compare apples to apples. Split the NOAA data into the same 3 regions and compare these, or average the ARGO data into a single line and compare this.
all data sets match the new karl version better than they match the old version.
Trust satellites? compare Aster versus new and old Karl
Trust argo? compare that to new and old karl
Bottomline, the new Karl is closer to the truth than the old Karl.
Steven, it appears to me that Richard A. O’Keefe and ferd berple are discussing ocean heat content data, not the Karl et al. surface temperature data.
Additionally, the sea surface temperature data disagree with your comment. See the posts here:
https://bobtisdale.wordpress.com/2016/01/27/on-the-monumental-differences-in-warming-rates-between-global-sea-surface-temperature-datasets-during-the-noaa-picked-global-warming-hiatus-period-of-2000-to-2014/
and here:
https://bobtisdale.wordpress.com/2016/01/20/summary-of-the-oddities-in-noaas-new-pause-buster-sea-surface-temperature-product/
Cheers
Two quick comments.
First, what does any researcher hope to accomplish with these analyses? One possibility is that they hope to explain how the planet is actually warming faster than ever because the oceans are warming faster than ever. Not with only one of the three sets of data showing distinct warming. This is not how global warming should work, so please elaborate on the remainder of the mechanism involved.
Another possibility is that this data show a frightening story that can help the theory of global warming through a tough time. This works better if one uses only graphs of ocean heat content, and not temperature increases. If ocean temperature has only increased 0.09 degrees in 50 years–well, that’s not very terrifying because we know that heat stored in the ocean cannot appear suddenly to increase air temperature by any larger amount.
Second, there is this… “Levitus 2012 says the uncertainty in estimates of warming in the top 2,000 meters of the world ocean during 1955-2010 is 0.09°C ±0.007°C (±2 S.E.)”. Measuring temperature to an uncertainty of 0.007 is extremely difficult. I find these estimates to be not credible, and at best they are probably taking into account only a small subset of the potential sources of uncertainty. The estimate undoubtedly assumes IID measurements for the equipment involved and for the processes of thermal variation in the oceans.
Firstly, no researcher should be “trying” to prove anything in analyzing data. The analysis should be in the form of a question as to what is actually happening- but I get what you mean. Given that the data only extends to 2000 metres and is very spotty and of fairly short duration, we have to accept it’s limited value in the additional knowledge that the oceans are a dynamic group of dynamic bodies, populated by various massive currents which move tremendous ( but unknown) quantities of heat around the globe. Much of this heat transport appears to take place along deep channels of perhaps fairly limited width and they may even meander somewhat. So they found a few yellowish pieces to a thousand piece puzzle of a field of dandelions. The .007 C uncertainty is like the error in estimating how many bits of dandelion fuzz are in the whole picture ( as yet unseen). And- oh yeah, we’re all gonna die!
Abstract says: “it has become possible to sample the upper 2,000 m of the ocean globally and uniformly in space and time. ” globally and uniformly!!!!
like andyg55 i think that rather than spending any time at all discussing the contents of this paper the focus should be on the statement you highlight and the entire paper dismissed completely. it is more climate wang .
Whenever ARGO is discussed one has to bear in mind that it initially showed oceanic cooling.
It was assumed that the data must be wrong, and that the buoys that showed the greatest trend in cooling were erroneous/faulty. This was never tested. None of the buoys were taken back to the laboratory for instrument testing/calibration assessment. Instead, the ‘solution’ was to simply to remove from the data series, the buoys that showed the greatest trend in cooling.
In no other branch of science would that have happened. If there was reason to suspect that the returned data was somehow erroneous (and I am not suggesting that there might not have been a valid reason to suspect the accuracy of the data), a random sample of the buoys showing the greatest trend in cooling, and a random sample of the buoys showing the greatest trend in warming would have been returned to the laboratory to ascertain whether there was or was not some equipment error, fault, calibration problem. One would investigate the position, and since if there was some error with the equipment, this error could work both ways and perhaps it was the buoys showing the greatest warming trend were faulty, that possibility should also have been tested. But in climate science, if the data does not give the desired result, one simply adjusts the data (in this case by removing the buoys that were showing the greatest amount of cooling) without in any way whatsoever establishing whether there was a genuine problem with the equipment.
Additionally, as I frequently comment, there has been no evaluate as to whether there is some inherent bias due to the free floating nature of the buoys that drift on currents which currents are themselves density/temperature dependent. The fact that a current has a different temperature profile and the fact that the buoys are swept along with currents gives rise to the possibility that there may be some underdetermined bias in the data being sampled/returned.
See generally:
http://earthobservatory.nasa.gov/Features/OceanCooling/page1.php
If I followed the practice you described above in my profession, I would have ended up in jail.
Richard: “In no other branch of science would that have happened.”
I have a feeling there are multiple cheats going on. This is just a really good example of a bad example.
Does anyone have any idea who many data points are being subtracted from the total, and why? What’s the algorithm? What is the justification?
All it would need for complete defenestration is proof that when the readings from a particular instrument are low, the data is deleted, and when high, are included. That would be proof that the instrument is not rated as ‘defunct’, just that the data is rated ‘deficient’.
“…So these short plots are overlaid on a plot of heat content estimates for 0–2,000 m depth for the period 1955–201042…”
201042? That is one hell of a projection forward!
Michael Jankowski, thanks for catching that. The 42 was supposed to be a subscript.
After looking at the figure presented by AndyG55, relating to coverage (%) of ocean temperature samples, I doubt on the reliability of the temperature anomaly in the Southern Hemisphere oceans with sudden jumps at 2010-11 & 2013-14.
Dr. S. Jeevananda Reddy
Sea levelllllllllllll risingggggggg fastest in 2800 yearrrrrrrrrrrrrrrs! Ladeeeeeeees and gentlemennnnnnnnnnn ….. step right up!
So if you took the climate network, accounted for humidity, and showed the same units (Joules), what would you get?
What strikes me about the ARGO data is that there appears to be no change in ocean heat content in some regions of the ocean. If you match this to sea surface temperatures and satellite temperature measurements it suggests that certain volumes of the Earth’s atmosphere from surface to TOA do not show any change in temperature.
In essence you have steady state thermal conditions and as such the TOA emission of that particular surface footprint should be stable.
Surely this would be useful to finally determine the CERES offset? If it existed under these conditions it could be noted as a real system bias as the underlying system had not changed.
In Fig. 1 the ocean heat content is nearly constant between 20°S and 60°N. In this latitude range the fraction of land is very large. My impression: Phenomena like El Nino, gulf stream and so on transfer the stored heat of the oceans into the atmosphere.
Argo data follow NOAA/NODC ocean heat content quite well, at least after 2007 when the Argo array was fully deployed.
Here is my comparison based on temperature data from Global Argo marine atlas plus hypsographic data from Etopo1, and heat capacity of sea water, etc..:
http://postmyimage.com/img2/960_ARGO_NODC_Models.png
The paper seems to confirm that there is considerable amounts of heat missing, and that climate scientist think that the missing heat might be hiding in the deep oceans below 2000 m depth.:
“Other studies (55,56) point to the even deeper waters of the world ocean, beneath the present limits of Argo sampling, as a possible repository of the increased heating necessary to close the global heat budget.”
And here is another recent paper mentioning missing heat:
Unabated planetary warming and its ocean structure since 2006 (Roemmich et. al 2015)
“As measurements of the Earth radiation budget are relatively accurate for estimation of changes over time but less so for the absolute difference of incoming minus outgoing radiation, an important step in closing the energy budget is to ‘calibrate’ the net radiation with a period of well-measured global ocean heat uptake.
Beginning with the present Argo-only analyses and going forward with planned enhancements to systematic ocean sampling, it is feasible to quantify the total energy budget of the ocean, reducing uncertainties and accounting for the possible sinks of missing energy, including the deep ocean.”
The ARGO data seems to be a pretty important set of data – as one of the strategies by climate scientists seem to be to use the ARGO data set for “calibration” of the global net radiation (The global warming). I hope that the ARGO data set is not messed with.
And here is another paper which also mentions that there is some missing heat:
Unabated planetary warming and its ocean structure since 2006 (Roemmich et al 2015)
“As measurements of the Earth radiation budget are relatively accurate for estimation of changes over time but less so for the absolute difference of incoming minus outgoing radiation, an important step in closing the energy budget is to ‘calibrate’ the net radiation with a period of well-measured global ocean heat uptake.
Beginning with the present Argo-only analyses and going forward with planned enhancements to systematic ocean sampling, it is feasible to quantify the total energy budget of the ocean, reducing uncertainties and accounting for the possible sinks of missing energy, including the deep ocean.”
As some climate scientists considers using ARGO data for “calibration” of the net radiation (The global warming) I sincerely hopes that all original measurements are recorded, archived and that full traceability is maintained for all measurements and every single exclusion or corrections.