While the Pacific “blob” seems to have died, this new research say they can find blobs lost in time. What is most interesting is that they say Greenland went through temperature shifts of 10-15 degrees C in just 50 years, all without any man-made influence.

New research published in Scientific Reports in February indicates that a warm ocean surface water prevailed during the last ice age, sandwiched between two major ice sheets just south of Greenland.
Extreme climate changes in the past Ice core records show that Greenland went through 25 extreme and abrupt climate changes during the last ice age some 20.000 to 70.000 years ago. In less than 50 years the air temperatures over Greenland could increase by 10 to 15 °C. However the warm periods were short; within a few centuries the frigid temperatures of the ice age returned. That kind of climate change would have been catastrophic for us today. (link)
Ice core records from Antarctica also show climate changes in the same period, but they are more gradual, with less severe temperature swings.
The Nature Scientific Report study shows that an area of the Nordic Seas, just south of Iceland, followed the Antarctic pattern of warming and cooling. Which is strange since it is so close to Greenland.
“We had expected to see sudden climate changes. But sediment core records from the area show that the climate changes here were actually gradual, and quite identical to Antarctic climate changes.” says CAGE professor Tine Rasmussen, the principal author of the paper.
Gulf Stream holds the answers
Then, as now, the circulation of Atlantic Ocean, with currents such as the Gulf Stream, regulated transportation of heat to this area. Simply put, the surface currents transport heat from the southern and tropical Atlantic toward the North Atlantic.
” The Nordic seas between Norway and Greenland play a crucial role for the current patterns of the Atlantic Ocean. They act as a pump. Here the warm and salty surface water cools down during winter. It becomes heavy and is pumped down to the bottom before returning to the Atlantic, where it continues as a deep current all the way to the Antarctic region. ” co-author Erik Thomsen from Aarhus University ( link) points out.
Without this pump, the north-south current system would slow down considerably. Changes in this circulation can have a profound impact on the global climate system.
During the ice ages this circulation was assumed to work as a seesaw in the playground – going up and down in opposite directions with an axis somewhere around the equator. The idea is that when it warmed in the north, it cooled in the south and vice versa. But Rasmussen and colleagues indicate another scenario.
Rewriting the seesaw hypothesis
During the coldest periods of the last ice age the Nordic seas were covered with a permanent layer of sea ice. The pump stopped transporting the heat northward. The heat accumulated in the southern oceans. However, the warming was not restricted to the south.
” Our results show that it continued all the way to Iceland. The warming was slow and gradual, and happened simultaneously in both hemispheres. Little by little the warm Atlantic water penetrated into the Nordic sea underneath the ice cover. It melted the ice from below. Once the ice was gone, the pump started up again, bringing additional warm water into the Nordic seas. And we got a warmer period for 50 years. ” says Rasmussen.
Large ice sheets continued however, to cover the continents around the Nordic seas. In contact with the warm ocean water they started calving. This delivered icebergs and fresh water into the sea and caused a cooling down of the surface water. The seas were again frozen. And the pump slowed down.
The warm ocean blob of the ice ages rewrites the understanding of the ocean circulation systems, and how they affected the extreme climate changes of the past. The seesaw was actually more of a ‘push and pull’ system.
“There are no symmetrical processes in the north and the south – the climate changes were principally governed by simultaneous warming and the constant closing and re-opening of the sink pump in the Nordic seas” says Tine Rasmussen
###
Well, we’ve had “The Blob,” “Son of Blob,” and now “Cousin or Ancestor of Blob???”
Climate IS interesting, especially when viewed dispassionately, and without dollar bills being thrown over the transom or under the table!!!
Anthony,
“Extreme climate changes in the past Ice core records show that Greenland went through 25 extreme and abrupt climate changes during the last ice age some 20.000 to 70.000 years ago. In less than 50 years the air temperatures over Greenland could increase by 10 to 15 °C. However the warm periods were short; within a few centuries the frigid temperatures of the ice age returned. That kind of climate change would have been catastrophic for us today. (link)”
“That kind of climate change would have been very challenging for us today.” I suggest.
The problem is not technical – it’s political . . . .
Auto
…Oops, no more grant money for them ! They forgot to say the magic words …” Man made Catastrophic Climate Change ” !!
Dont suppose there is any kind of volcanic activity involved in these blobs. Iceland is renowned for some pretty spectacular eruptions.
That “blob” is over what has been mapped as a currently active, submarine volcano. Do the atmosphere people ever talk to the ocean people? Probably not…after all, if the oceans are actually obeying thermodynamic laws, and heating is rising from the floor to the higher layers, no one claiming the atmosphere is causing it would welcome that information.
B.L.O.B
Boiling Lava Observed Below
Better Look On Bottom
birdynumnum February 21, 2016 at 6:50 am
Aphan February 21, 2016 at 9:27 am
—————————————————–
Had to laugh, thanks.
Not to mention the ridge and as yet possibly un-mapped volcanoes and black smokers.
Not to mention that the weight of the glaciers would also have had to play a role with the above tectonic action jackson.
So many variables not yet understood.
The weight of all that ice melting and coming off Greenland is obviously running into the sea and buckling the plates on the ocean floor due to the extra weight. This in turn is causing volcanoes to erupt underwater which is making the hot water thats melting the ice.
Its all over Im afraid.
Dont think I will get into a lava over it though being in the SH.
“In less than 50 years the air temperatures over Greenland could increase by 10 to 15 °C.”
That is crazy! I wonder if there is any coincident, volcanic, solar, or SUV activity.
https://malagabay.wordpress.com/2013/06/18/chronology-ice-cores/
It is most likely due to an anomalous heating of the Gulf Stream, which would have pushed its way up into the Labrador Sea. In the early 1980s, I saw a published paper that showed the ocean temperature of the Labrador Sea reached the 80s and 90 degree Fahrenheit during the time of the Greenland warming period. This was based on core sampling of the sea bed. The paper was soon widely scorned as preposterous and removed from circulation. It’s time to resurrect that paper and give the author credit, if he is still alive.
It’s sad, but very common, that accurate science is discarded just because it says something unpopular.
David Thompson,
Incidentally, coincident with that anomalous heating was the collapse of the cod fishery. I was aware of the panic at the Bedford Institute of Oceanography at that time and aware of the 1000’s of abruptly unemployed fisherman. I mean abruptly! One season… loads of fish…next season nearly none. Blame was laid on mankind for “overfishing” but the fish population may have moved or died off due to ocean salinity, nutrient, and temperature changes?
“… they say Greenland went through temperature shifts of 10-15 degrees C in just 50 years, all without any man-made influence.”
Many have pointed out that there have been large temperature sifts in the past — long before human released CO2 could have been the cause. The main problem with the CO2 myth of the present is that climate “scientists” have almost outlawed mention of natural variation and that is a shame.
I read one theory that said that the total energy of the planet had not changed much over a long time, but that it would get colder in the northern hemisphere while it was warmer in the southern and we would see the glaciers in the north and think it was an ice age all over the globe. I am not so sure that theory is correct but in science we should investigate all plausible causes and not just lock in on the discredited CO2 mythology.
Glaciers advance in the SH at the same times as in the NH.
But the theory was that they have not always done so. Like I wrote, I don’t know if the theory has any merit, but all aspects of how climate changes should be “on the table” until we figure it out. Certainly natural variation is a difficult problem.
When the NH grows ice sheets, ice also expands in the SH. This has happened in all the Pleistocene glaciations.
The interglacials are also coordinated, as now.
Old but confirmed by subsequent study:
http://www.sciencedirect.com/science/article/pii/0277379190900245
GM
You’re quite probably right about the Pleistocene.
And earlier times?
Could it be that markstoval has some sense in his comment:
“we should investigate all plausible causes and not just lock in on the discredited CO2 mythology”
Auto
Mods – here an enquiring mind – no /sarc whatsoever.
Auto,
The continents were arranged differently during previous Ice House eras, periods and epochs.
@ markstoval, feb 21, 6:58 am. You said, “The main problem with the CO2 myth of the present is that climate “scientists” have almost outlawed mention of natural variation and that is a shame “,
it’s not a shame, it is criminal.
As Steve Andrews (Steve McQueen) said at the end of the film, The Blob, when the Air Force transport The Blob to the Arctic to remain in an inactive, frozen state: “Yeah, as long as the Arctic stays cold.”
Sounds like Heinrich and D/O events:
http://www.ncdc.noaa.gov/paleo/abrupt/data3.html
Yes, the paper shows data which is very similar to the Dansgaard-Oeschger events, although they are slightly out-of-phase with the D-O events.
The temperature changes they calculated for the north Atlantic are in the order of about 4.0C during these swings (although again there is always suspect translation of dO18 isotopes to temperature in Greenland-Greenland-linked climate science – I would translate the isotope data as about 2.0C-3.0C swings – The D-O events in Greenland were not anything like the 10-15C often quoted, maybe 6C if the proper math was used.)
The study is open-access on-line.
http://www.nature.com/articles/srep20535
The key chart is this one. Calculated North Atlantic SSTs is the second line from the top – and then compared to Greenland, Antarctica data etc.
http://www.nature.com/article-assets/npg/srep/2016/160205/srep20535/images_hires/m685/srep20535-f5.jpg
Thanks. I always learn things from your comments.
I was reading it while you posted, BI. One core in one spot seems rather skimpy evidence for inferring Atlantic circulation changes, even though the reasoning is impecable and the D-O events are well recognized.
Inferring SST from foraminifera paleo proxies is also fraught with uncertainty. Essay Cause and Effect showed how poor statisticly Shakun’s essentially wrong paper on CO2 and SST was. He deliberately hid the paleo proxy uncertainty that negates his conclusion, but which was easy to tease out of the SI.
“Extreme climate changes in the past Ice core records show that Greenland went through 25 extreme and abrupt climate changes during the last ice age some 20.000 to 70.000 years ago. In less than 50 years the air temperatures over Greenland could increase by 10 to 15 °C.”
=============================
who says this process has stopped? Isn’t the vast majority of the warming seen in the past 50 years nearly identical to this? Warming of the Arctic near Greenland, which when averaged over the entire globe shows global warming. Where is the CO2 in all of this? Or were cavemen driving around in SUV’s 20,000 years ago?
http://www.bobcesca.com/files/2013/10/flintstone-car.jpg
“Or were cavemen driving around in SUV’s 20,000 years ago?”
Are you suggesting they weren’t ??
How else could the climate change ??
Next you’ll be saying it’s all a natural process !!
..Those dinosaur farts were pretty nasty !!!
I love those blobs, both in the Pacific and in the Atlantic – and the more and the warmer they got wouldn’t precipitation increase over the huge ice sheets in America and Scandinavia??
That kind of climate change would have been catastrophic for us today.
=====================
why? primitive humans lived through it. We have just lived through 50 years of similar warming. And there have never been more humans living in relative prosperity. By what measure has warming been bad? It is the cooling that follows that is likely to cause the problems.
Earth hasn’t enjoyed 50 years of warming. The world was in a cooling trend from the 1940s to late ’70s. It did warm from around 1977 to 1996, but the super El Niño blew that off and since then global average temperature has stayed about the same or cooled.
^^This!!^^
Back in the 1970s one of my buddies attended a climate presentation by a visiting scholar. His main message was that we have been living in an abnormally stable climate for the last 10,000 years.
The Insanity of Worry about CO2 is that by every measure of climate we are slowly slipping into the next Ice Age, and with this Ice Age will come the extinction of most of the major cities of Europe and North America.
This process is absolutely clear in the Paleo records. None of the inter-glacial periods have lasted much longer than our current one. And they don’t end gradually with lots of warming. The temperature drop is steep and sudden. The snow will fall one winter, and by the end of summer it will not have melted. We saw hints of this in the 1970’s.
And then for 30 years temperatures warmed, food shortages disappeared from memories, children grew up not knowing what famine was. Instead we started hearing that warming was a problem, that we needed to eliminate CO2. That we need to eliminate warming and return to the natural Ice Age cycles.
Just because something is natural doesn’t mean it is good for you. Smallpox, Plague, Polio, Malaria, Dengue and Zika are all 100% natural.
The previous interglacial, the Eemian, lasted 5000 years longer than this one has so far. The interglacials of ~400,000 and ~800,000 years ago lasted even longer. The Eemian and those two prior ones were also warmer than the Holocene.
That makes me think of this cartoon.
Commie Bob…perfect cartoon! Goes with ferdberple’s observation
ferd – isn’t it typically the other way around?
You say: “The temperature drop is steep and sudden.” But the graph by Bill Illis above (and others) seem to show rapid warming followed by gradual cooling. Much like our current interglacial. There was rapid warming and we have been cooling with many bumps since the inter-glacial “optimum”. (humour intended.)
Now for a little more humour:
https://en.wikipedia.org/wiki/Holocene_climatic_optimum
Stated with authority. 😉
What about geothermal heating? It looks to me like this hot spot is right smack on top of the mid-ocean ridge which extends to Iceland. We know that Iceland is an extremely active volcanic site. Why discount the possibility that there is a hot spot on the ocean floor near Iceland, similar to the plume that formed Midway and the Hawaiian Islands in the Pacific? It could well be that the Blob is the next Iceland in waiting, millions of years from now.
Some geologists think Iceland is a hot spot like HI, but others disagree.
https://en.m.wikipedia.org/wiki/Iceland_hotspot
Icelandic volcanism is associated with mid-oceanic crustal rifting; Hawaii may be in the middle of an ocean but there is no such rifting.
When you’re constantly discovering new elements in a system it indicates that you don’t know the system very well. Certainly not well enough to be making projections about what it will do, let alone predicting all sorts of negative consequences that will result of its behaviour.
“It ain’t what you don’t know that gets you into trouble. It’s what you know for sure that just ain’t so.”
Too true. Anyone who claims to really understand a probably chaotic climate system is blowing smoke (and I won’t sahy from where).
Tom
+ shed loads & shed loads.
Auto
PS – Mods – the science really isn’t settled or anything like it, despite some desperate claims . . . . . . .
Your postings in this thread are pretty LAME.
“Your postings in this thread are pretty LAME”
Speaking of lame, is that all you have for us?
Paul, LAME is an acronym for ‘Look At Me Everybody’. As you may notice, Auto used keywords ‘A~y’ and ‘M~s’ in all posts to provide some useless work for them when forced to look at his important posts.
Maybe like http://iwastesomuchtime.com/on/?i=70678
Climate science is chock full of urban legends. Urban legend theories are theories (mechanisms) which are repeated when there is obvious data and logic that supports the assertion that the theories in question are completely incorrect, not part of the solution.
Solar cycle changes are the cause of past cyclic climate change and were the cause of the warming in the last 150 years. The pathetic climate wars are going to end when the planet abruptly cools.
1. The discrete thermal halone ocean conveyor theory has been proven incorrect by ocean float data (twice as those pushing the incorrect theory did not believe the data from the first test). The discrete thermal halone conveyor ‘theory’ started with a picture that Wally Broeker drew without proof. My theory see picture. Repeat picture a thousand times in articles and bingo everyone believes picture has something to do with reality.
Ocean float data shows only 8% of the deep water flow in the North Atlantic fallows the Broeker conveyor path. Therefore two consequences: 1) changes in the fresh water flow into the North Atlantic cannot interrupt the North Atlantic drift current and 2) changes of the North Atlantic drift current do not affect ocean current flow in the Southern Hemisphere. Wally’s picture was to try to come up with a solution to a problem. Incorrect theories block solving problems. They are not ‘part of the solution’.
2. Basic analysis shows the heat transferred by the North Atlantic drift current is three times less than heat that is transfer from solar summer warming of the North Atlantic ocean. A complete interruption to the North Atlantic drift current therefore cannot cause the cyclic warming and cooling of Europe and Greenland Ice sheet.
3. The warming in the Southern Hemisphere is simultaneous with the warming in the North hemisphere. If ocean currents where the cause of the warming which they are not as there is no direct link of the ocean current flow in the Northern and Southern hemisphere there would be roughly a 1000 year lag.
4. When the Southern hemisphere, the Greenland Ice Sheet, and the Northern hemisphere warm, the Antarctic ice sheet cools. This phenomena is called confusingly the ‘Polar see-saw’ (see Svensmark’s attached paper, there is no see-saw). The Antarctic ice sheet cools as the albedo of that ice sheet is greater than the albedo of clouds and the Antarctic ice sheet is separated from the Southern ocean by a the Antarctic polar vortex which enables the Southern ocean to warm and the Antarctic ocean to cool.
News flash: The Antarctic Ice sheet cooled in the last 50 years which is exactly what has happened in the past when solar cycle changes cause the warming of the Northern and Southern hemisphere. This is one of more than a dozen different observations and analysis results which support the assertion that solar cycle changes are the cause of cyclic warming and cooling of the planet.
Therefore an increase in cloud cover over the Antarctic causes warming of that ice sheet rather than cooling. The albedo of the Greenland ice sheet is low than the Antarctic ice sheet and the Greenland ice sheet is not isolated by a polar vortex and hence unlike the Antarctic ice sheet follows the temperature of the surround ocean.
http://www.sciencedaily.com/releases/2009/05/090513130942.htm
http://www.americanscientist.org/issues/pub/the-source-of-europes-mild-climate
http://www.atmos.washington.edu/~david/Gulf.pdf
http://arxiv.org/abs/physics/0612145v1
William Astley, Bob Tisdale
Interesting, and detailed commentary.
Now, my challenge then: Since 1979 sea ice records began, the Antarctic sea ice anomaly has been generally increasing, with a few very large (1.5 to 2.0 Mkm^2) increases and decreases that “jump” high and and low from the long-term trend.
Most recently, the Antarctic sea ice anomaly – which had been sharply rising from 2010’s El Nino through July 2015’s suddenly dropped to near-zero in late August, then has been hovering at near 0.0 since August through today. This “seems” to correspond to the fall 2015 El Nino, just like 2010’s Antarctic sea ice negative anomaly matches the 2010 El Nino. But today’s recent South Sea (the ocean waters around Antarctic) surface water temperature anomalies have NOT been “hot” during the low Antarctic sea ice anomaly. Further, stable (not moving) warm surface sea water off the South American coat – the definition of an El Nino (or its opposite – the La Nina cooler waters) take a lot of time to circulate west towards Australia near the equator, turn and bend south towards Antarctica then flow under the Antarctic sea ice to head back north towards the El Nino regions near the equator.
So, the past 5 months of low Antarctic sea don’t “seem” to be El Nino related. This time.
If the warm north-west Pacific “blob” reduced the Arctic Okhotsk sea ice anomaly in 2014-early 2015 north of Japan, does this month’s “loss of blob” incident indicate the Okhotsk sea ice will likely go back the normal, thus increasing total Arctic sea ice back towards its historic normals of 1980-1995 that the CAGW community so strongly desires?
This is not a root cause. The root cause would explain “simultaneous warming and the constant closing and re-opening of the sink pump in the Nordic seas”. Send money.
This is just the climate equivalent of astronomy’s “dark matter”. The technique is, when evidence refutes your theory, don’t change the theory, but instead announce a new kind of phenomenon — previously unheard of and scientifically unmodelled — and nest it into your theory and proclaim that it makes your theory even stronger! My BS meter is broken now from overloading.
Agreed. Background radiation too flat? The universe suddenly inflated for no reason to flatten it out. Galaxies spin too fast? Must be dark matter. Universe receding too quickly? Must be dark energy. What are these things? How do they fit into the standard particle model (itself a massive parameter-fixing exercise)? No idea. But guess what! IT’S TRUE! There was inflation, there’s dark matter, dark energy! Aren’t cosmologists wonderful! /sarc
I was horrified when I discovered the anti-science, ratbaggery and all-round dishonesty of the CAGW movement in 2008. But since then I have been wondering about the branches of science I love and admire, the ‘hard’ fundamental sciences. What about the Higgs boson? Predicted and searched for umpteen times until it was finally “found”. But think: what does a failed search mean? It was predicted to exist at a certain energy level and wasn’t there. That’s the failure of the theory (the “standard model”). It made a faulty prediction. Re-predicting at a higher energy is adjusting the parameters to fit the facts. And this went on a number of times. The inescapable conclusion from this is that the theory has enough free parameters to adjust to any experimental outcome. It isn’t science. None of this bodes well for us as a species maintaining our very best attributes in the face of obscurantism and opportunism.
Thanks for the elaboration, Ron, and how you’ve put it is exactly what I mean. A quick mention of two early examples which were undermining science before our day: (1) “Entropy” in thermodynamics is the part that gets lost in the process. So they made thermodynamics beautiful by saying that entropy is the state of disorder in the system, and so everything added up as though they knew what they were talking about. Fooled me for 25 years, I thought thermodynamics was the most perfect science. Struck me like a thunderclap when I realized it was all just another shell game. (2) In math, “formalism” is where existing theorems take you when pressed to the extreme, whereas “constructivism” is when math theories are considered to be “not real” unless actually constructible from lower order theorems. 90% of mathematicians are formalists and hold constructivism as heresy. And all this time, it is constructivists who build computational theorems which are actually used by computers and engineers, while the formalists waste time publishing useless nonsense. I point these out to show that the virus of invalid thought was present even in older times, but it’s really got us by the balls now.
@ Ron, Feb 21, 6:30 pm. I have had the same feeling about the arguments you are making, to me it is this ” who do you believe” notion, with Global Warming the last few years that has proved to be a scam, what else is being driven by these grant seeking projects? I have looked at my wife many times and mentioned ” where is all this money coming from and who gets the benefits”.
Do not get me wrong there are many things that science and exploration have found and have benefited humanity in many ways. BUT I firmly believe those that are paid for by directly or indirectly by the taxpayers should be common knowledge and immediately available to the general public. This includes many “hidden” taxes. Those seem to disappear. Think of it this way, we the taxpayers provide a grant, the project finds something and patents it, where do the royalties from those patent flow to, the taxpayers? I wonder.
I think this is exactly wrong. Why? Because warm blobs can occur in the presence of normal overturning circulation. We have one right now. Where did it come from? The accumulating El Nino layered warm water riding ocean currents and getting stuck in the outside “rough” of our main larger ocean gyres http://oceanmotion.org/html/background/wind-driven-surface.htm. The action isn’t at the polar edges in a top down motion where cold water sinks and warm water rises http://www.eoearth.org/view/article/150290/. The action is in the circular top 700 meters, an action that happens all over the globe. Fluid dynamics folks.
YES!!! the pieces are starting to fit into place as to my ideas that the cause of the last ice age was in a large part down to the blocking of the weather patterns over the long term. Understand weather and you understand the cause of this “blob”. Because to have got ice sheet extent we saw during the last ice age then the weather patterns would have to have formed a blocking high in the Greenland/Northern Europe area, that was on the same scale as the Azores High is in the present. This Atlantic Blob is to my mind along the other facts.ls strong evidence that this is just what happened during the last ice age
Which leaves the meridional overturning to continue as the lesser complicated factor, not the major one http://www.aoml.noaa.gov/phod/research/moc/namoc/.
The issue here are the lesser high-latitude gyre blobs which swirl latitudinally above and on the outskirts of the major gyres and apparently serve to collect the warm top layer from El Nino episodes. I don’t know if these higher latitude gyres have a regular appearance schedule (such as towards the end of a string of El Nino’s). I don’t know if a long-lived Pacific and/or Atlantic one is/are responsible for warm-epic peaks such as the MWP, or over-energetic and long-lived polar vortex ice sheet advances.
hmmmm.
am missing a reply?
Well Pamela the reason why l think it has little to do with the North Atlantic Drift.
ls because is if this was reason for this blob.Then why did the climate of NE europe/NW Russia become much colder then most of the rest of the NH during the coldest part of the last ice age?.
Can a mod check the bin for a missing reply to taxed please
Which leaves the meridional overturning to continue as the lesser complicated factor, not the major one http://www.aoml.noaa.gov/phod/research/moc/namoc/.
The issue here are the lesser high-latitude gyre blobs which swirl latitudinally above and on the outskirts of the major gyres and apparently serve to collect the warm top layer from El Nino episodes. I don’t know if these higher latitude gyres have a regular appearance schedule (such as towards the end of a string of El Nino’s). I don’t know if a long-lived Pacific and/or Atlantic one is/are responsible for warm-epic peaks such as the MWP, or over-energetic and long-lived polar vortex ice sheet advances.
hmmmm.
This is what this Atlantic blob suggests to me what was going on during the last ice age.
There was persistent high pressure blocking in the area between Greenland and NW Russia, and that this blocking extended into the summer months. This blocking at times would push warm air up from the mid Atlantic and flow across Greenland. So leading to large swings in temp across Greenland. But over NE europe/NW Russia this same blocking would be sending cold Polar air flooding down across that area. Which would explain why it became much colder in this area. To have got weather to “play ball” with the forming of ice age. Then there would needed to have been blocking highs in and around the area where this blob was. The forming of this blob strongly suggests that this is just what happened.
Hmmm. (Link) in para 2 does not appear to work.
Mods. That link still not working.
During the period of the ice sheets wouldn’t the northern oceans be somewhat protected from wind effects due to the surface sitting at lower elevation? Would this lead to warmer surface waters?
Or as l suggest,that persistent high pressure blocking over this area. Which lead to light winds and increased sunshine amounts. So allowing the sea surface water to warm up. The fact that there was a blob in that area. Is what suggests to me that the blocking extended into the summer months. As this the area that is most likely to have been free of ice during the summer in the northern Atlantic.
1) What are the implications for sea level associated with such a cycle? (E.g., periodic warming and calving)
2) Is the resolution in sea level proxies sufficient to see such an effect?
Epic fail.
It is not a pump, it is a waterfall.
Pumps convert mechanical energy into potential energy, but this sink works in the opposite direction. It sucks in water masses with high potential energy and converts them into ones of low potential energy, generating some mechanical energy (currents) along the way.
As soon as pumping (in this case: rain) stops in the upper basin of a waterfall, that basin dries up, and the waterfall stops going. Also, if water accumulating in the lower basin is not removed, it fills up, with the same result.
In case of the so called thermohaline circulation the active pump is vertical turbulent mixing elsewhere, mainly in mid latitude southern oceans. Without it thermohaline downwelling at the ice margins would grind to a halt, because the abyss eventually gets saturated with dense, cold salty water and no amount of cooling can produce higher density at the surface any more.
Therefore the global flux of downwelling is determined by an actual pump, which converts pure mechanical energy input, via breaking internal waves generated by tides and surface winds over rugged bottom features and at continental margins of complex geometry, by generating intermittent vertical turbulent mixing, which replenishes abyssal buoyancy, consumed by downwelling elsewhere.
Average rate of vertical turbulent mixing over the open ocean is measured to be much too low to do the job and there is no such thing as “upwelling” at all, for obvious reasons. So all the work is done at specific sites and specific times.
Salt water, unlike fresh water, assumes its highest density just above freezing (at -1.9 °C), what is more, ice does not like salts, so salinity of freezing water masses is incearesed further by brine exclusion. That makes water sink somewhere along the ice margin.
The exact locations are determined by highest density, and that may vary over time. However, it should always be close to the ice/water interface, as long as such interface exists, because of the physical properties of sea water. But the global flux of downwelling is another issue, which has nothing to do with ice. It is determined by the rate of vertical turbulent mixing, half of which is provided by tidal breaking, the rest by mid latitude winds, most (about 80%) over the Southern Ocean and a small amount over the North Atlantic.
Downwelling is also an interesting process. At current configuration of ice sheets the ice/water interface never goes down beyond several meters in the Northern Hemisphere, but around Antarctica it is a completely different story. There are sites where the bedrock, upon which the ice sheet rests, goes down to several hundred meters below sea level, even a kilometer at some sites. It is important, because the melting point of ice decreases with increasing pressure, and temperature of water at the interface is at the local melting point. That means temperature of Antarctic bottom water initially can be well below the freezing point at the surface.
http://www.antarctica.gov.au/__data/assets/image/0020/108173/varieties/antarctic.jpg
The process may be rather complex. As coastal polynyas open up due to strong catabatic winds blowing down the Antarctic plateau, surface water is cooled to freezing temperature. As some sea ice is produced, its salinity is also increased due to brine exclusion, so it starts to sink. However, as it sinks, its temperature increases somewhat due to adiabatic compression. But it keeps coming into contact with ice well below sea level, which cools it down further. The net result is the densest possible water mass, with somewhat lower salinity, than that of North Atlantic deep water, but considerably colder than that, so it goes below it when they meet somewhere around the equator.
If enough Antarctic bottom water is produced to balance deep vertical mixing at mid latitudes, downwelling stops elsewhere altogether, including the North Atlantic. However, total flux of Antarctic bottom water seems to be limited in the current epoch, so downwelling also occurs in the North Atlantic, where temperature of water can not go below -1.9 °C, but salinity is higher.
It is hard to tell how this unfolded during the ice age. First of all, there were huge continental ice sheets in the Northern Hemisphere, some resting on bedrock well below sea level in coastal regions, so bottom water formation, which is currently restricted to the Southern hemisphere, could happen here as well. If buoyancy resupply in the abyss was fast enough, it could also maintain some downwelling along the sea ice margin, but because sea ice used to extend much farther south, location of downwelling should also have been south of its current locations.
The ACC current extends from the surface to the abyss. It seems a wind driven centrifugal pump, complete with venturi producing jets into the Pacific at the Penninsular/Australian restriction, and into the Atlantic at the South American restriction.
As you have pointed out many times, there is nowhere enough potential energy for it to be a thermohaline heat engine.
I am not clear about your “mid latitude southern ocean vertical mixing pump”. Firstly, if it is the Antarctic bottom water undercutting the Atlantic (I have heard the opposite, never been down to measure myself), that becomes a thermosteric engine, no? Secondly, and possibly quibbling, the Southern Ocean is generally defined as high latitude >60. In case this is not quibbling and your intention is that some sort of vertical mixing pump is taking place, partitioned between Southern Hemisphere continents, at southern latitude 45 or thereabouts; please explain.
There must be something in the black hole bin with my name on it. Anthony?
Well, Steve McQueen used CO2 to freeze the original Blob. (?)
Since times have changed, maybe if you sprayed a bunch of CO2 on your comment it might be unfrozen from “the bin”?
Or maybe black holes don’t about CO2? 😎
Arrrrgggg!
“Or maybe black holes don’t about CO2? 8-)”
Or maybe black holes don’t care about CO2? 😎
There’s blobs, and then there’s BLOBS. This paleoblob seems to always hang out in the same place, like a boring hydrothermal vent or something. Now a BLOB, that gets interesting because it’s like the Loch Ness serpent, a secret warm current that touches the surface here, there, the next place before meeting a rock wall in the crook of Alaska. There, it’s opportunities become limited. It spreads south along the coast following the gyre, riding atop the Ekman upwelling.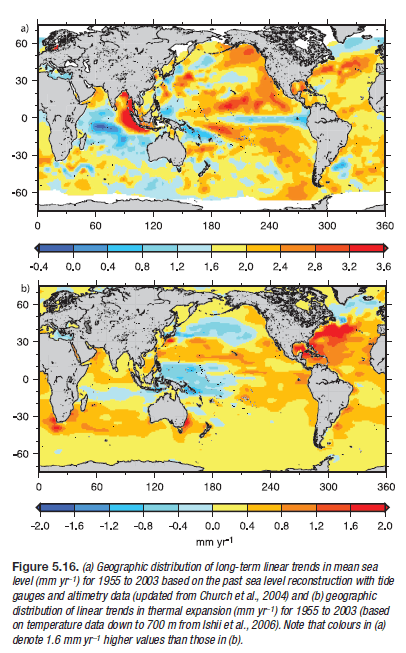
It is not unprecedented.
While this may look like the late BLOB, it is actually the trends in sea surface heights and thermal expansion from 1955 to 2003…
You hear little of the convection of crust heat to the oceans, how quantified is this aspect?
Mark, You will never hear much about that, as the Earth is 4.5 billion years old and should be cooling,yet internally it is bubbling with cracks,vents and volcanoes trying to release excess heat. Does not compute with mainstream science.
The “climate scientists” don’t care that it’s not quantified either. Some old study was done where a couple of scientists ESTIMATED how much heat/gas was being released by measuring a handful of active volcanoes on land (not all….and not continually either) and called it negligible. But then ocean scientists began exploring the ocean floor (oceans cover 70% of this planet) and finding ACTIVE volcanoes, vents, cracks. They hypothesized that ocean floor volcanoes at a certain depth COULD NOT violently explode or erupt due to the pressure of the water above them. THEN they found evidence….a LOT of evidence, that not only CAN it happen, it HAS happened, more than once. The ocean floor that we HAVE examined is covered with old debris, more recent debris, smoking vents with LIVING creatures on/near them in super heated water, minerals and gases spewing out of them, and hot water vents, and plate cracks and volcanoes galore.
Think about it….the tectonic plates might be moving so slowly we cannot see it (but we CAN measure it) but the FORCE of their movement is STILL making the Himalayan Mountains GROW upward! Imagine the pressure and force that takes! To push not only a landmass around, but to push against gravity and move it upward at the same time. An ice skater causes enough gravitational force for the ice between their skate blades and the rink ice to MELT…allowing them to slide across the ice. Mega ton glaciers moving against the GROUND cause enough friction to melt the ice between them which allows them to “slide” due to gravity either pulling or shoving them. If friction can melt ice on the surface, what kind of heat must be caused JUST by the friction of two continents shoving against each other? Not to mention the MOLTEN core of this planet which by the laws of nature MUST be relieving internal pressure and heat outward or it would explode?
Yellowstone is a prime example of a whole lot of deep earth heat and pressure actually arriving at the surface on land. Scandinavian countries where geothermally heated water is a power source….is deep earth heat/pressure arriving at the surface. Hot pots. Natural hot springs. All OVER the surface. And land is only 30% of the Earth’s crust exposed.
http://www.mbari.org/mbari-researchers-discover-deepest-known-high-temperature-hydrothermal-vents-in-pacific-ocean/
http://www.stormchaser.ca/caves/naica/naica.html
The Naica Crystal Caves were formed under intense pressure, and are NORMALLY full of incredibly hot water. It was pumped from the caves by miners, and if they STOP pumping it out, the cave would fill again.
You never, ever, hear “climate scientists” talk about, or acknowledge this stuff:
http://www.livescience.com/15084-radioactive-decay-increases-earths-heat.html
The research funded in response to this will have to include quantum mechanical effects of AGW and its alteration of the past before human causes in linear chronology. An official response will come to patch the problem in the green scriptures.
A ‘hot spot’ directly over the Mid-Atlantic Ridge, just south of Iceland?
I have to say it again: submarine vulcanism – it is totally ignored by all ‘global circulation models’, unpredictable, a measurable source of heat input to the oceans, and significant enough to affect ocean currents, which affect surface water and air currents and storm tracks.
http://www.livescience.com/15084-radioactive-decay-increases-earths-heat.html
Just posted that above. So much more out there. But in all of the AGW studies, Earth is treated as a “black body” that has no heat of it’s own, which is a complete and utter lie. They are so incredibly stupid, and they assume everyone else is just as stupid as they are.
Aphan
February 22, 2016 at 1:21 pm
———————————————————————-
Thanks Aphan a couple more links for this collection.
One of the first discoveries and realization that volcanoes occur under ocean, was up, under the Arctic Ocean on Gakkel Ridge. They estimated it erupted around 1999 and that it was similar in scope to the eruption that took out Pompeii.
So much of this going on under there.
They don’t yet have a decent handle on this.
Much less incorporate the info into some sort of heating and cooling model.