Guest Post by Bob Tisdale
This post will serve as part 2 of the 2015 update of the model-data comparisons of satellite-era sea surface temperatures. The 2014 update is here. This, the second part, contains time-series graphs. But the data and model outputs are being presented in absolute, not anomaly, form.
INTRODUCTION
The climate models used by the Intergovernmental Panel on Climate Change (IPCC) are not simulating climate as it exists on Earth. That reality of climate models will likely come as a surprise to many climate laypersons.
We presented in part 1 of this series how the spatial patterns of the modeled warming rates for the surfaces of the global oceans from 1982 to 2015 (the era of satellite-enhanced sea surface temperature observations) show no similarities to the spatial patterns of the observed (data-founded) warming and cooling. And we discussed why it’s important that the models used by the IPCC are capable of simulating where and when and why the temperatures of the ocean surfaces vary. It’s relatively easy to understand. Where and when the surfaces of the oceans warm, don’t warm, or even cool naturally and by how much—along with other naturally occurring factors—dictate where and when land surface air temperatures rise and fall and where precipitation increases or decreases…on annual, decadal and multidecadal bases.
In part 2, we’re presenting the model-data comparisons in time-series graphs globally and for a number of subsets. And as noted earlier, the data and models are being presented in absolute form. The use of sea surface temperatures instead of anomalies helps to illustrate addition problems with the models.
WHY ABSOLUTE TEMPERATURES?
The actual ocean surface temperatures, along with numerous other factors, dictate how much moisture is evaporated from the ocean surfaces, and, in turn, how much moisture there is in the atmosphere…which impacts the moisture available (1) for precipitation, (2) for water vapor-related greenhouse effect, and (3) for the negative feedbacks from cloud cover. In other words, failing to simulate sea surface temperatures properly means the atmospheric components of coupled ocean-atmosphere models are also flawed.
PRELIMINARY INFORMATION
The sea surface temperature dataset being used in this post is the weekly and monthly version of NOAA’s Optimum Interpolation (OI) Sea Surface Temperature (SST) v2 (a.k.a. Reynolds OI.v2). We’re using it because (1) it is the longest running satellite-enhanced sea surface temperature dataset available, (2) its satellite data are bias adjusted based on temperature measurements from ship inlets and from buoys (both moored and drifting), and (3), most importantly, NOAA’s Reynolds OI.v2 data have been called “a good estimate of the truth”. See Smith and Reynolds (2004) Improved Extended Reconstruction of SST (1854-1997). The authors stated about the Reynolds OI.v2 data (my boldface):
Although the NOAA OI analysis contains some noise due to its use of different data types and bias corrections for satellite data, it is dominated by satellite data and gives a good estimate of the truth.
This is not the (over-inflated, out-of-the-ballpark, extremely high warming rate) high-resolution, daily version of NOAA’s Reynolds OI.v2 data, which we illustrated and discussed in the recent post On the Monumental Differences in Warming Rates between Global Sea Surface Temperature Datasets during the NOAA-Picked Global-Warming Hiatus Period of 2000 to 2014. Based on that post, we also are not using the NOAA ERSST.v4 “pause buster” data, which makes up the ocean portion of the NOAA and GISS combined land+ocean surface temperature products. NOAA has adjusted the numerous parameters in their ERSST.v4 model so that the warming rates for the NOAA-selected periods of 1951-2012 and 2000-2014 are at the extreme high ends of the trend uncertainty ranges for those periods. And as we illustrated and discussed in that post, the original (weekly/monthly, 1-deg resolution) version of the Reynolds OI.v2 data we’re presenting herein has, basically, the same warming rate as the UKMO HADSST3 data for the NOAA-selected hiatus period of 2000-2014.
The climate models presented in this post are those stored in the CMIP5 archive, which was used by the IPCC for their 5th Assessment Report (AR5). The CMIP5 climate model outputs of sea surface temperature are available through the KNMI Climate Explorer, specifically through their Monthly CMIP5 scenario runs webpage, under the heading of Ocean, ice and upper air variables. Sea surface temperature is identified as “TOS” (temperature ocean surface). For consistency with past posts, the “CMIP5 mean” and the Historic/RCP6.0 scenario are being used. The RCP6.0 scenario is the closest to scenario A1B used for the CMIP3 models (used by the IPCC for the 4th Assessment Report). And once again we’re using the model mean because it represents the forced component of the climate models. Basically, the model mean represents the consensus of the climate modeling groups for how the surfaces of the oceans should warm if they were warmed by manmade greenhouse gases and the other factors used to drive the models. For a further discussion, see the post On the Use of the Multi-Model Mean.
Because the model-data comparisons are in absolute terms, annual data are being presented. The Reynolds OI.v2 data start in November 1981 so the comparisons run from 1982 to 2015…34 years.
The linear trends in the graphs are as calculated by EXCEL.
GLOBAL TIME-SERIES
Figure 1 presents two model-data comparisons for global satellite-era sea surface temperatures, not anomalies. The top graph for the latitudes of 90S-90N includes the polar oceans. Excluding the polar oceans, the latitudes of 60S-60N are shown in the bottom graph. It makes little difference whether we include or exclude the polar oceans in the model-data comparison. The disparity between the models and data is slightly greater if the polar oceans are excluded, but, bottom line, the models show too much warming.
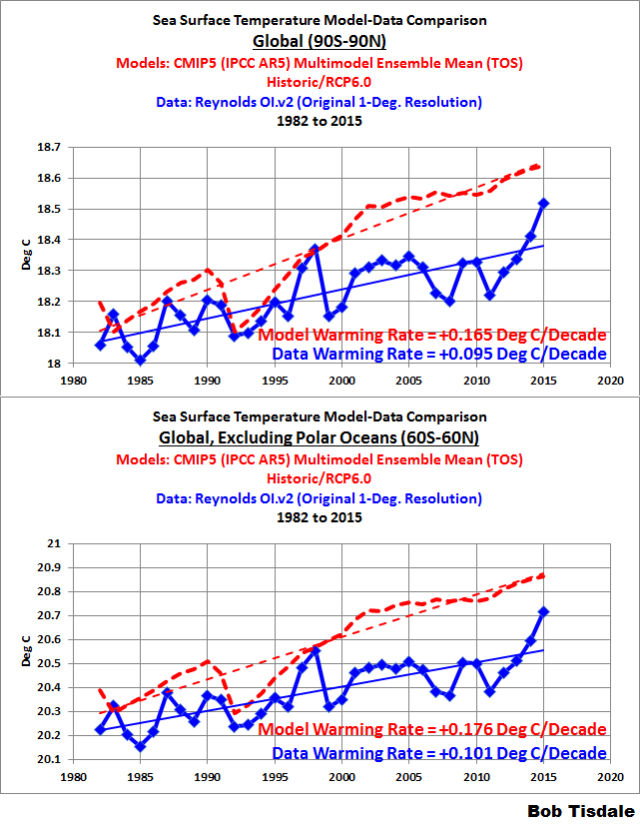
Figure 1
The differences between models and data on a global basis highlight a very basic problem with the models. The modelers have to rely solely on manmade greenhouse gases and other anthropogenic factors to drive the climate models, because climate models do not properly simulate the timing, magnitude and duration of naturally occurring processes that can cause ocean surfaces to warm. Based on those models (that bear no similarity to the real world), the surfaces of the global oceans were expected to warm at a rate of roughly 0.17 deg C/decade for the past 34 years, but in the real world, the observed global warming rates due to the combination of natural variability and greenhouse gases was only about 0.10 deg C/decade. That’s a monumental difference between hypothesis and reality.
Another fact to consider: the data existed while the modelers were preparing their climate models for the CMIP5 archive. In other words, the modelers knew their goals. And the best the modelers could do was almost double the warming rate of the surface of the global oceans. That’s an atrocious modeling effort…even with the recent upticks in global sea surface temperatures attributable primarily to The Blob in 2014 and to the 2015/16 El Niño in 2015.
Also note that the climate model-simulated ocean surfaces are slightly warmer than observed. For the latitudes of 60S-60N, the average model-simulated ocean surface temperatures for the period of 1982 to 2015 are about 0.2 deg C higher than observed. Maybe that’s why climate models simulate too much precipitation globally. See Figure 2, which is Figure Intro-10 from my ebook On Global Warming and the Illusion of Control.

Figure 2
TROPICAL SEA SURFACE TEMPERATURES
The models overestimated the warming of the sea surface temperatures of the tropical oceans (24S-24N) over the past 34 years…no surprise there. The surprise is how similar the modeled and observed sea surface temperatures are in the tropics. See Figure 3. For the tropical oceans, the average model-simulated ocean surface temperatures for the period of 1982 to 2015 are only about 0.02 deg C higher than observed.

Figure 3
While the absolute temperatures are very similar, the models overestimated the warming by a wide margin. The data indicate the sea surface temperatures of the tropical oceans warmed at a not-very-alarming rate of about +0.08 deg C/decade, while the models indicate that, if the surfaces of the tropical oceans were warmed by manmade greenhouse gases, they should have warmed at about +0.19 deg C/decade. Now consider that the tropical oceans (24S-24N) cover 76% of the tropics and about 46% of the global oceans.
That disparity between models and data supports the June 2013 model-data comparisons of the warming of the tropical mid-troposphere prepared by John Christy. See Roy Spencer’s posts EPIC FAIL: 73 Climate Models vs. Observations for Tropical Tropospheric Temperature and STILL Epic Fail: 73 Climate Models vs. Measurements, Running 5-Year Means. The models grossly overestimated the warming rates of the mid-troposphere in the tropics.
Let’s break down the tropical oceans. As shown in Figure 4, the difference between the simulated and observed warming rates for the tropical Atlantic and Indian Oceans (24S-24N, 80W-120E) is about 0.08 deg C/decade, with the models showing too much warming of course.

Figure 4
But for the tropical Pacific (24S-24N, 120E-80W), Figure 5, the models are showing warming at a rate that’s almost 0.14 deg C/decade higher than observed.

Figure 5
El Niño and La Niña events have their greatest direct impacts on the Eastern Tropical Pacific. During an El Niño, warm surface and subsurface waters from the western tropical Pacific flood into the eastern tropical Pacific along the equator, with the warmer-than-normal subsurface waters rising to the surface. During ENSO neutral (not El Niño or La Niña) periods and during La Niña events, cool waters from below the surface are upwelled to the surface. Apparently, climate modelers haven’t grasped even the most subtle aspects of the tropical Pacific. While the data for the Eastern Tropical Pacific (24S-24N, 180-80W) show no surface warming over the past 34 years, the consensus (groupthink) of the models indicate the surfaces there should have warmed at a rate of 0.18 deg C/decade. See Figure 6.

Figure 6
EXTRATROPICAL SEA SURFACE TEMPERATURES
For the extratropical oceans of the Southern Hemisphere (90S-24S), Figure 7, the observed warming rate is also extremely low at about 0.06 deg C/decade. On the other hand, the climate models indicate that if manmade greenhouse gases were responsible for the warming of the sea surfaces in this region, the oceans should have warmed at a rate of 0.12 deg C/decade, effectively, doubling that observed trend. Now consider that the extratropical oceans of the Southern Hemisphere cover about 33% of the surface of the global oceans (about 23% of the surface of the planet).

Figure 7
On the other hand, the climate models seem to get the warming rate of sea surfaces just about right for the smallest portion of the global oceans, the extratropical Northern Hemisphere (24N-90N). See Figure 8. The extratropical oceans of the Northern Hemisphere cover only about 21% of the surface of the global oceans (about 15% of the surface of the Earth).

Figure 8
Unfortunately for the modelers, they underestimated the warming of the surface of the extratropical North Atlantic (Figure 9), and overestimated the warming in the extratropical North Pacific (Figure 10), so they accomplished the overall warming of the extratropical Northern Hemisphere incorrectly. No surprise there.
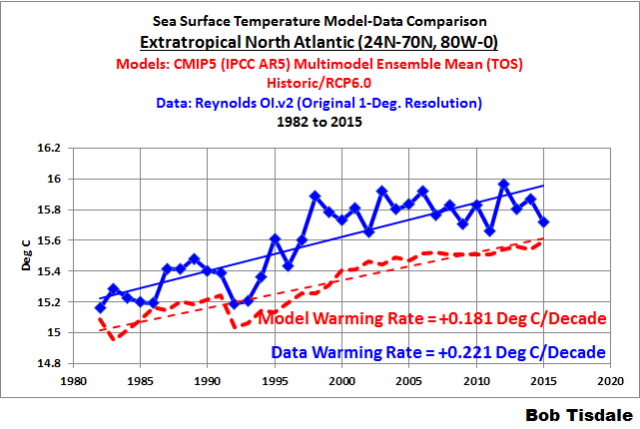
Figure 9
# # # # # # #

Figure 10
Now note the similarities between the modeled and observed surface temperatures (not trends) of the tropical oceans (Figure 9). The average observed tropical sea surface temperatures for the period of 1982 to 2015 are only 0.02 deg C cooler than the models. Then there are the differences between the models and observations in the extratropics of the Southern (Figure 7) and Northern (Figure 8) Hemispheres. For the period of 1982 to 2015, the modeled sea surface temperatures in the Southern Hemisphere are too warm by almost 0.8 deg C, and in the Northern Hemisphere, the modeled sea surface temperatures are too cool by 0.4 deg C. Those are further indications that ocean circulations in climate models are flawed.
Those disparities in absolute temperatures may help to explain why climate modelers cannot simulate the sea ice loss in the Northern Hemisphere and the sea ice gains in the Southern Hemisphere. See Figures 11 and 12, which compare modeled and observed sea ice area for the Northern and Southern Hemispheres. They are Figures Intro-8 and Intro-9 from my ebook On Global Warming and the Illusion of Control.

Figure 11
# # # # # # #
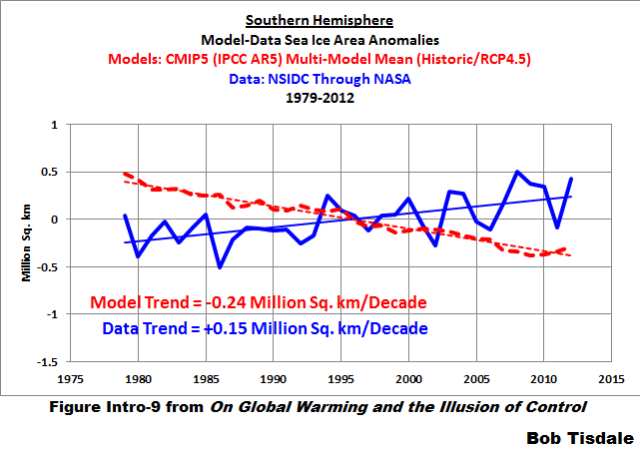
Figure 12
INDIVIDUAL OCEAN BASINS
The following are model-data comparisons for the individual ocean basins and their hemispheric subsets where appropriate…without commentary.

Figure 13
# # # # # # #

Figure 14
# # # # # # #

Figure 15
# # # # # # #

Figure 16
# # # # # # #

Figure 17
# # # # # # #

Figure 18
# # # # # # #

Figure 19
# # # # # # #

Figure 20
# # # # # # #

Figure 21
ATLANTIC MULTIDECADAL OSCILLATION
The Atlantic Multidecadal Oscillation is often described as the variations in the surface temperatures of the North Atlantic that take place over periods of 50 to 80 years. In this light, the Atlantic Multidecadal Oscillation is typically displayed by detrending the long-term sea surface temperature anomalies of the North Atlantic. The argument against the detrending is that it doesn’t consider “global warming”.
If you’re not familiar with the Atlantic Multidecadal Oscillation see the NOAA Frequently Asked Questions About the Atlantic Multidecadal Oscillation (AMO) webpage and the posts:
- An Introduction To ENSO, AMO, and PDO — Part 2
- Multidecadal Variations and Sea Surface Temperature Reconstructions
Over some multidecadal periods, the sea surfaces of the North Atlantic warm faster than the rest of the global oceans, and during other multidecadal periods, the North Atlantic sea surfaces warm slower than the rest of the global oceans and can also cool dramatically. For much of the period of November 1981 to December 2014, the sea surface temperatures of the North Atlantic were on one of their naturally occurring upswings.
As noted earlier, detrending the North Atlantic data does not account for the warming of the global oceans. Therefore, a better description of the Atlantic Multidecadal Oscillation is the additional long-term variations in the sea surface temperatures of the North Atlantic beyond those of the global oceans. To this end, to portray the Atlantic Multidecadal Oscillation, Trenberth and Shea (2006) subtracted global sea surface temperature anomalies (60S-60N), from sea surface temperature anomalies of the North Atlantic (0-60N, 80W-0). That method accounts for the additional variability of the North Atlantic data above the variations in the global data. But, for this post, we’re adding a minor twist to that method. We’re presenting the difference between the global and North Atlantic data in absolute terms, not anomalies.
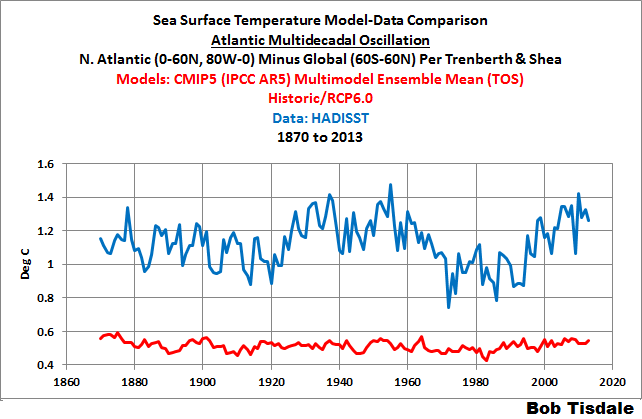
Trenberth and Shea (2006) used HadISST data, so I used that dataset for this discussion in past updates. See Figure 22, which is Figure 25 from the post Alarmists Bizarrely Claim “Just what AGW predicts” about the Record High Global Sea Surface Temperatures in 2014. It displays the modeled and observed differences between the North Atlantic and global sea surface temperatures for the period of 1870 to 2013, a.k.a. the Trenberh and Shea (2006) portrayal of the Atlantic Multidecadal Oscillation.

Figure 22
Obviously, the data show that there are noticeable multidecadal variations in the sea surface temperatures of the North Atlantic that are beyond those seen in global data. That of course indicates that the natural variations in the surface temperatures of the North Atlantic can enhance or suppress global warming. Or as NOAA ended their FAQ webpage about the Atlantic Multidecadal Oscillation:
In the 20th century, the climate swings of the AMO have alternately camouflaged and exaggerated the effects of global warming, and made attribution of global warming more difficult to ascertain.
Unfortunately, the model mean of the climate models does not show that additional variability in the sea surface temperatures of the North Atlantic, indicating the Atlantic Multidecadal Oscillation is forced by the factors (primarily manmade greenhouse gases) that create global warming in climate models.
So let’s update that graph using the Reynolds OI.v2 data, which limits our view to the past 34 years. First the components:

Figure 23
The top graph in Figure 23 shows the modeled sea surface temperatures for the global oceans (60S-60N) and for the North Atlantic (0-60N, 80W-0) for the period of 1982 to 2015. The modeled trend of the North Atlantic is very similar to the warming rate for the global oceans, only about a 0.02 deg C/decade difference. The bottom graph shows the observed North Atlantic and global sea surface temperatures. The data indicate the warming rate of the North Atlantic is almost 0.1 deg C/decade higher than that of the global oceans.
Figure 24 includes the model-data comparison of the satellite-era Atlantic Multidecadal Oscillation, using the method presented by Trenberth and Shea (2006), except that we’re dealing in absolute temperatures. According to the model mean (which represents the consensus or groupthink of the modeling groups), the sea surfaces of the North Atlantic should only have warmed at a rate that was slightly higher than the global oceans, but the data indicate the surface of the North Atlantic is capable of warming at a rate that’s almost 0.1 deg C/decade higher than the global oceans without being forced by the factors (primarily greenhouse gases) that drive the models.

Figure 24
The other problem shown in Figure 24: the difference between the surface temperatures of the North Atlantic and the global oceans is too small…once again indicating that the ocean circulation in the models is flawed.
CLOSING
We live on an ocean-covered planet. One might have thought that one of the climate modelers’ first priorities would have been to simulate the processes that cause sea surface temperatures to vary on annual, decadal and multidecadal bases. Sadly, the modelers elected another route…they chose to create models of a planet that bear no relationship to the one where we live, no relationship at all.
Climate model simulations of sea surface temperatures are far from reality. That is, they’re modeling a virtual planet—a science-fiction planet—with no similarities to Earth. More specifically, as shown in this series of posts, the climate models used by the IPCC do not simulate (1) the actual warming and cooling rates of the ocean surfaces, or (2) the spatial patterns of those trends, or (3) the absolute temperatures. It would be nice if climate modeling agencies might try to simulate the surface temperatures of this planet, not some fairytale one. That way, their models might have some value. Right now, they don’t serve any purpose…other than to illustrate how poorly they simulate Earth’s climate.
Next in this series: ocean heat content.
Reblogged this on Climatism and commented:
“The climate models used by the Intergovernmental Panel on Climate Change (IPCC) are not simulating climate as it exists on Earth.”
I am entertained by science fiction.
I think the Dolphins were right.
I never go any were with-out my towel.
I do not believe it. Prove it to me and I still will not believe it.
But thanks for all the fish.
Well who would want a model that models the earth’s climate ? How are you going to get grant money to do that ?
But it’s amazing what you can get grant money to study, or write about.
Down there on another thread, an anonymous stranger on the internet located a whole bunch of papers that prove that something doesn’t happen.
Now to paraphrase Albert Einstein, you only need one experimental observation (and subsequent paper on it) to prove that something happened. But even an infinite number of observations of that not happening, and the subsequent papers on those experiments, are insufficient to prove that it doesn’t or cannot happen.
But this anonymous stranger on the internet swears that he found many such papers, that prove that something doesn’t happen; namely people having died by internal overheating due to physical exertion while they were insulated by old style non breathing modern fabrics, that prevented their sweat from evaporating, and dissipating the internal heat they were generating.
Now I can understand a medical report of somebody having died from such a cause; but I can’t understand why people would publish a whole bunch of papers or medical reports about people NOT dying from internal overheating due to wearing non breathable insulating fabrics.
Now Mallory and Irvine died in 1924 at high altitude on Mount Everest, while wearing non breathable insulated clothing; but it is fairly well established that they died by falling off the mountain. So nobody ever wrote a report that they didn’t die from Hyperthermia, for wearing old style non breathing insulating fabrics. The reports all say that at least Mallory died in a fall, because they actually found his body, and he was dead; and it is presumed that Irvine likely did too, and possibly took Mallory down with him.
But anyhow, this anonymous stranger on the internet, has found numerous medical reports that say somebody didn’t die from hyperthermia due to wearing older clothing.
Unfortunately they must be copyrighted papers or reports, because he didn’t cite references or quote from any of them.
So if they give all of this grant money to people to not model the earth’s climate, why don’t they use some of that grant money to actually model the earth’s climate ??
Well I’m just asking !
G
Bob:
All these graphs appear to show temperature changes, not change in climate
Do all the climate models predict changes in climate or do they only predict changes in temperature?
Walt D: Surface temperature is one of the numerous metrics simulated and output by climate models. For example: Figure 2 shows global precipitation and Figures 11 and 12 present hemispheric sea ice area.
Thanks Bob.
Thanks Bob, very interesting.
Nice one bob, as usual. More so, the planet does not really have a single global climate from a personal perspective because we all, as individuals, live in separate climatic zones. Your charts clearly show these differences manifest in the temperatures.
Great post. Thanks!
In figs 19 & 20, how can the surface sea temperatures,both measured and modelled, be below 0 deg C, going as low as minus 0.7 deg C?
Is this a definitional matter?
Should there be concern that an important phase transition at a putative 0 deg C is straddled by measured and modelled numbers as if it did not exist?
Geoff Sherrington, isn’t the freezing temperature of sea water -1.8 deg C?
I think there may be a definitional matter. OI v2 registers frozen areas as having a temperature of -1.8°C, the freezing point of sea water. If you include that data, you do indeed get a low average in S Ocean, and of course, no variation in those areas. I don’t know if TOS as reported at KNMI follows this practice, but I think quite likely not. Hadley doesn’t.
Thank you Bob and Nick.
I was wondering about model/measure divergence and whether some of the representations of temperature (and related factors like salinity, density, CO2 saturation) were getting close to a point where aphysical processes are within their error bounds.
Geoff
Nick says, “If you include that data, you do indeed get a low average in S Ocean, and of course, no variation in those areas”
==========================================================
The southern oceans have been cooling. The trend is real, and SH sea ice verifies this, so I am not certain what you mean by “no variation in those areas”?
“I am not certain what you mean by “no variation in those areas””
It simply means that if you have a region of sea ice that you declare to have a temperature of -1.8°C, the temperature there cannot change from year to year, and if you include it in the Southern Ocean average, the trend will be artificially stabilized. HADSST says in that situation that there is no data; it returns the average of wet sea that can vary.
Nick Stokes – I’m interested in your comment that if you have a region of sea ice that you “declare to have a temperature of -1.8 deg C” then the temperature there can’t change. My understanding is that ice can get colder than it’s freezing point, so it looks like you are saying that the ice temperature can’t be measured, only assumed. Is that correct?
“so it looks like you are saying that the ice temperature can’t be measured, only assumed. Is that correct?”
Well, it isn’t measured, in these datasets. ERSST and OI V2 simply report the temperature of iced areas as -1.8°C. North Pole is -1.8 all year round, every year. So it has zero trend.
That’s OK if sea-water temperature is what you want. But if you are using it as a proxy for air temperature, obviously for iced areas it won’t do. All serious indices have some way of dealing with this.
Reblogged this on Norah4you's Weblog and commented:
Somewhere over the rainbow, sun may shine on good and evil, on facts as well as fiction.
BUT
Always remember: Nature is Nature and Facts are Facts, not Fiction.
The Independent “Our children won’t know what the snow is” and Independent on Sunday newspapers are to cease print editions in March
http://www.bbc.co.uk/news/uk-35561145
Very well organized and presented article. It is great to see actual, rather than anomaly, temperatures, and spatial-temporal variations between oceans. The modelers sure hide a lot with global temperature anomalies.
Bob, thanks for the straightforward analyses and presentations of measured vs modeled data. It sure helps when the author is trying to make data and facts apparent. One of my favorite articles here.
At some point, after protracted number crunching, one of these state of the art computers models will tell us that the answer is ’42’.
…I’d forgotten how the argument between Deep-thought and the philosophers sounds ominously like the bickerings and motives of climastrologists.
I took a global warming class at stanford univ and the climate modeling chief from LLNL came to speak. One of the first things he said: “The climate models are wrong. They don’t model anything well.” The class looked at him speechless and disbelieving. He repeated. “The climate models are wrong. They don’t work.” He said that studies showed that no model was any better than any other model in that if you pick any random period one model may do better but if you picked another period a different model was as likely to do better. I noted that meant the models couldn’t be modeling physical processes. He insisted they tried but in the end he admitted they were essentially fits to the data. He also explained the models have unphysical dampening. He explained when they first did the models they produced ridiculous results like parts of the earth would go to -200C or +200C. So they introduced algorithms not based on any natural process which made the models so the result “looked like” possible weather. In other words things varied by reasonable amounts.
It is hard to believe we are spending billions on these models considering the gross problems described. It is plainly obvious to anyone of even a modicum of scientific knowledge these are complete failures. It doesn’t mean hopelessness but the current approaches clearly are fatally flawed. They cannot possibly incorporate real physics in the sense that they model how the atmosphere works. Otherwise if one model had the physics right you would expect it to consistently outperform models that didn’t have the right physics. The fact none of them works better says immediately that none of them are actually modeling REAL physics. The use of non-physical dampening is just as it implies. It is non-physical meaning that is NOT how the real world works.
He said they did overall temperature okay but everything else from wind to precipitation to humidity or any other physical parameters were completely off the wall wrong. No relation to reality. One wonders how a model which is supposed to model climate which gets everything wrong that would affect temperature could possibly model temperature? It can’t. It’s impossible. The correspondence of temperature in hindcasts is clearly a result of “fitting” which means of course we’ve spent billions on a mathematical exercise a competent undergrad math major could do for an undergrad research paper.
If we are paying billions for models that we know are unphysical there are better much cheaper ways of modeling the past temperature curve. One way I tried recently simply involved a couple variables. I used “soot” to mean the cold produced by atmospheric particulates. “solar” to mean increased solar radiation we’ve seen at times. I used a PDO/AMO cycle and calculated using a sensitivity analysis that the frequency was 60 year cycle and with a 0.23C variation up and down and I found a TCS for CO2 of 1.2C. This simple spreadsheet model that took me a couple hours fit the unadjusted temperature record for 120 years with almost perfect precision. Certainly far better than the models. It showed all the ups and down perfectly and in sync. It only worked with unadjusted data though. I couldn’t make it converge with adjusted data. 🙁 Wonder why?
The model I did in a couple hours showed 2100 would be about 0.3C higher than today. That would make a huge amount of sense. Another way to look at this is that in 70 years since 1945 we have increased CO2 by 31% or so. This is about 40-45% of the way to 550 which is where I believe we will end up with CO2 in 2100. Therefore since we’ve had about 0.3C in those 70 years the next 70 or 80 years will produce about another 0.3C (CO2 is logarithmic). So, my model is confirmed by another method.
I certainly don’t think I did any magic brilliant work here. I’m just pointing out that several models can be produced with “spare time” of a couple people maybe that works better than billions of dollars of people’s time and centuries of computer time. It’s time to put an end to these computer models. They are stupid, don’t work and we’ve wasted vastly too much money on them. I like the australians argument for laying off 110 climate scientists. If the science is settled as they continue to pander then why do we need to study. It’s all settled. Fine. Go get real jobs and we’ll see if another bunch of blokes taking a completely different approach might be able to settle the settled science by rewriting it to the correct science.
Beautiful. I don’t know how to do models mathematically, but have made one by graph and eyeball that shows the next peak about 2100 and about 0.2 degrees C warmer than now, followed by a somewhat higher peak near 2300. Between now and 2100 there is a significant valley bottoming about 2035 about 0.5 degrees C cooler than now. Do you have the cooling?
I didn’t do that so I just did it. Great question. I extended the model another 300 years. I had to make a bunch of assumptions. 1) I assume we will keep the skies clear so that the soot factor stays 0 in terms of cooling any more. We don’t know what the cyclic phenomenon of the sun is. I assume that the sun doesn’t change from today which is a bad assumption I realize but according to my model I have not put a lot of effect from the sun except possibly indirectly from PDO/AMO. I also assume that CO2 will peak at about 520 and decline slowly. Nobody knows how fast the CO2 will decline but my model shows CO2 dropping to 377 by 2400. It may drop MUCH FASTER than that. So, this is pretty conservative assumptions.
My model shows the peak temperature is actually reached in 2125 at about 0.55C over todays temperature. In other words 2100 is not the high. In fact it is at an early part of an upcycle in PDO. So temperatures rise after 2100 for some time to this peak about 0.5C higher than today or another 0.2C from 2100. I have one low at 2215 which gets back to todays temperature and around 2345 temperatures are 0.15C lower than today. By 2400 my model shows temperatures are 0.4C lower than today.
If CO2 falls faster then these schedules could move 100 years earlier. I don’t believe my model is correct because 1) we don’t understand the deeper cyclic behavior of the ocean 2) we don’t understand the cyclic behavior of the sun 3) it does not take into account what we’ve recently learned about deep ocean fissures and heat released from the mantle. These may or may not have significant impact on the time scales of a few hundred years. It is such a short time from a geological perspective.
I have become convinced a big reason for the weakness of the CO2 “amplification” is because they misinterpret the role in paleological records of CO2 variations. I believe a principal reason for the warmists sticking to the TCS=3 is because they see in the paeological record a change of temperature that they can’t explain other than by trying to ascribe a high CO2 amplification. I have recently learned that Milankovic cycles combined with glacier movements can cause forces on the earths crust that open or close fissures in the ocean that release or close off heat to the earth and the oceans. This is probably MOST of the reason for the changes in temperatures during the ice ages. This means CO2 has much less to explain for ice age temperature variation. Therefore TCS for CO2 can be much lower as we are finding out. This is undoubtedly confusing to the CO2 stalwarts but they simply ignored things they shouldn’t have ignored.
“Therefore since we’ve had about 0.3C in those 70 years the next 70 or 80 years will produce about another 0.3C (CO2 is logarithmic). So, my model is confirmed by another method.”
Good comment. I also programmed “crystal ball” future predicting programs (we did not call them “models” at that time and place) and learned that you can match the past pretty well but the future is much harder. 🙂
I also learned that if you start with crappy assumptions (like CO2 warms the surface) then getting any useful information is all that much more difficult.
I am in agreement that these “climate models” are utter crap. They should be tossed into the garbage. (along with all who worked on them)
~ Mark
They do not do clouds well as a result of what Bob has demonstrated. There is a graphical illustration from CMIP5 in essay Models all the way Down.
“Right now, they don’t serve any purpose…other than to illustrate how poorly they simulate Earth’s climate.”
Correction Bob,,,,,,, the models are setting global energy policy as I type, without any vetted scientific substantiation for such.
“Climate Models Are NOT Simulating Earth’s Climate”
Gasp!
OT question for Bob. Do we have a Blob update in our future?
ossqss, there’s an update for The Blob in the recent monthly SST update:
Full post is here:
https://bobtisdale.wordpress.com/2016/02/09/january-2016-sea-surface-temperature-sst-anomaly-update/
While the computer models a totally scientifically wrong, they do serve a political purpose and that is what the modelers are paid to do.
READ MORE: Trudeau and UN chief Ban Ki-moon to talk climate, refugees, peacekeeping. First Hand experience in Montreal of – 20 C reminds me of all gore in a snow storm that had to cancelled. At that time it was called Global Warming.http://globalnews.ca/news/2513797/un-secretary-general-ban-ki-moon-to-meet-coderre-couillard-in-montreal/
Bob, you show some similarities between the models and observations in some equatorial ENSO areas. What I find interesting is that the models are based on the addition of CO2 driven additional warmth, while your proposed and reasonable mechanism is based on a natural stepped function driven by basin-distributed El Nino waters. (See: ).
).
Your mechanism appears to have validity when the fluid dynamics of various currents carrying and distributing this surfaced warm water are considered thus leading to naturally warmed waters. No physics laws are broken. The greenhouse mechanism whereby re-radiated longwave infrared energy is absorbed into the oceans thus leading to anthropogenic warmed waters is contradicted by the inability of the oceans to absorb this infrared frequency. In this case, a main physics law is broken.
Trenberth asserts that the supposed anthropogenically driven energy imbalance between incoming solar and outgoing OLR is the cause of ocean heating. However, it could be in the calculations.
http://www.nature.com/ngeo/journal/v5/n2/abs/ngeo1375.html
Thanks for the link. I note the following conclusion from the abstract:
“We combine satellite data with ocean measurements to depths of 1,800 m, and show that between January 2001 and December 2010, Earth has been steadily accumulating energy at a rate of 0.50±0.43 Wm−2 (uncertainties at the 90% confidence level). We conclude that energy storage is continuing to increase in the sub-surface ocean.”
What continues to astonish me is that the cloud feedback effect hypothesized by IPCC seems to be about equal to the reported net energy accumulation on the earth from 2001 to 2010:
“Figure 7.10 | Cloud feedback parameters as predicted by GCMs for responses to CO2 increase including rapid adjustments. Total feedback shown at left, with centre light- shaded section showing components attributable to clouds in specific height ranges (see Section 7.2.1.1), and right dark-shaded panel those attributable to specific cloud property changes where available. The net feedback parameters are broken down in their longwave (LW) and shortwave (SW) components. Type attribution reported for CMIP3 does not conform exactly to the definition used in the Cloud Feedback Model Intercomparison Project (CFMIP) but is shown for comparison, with their ‘mixed’ category assigned to middle cloud.”
(The values for cloud feedback have to be multiplied with 0.85 deg C – surface warming since preindustrial times as given by IPCC WGI;AR5;Page 5.)
What was first? Clouds or warming – is temperature driving clouds or is clouds driving temperature – has the egg has laid a chicken? More information with references in my post here:
Without cloud feedback there would be no global warming!
Yes. I noticed that. Energy accumulation is thus .07 W/m2 beyond a plus or minus .43 W/m2 uncertainty. So we could be looking at actual rates of .07 to .97 during a less than climate relative time span.
Bottom line? Run for the hills. Or at least walk quickly. Others could amble. You have time to take a nap first. Or become somebody’s ancestor.
“The greenhouse mechanism whereby re-radiated longwave infrared energy is absorbed into the oceans thus leading to anthropogenic warmed waters is contradicted by the inability of the oceans to absorb this infrared frequency.”
Even IPCC seems to agree with you – the mechanism for transfer of energy to the oceans is questionable 🙂
“Uncertainties in air–sea heat flux data sets are too large to allow detection of the change in global mean net air-sea heat flux, of the order of 0.5 W m–2 since 1971, required for consistency with the observed ocean heat content increase. The products cannot yet be reliably used to directly identify trends in the regional or global distribution of evaporation or precipitation over the oceans on the time scale of the observed salinity changes since 1950.”
Chapter 3 – Observations: Ocean; Page 258
That’s OK. I haven’t grasped the most subtle aspects of my own field of study either. Perhaps you meant:
Bob, you and Christopher Monckton, by just accepting the Karlized temperatures and going with those are yourselves getting farther away from reality and also cementing in acceptance of the karlized pause buster temperature. The way this game plays out, is your future comparisons will get closer and closer to the “observations” as these WILL be changed to keep the meme alive. Ultimately, your criticisms will be ‘falsified’!
I don’t have a background in science (only a lifelong interest), so I’m not going to pretend I understand all this. However, I do understand enough to ask how these individuals and organizations promoting AGW continue to get away with their deceptions year after year, decade after decade? It’s like reading Orwell’s book “1984”. If they were doing it on their own dime that would be one thing, but they are sucking billions of dollars of taxpayers’ money to perpetrate and perpetuate this fraud.
They are very good at suppressing dissent. Judith Curry had this interesting link on her website.
It begins in highschool. Boys learn not to talk about women’s issues. Whites learn not to talk about colored people’s issues. Freedom to express unpopular opinions is dead.
My favorite example of this kind of crap is the cancelling of free yoga classes at the University of Ottawa. The Hitler Youth (or Red Guard if that suits you better) at the University of Ottawa thought it was their duty to protect the poor subjugated Hindu population from cultural appropriation. Here’s the kicker. The exercises we know as yoga have European roots! Another epic example of political correctness. LOL [/rant]
Climate Models Are NOT [working], Part 2, 2/12/2016 says,
… climate models … represent[] … how the surfaces of the oceans should warm if they were warmed by manmade greenhouse gases and the other factors used to drive the models.
How climatology flounders on bootstrap reef!
Atmospheric CO2 is regulated by the temperature of the surface ocean, circulated by the Meridional Overturning Circulation, aka the Great Conveyor Belt. This is the carbon pump. It has periods of many centuries to a millennium at different outlets, and it trivializes human emissions. CO2, whether originally natural or manmade, contributes to the atmospheric blanket that warms Earth’s surface, but Henry’s Law of Solubility assures that neither species accumulates in the air.
IPCC doesn’t recognize Henry’s Law (even when it stumbles on it), and doesn’t measure leads and lags to determine what could be a Cause and what could be an Effect. With respect to CO2 and surface temperature, IPCC has Cause & Effect reversed. That error invalidates its climate model, and nullifies the popular regional concerns.
First, as far as I go, models are worthless and have been so ever since Hansen had the temerity to introduce them in 1988. The current modeling operation should be shut down to save the money wasted on supercomputers. Since 1988 they have had 26 years to make their predictions work but they still cannot do it. Not only that but they have a pseudo-scientific belief that averaging one hundred randomly differing modeling attempts will yield a meaningful climate prediction for the next 100 years. Their only practical use so far has been production of false forecasts of increasing temperatures for political purposes. Secondly, the Reynolds data-set based on the belief that satellite temperatures need adjustment should be withdrawn. as a political device that falsifies real temperature history. They have twisted temperature history in order to eliminate two hiatuses and thereby create an imaginary linear temperature rise from 1980 to 2015. This kind of revisionism is clearly falsification of science and should not be given credence in scientific literature. I see now where your misinformation comes from that you brought out in your comment on October 29th last year. I want you to publicly withdraw what you said in that comment about me and apologize for it.
@Arno Arrak, 5.52 pm Feb 12. Can you please tell me to whom you are talking and give me links back to Oct 29th ( I presume 2015) Thanks. And please can you paragraph your comments they are hard to read.
1. The trend over different parts: models show less variation and actual show wide variations.
2. The actual trend shows what the general circulation patterns say,that weather patterns vary with latiture & longitude — pressure and wind –.
3. As you noted the importance of AMO [in your book also]. In addition to AMO, PDO, ENSO, & other oscillations controlling the temperature in a given general circulation pattern zones. Then fitting the data to linear trend using truncated data of such oscillations, has any significance.
Dr. S. Jeevananda Reddy
The reason these guys are getting the wrong results is that they are ignoring surface tension. The surface of the ocean will allow the passage of radiated energy but surface tension blocks heat from warm gas. Its not difficult to demonstrate. Therefore no “extra” heat enters the ocean.
Surface tension is a consequence of binding forces between molecules in the liquid. Just how on earth does that block “heat” from a warm gas ??
g
Can someone with a strong background comment on the discrepancies between the the northern and southern hemispheres taking into account the difference in sea water volumes. There have been hints on this forum that a similar situation occurred during the MWP. Why would this occur?
I get the feeling that the north can wobble and bobble as much as it likes but there is a great anchor hanging on its arse – the wild and beautiful south. Nothing major can occur until we see change in Antarctica and the Southern Ocean. At the moment it appears to be cooling
There appears to be an obsession with the North Atlantic and the Arctic. It’s only a puddle
Hard though it is for many people to believe, the curves labelled “Models: CMIP5” are not the result of predictions by these models. Instead, they are the result of projections by them. Being examples of propositions, predictions are falsifiable. Not being examples of propositions, projections are not falsifiable. Thus, Mr. Tisdale’s attempts at falsification fall flat.
The 2014 update is here . This, the second part, contains time-series graphs. But the data and model outputs are being presented in absolute, not anomaly, form. Where did you get this information?