Ir has been a couple of months since WUWT has checked in on the progress of solar cycle 24. Right now, the sun is in “cue ball” mode, with no large visible sunspots as seen below in the most recent Solar Dynamics Observatory (SDO) photo:

Since there is a new analysis out at Pierre Gosselin’s website by Frank Bosse and Prof. Fritz Vahrenholt, I thought it would be a good time to do an update. They write:
[The sun was] rather quiet in January. The determined solar sunspot number (SSN) was 56.6, which is 71% of the mean this far into the period, calculated using the 23 previously measured solar cycles.

The earlier peak occurring at month number 35 (fall 2011) signaled the time of the SSN maximum at the sun’s northern hemisphere. The later peaks occurring at about month no. 68 (mid 2014) are the SSN maximum for the sun’s southern hemisphere.
They also have a prediction, read about it here. Full report (in German) here.
As you can see from the plots in Figure 1, the current level of activity of solar cycle 24 seems close to that of solar cycle number 5, which occurred beginning in May 1798 and ending in December 1810 (thus falling within the Dalton Minimum). The maximum smoothed sunspot number (monthly number of sunspots averaged over a twelve-month period) observed during the solar cycle was 49.2, in February 1805 (the second lowest of any cycle to date, as a result of being part of the Dalton Minimum), and the minimum was zero.(ref: Wikipedia)
Below is what the NOAA Space Weather Prediction Center has offered this month. Sunspot count continues below the red prediction line. 10.7 cm radio flux is about at the prediction level, and the Ap geomagnetic index continues to rise, suggesting that the solar magnetic dynamo might be a bit more active, but that activity isn’t translating into increased sunspots or radio flux.
Sunspot Number Progression

F10.7cm Radio Flux Progression

AP Progression

As always, there’s more at the WUWT Solar Reference Page
John, my late brother, would have eaten this stuff up.
So, what happens when the Sun starts to cool off? We better be stocking up on the coal.
In the N. Atlantic basin not great deal, as long as the far North Atlantic (between the Reykjanes Ridge south west Iceland and Svalbard) keeps rumbling.
http://www.vukcevic.talktalk.net/LIA.gif
(sorry your late brother isn’t around any longer, even if he may not had liked the above)
There are clearly no correlations here, except for the occasional random peaks.
Doc
Correlation isn’t perfect , but no one expects it to be, it is the best that we have. When you, or someone else comes up with something better, that has the power to do it, I’ll pay attention.
You say solar didn’t and couldn’t do. I don’t thing much of your “complicated non-linear system natural internal stochastic variation”, kind of incoherent moan that wouldn’t help much to those in the northern lands. Go on, rise to the challenge, come up with a better alternative, not much point counting the spots, if they don’t do anything.
If it wasn’t for the big blast in the 1720’s, now we would have been 300 years down the slope towards the next Ice Age. It is a good thing that the ‘Nordic growl’ is picking up again in the last 5 or so years, after going ominously quiet in the previous decade. The above mentioned delay means some cooling by and in the 2020s, before we may warm up again.
it is the best that we have. When you, or someone else comes up with something better, that has the power to do it, I’ll pay attention.
Correlation is one thing, physical understanding is something entirely different. What you dish out, it not ‘the best we have’. It is numerology with no basis in fact. Whether you pay attention, is irrelevant.
Forget all the science and numbers. The carbon credit crowd does not believe for one minute in what they are preaching to the world. Their aim is two fold; to soak us for ever penny we re worth and focus our attention on things other than poor economy, war, and the alike. These people should be in jail.
“It is numerology with no basis in fact.“
When you go back to the land of fire & ice, ask people around there if it is numerology. Right through the middle of it, there are 30 active volcano systems on the Mid-Atlantic rift, 15 of which have been erupting since 1600, when Denmark decided to stifle local democracy in the world’s oldest parliament.
Counting sunspots is numerology, keeping records of deadly volcanic eruptions is science!
Your DK-syndrome shines though.
Comparing numerology [sunspots] and volcanoes [science] is still numerology.
There are hundreds of things, both big and small that influence climate. I wouldn’t expect a perfect match for any one of those factors.
“Their aim is two fold; to soak us for ever penny we re worth and focus our attention on things other than poor economy, war, and the alike. These people should be in jail.”
Kinda hard when they use leo’s and militarized “service” departments “enforcing” unconstutional edicts.
I call bullshit on this one. Sorry. I know psuedo science lies. Please people. If you cannot check for yourself, it is probably lies. Like the waves of gravity discovery. BS.
John loved the solar astrophysics aspect. He had no official opinion on climate change. Thank you, everyone, for the well-wishes.
Has any one reading here considered that the reoccurring 11,500 year cycle for ice ages is now at 11,700 years? Have we noticed that in Europe and North African nations are being hit with snow in very unusual quantities. And is there any agreement that droughts also appear as transitions occur towards very cold climates.
I’d also ask, has anyone thought back to the 70’s when scientists were mocked for “warning” of a coming ice age to show it’s ugly 50 years from their announcement. I will suggest many forget it was a warning to prepare for what is coming.
Few can honestly disagree with the facts today, outside of those who have an agenda and want to hide the facts as they speak of 30 year computer models that have not once been correct.
Get ready folks, it’s bee 46 years since the scientists warned our world leaders to get ready and they haven’t, at least not where the general public is concerned.
Blessings and be well. all.
Wm,
Interglacials vary greatly in duration, so an average means little. The one 400 Ka was very long and hotter than usual, a super-interglacial. So was the one 800 Ka. The Holocene might fit into this pattern, in which case it has tens of thousands of years left to run. The previous one, the Eemian, c. 100 Ka, was also longer (16,000 years) and warmer than the two preceding it, ie 200 Ka and 300 Ka, and the Holocene so far.
Pray for global warming.
But, I thought CO2 emissions were the cause of the low sunspot activity???
But experts were predicting global warming in 1949, long before the “coolers” came along in the 70s
Can’t.. it’s illegal
If Hillary wins, we have Global Warming.
If Trump wins, we have Global Cooling.
Either way, taxes will increase to pay off the Won’t-Workers
You are right on . . . . . . every way ” we the people ” get screwed.
I must have a really common name, given this is the third time I’ve had someone show up and start posting with my regularly used name in these comments.
Coal is being banned by the current administration…
This is causes by Man-Made Global Warming! WE’RE ALL GONNA’ DIE!
Man, go directly to the site they are talking about and look for your self…I can see spots from just 2 mins ago….
Don’t miss the forest because of the trees… the report doesn’t say there are NO sun spots. Google Maunder Minimum for more info of this phenomenon.
ive the article to the President ( B-OBma ) I need a ( POLITICAL REPLY !
This is Barrack Obama responding to your recent posting alerting me to this serious situation but never forget Climate Change is real it’s serious and only by sending Washington DC gobs and gobs of your hard earned money can it be reversed. Thank you.
Update from BO ~ You didn’t earn that money
Two “here” links to German.
Is there a link to English?
If not, what is the prediction?
Thank you
Try this:
http://www.sidc.be/silso/home
http://translate.googleusercontent.com/translate_c?depth=1&hl=en&ie=UTF8&prev=_t&rurl=translate.google.com&sl=de&tl=en&u=http://diekaltesonne.de/die-sonne-im-januar-2016-rekorde-und-ozeanstromungen-der-golfstrom-bleibt-stabil/&usg=ALkJrhgUuZKuQZIhcxkDqqaNaMVS8iE3DA
Ben February 11, 2016 at 11:22 am
Two “here” links to German.
Is there a link to English?
Well for one thing Ben If my Google Translate is correct they are hammering “Karl”
The following is from the link read last sentence of first paragraph
The record year 2015 and what helped
The 2015 ended with a record: The temperature range GISS recorded +0.87 ° C anomaly compared to the reference period 1951-1981. These were further 0.13 ° C was observed over the previous year in 2014 globally. They rose strongly on ocean temperatures. A look back at a few months earlier record GISS of May 2015 shows that the global mean temperatures were 2014 then still appear lower by 0.06 ° C than in January 2016. How can that be? In summer 2015, a correction of ocean temperatures was introduced, we had, among other things here reported. The trigger: The measurement methods for detecting the surface temperatures of the oceans (SST Sea Surface Temperature) changed from 1998. Whereas previously the SST determined from ships, often by the water temperature was measured in buckets or the sucked cooling water, you went to later precise measurements over buoys. This transition was, according to the scientists to T. Karl. By NOAA, a negative distortion, which is minimized (for obvious to warm measurements of the past down to the precise measurements of the presence of upward) with corrections This measure was taken very quickly for the global soil temperature series. There is therefor not only applause in the art, as our article ” IPCC author Gerald Meehl sentenced questionable bailouts from environmental activists for heating pause: The hiatus is real and is in need of explanation ” showed. It seems very questionable to change good newer buoys measurements upward to reflect the bad old bucket measurements.
We want to assess the validity of the corrections by T. Karl shortly. As a reference, we use the most homogenous temperature range that is available for sea surface temperatures: The buoy measurements of the Argo program , which since 2004 provides fairly accurate and closely defined data error. We consider the temperatures of the upper 100m globally and comparing the uncorrected series ERSSTv3b and the realigned series ERSSTv4 (NOAA).
Oh my,,,
michael
I am fluent in German. Despite the flaws in Google translate, it got the the gist correct. You are good to go.
For another ‘hammer on Karl’ see my recent guest post here on karlization, including my comment correction since did not originally catch the 2014 NOAA graph axis label mistake. A ‘Write slower, proof more’ lesson.
ristvan February 11, 2016 at 3:30 pm
Thank you.
I read your contributions, I don’t always comment. Different knowledge and skill set.
respectfully
michael
We are all in this together, and bring different skills/perspectives that make the whole stronger.
Thanks much for your contribution. I merely read the German originals and confirmed that despite its many linguistic errors, your provision of Goggle translate did not corrupt the main messages.
Helps to have lived in Munich for 6 years, and after a year of private tutoring having done all business ‘auf Deutsch’. Heck, I can even write it, not just read and speak it. Of course, with a Bavarian accent. ‘Ich spreche doch Bayerische’ where the doch confirms the Bayerische since not otherwise used in German. And Swiss German is still an incomprehensible dialect for me.
Von Bismarck said of Bavaria, … Ah, that lies between Austria and civilization. Well, I get Austrian German no problem, no different than ‘hoch Deutsch’ (Prussian/ Berlin) or Platte Deutsche (Hamburg and north). Now Swiss German… Bavarians consider a ‘Halts Krankheit’ aka a throat disease.
So now you know some of the many German dialectical jokes that were thrown around locally (and frequently) in my former part of the world. Gruess Gott.
Article and above comment left out: AND IT’S ALL GEORGE W. BUSH’S FAULT!
Short cycle. With that slope, looks like it’s back to zero sometime in 2018.
It’s not a short cycle, it will be the longest in decades, likely centuries. The butterfly needs to be finished, so not before 2021/22 (the next minimum).
http://solarscience.msfc.nasa.gov/images/bfly.gif
Is that a prediction or a projection?
Ok S.. It is well known that weaker solar cycles are longer than shorter more active solar cycles… this is suggested to be due to the speed of rotation and reversal of the suns polar field.
Is there really correlation with temp ? Low sunspots in 1940s during high temps, high sunspots in 1960s and 80s during low temps. 1798 was a remarkably warm year.
So why is The Earth’s surface still warming?
adjustments?
adjustments?
Incorrect ones? Significantly, I think. But not entirely.
They are a reasonably fair hand at identifying most of the major problems. (The rest is below-par games design.) I praise them with faint damnation.
Evan,
Did you mean ‘damn them with faint praise’? Or did you mean what you wrote? ☺
You said it, Paul!
http://wattsupwiththat.com/2015/08/06/the-pause-draws-blood-a-new-record-pause-length-no-warming-for-18-years-7-months/
According to the authors of this paper, 2015 was a “record” due to Karl’s adjustment of the SST. They argue that this adjustment was improper.
El Niño 2015 is the outlier, though not the only liar in climate science.
El Nino represents a re-arrangement of heat (enthalpy) on the earth’s surface rather than an increase in enthalpy on the earth’s surface in the most profoundly simplest explanation of the phenomena. Surface temperature is only a poor estimate of total enthalpy. Consider two 100 degree tiles stacked on each other next to a 50 degree tile. The average “surface temperature” is 75 degrees. Now slide one of the 100 degree tiles over the 50 degree tile. The average “surface temperature” is now 100 degrees, but no heat (enthalpy) has been added to the system.
@ShrNfr
Yes it’s a re-arragnement of heat from the oceans to the atmosphere but where does it go from there? Once it’s in the atmosphere it’s going to eventually make it’s way to space. Hence it’s a next loss of heat to the system.
://wattsupwiththat.files.wordpress.com/2011/08/cartoon_climate_science.png
Neither Sunspots nor TSI are controlling whether the Earth heats, or not. There’s just too little variance in energy reaching Earth, or any other variable between Sun/Earth as far as anyone knows at this point.
“As far as anyone knows…” That means “maybe”, so it may be you’re wrong. Nobody knows so your first statement can’t be taken as fact because your second statement disqualifies it as fact.
Ever hear of that thing known as albedo? More cosmic rays, more cloud seeding, more cloud seeding, more radiation reflected back into space. Obviously not quite that simple, since the TSI also couples with the cosmic ray flux, but it is not just the amount of energy reaching the earth, it is also about the amount of energy reaching the surface of the earth. Add to the the positive feedback mechanism of ground albedo due to increased ice/snow and it adds up.
In any event the temperature dataset of the 20th century tropospheric temperatures looks a lot like a ARMA process of solar magnetic activity and NOT like a total concentration of CO2.
dp says: “Maybe”.
That’s right, dp. Maybe. That’s not the first time I’ve written something poorly and I may be wrong, but prove me wrong with data. No one knows as any correlations have proved spurious to this point.
What statement/conjecture in science doesn’t tacitly end with “as far as we know at this point”?
@ Allen… and AGW didn’t manipulate the earth’s radiation balance to get the desired results they wanted in their models either??? That’s why their models are wrong. If the outgoing and incoming are very close, the entire idea of retained heat goes out the window, or space. You would never in the 1st instance have run a way greenhouse effect, and 2nd it would take centuries before any warming could be detected being that nothing else changed. Then there is the co2 record , sinks and temperature. The current sink is 150% larger than 1965. Every bit of co2 produced in 1965 would be sunk along with another 7 billion metric tons. How do you think that’s happening in light of a warming ocean (less able to absorb co2) and a much smaller tropical forests?
@ ShrNfr
You seem to be arguing for Svensmark’s Hypothesis, which remains highly controversial, as does the net effect of clouds, without regard to Svensmark. We don’t know enough about clouds.
“Neither Sunspots nor TSI are controlling whether the Earth heats, or not.”
Apparently you didn’t read this:
http://wattsupwiththat.com/2016/02/08/a-tsi-driven-solar-climate-model/
But Alan, what exactly is the TSI reaching the top of the atmosphere? Even with today’s technology and satellites, the estimate for TSI is highly varied. Now how can anyone say TSI variability has no impact on heat variability on Earth when we can’t even agree how much TSI varies in the first place?
http://www.nap.edu/openbook/13519/xhtml/images/img-39.jpg
http://jonova.s3.amazonaws.com/graphs/solar-radiation/tsi-datasets-ls.gif
Also, it is known that higher solar activity coincides with a shift of the total radiation emitted from the sun towards higher energy radiation. What effect will a shift from higher frequency radiation to lower frequency radiation have? My first inclination is that higher frequency light tends to penetrate deeper into water and subsequently warms it more, whereas low frequency light is more likely to only penetrate the surface where it is subsequently emitted back into the atmosphere as long wave radiation.
A correlation between the relatively small climate changes and solar variability has been suggested for decades because the correlation is obvious.
Clouds not only reflect sunlight, but the water droplets in clouds and ice absorb solar energy.
http://www.ospo.noaa.gov/data/atmosphere/radbud/gs19_prd.gif
http://www.ospo.noaa.gov/data/atmosphere/radbud/gld19_prd.gif
But within the total there are variances in wavelength that affect where the energy is absorbed.
I presume that you accept the LIttle Ice Age happened, and that it followed the Medieval Warm Period which itself followed the dark ages that followed the Roman Optimum.
Do you have a neat explanation for these significant climate changes which predate industrial level CO2 emissions, that does not involve the Sun?
The razor of William of Oakham shaves the hair off of many a hoary model. We simply live around a slightly variable star. Sorry Mr. Robertson.
Alan R
We do know quite a bit about ozone in the Antarctic and GCR. There is a strong cooling effect caused by interactions between CR and ozone. This is independent of Svensmark’s ideas. Prof Lu at the University of Waterloo has written several papers on this and defended the conclusions pretty well I think. He also demonstrated the chemistry and physics involved here in Waterloo in the lab.
As you are probably aware CERN is investigating further the Svensmark effect after confirming that the effect was real and larger than expected. Both mechanisms work, and can explain most temperature changes over the past century.
In short, the cause is solar. Neither depends on TSI as the variable.
BFL, et al,
Let’s cut to the chase: Where are the Sunspot/climate correlations back to 1700? Decadal scales don’t cut it. What about TSI and climate? Any other Solar metric?
——-
Ian W says:
Do you have a neat explanation for these significant climate changes which predate industrial level CO2 emissions, that does not involve the Sun?
——————
No. I don’t have one involving the Sun, either. Nor have I seen any correlation with TSI, or any Solar parameter, that doesn’t fall apart at some point.
—-
The whole “it’s the Sun” thing is unproven and highly controversial. Maybe I missed the proof… take me to task and prove me wrong. Let’s see the proof. If you are right, it shouldn’t be hard to prove me wrong… I’m just a man in the world, claiming no credentials, or such beyond layman’s interest.
Ps I’ve rephrased the argument somewhat from planetary heating to global climate change, but it’s the same case. Come up with definitive proof that the Sun is the driver of climate change and you’ll win a prize. Figure out why we swing from glaciation to interglacials and you’ll win a prize for that, too.
I always checked boundary conditions to see if statements like ” There’s just too little variance in energy reaching Earth, or any other variable between Sun/Earth as far as anyone knows at this point.” are justified.
The simple refutation is if dead sun – frozen earth, if supernova sun – cinder earth
Crispin in Waterloo says: GCRs.
————
Thanks.
For me, studies related to GCR hold great promise for explaining many of the great unknowns in climate research. The Sun is likely the strongest influence, but there are still so many unknowns, such as the variances with GCRs, themselves. Such drivers as the Solar System’s oscillation above/below the galactic plane and movement through the galaxy are known, but still we are in shallow waters.
At this point, GCR research is interesting, mostly unknown, but bringing us closer to the truth of things than we were before.
My conjecture remains, we don’t know enough yet, to definitively say, “it is the Sun” (or anything else, imho.)
Lawrence Todd
February 11, 2016 at 3:11 pm
I always checked boundary conditions …
The simple refutation is if dead sun – frozen earth, if supernova sun – cinder earth
……………
That’s quite a context. Aren’t you the clever one.
The planet will likely have lost all its Hydrogen long before either of those events.
I think Vincent Courtillot and his buddies might have something to say about that.
“Neither Sunspots nor TSI are controlling whether the Earth heats, or not.”
Alan;
You are right. Sunspots themselves do not control anything; they are storms that vary in number with the strength of the solar electromagnetic field. The more spots there are, the stronger the field; the fewer spots the weaker the field. The solar field, itself, however, probably DOES influence temperatures on the Earth. I believe that there were experiments (CLOUD) done at CERN that pretty well confirmed the hypothesis that variation in the Sun’s electromagnetic field also caused variation in cloud formation in the Earth’s atmosphere from cosmic rays. A stronger field deflects the rays; a weaker field allows them to penetrate deeper into the atmosphere.
TSI, including infrared (heat) radiation measured at the Earth’s surface, will vary depending with the amount of cloud cover shielding the surface of the Earth from solar heat. Additionally, cloud cover also reflects solar radiation back toward space. Sooo, TSI at the Earth’s surface DOES affect whether the Earth heats or not. If you do not believe that this is true, then how is it possible for the seasons to change from Summer to Winter in the northern and southern hemispheres? As far as we can determine, this happens when either greater or lesser amounts of direct sunlight reach the surface of the Earth due to it’s inclination. Even a tiny variance in solar infrared radiation will, over time, affect heating or cooling. You have to think of it as a sum of money in the bank gaining compound interest. The longer a positive or negative variation in TSI lasts, the greater will be cumulative amount of cooling or heating over time.
Alan– You are correct that TSI hasn’t changed that much during the current weak solar cycle, however, during weak solar cycles, solar UV radiation declines, as do solar winds.
The Svensmark Effect postulates that reduced solar winds allow more Galactic Cosmic Rays to enter earth’s lower troposphere, which nucleate more inorganic compounds that form cloud seeds and create more cloud cover. This increased cloud cover increases earth’s albedo, which reflects more solar energy out to space leading to global cooling.
It’s a widely held belief that the 4 Grand Solar Minimum events (Wolf, Sporer, Maunder and Dalton) which occurred between 1280~1820 were responsible for the Little Ice Age, which began and ended during the course of these 4 GSMs.
During strong solar cycles, the opposite effect occurs, leading to global warming.
The strongest 63-yr string of solar cycles in 11,400 years occurred between 1933~1996, which may account for a substantial portion of 20th century warming. It’s also interesting to note that when these strong solar cycles ended in 1996, so did the global warming trend….
It’ll be interesting to see what happens to global temps when another Grand Solar Minimum occurs, which many astrophysicists think will happen from around 2030.
Not much water on your planet then? With its three states and two-edged thermodynamic sword. Better hope the bottom one doesn’t take a little swipe, it’s much sharper.
Don’t know where you got that from, Alan. . There are many good scientists out there who are researching the link between Earth’s climate and solar activity.
“Figure out why we swing from glaciation to interglacials”
Wrong question. Figure out why the rise and fall is the shape it is. The answer is possibly water’s massive latent heat differential either side of the liquid state + albedo change. Little to do with CO2 which follows along for the ride ~800 years later. The rest is per Milanković, the signal of which is NOT that shape.
Alan Robertson says:
Agree. The numbers for TSI (and its various components) are pretty precise now, and they vary remarkably little. Theories may be proposed on how that can change weather/climate, but I see nothing convincing so far. If one accepts a variance of a watt or so (which goes up and down cyclically) significantly affects climate, then shouldn’t they accept greater effects from 3-4 watts of added CO2 forcing?
“shouldn’t they accept greater effects from 3-4 watts of added CO2 forcing?”
Only if you suffer from radiative myopia and diffusion confusion. Atmospheric CO2 is non-condensing. There are no magic partial mirrors operating in 2D, even though it might look like you can measure them. Most of the problem is childish ‘forcing’ cartoons and fag packet fizzics.
El nino and adjustments. NOAA published a global average temperature that was +3 F degrees warmer in 1997 than now. That’s 1.5 C. Were they wrong then, now, or was the very recent past much colder? I am perplexed as to how 2015 is the hottest year on record. There is a discontinuity in the records. They compared 1997 with previous adjusted records, then adjusted all of those records again. The original records are in a landfill. If you had followed this since 2001 you’d know that they didn’t share how they adjusted the “lost” records.
It is my view that temperatures have been falling for 1 of 2 reasons. 1) AGW works like they say it does, and the temperature even by IPCC methods falls below the lowest modeled number. Which would be cooling even in the face of rising co2 levels . Or 2) the global average temperature in 1997 is correct, and it is apparent in satellite records, and the temperature has dropped more than 1.5 C .
El Nino
and thermal lag
Carbon dioxide ganging up on the tropical Pacific Ocean ?
https://en.wikipedia.org/wiki/Volumetric_heat_capacity#Thermal_inertia
Go garner a basic understanding of science before attempting to troll.
Does this look like its warming ???
http://tinyurl.com/pjx29ke
Click on ‘globe’ & drag to rotate;
Click on ‘globe’ – green spot gives – Position, Wind direction & speed, Temperature.
Click on ‘about’ for more details.
Temperature colour key for surface layer.
Blue = 0 to-30°C, Red = -30 to -60°C
Green = 0 to +10°C, yellow/green = +10 to +20°C, Brown = +20 to +60°C
North Hemisphere Jet streams & temperature see – http://tinyurl.com/om2nnl6
Without doubting the thrust of your arguement , Isave , I would like to take this opportunity to bring up a point that has been concerning me about the eart.nullschool images .They are visually stunning and have been shown here frequently lately (and have started to appear in mainstream media) but I am a bit uncertain how much is based on actual measurement and how much depends on modelling. For example take the disclaimer the presenter makes about CO2 surface concentration :
–
“about CO2 concentrations
While implementing the visualization of CO2 surface concentration, I noticed the NASA GEOS-5 model reports a global mean concentration that differs significantly from widely reported numbers. For example, from the run at 2015-11-23 00:00 UTC, the global mean is only 368 ppmv whereas CO2 observatories report concentrations closer to 400 ppmv. GEOS-5 was constructed in the 2000s, so perhaps the model does not account for accumulation of atmospheric CO2 over time? This is simply speculation. I’m just not certain.
To bring the GEOS-5 results closer to contemporary numbers, I have added a uniform offset of +32 ppmv, increasing the global mean to 400 ppmv. This is not scientifically valid, but it does allow the visualization to become illustrative of the discussion occurring today around atmospheric CO2. Without question, I would welcome a more rigorous approach or an explanation why the GEOS-5 model produces the data that it does.
Also worth mentioning, the GEOS-5 site contains the following disclaimer: Please note that these predictions are experimental and are produced for research purposes only. Use of these forecasts for purposes other than research is not recommended.” –
It does not seem to be relying on OCO2 data , which is surely the latest and best available.
So how much of the Earth.nullschool imager is based on real land or satellite observations and how much on modelling?
Just now on the EarthWindMap I green spotted the temp where I live, in a rural community. It gave a reading that was 7 degrees lower than the official local temp. I did the same using a similar commercial product called MeteoEarth and the temp it gave was .5 degree out.
@ mikewaite
Mauna Loa Observatory makes actual measurements of atmospheric CO2 quantities (ppm).
Satellites are incapable of making actual measurements of atmospheric CO2 quantities (ppm).
Therefore, satellites are per se “modeling” the atmospheric CO2 quantities (ppm) based on the amount or quantity of IR radiation that is detected in the atmosphere at any given altitude above the surface.
It isn’t still warming. Does that make it easier to understand?
It clearly is still warming. Satellites and surface data are in agreement on that point at least.
Man made Global Warming!…pg
20,000 years ago, or less, an ice sheet one mile thick lay over what we now call New York City.
Reflect.
Based on which source? Certainly not the satellite systems (UAH & RSS). The current spike, that could possibly end the pause, is entirely due to a very strong el-nino. Of course that will be offset by the inevitable la-nina next fall and we’ll be back to the pause or worse yet, cooling.
….As a Canadian living in the frigid North, I worship Glo.Bull Warming as my GOD..so far, it ain’t answering me !
………He, it , She ?
they?
She, Mother Nature.
Tom in Florida, ……………………. freaking arthritic fingers sometimes don’t work so well.
Marcus, perhaps your GOD is not hearing you because you are not speaking the Glo-Bull Warming language.
And what language might this GOD understand?
Hint: Money talks.
Science walks.
And blind faith speaks loudest of all.
Marcus: You COULD move to someplace balmier like Halifax or Toronto. Or even to Florida if you don’t mind putting up with Americans,venomous snakes, 3 meter carnivorous lizards in your backyard, and mosquitoes 12 months of the year.
You do make a point that needs to be made repeatedly. ANY change in climate — warmer or colder — is going to have winners and losers– not just losers.
Do not listen Marcus!
Those gators are like big pussycats, snakes hear you coming and go the other way if you stomp around loudly, and there are almost zero mosquitos at the beach or in well sprayed snow-bird communities.
As for Americans, that can be hard to locate amongst the hoards of Canadians snow birds this time of year.
But you can spot natives some if you know how to look: They are the ones who occasionally obey traffic laws, and they rarely drive a huge bus pulling a car with seventeen bikes attached to it.
“But you can spot natives some if you know how to look: ”
Yeah, we are the ones NOT wearing shorts and flip flops in 55F weather.
What is the impact historically? What is the lag period before surface temps reflect the change?
Michael
This is a graphic from one of my recent articles. I have plotted CET from 1538 ( my reconstruction 1538 to 1658) against sunspot numbers.
Clearly Ther is some sort of relationship ( coincidental or otherwise) with low numbers of sunspots at the end of the 17th century.
The relationship between sun spots and low temperatures at other times is much less clear cut.
So do extended periods of solar inactivity result in extended periods of cold? I am not convinced but are open to the arguments of those who have studied the relationship in depth
Tonyb
I should have mentioned that the sun spot record in any meaningful form commenced in 1610 .
Consequently no inference should be placed on apparent lack of sunspots/cold temperatures prior to this date
Tonyb
I’d say the correlation holds well for the Dalton Minimum as well.
Curious that the Volcanism plot is missing Agung and El-Chichon, El-Chichon in particular was a major player.
Not really. Mean CET Temperatures for the 1780-1800 period are virtually the same as for the 1800-1820 period and the mean temperature for the entire 19th century is not appreciably different to the Dalton minimum mean temperature.
I think you’re seeing what you want to see.
Tony, thanks for posting that. My mind is open to causal relationships like solar wind/cosmic rays/ albedo (Svensmark), shift in UV intensity/ozone…but the trained statistician in me suspects spurious correlation around the Maunder minimum.
Wrote about spurious correlation using a magnificent MIT example in The Arts of Truth, statistics chapter. US. Sec. Agriculture under Obama used U. Iowa statistics to claim corn ethanol had reduced US gas prices $1.37 in 2011 from what they would otherwise have been. Absurd on its face, as the ethanol blendwall is 10% and US gasoline did not cost $13.70/ gallon in 2011. The same spurious correlation also proves that if the US had stopped using ethanol in gasoline in 2011, then UK unemployment would have dropped 47%.
The topical relevance to CAGW is obvious. U. Iowa researchers are as motivated to support corn ethanol as mainstream climate scientists are to support CAGW. And the motivation is simple. Money.
Tony – thanks
Tonyb,
I have looked with quite detail into temperatures of the past.
The strongest correlation of temperatures is with Earth’s axial tilt (obliquity). The second strongest correlation is that of cold periods with periods of clustering of grand solar minima following two different cycles that are not always equally intense, the 1000 years cycle and the 2500 years cycle. LIA was a period when both hit a low almost simultaneously, but previously recognized strongly cold periods follow this pattern. So while temperatures do not appear to follow solar activity, grand solar minima appear to induce strong cooling when they cluster, and when they end, a natural return to warmer temperatures takes place over 2-4 centuries.
http://i1039.photobucket.com/albums/a475/Knownuthing/Solar%20cycles2_zps1va5vqbt.png
@ Javier… try convincing the IPCC and associates that there was even a LIA. (Worldwide) Their argument co2 levels didn’t change, therefore neither did the temperature. Else they have a problem explaining a drop in co2 and why that happened.
rishrac,
It is well known that during most of the Holocene temperatures and CO2 levels have been moving in opposite directions, temperatures going down and CO2 levels going up. It is called the Holocene temperature conundrum:
The Holocene temperature conundrum
As to the solar weather, they say that “sunny weather eludes so far all attempts at prediction” (Google translate)
They attack Karl’s SST modification among other things.
Please correct if I’m wrong, this is a question: the accumulated heat in the oceans being released in the current El Nino is resulting in atmospheric temperature rise, which will continue until that also dissipates/radiates back out to space. Is that right? Is it thought that a quiet sun will not restore the lost oceanic heat as rapidly as a more active sun?
That is the only way energy can get from the ocean to space (by first warming the atmosphere). If the surface temperature returns to the pre-impulse level and the oceans return to a La Niña temperatures then it means most if not all energy from the El Niño impulse has left the earth system. Since the oceans are not an energy source but an energy storage medium I don’t know how the El Niño phase of the ENSO cycle can be anything but a cooling event – La Niña being the warming event.
Cant ocwans be warmed by vulcanism….ie a heat source to Air?
Actually, a lot of energy is radiated directly to space without heating the atmosphere. link
>the accumulated heat in the oceans being released in the current El Nino is resulting in atmospheric temperature rise, which will continue until that also dissipates/radiates back out to space.
Mostly right? My understanding is that normally winds near the equator blow East to West — Trade Winds. That causes warm water near Asia to be pushed down and be replaced with equally warm water blown in from the East. But on the East side of the Pacific, the wind driven conveyor is pulling up deep, rather cold water off South America. So there’s a temperature gradient form colder to warmer across the Equatorial Pacific. Every now and then, equatorial winds reverse for a while and blow from the West. That spreads warm water East to South America. Then the winds reverse back to more normal Easterlies. But it takes rather a while for the warm water to be pushed back to the West. So during and after an El Nino event, the tropical Pacific Ocean is warmer than usual and of course it would be radiating more than usual heat to space. A lot of the subsequent cooling comes from upwelling of colder water off South America and its redistribution across the tropical Pacific.
That’s my understanding. Could be all wrong.
Good question, answer not so clear. Oceans are warmed by SWR (visible sunlight) as LWR (infrared) cannot penetrate and at most causes increased surface evaporation–which cools. But this simple statement ignores the vertical and horizontal movement/ exchange of ocean heat due to forces we do not fully understand.
Consider ENSO. Sun heats tropical Pacific, and the Hadley cell induced tradewinds pile that warm water up in the western tropical Pacific. Now when that ‘pile’ gets big enough, it sloshes back east as a Kelvin wave. Accompanied by a weakening or even reversal of the tradewinds. El Nino. Runs its sloshing course, and the reverse sets in, La Nina.
Bathtubs can teach climate sciece some useful things. Over to Bob Tisdale for details.
Misthread. Intended as Notanist reply comment.
Hi ristvan,
“Oceans are warmed by SWR (visible sunlight) as LWR (infrared) cannot penetrate and at most causes increased surface evaporation…”
Shorter wavelengths in the electromagnetic spectrum (SW) are UV and x-rays, intermediate wavelengths (visible region) are between UV and the long wavelengths (infrared).
Shorter high frequency wavelengths (UV and X-rays) penetrate deeper into the oceans and their radiant energy lasts longer than both intermediate wavelengths (visible region) and the long wavelengths (infrared)…
If graphs for SGN and TSI are added it would complete the overview.
I expect a controversy in this comment thread on how sunspots relate to TSI. Isvalgaard must be off-line.
Sunspots are magnetic storms or turbulence, so if they have a relationship to TSI, wouldn’t it be an indication of the current overall level of energy in the sun?
Waiting for the warming.
As a canadian living north of the 60th parallel I too wish for AGW, it would feel so good.
Unfortunately it looks like the only way to prevent the return of the great ice sheets would be a solar mirror focused on Hudson Bay.
Not sure if direct sunlight or infrared only would work best, but if the bay stays frozen Year round,everything north of New York is doomed.
More on topic, what is the most likely lime lag for heat cycling through the ocean?.
Our remarkably stable climate is regulated by these massive bodies of water, so what length of solar low activity would it take to see a measurable global temperature drop?
Assuming we can calculate such a metric.
Leif. I haven’t seen a Livingstone, Penn & Svalgaard graph for a year or so. Initially it was going down in a straight line but then started to curve away from the 1500? gauss? line. Any up to date graph available ? Prognostications thereon ?
To save Leif the hassle of posting a link …
http://www.leif.org/research/Livingston%20and%20Penn.png
Thanks for that, suggests that speculation about the demise of cycle 25 may be premature, and that 25 will be similar to 24. Pity, a serious cold spell would have been useful from a political standpoint.
These graphs are on the WUWT solar page.
One thing is pretty sure. After 5 years we are much wiser. If the temperature does not stat to increase in 5 years, it is finally a good enough proof that CO2 is not responsible for the high temperatures of today. If the temperature declines – let us say – 0.2…0.3 degrees, its is strong evidence of cosmic forces: sun, cosmic rays, cosmic dust even. If the temperature stays at the present level, then we need new theories.
If the temperature stays at the present level, then we need new theories.
If the temperature stays at the present level, then we need new theories.
Perhaps both “theories” are correct. Perhaps the CO2 effect has been offset by the Solar effect.
That makes a lot of sense. If true, though, can you imagine how horrible winter would be? You’re welcome Canada.
Nonsence… Co2 does not offset the suns energy, either by warming or cooling, the temperature of Co2 in the atmosphere is regulated by the temperature of the enviorment it is found in, Co2 is not an energy source, it does not double energy when exposed to it, it is a trace gas, it is a low lying gas that plant life has evolved over millions of years to take advantage of it’s properties, solar energy, UV and Xrays from the sun, along with the strong electromagnitic forces from the suns polar field effects planetary climates, a prolonged solar minimum will reduce all the warming effects of an active sun and it will have a large reduction in temperatures the longer solar minimums are… there’s a long solar minimum coming up soon and you will see this effect for yourself.
That’s what they said five years ago.
The right people said we were entering into one of the weakest solar maximums and they were correct, all these data adjustments taking place to cover up an on going planetary cooling phase will bring a political shitstorm with it once people begin to see bodies on their streets due to freezing temperatures that these deep solar minimums bring…
Sparks: Not happening. Do you think that somebody gives s… how many people are freezing to death? Look on Taiwan few days ago – 89 people death because freezing temperature. Somebody cares that in UK few thousand people die because of cold? Same in Europe, USA. Cold is taking death toll from people on bottom of wealth pyramid. Nobody cares.
sorry for posting sort of off topic.
Does anybody know how somebody would go about calibrating 3 instruments, miles apart, if you are trying to detect tiny movements in time and space ?
presumably you would have to calibrate for what you are looking for ?
all this cosmology stuff sometimes seems to me to be like the climate change stuff.
calibrating gravity pulses – part of it is you have a normal range of variation, then both instruments detect a big pulse at the same time.
the resolution – a thousandth of the diameter of an electron or whatever – that i cannot figure out. you sure have to add a lot of gain to that signal.
I dunno, I’m not convinced by any of this stuff.
” Oh look! There’s one! I saw one!
At least, I think it was one.”
There is a mirror on the moon, need one on Mars, then wait for quadrature and the shift measurement would be far more accurate
Yes. I understand. First, you have to isolate the interferometry mirrors from any other source of noise, as much as possile. This was done by suspending them in a vacuum using fine glass threads, glass being amorphous, and fine glass threads relatively flexible (fiber optics) so quite vibration damping compared to the weight of suspended mirror. Next use a high frequency beam split laser to send half of the coherent beam down each of two perpendicular arms for 2.5 miles, then back after reflecting off the suspension damped mirrors. Round trip for each half beam, 5 miles. If no gravity wave, the return beams recombine and cancel at the splitter. No resulting light. If gravity waves, then the two beams return out of phase at the splitter thanks to stretched spacetime ( accentuated by the perpendicular arms per general relativity theory) and there will be some light photons leaking beyond the splitter. A phototube measures those as the strength of the gravity wave signal. NYT today has a nice graphic on this from CalTech.
Now build two of these as far apart as possible. 1. Cancels local vibrational residue. They should both get a gravity wave signal. 2. Delta signal timing (speed of light atomic clocks are no big deal anymore, else GPS would not work) probes the other general relativity gravity wave prediction, that spacetime gravity waves only travel at the speed of light. Both predictions confirmed by this event, and to the predicted values. Bravo for science here. Another BIG confirmation of general relativity. Now if we could only unify general relativity with quantum theory…
I dunno, you do something and get a result not sure you should attribute it to what you are looking for.
the mirror suspension assembly was designed and built here in scotland i believe. nice to see such a big international collaboration come together. thanks for that explanation ristvan, much clearer than anything i have seen or heard in the mainstream media (no surprise there).
yes, sorry, it is all probably correct, yet I consider trying to measure a thing from inside a thing has got to be really difficult.
ok it becomes clearer, I found some explanations here.
http://quibb.blogspot.co.uk/2014_03_01_archive.html
OK here is the thing. When you are calibrating your mirrors the gravitational waves ( that you have not discovered yet ) are distorting the lengths of your tubes, you do not know the intensity, the direction and so how can you calibrate anything ?
whats the margin of error ? much greater than the size of grav waves ?
“Solar cycles are numbered from a minimum to a minimum since Cycle 1 of 1755/1766, the maximum was in 1761. And now we come to the cycle No. 24 which had its absolute minimum in late 2008 and should have its maximum around 2013. According to the law of GO (Gnevyshev-Oh) an odd-numbered cycle is more active and thus more sunspots that the number is even cycle preceding it. This allows to have an idea of solar activity cycles odd.
But during these 23 cycles, the law of GO was raped by three pairs of odd-even cycles. Those are the cycle No. 4-5 so the solar cycle from 1785 to 1798 and from 1798 to 1810, the cycles No. 8-9 so the solar cycle from 1834 to 1843 and from 1843 to 1856 and then the cycles No. 22- 23 from 1985 to 1996 and from 1996 to 2007 is because contrary to the law of the GO odd-numbered cycle is more active than the preceding even cycle.
If as was indicated Mr Hathaway (NASA, member of the panel forecasting the solar cycle) cycle No. 25 could be one of the lowest in the last century then there will be violation of the law between the GO N cycles 24 and 25 °.
Violations of the law GO place near a time when the orbital motion of the Sun around the center of gravity is retrograde and when the orbital angular momentum of the Sun decreases a lot and quickly. At these times there was approximately an alignment of Jupiter-Sun-Saturn-Uranus-Neptune so the center of gravity is near the center of the Sun and reverse with an alignment of the Sun-Jupiter-Saturn-Uranus-Neptune around 6 years after the more or nearly one year. So a quick change in the distance between the Sun and the center of gravity. Because when Saturn-Uranus-Neptune are on the same side of the Sun while Jupiter has a shorter orbital period varies very quickly the distance between the Sun and the center of gravity.
Below you have the position of the gas planets at two points given during solar cycles that have violated the law of GO. For the first two where the date is less than the beginning of the numbering of solar cycles, the law of GO has been raped but can not Verily know. As we see the alignment of gaseous planets are all on the same side and between 5 and 7 years later, Jupiter is on the other side of the Sun and the other gas planets are the opposite side of Jupiter.”
Position of the planets in 2023 and 2030 is when
the odd cycle No. 25 violated the law GO
http://la.climatologie.free.fr/soleil/2023.gif
http://la.climatologie.free.fr/soleil/2030.gif
Sorry.
http://system.solaire.free.fr/soleilactivite.htm
Sorry.
http://la.climatologie.free.fr/soleil/barycentre.png
http://la.climatologie.free.fr/soleil/soleil2.htm#g-o
By the end of this year GCR rates will likely exceed the rates of the solar minimums of the last two cycles.
http://cosmicrays.oulu.fi/webform/monitor.gif
EFFECT OF THE SUN
CLIMATE
COSMIC RAYS
Our planet is bombarded by high-energy cosmic particles (nuclei of atoms) from other stars and supernovas. They are cosmic rays. The magnetosphere deflects most cosmic rays but some arrive in the atmosphere and cause reactions there. At the magnetic equator of low energy particles are returned back to space by the Earth’s magnetic field at the magnetic poles but the particles of all energies can follow the field lines down to the top of the atmosphere. Scott E. Forbush noted physicist in 1937 that solar flares mitigated the flux of cosmic rays. This is what has been proved by the Pioneer probe 5 in 1960 and called the Forbush effect. So when solar activity is at its maximum, the Earth receives less cosmic rays and at the minimum of solar activity it receives more.
At the maximum of solar activity the Schwabe cycle the solar wind prevents these particles reach Earth knew then that during the minimum of solar activity solar wind is less important the Earth’s atmosphere receives more cosmic rays. The change in the amount of cosmic rays received by our planet is approximately 20% between the maximum and minimum solar activity.
COSMIC RAY ACTION
Three Danish researchers (Knud Lassen, Eigil Friis-Christensen and Henrik Svensmark) think they have explained how the climate is influenced by the sun. From the 1984 to 1990 data from three satellites they concluded that the variation of cosmic rays entering the atmosphere was the same as that of cloudiness. Then in 2011 the results of the CERN experiment called CLOUD have shown that cosmic rays multiplied at least tenfold the production of cores. However even if it is true that these cosmic rays increases by a factor of ten these clouds, even with that effect, it is still far from the concentration necessary to explain the condensation of the clouds. Because in the Minutes of the CERN / CLOUD they tell us: “Second, we found that the natural rate of atmospheric ionization, resulting from cosmic rays, can amplify the nucleation in the conditions of our work (NdT: It’s ie only with traces of sulfuric acid and ammonia) of a factor of up to 10. the amplification by the ions is particularly pronounced in the cold temperatures of the troposphere average and above, where CLOUD found that sulfuric acid and water vapor can nucleate without the addition of additional vapor.
This result leaves open the possibility that cosmic rays can influence climate. However, it is premature to conclude that cosmic rays have a significant influence on the climate as additional nucleating vapors have not been identified, their amplification rate by the ions was measured and their ultimate effect on clouds has been confirmed. ”
The clouds that form at low altitude are relatively warm and composed of fine water droplets. They would cool the planet by reflecting sunlight back into space. But the clouds that create high altitude, are colder as they are composed of ice particles and have the opportunity to warm the Earth by trapping heat.
According to satellite data since 1980 Henrik Svensmark and ND Marsh concluded that it is above the lowest clouds (within 3 km altitude) which vary most depending on the intensity of cosmic radiation.
Depending on the amount and types of clouds, albedo of the Earth is very different. The clouds reflect more light back into space as the cloudless sky. the size and thickness of clouds, and the size and number of droplets inside the cloud varies the cloud albedo.
The clouds composed of large drops of water or with a lot of water droplets reflect more light back into space.
The albedo of different clouds from J. Gourdeau.
Water
8%
Cirrus
20-40%
Stratus
40-65%
Cumulus
75%
cumulonimbus
90%
The clouds have albedo than the surface of the Earth without clouds. So they reflect more sunlight back into space than does the Earth without clouds the fact that there is less energy available to heat the Earth’s surface and atmosphere.
The movement of the gas planets varies the angular momentum of the Sun around the center of mass of the Solar System. Every 179 years the angular momentum of the Sun varies very quickly as was the case during the Maunder Minimum. Which could slow the major internal convection currents Sun suspected by some scientists to influence changes in solar activity.
At a low solar activity the Sun’s diameter is larger, and its speed of rotation is lower by about 3% than the current speed. When solar activity faiblie brightness is the same as it was the case during the Maunder minimum, since the brightness would have been lower by around 0.2 to 0.3% now. More solar activity wanes, the more the magnetic field and the solar wind dropped and therefore the extension of the Earth’s magnetic field is reduced. This allows more cosmic rays entering the atmosphere. And therefore cloudiness increases because cosmic rays promote the formation of clouds at low altitude which increases the albedo and thus also reduces the brightness and radiation from the Sun to Earth.
During the Maunder Minimum total solar irradiance long called the “solar constant” was lower by 0.25% compared with now is 4W / m² which had the effect of lowering the temperature 0.25 ° C. While ultraviolet (UV) radiation that are only about 1% of the production solar radiative their variation is more important than total solar irradiance. At a 0.25% change in solar irradiance total relative to now, UV varies around 10%. The UV has much effect on the atmosphere. Increasing the temperature of the ionosphere is around 300% between the minimum and the maximum of solar activity cycle of 11 years. So when a major change as between the Maunder Minimum and now the UV must have varied so much that it had to have quite an effect on the chemistry of the stratosphere (the ozone layer …) and its dynamic.
So when a major change of several solar cycles from an average of 11 years due to changes in long-term cycles like Suess solar cycle or De Vries, the variation in solar radiation, UV, the brightness, magnetic field, solar wind and thus cosmic rays, are one of the causes of the evolution of the temperature in the atmosphere.
http://la.climatologie.free.fr/soleil/rayon-cosmique-sun.gif
http://la.climatologie.free.fr/soleil/soleil3.htm#cosmique
As the Earth’s surface temperature gradually rises, it has become vital for us to predict the rate of this increase with as much precision as possible. In order to do that, scientists need to understand more about aerosols and clouds. Jasper Kirkby details an experiment at CERN that aims to do just that.
https://youtu.be/sDo7saKaEys
Let’s see how much sulfuric acid in the atmosphere.
http://earth.nullschool.net/#current/particulates/surface/level/overlay=suexttau/equirectangular
“Atmospheric aerosols exert an important influence on climate1 through their effects on stratiform cloud albedo and lifetime2 and the invigoration of convective storms3. Model calculations suggest that almost half of the global cloud condensation nuclei in the atmospheric boundary layer may originate from the nucleation of aerosols from trace condensable vapours4, although the sensitivity of the number of cloud condensation nuclei to changes of nucleation rate may be small5, 6. Despite extensive research, fundamental questions remain about the nucleation rate of sulphuric acid particles and the mechanisms responsible, including the roles of galactic cosmic rays and other chemical species such as ammonia7. Here we present the first results from the CLOUD experiment at CERN. We find that atmospherically relevant ammonia mixing ratios of 100 parts per trillion by volume, or less, increase the nucleation rate of sulphuric acid particles more than 100–1,000-fold. Time-resolved molecular measurements reveal that nucleation proceeds by a base-stabilization mechanism involving the stepwise accretion of ammonia molecules. Ions increase the nucleation rate by an additional factor of between two and more than ten at ground-level galactic-cosmic-ray intensities, provided that the nucleation rate lies below the limiting ion-pair production rate. We find that ion-induced binary nucleation of H2SO4–H2O can occur in the mid-troposphere but is negligible in the boundary layer. However, even with the large enhancements in rate due to ammonia and ions, atmospheric concentrations of ammonia and sulphuric acid are insufficient to account for observed boundary-layer nucleation.”
http://www.nature.com/nature/journal/v476/n7361/full/nature10343.html
Still very strong ionization.
http://sol.spacenvironment.net/raps_ops/current_files/rtimg/dose.15km.png
Don’t know about the 200 years, plot cycle 14 apr 1902 to apr 1911
against jan 2009 to now, monthly sunspots…….almost exactly the same!
Cycle 12 is pretty similar also.
Zemlik if you read up on how the GPS system, timing, works that might help you out.
yes but they are trying to measure something using what they are trying to measure, innit ?
Now that we have detected gravity waves, could we work on the lagged or indirect correlation and causation between solar cycle waves and global temps via oceans. Dismissing the link between the Dalton Minimum and global cooling could be costly for those who pay for monumental policy mistakes, like planning and spending for the opposite outcome like we have today. Most other cases of monumental policy failure involve the old ‘wait and react’ pattern of doing nothing and then spending a lot on management by crisis. There are far fewer cases of large scale policy failure involving spending on a crisis in a complete opposite swing of outcomes.
“Now that we have detected gravity waves”
They detected GRAVATIONAL waves. There is a difference.
should be GRAVITATIONAL, once again my fingers betray me.
Okay, you had me going there with the new spelling standards.
This site seems to count/show more sunspots. They count 5 today – some really small…
Also on Mar 5 they show an asteroid 0.044 LD 30 meters in diameter (approx 10,000 miles from earth)
Oops forgot the link:
http://www.spaceweather.com/images2016/11feb16/hmi1898.gif?PHPSESSID=aa57e6o3jh9menqlc62a5ligu6
Those are sunspot groups, not individual sunspots. According to spaceweather,com, the current sunspot number is 81.
littlepeaks, those sure are some mighty small Sunspots…..are you sure they qualify as Sunspots ?? Kinda like Pluto no longer qualifies as a planet !!
OK thanks littlepeaks, never realized that.
So, if I understand the article correctly, Mann-Made Global Warming is causing the sun to lose its spots?
Brian McCool,
Nice.
Also, I wouldn’t be surprised if some US gov’t funded researcher claims “Mann-Made Global Warming” is responsible for leopards losing their spots.
John
Regarding the nature of the relationship between grand minimums in solar activity and cooler periods in climate, why think causation rather than merely being a non-dominating contributor?
For instance the LIA being caused by the Dalton minimum is weak because the energy variances from the sun are very very small for such a relatively large effect. Also, the timing of the LIA start is arguably before the Dalton minimum start.
Interesting.
John
Correction to my ‘John Whitman on February 11, 2016 at 3:54 pm’.
It should be the Maunder minimum versus the Dalton minimum.
John
That’s right. Maunder correlation isn’t there and isn’t strong enough to matter.
Mr Whitman
Both sun and Earth are driving climate oscillations
http://www.vukcevic.talktalk.net/Tec-TSI.gif
Look at planetay orbital data for the time of the Maunder minimum, there were large changes, it is believed that these orbital changes effected the suns polar field throwing it out of a regular cycle and prevented it from reversing completely for decades, this produced a phase of very weak solar activity… on earth this translated into a known cool period… hypothetically, if the suns polar field can be knocked out of a regular reversal and it’s polarities remain at the geographical poles for extended periods of time, then it’s not inconceivable that this process could cause full blown ice ages…
The sort if situation we have now where one pole has reached a near normal magnetic field strength and the other is still weak ?
Hi J Martin,
I’m under the opinion that the suns polar field strength doesn’t change in the sun itself and the measured changes are a superficial artefact produced on the surface while the suns polarities are interacting and ‘shorting-out’ causing sunspots and localized magnetic field distortions, from solar minimum when the suns polar field [-] and [+] are at the geographical poles this is the true strength of the suns polar field, produced byway of E=mc2, in this state the suns polar field should be measured as a constant (it wont increase or decrease as long as the suns mass doesn’t increase or decrease) and it should remain like this until the polar field begins rotating around the geographic poles and it proceeds to reverse around hemispheres…
Even though it sounds counterintuitive that when the polar field is measured to be at its strongest, the sun is actually in a state of low activity, it is the natural state for any known polar field floating in space, for a polarity of a planet or a star to change or ‘reaction’, there has to be an equal and opposite action, there is only one way this can happen in nature and that is through the interaction of another body/mass polar field etc…
When you break the suns components down to is basic properties, it behaves exactly how you would expect and you can observe its interactions with other bodies to make a judgement on how it will behave…
I like the elementary approach to understanding complexities even if its sometimes frowned upon, well, that just makes it more interesting 😉
The randomness of solar activity
https://www.researchgate.net/publication/288826889_THE_HURST_EXPONENT_OF_SUNSPOT_COUNTS_A_NOTE
“We therefore propose that the phenomenon is best described as the sum of two components – one regular and cyclical and the other irregular and random.”
Only one? How does a rescaled range analysis of the residuals of a secondary effect determine that if there is weak attenuation (with harmonics) of a dominant hysteretic primary evolution going on?
Evil C02 and growing a cowpea, yes off topic but
Solar cycle 24 activity is the lowest in nearly 200 years and was particularly low in January 2016.
Despite this we saw the warmest January on record for both surface and satellite data sets.
What does this tell us about the effects of solar cycles on global climate?
Oceans releasing many years’ worth of stored heater > reduced activity from the sun?
There is a level of lag (multi-decade) when you factor in oceans, so we can’t say much, I think.
If the warming is the result of oceans releasing stored heat then you’d expect to see a concurrent reduction in ocean heat content, right?
The opposite is the case though. Sea surface temperatures and ocean heat content are also increasing and are at record high levels.
How can oceans release heat without cooling?
“The opposite is the case though. Sea surface temperatures and ocean heat content are also increasing and are at record high levels.”
nonsense.
1) The heat capacity of the oceans is thousands of times greater than the heat capacity of the atmosphere. Having the oceans warm the atmosphere by a few tenths of a degree would cause a drop in ocean temperature of a few ten thousandths of a degree. IE, too little to measure.
2) We don’t know the temperature of the oceans to within 5C in the first place.
DWR54,
But is it really? The argo floats data was showing ocean cooling, so the data handlers removed all the ones showing cooling from the calculations because that just couldn’t be allowed. The models all show that the oceans should be warming from the longwave radiation reflecting from all that awful CO2. Of course they forgot that longwave only penetrates the surface interface of the water just increasing evaporation. Since they don’t have the mechanism right, nothing that follows can be treated with any credibility.
It tells us that warm years happen during solar maximums, they always do, there was no surprise, there was still a lot of solar activity and enough to effect heavily doctored data, but as many people have mentioned this enso warm spike is energy leaving the atmosphere and it will not be there as we head into a long solar minimum, so there are still no surprises happening…
This isn’t a solar maximum.
Dwr544… this is currently solar cycle 24, it is a peak of activity where a maximum number of sunspots occur, this is a weak solar maximum and activity is declining toward a solar minimum where there few to no sunspots and minimum solar activity and the polarities will be at the suns geographic poles, is that clear enough for you to understand, it is a bit tricky 🙂
Would you please stop embarrassing yourself?
That was directed at DW, sorry for any confusion.
“Solar cycle 24 activity is the lowest in nearly 200 years and was particularly low in January 2016.
Despite this we saw the warmest January on record for both surface and satellite data sets.
What does this tell us about the effects of solar cycles on global climate?”
Not much if we don’t look at any data prior to January, nor if we don’t understand the solar data from January.
SORCE TSI for January averaged 1361.2892 W/m^2/day. What does that mean to you? (That was a general question for everyone – not picking on DWR54.)
Does anyone here know how high TSI has to be and for how long for the earth to warm? or conversely, cool under low TSI? I asked and answered those questions while researching and developing my solar supersensitivity-accumulation model, work I did July 2014 to August 2015.
The answer means TSI is now just about to slip below the cooling line, and it will stay there most of the time until the next solar cycle rises to its maximum. We have a double whammy now with the La Nina occurring whilst the sun isn’t active enough to warm, so it’s going to get colder this year, and 2016 will not be a record temperature year as a result.
Today’s SSTs and OHC are the result of today’s TSI, but moreso of accumulated energy from high TSI stored in the ocean during the past, so trying to infer that today’s temps should only be proportionate to today’s TSI would be a mistake, and therefore missing the main story.
The recent El Nino started in earnest in March 2015, one month after the smoothed TSI peak for SC24 in February. Without the TSI spike last year, the 2014 El Nino would’ve fizzled into nothing, not blown up into a stronger ENSO as it did in 2015. It’s not a coincidence that 2014-15 were warm years while TSI was high. SORCE TSI rankings by year (2013 & 2014 with incomplete SORCE data)
Year TSI
2015 1361.4321
2014 1361.3966
2013 1361.3587
2016 1361.2854
2012 1361.2413
2011 1361.0752
2003 1361.0292
2004 1360.9192
2010 1360.8027
2005 1360.7518
2006 1360.6735
2007 1360.5710
2009 1360.5565
2008 1360.5382
http://spot.colorado.edu/%7Ekoppg/TSI/TSI_SORCE.jpg
Recent reconstructions are most certainly imperfect, but they’re all we have. The first one below fills in the missing SORCE data going back to 2000. Interesting articles on how the composites were stitched together at http://ceres.larc.nasa.gov/science_information.php?page=TSIdata, and https://www.pmodwrc.ch/pmod.php?topic=tsi/composite/SolarConstant.
http://ceres.larc.nasa.gov/images/TSIdata-plot.png
http://www.leif.org/research/Kopp-et-al-New-TSI.png
I think the actual frequency distribution is as important as the number. If it is blue shifted, it will penetrate oceans much more deeply than if it were red shifted. So the same raw TSI number could have very different impacts on the Earth temperature system. Higher frequency gets stored in the system for much longer than lower frequencies. So the old saw about a watt being a watt is all wet when the medium doing the absorbing has a varied response to frequency.
We see this in optics labs where our materials are very wavelength dependent. A glass that works great on our visible lasers becomes a really bad mirror to the CO2 laser in the IR spectrum. (Can wind up melting the glass under the right wrong circumstances.) Meanwhile the windows we use for IR look pretty opaque to the naked eye many times.
How are reconciling the 1997 NOAA record with today’s as being the warmest? Additionally, even if solar activity is not a factor or is a huge coincidence, then AGW is definitely not a valid theory, the current temperature is below the lowest modeled forecast. So much so that I can say since 1998 temps have been falling. At this point it is just a matter of time to see. Global cooling is a concern, warming isnt. We haven’t had a decade like the 1970’s. Food rationing was on the table before back to back super harvests in the US ushered in by warmer weather. And that wasn’t a major downturn. What do you think this author of this article is saying? And which do you think I think is the most likely, AGW or solar activity? It’s hard to ignore that if you think with reason that temps have fallen by 1.5 C and that solar activity has fallen that there isn’t some connection. Remember there has been no reduction in the output of co2, in fact year over year increases of over a billion metric tons.
Inertia.
it tells us solar activity is a leading indicator just like Co2 is a lagging indicator (in the context of historic global temperatures.)
the real climate change a cooling sun. ice age? of course by the time it gets really going gore and obama and most of us will be in the ground when the great sheet of ice grinds us up! climate hustle mon full display!
I suggest we send Algore and Obozo in a rocket to the Sun to research this.
After reading the comments, I was thinking they should have had this debate BEFORE they concluded the earth was heating up because of man, and taxing CO2 would save the planet.
But we can always re-adjust the temps upwards to turn the cooling into warming and get NYT to print our graph on the front page. This will instantly change the minds of those who are dying in the cold and convince them that its actually extreme heat thats killing them.
carlb says:
My plan is to have my my ashes scattered over the surface of the ice sheet to lower the albedo. It will be my small part to reduce global cooling.
There will be public and media demands for an explanation as to why the planet is abruptly cooling. It is possible to wave away 18 years of no warming with heat is hiding in the ocean. Abrupt cooling will be a game changer.
The politicians will abandon the cult of CAGW when it becomes obvious that the entire IPCC science was incorrect. More than 75% of the rise in atmospheric CO2 was due to the warming of the oceans and increased deep core release of CH4, as opposed to anthropogenic CO2 emissions.
Almost the entire warming in the last 150 years was due to solar cycle changes, as opposed to the rise in atmospheric CO2. Double trump. Humans did not cause the rise in atmospheric CO2 and the rise in atmospheric CO2 did not cause the warming.
The efforts to reduce anthropogenic CO2 emissions achieved almost nothing and were a purposeless waste of money. Trillions of dollars have been wasted fighting ‘climate change’.
The problem which must be address is to this point unimaginable to the public and the politicians: Abrupt cooling and what will happen to the earth when the solar cycle restarts. Does anyone remember the 18 burn marks on two different continents at different latitudes that coincide in time with the Younger Dryas abrupt cooling event?
The cult of CAGW are in denial they know something extraordinary is happening to the earth’s climate, it is starting to abruptly cool.
http://www.ospo.noaa.gov/data/sst/anomaly/2016/anomnight.2.8.2016.gif
http://news.yahoo.com/la-nina-expected-next-months-first-time-since-190913814.html
It is obvious based on observations that the solar cycle has been interrupted. There are cycles of abrupt climate change in the paleo record that correlate with abrupt changes to the sun. What is now happening to the sun is what causes a Heinrich event.
The solar cycle is not slowing down. The graph of the average field strength of a sunspot on the surface of the sun stopped dropping (plateaued due to a mathematical and physical reason) as the minimum field strength of a sunspot on the surface of the sun is around 1500 Gauss. The graph stopped dropping linearly dropping when the minimum field strength of a portion of the set of sunspots on the surface of the sun has below 1500 Gauss. At that point only sunspots with a field strength greater than 1500 Gauss are measured.
As the solar process unfolded, long lasting large sunspots (last up to a month) were replaced by tiny short lived pores (disappear in less than a week) as the magnetic field strength of the magnetic flux tubes that rise up from the tachocline to form sunspots on the surface of the sun decreased.
As the magnetic field strength of the magnetic flux tubes continued to decrease the magnetic flux tubes that rise up to the surface of the sun were torn apart by convection forces in the solar convection zone so what has left on the surface of the sun was a region of higher magnetic flux but no visible sunspot.
The Younger Dryas is the last Heinrich event. The Younger Dryas is the name for an abrupt cooling event that occurred 12,800 years ago, at which time the planet when from interglacial warm to glacial cold with 75% of the cooling occurring in less than a decade. The YD abrupt cooling period lasted for 1200 years. The YD event occurred when summer solar insolation at 65N was maximum which is one of more than a dozen different observations/analysis results that support the assertion that summer solar insolation at 65N is not the cause of the glacial/interglacial cycle or the cause of cyclic abrupt climate change.
http://www.falw.vu/~renh/pdf/Renssen-etal-QI-2000.pdf
http://wattsupwiththat.files.wordpress.com/2012/09/davis-and-taylor-wuwt-submission.pdf
http://iopscience.iop.org/1742-6596/440/1/012001/pdf/1742-6596_440_1_012001.pdf
There will be public and media demands for an explanation as to why the planet is abruptly cooling.
Except that it is not. What we should demand is an explanation for why it is not cooling.
And your ‘solar cycle interruption’ is just nonsense.
“What we should demand is an explanation for why it is not cooling”.
Isn’t the planet constantly cooling?
I haven’t seen any accumulation of heat evident in any temperature dataset, the fact that there are variety of fluctuations in every year (even at longer time-scales) in every record, shows in realistic terms that the earth is constantly cooling off…
No explanation needed!!
If there is less heat to cool off, shouldn’t there be a point where the rate of cooling will be equal to the rate of warming? hmm did someone mention ‘a pause’??
@ William. .. I’ll only respond to the 1st part. There is something wrong with the co2 record. There are no negative numbers since the industrial Revolution began. In terms of quantity , the rate of rise per year, and the sink rate it confirms what you are saying. Additionally, it was pointed out by the IPCC that they could tell where the co2 came from by isotope ratios. The reasoning was that fossil fuels since being buried for so long was now isotope free than say burning from a forest fire. It is interesting to note that the greens in California ( see the gas leak) aren’t just concerned about the radon from that leak, ( and maybe from the proximity to a former nuclear production site that melted down in 1949) but from all fossil fuel burnings. Do note that the highest year on record for growth of co2 was 2.53 ppm in 1998. The production rate of co2 has increased every year since then. There are a lot of unasked and unanswered questions.
Their models came nowhere near predicting what we are experiencing now. How valid does that make them for the future? Not much.
On the contrary, our models of the solar cycle did an outstanding job predicting that the current cycle would be the lowest in at least 100 years.
No, the official sites like JPL and Goddard didn’t . Cycle 23 and 24 were suppose to look exactly like cycle 22 and 21. In fact I remember them talking about the magnetic field strength and diapoles being exceptionally strong leading to a very active cycle 23. Isvalgaard that is revising the past. They didn’t know and it was a surprise. I’m sure that if the sun hadn’t of gone quite the global warming debate would have been over. Did I know? , sort of, it could have been cycle 25 , 26 or longer. The sun has its own agenda and reacts to different things we haven’t figured out yet. Otherwise the pretty graphs of the forecast of cycle 23 would have looked a lot different.
I was on the OFFICIAL solar prediction panel in 2006-2008 and we ended up predicting a weak cycle 24, based on our paper http://www.leif.org/research/Cycle%2024%20Smallest%20100%20years.pdf
We do know how this works.
Anthony said “most recent Solar Dynamics Observatory (SDO) photo” shows no sunspots. That is because the recent photos are way out of focus. The intensity from the HMI experiment shows healthy sunspot activity:
http://spaceweather.com/images2016/11feb16/hmi1898.gif?PHPSESSID=otddd9qi6ultlaj7b16mhh53t1
The cycle is not dead at all.
What you are providing a link to above is an amalgam of different frequencies as it no longer possible to see sunspots in the standard single frequency. In the very recent past (last solar cycles) sunspots were clearly visible in the single frequency view. They are no longer visible in the single frequency view. You are ignoring that obvious observational change in addition to the fact that large long lasting sunspots have been replaced by tiny short lived sunspots which are called pores.
The silly solar gate propping up of the sunspot number by NOAA that is going on is pathetic and purposeless. I do not understand why NOAA is attempting to hide the obvious observational fact that sunspots are disappearing which is different than there are less sunspot groups and less sunspots on the surface of the sun. Propping up the sunspot number does not change what is happening to the sun.
As I have stated there are hundreds of astronomical observations and solar system observations that support the assertion that the sun and stars are significantly different than the standard model.
You are completely unaware of the observations (anomalies and paradoxes) in question which explains why you repeat an incorrect theory emphatically that is disproved by observations.
Obviously observations (am asserting there will be abrupt cooling of the planet and an announcement that the sun is in a weird state) will prove which one of us is correct. A scientist changes his or her mind when observations no longer support a theory. Science is not a debate where people pick sides and have an emotional attachment to one theory or another.
The solar cycle has been interrupted and the planet will abruptly cool. There is a physical reason related to the mechanisms and how the sun has changed and is changing that explains why there was a delay in cooling.
The observational fact that there has been an increase in jet stream speed is one of the observational signs that the cooling has started and is one of the cooling mechanisms. There is increased evaporation of cooling of the ocean when wind speed increases.
If you had read Svensmarks’ book Chilling Stars: Cosmic Climate Change which you have not you would understand the greatest amount of cooling is in the latitudes 40 to 60 which is where the cooling has started.
http://www.amazon.com/The-Chilling-Stars-Cosmic-Climate/dp/1840468661
They are no longer visible in the single frequency view
Total nonsense. Here is the view of the solar disk today in the single frequency of 6173Å :
http://spaceweather.com/images2016/11feb16/hmi1898.gif?PHPSESSID=1bf1qe3mc76obl3a81hb5j1sh3
A scientist changes his or her mind when observations no longer support a theory
But a pseudo-scientist like you never does that, right? I mean, if you understand everything perfectly from a holistic view [as you claim you do], changing your mind would not make sense.
I have asserted that the majority of the warming in the last 150 years is due to solar cycle changes. I have also asserted the solar cycle has been interrupted. If both assertions are correct the planet will abruptly cool.
In science theories are proven correct or incorrect by falsifiable predictions compared to observations.
Leif has asserted that the sun cannot significantly change and that solar changes have almost no affect on the earth’s temperature. (I am curious if there will be a significant change in TSI when as the solar cycle interruption proceeds, see below.)
Leif do you have an explanation for the Solar Convection Zone Paradox? Have you though about it?
Solar Convection Zone Paradox
Recent helioseismology analysis has determined that motion in the solar convection zone is a hundred times smaller than expected based on the standard solar model.
The paradox is why is motion in the solar convection zone a hundred times less than modeled? If the physics of convection is not changed/correct, as the energy output of the sun is known.
The implications of this finding is there is a non convection mechanism which in turn logically requires a non fusion reaction (the only method for the fusion reaction to transfer energy is radiation which takes millions of years to move through the radiative zone and then the radiation transfers energy by convection motion through the convection zone to the surface of the sun) that is transferring energy from the core of the sun to the surface of the sun.
The finding that convection motion in the solar convection zone is a hundred times slower than expected is one of the hundreds of astronomical observations (There are at least a dozen or so in our solar system in addition to the very recent solar convection paradox such as the variance of comet coma for first pass comets: Why do new comets (those approaching the sun for the first time) loss two to three magnitudes in average brightness, while old comets show little evidence for further brightness decreases? Why do comets display large comas at very great distance from the Sun where the solar vaporization is expected to be small?) standard model.
The logical implications of the finding that motion in the solar convection zone is a hundred times slower than modeled (accepting the result and assuming the physics of convection is correct so the convection motion would be 100 times faster if the primary/only method of heat transfer was convection), is energy is being transfer from the solar core to the solar surface by a non convection mechanism.
This new mechanism would enable a specific reaction change (non fusion reaction, the reaction that is creating the coronal holes and the solar wind) in the solar core to cause an almost immediate change in solar irradiance which is interesting. I am curious if TSI will change when the sun is in the new state.
http://www.mpg.de/5913479/convection_sun_surface
Leif do you have an explanation for the Solar Convection Zone Paradox? Have you though about it?
I am the great expert on all things solar and you cannot find anything valid about the Sun that I’m not familiar with.The wording in the paper is very misleading for the uninitiated. What was found was that the Rossby number: the ratio of convective velocity to the speed of rotation is low and that convection is thus strongly influenced by the Coriolis force. This is a problem for some numerical models of the convection, which just shows that those need to be improved. This is not the same as to say that the ‘standard model’ must be rejected. The standard model is extremely successful.
I have asserted that the majority of the warming in the last 150 years is due to solar cycle changes. I have also asserted the solar cycle has been interrupted
Assertions like that are not science, but wishful thinking.
AS IF it matters. CO2 is the driving force behind globull warming. The sun just provides a little light..
Looking good from here
http://sdo.gsfc.nasa.gov/assets/img/latest/f_211_193_171_1024.jpg
And no Astley “interruption” here …
http://wso.stanford.edu/gifs/DipallR.gif
Matthew 24:29
You mean the sun has an impact on our climate change? Someone should tell Al GOre. Funny how no one from the climate change fan club seems to think that the sun has any affect.
200 years? … and those records are where ???
The records from 1749-1799 are today stored in the library of the Astrophysikalisches Institut Potsdam,
Germany, and are in very good condition. Arlt (2008) has recently photographed the drawings.
See e.g. http://www.leif.org/research/Recount-of-Staudach.pdf
Later records are similarly photographed and have been published long ago.
It was determined last July that our sun is descending into the next Solar Gand Minimum a natural cycle that occurs approximately every 350-450yrs, it’s been 400yrs since the last one and we are due! Every Grand Minimum is preceded by a warming period, thus the global warming scare that had nothing to do with C02 emissions and It’s easy to prove. When our planet was warming, as stated more than once in the above comments it stopped over 18yrs ago. NASA, NOAA, GISS,IPCC among others have been fudging data to keep the grant money flowing period! The IPCC only used the word “SOLAR” once in its last report, that is why not ONE OF THEIR MODELS HAVE BEEN CORRECT! ZERO, ZIP, NONE! Anyway, when earth warmed the weather also changed on every planet in our solar system. The ice caps on Mars melted, the winds on Venus increased by a third ect. Look it up for yourselves. Our C02 wasn’t affecting other planets so don’t even go there. More than anything else, solar activity drives our weather, they just won’t talk about it because it doesn’t fit their narrative of using fear to steal billions for the taxpayers! There is also another natural cycle that is affecting our weather, the earth started a magnetic reversal 10-15yrs ago. The last time that happened was almost 800,000yrs ago and it’s definitely having an affect on our planet. The fact is folks, it’s going to get cold, antarctic ice levels have just broken al time records again and the arctic had expanding quickly, the ice never even completely melted out of Hudson Bay this summer, and it started refreeze a month early. Our sun is going to sleep for a bit and their is a 99% certainty of that, look it up! Those who lie will continue to, this is the honest to god’s truth so start to prepare for it now. In 10-15yrs we’ll be ass deep in it!
Solar “Grand Minima” Threat Analysis
James A. Marusek
2009
[Snipped. Far too long. Please just post the link. -mod.]
Many things right, but also many things wrong [and out of date – 2009].
Isvalgaard: Can you list which things are right?
Thanks,
-Walt
Lordy. Link to the article so we don’t have to scroll down through a cut and paste filled with returns.
The unfortunate fact is that politics requires reassurances and scapegoats. The powerful must be just that, powerful. This goes to the need to be able to affect global temperatures. In the political model, the one thing they can control, or at least scapegoat, is CO2. For the simple minded, it works well. Show them a smokestack with some creepy background music. Then role out a program. Most of the tenured grant grifting researchers will fall in line and do what’s demanded of them. In fact, they will compete for the prizes available to the best fakery. It is obvious that the Sun brings us heat, after all it gets cold at night. This is a problem. The demigods can’t plausibly control the activity of the Sun. To claim the ability to do so would open them up to ridicule. In addition, the Sun is too big to ignore. So, it must be viewed as a constant. Those who assert otherwise are considered heretics and their careers are torched. Government people are consensus builders, not truth seekers. They will avoid and deny all anomalous, contradicting, outlining information until it bites them in the butt. Afterwards, they will react it their typically pompous, clumsy, self-promoting manner, getting little done, while consuming great resources. The current information flow seems to indicate that the butt biting will occur around 2030. In the meantime, we need to advocate the launching of a second Ulysses Satellite to track the activity of the heliosphere. This replacement for the previous probe would hopefully be larger, with a better battery pack and more fuel onboard, in order to give it a longer lifespan. And a permanent solar probe mission should be put in place, even if it requires international funding and monitoring. Given the high evolved complex social system we live in today, with its profound specialization and interdependencies due to the intensification of the division of labor, an unprepared for repeat of a Maunder Minimum event would have such cascading effects as to wipe out much of the human race.
Perhaps go outside and enjoy some “Sun” . The big picture here , is that we are only here for a short period of time. All of this time and effort put into something that truly will have no direct impact on your life personally. Always trying to “prove” something. How about enjoying what little life you may have left ……
So very true. People go about their lives – but if you told them how many days they had left, they would act so differently. It’s thought that over 100 billion people have lived and died on Earth. Yet not one single one of that number has lay on their deathbed, and with their last breath said, “I wished I had spent more time at work”.
Work less, enjoy more. You can’t change the world, so don’t waste time trying. Believe in nothing without evidence, but do believe in love at first sight. Strive to be healthy, but not too much. You get a very brief chance to flash your colours.
Thanks Clayton for reassuring me that there are a few people left that think for themselves instead of blindly believing what is spewed from the “Orwellian Box” in most peoples living room. I have been following this for awhile and all things related to a coming solar quiet are happening all over the planet. Lets hope it’s not a repeat of the Maunder Minimum, millions died, mostly from famine, that would probably equate to over a billion perishing today. We wouldn’t see nearly the loss of life if it were not for America’s biggest enemy (Our federal government) not allowing the media to inform the public so some at least could prepare, most would don’t have the attention span or ambition to pay attention or seek the truth. It seems this planet is doomed to continue to repeat the same mistakes over & over because people allow corrupt governments rewrite history and thus allowing it to repeat. Cheers!
An increased Rossby waved jet stream could be result of the quiet Sun, it has been thus since 2010.
the effects on the upper level atmosphere are exponential imo to slight changes to TSI.
The lag to overall lower leveling downward temp. trend could show itself once things settle down in those regions.
Cycle 24 weak compared to priors with reduced TSI (which say given is not enough in W/sqm) but magnetic field of sun weakening in turn reduces the protecting/shielding the earth would lead to more high frequency cosmic radiation hitting earth (Svensmark, CERNS) more cloud seeding, more albido, colder temp (or hotter temps opposite for strong cycle 22), makes complete sense.
Now, what about earth’s magnetic field? Seems should have same effect. It has been decreasing (abet we have not had the atmosphere stripped off like Mars). Should not that have same effect, say 5% weakening now per century, abet longer run volatile, also for poles drift which would could theoretically effect albedo and northern lights, think about center on polar ice cap or off center, plus that would differ in N or S. Been 770,000 years since earth flipped which is a bit less than sun on a more constant approximate 11 year cycle.
Anyone care to take a shot at this, if the sun’s magnetic field fluctuating has a big impact on earth’s climate, would not the earth’s magnetic field changing have a similar effect? I hear all about sun, nothing about earth.
http://image.gsfc.nasa.gov/poetry/magnetism/MagIntensity.jpg
I cannot confirm nor deny this info but the fact is, Ma nature is not your friend and if this info holds true to fact and logic then mankind is getting a break on the alleged cause for the earth’s climate and local weather patterns……Maybe we can shoot for sovereignty and less communism so the UN will stop whining about global government….
The ‘takeaway’ from the current solar cycle apparent ‘decline’ is that if it continues on track, we will have a very different solar cycle ‘on file’ compared to the previous few (in the satellite era).
Obviously, I can’t speak for Leif, but I’d be reasonably confident many solar scientists are excited by the significant apparent differences in this cycle and is presumably looking forward to seeing if there are any subsequent effects in order to further our understanding? The previous solar cycles ‘ramped up’ in apparent activity (SSN’s) and this one is noticeably lower. What does it mean for the climate? I venture to say that we do not know yet but Nature has given us this directly observable variation – so let’s just observe and see what happens!
Yet somehow, humans are responsible for this and we have to pay to get this fixed!
“This alignment of gas planets happens every 179.60 years. This is why the Sun orbits the center of gravity and center of gravity of the solar system are reproduced sequentially with a period of 179.60 years. This must be the cause of the cycle Suess or Vries as the minimum of the solar cycle falls when the orbital angular momentum of the Sun varies rapidly or every time when solar activity and temperatures have weakened either at minimum Oort, Wolf, Spörer, Maunder and Dalton.
In the figure below there is the variation of the distance of the centroid-Sun, the speed of the sun around the centroid of the orbital acceleration of the sun around the centroid, the rate of change of the orbital angular momentum of the Sun. the number of Wolf sunspot and temperature anomalies in the northern hemisphere. Two spaced vertical dashes of approximately 43 years appear every 179 years. The gap between the two close enough vertical dashes is around 43 years or the period conjunction of Saturn and Uranus.
Each vertical dashes represent a rapid variation of the orbital angular momentum of the Sun occurs when the center of the Sun passes close to the center of gravity, resulting in variations in angle theta fast and therefore an angular velocity that can become very high. Either when Jupiter is the opposite of the four Jovian planets from the Sun, as was the case in 1632 and 1672, 1811, 1851, 1990 and soon in 2030.
As we can see, the two dashes returning every 179 years or when the law of GO is not followed and thus the odd cycle is less active than the preceding even cycle contrary to what it should be. Each of these vertical dashes couples are near a periods of solar activity and temperature of the northern hemisphere are low or declining.”
http://la.climatologie.free.fr/soleil/barycentre2.png
http://la.climatologie.free.fr/soleil/soleil2.htm#g-o
Nice work, ren.
Perhaps they should do some more research. There has been a single, one, spotless day since 2011.
Grand minimum.
Not a Maunder or a Dalton.
A Grand minimum.
It’s Bush’s fault.
OMG, Whew… all the comments, and commentators, have proven EXACTLY why Government, NOAA and proponents of AGW have been able to hornswoggle the (a majority? No) electorate. I had to take a aspirin after reading it all… stunning. So, I guess it is going to get warmer? Oh, er, no, no, excuse me, colder… in a few states, no? The world? Just the Atlantic, or the Pacific, oh the traffic is terrific. Somethings gotta rhyme As long as you don’ tlike the backs of your hands after the presentation. Thank you.
Get ready folks. We are going to have very cold winters and years without warm summers.
It already is occurring, fewer stations have reported an eclipse of the century mark for the last 3 years running in the U.S. Only a zonal type jet stream is required at this point for the cooler numbers to add up.
And is the only reason why without they are able to claim an overall “warming” of the globe. The jet stream is in mix mode. When not, those tropics will heat sink even more into their waters.
Well:
http://spaceweather.com/images2016/12feb16/hmi1898.gif?PHPSESSID=8a0aql1t6oina82a52ilfjkj95
There is a large sunspot..
so…
don’t worry folks, obama and other leftist will figure out a way to blame global warming, or climate change from planet earth being projected unto the sun.
Silly Anthony, lack of sun spots is directly caused by people driving fossil fuel powered vehicles here on earth.
Can someone explain the new method of counting sunspots?
The new CORE math methodology
same as the old one used a hundred years ago. The main difference is with modern data after 1947 that are contaminated with a ‘double count’ of large spots, see: http://www.leif.org/research/Effect-of-Sunspot-Weighting.pdf
This over-count has been removed from the new series.
Global warming
I hope it goes supernova
[A rather perverse desire. From where are you typing this? .mod]
A lot of scientific jargon and graphs here…but here’s what the Bible says is going to happen…
“Then the fourth angel sounded:And a third of the sun was struck, a third of the moon, and a third of the stars, so that a third of them were darkened. A third of the day did not shine, and likewise the night.”
(Revelation 8:12 NKJVS)
What we’re seeing today might just be a prelude to this prophesy…
I think they were describing atmospheric dust caused by nuclear explosions. Don’t forget about the poisoning of the waters.
I KNEW IT THE PREACHER AT THE CHURCH OF GLOBAL CLIMATE CHANGE HINTED IT. THE SUN IS THE CAUSE OF GLOBAL CLIMATE CHANGE. SOMETHING MUST BE DONE WE MUST EXTINGUISH THE SUN THEN WE CAN CONTROL IT OURSELVES.
Is it just me or does the use of the term “Global Climate Change” suit this particular kind of comment, it just sounds so loony tunes when you read it in this context! lol
Mankind has polluted the earth to the point we are warming into a cesspool of muck and sulfur. Now we find that our greed and arrogance and callous disregard of Mother Nature is cooling the sun. Is there no end to the madness? When are the men on Mars going to get revenge on the evil capitalist polluters of the Earth who are now plotting to cool our Sun from afar, beyond the infinite expanse of the Universe?
“Cyclic Global Climate Change”, Leif Erickson, Greenland and BUFFALO [prunes]. We are lucky they slaughtered all the millions of buffalo that pootered their methane. The world would have been destroyed!
beware of liberals, they believe in the hoax
Good thing we have global warming
Hard to take an article seriously when it starts out with a photo that is either a misprint or just made up. See solarcycle24.com to see that there is indeed a fairly large active area right in the middle of the northern hemisphere of the sun today.
glenn,
You know the sun constantly changes, right? And it rotates.
Sunspots come and go. But lately they’ve been sparse.
I have great fun telling my progressive friends that this is due to anthropogenic sunspot depletion brought on by all the solar panels. 😉
Having fun is good, especially since it doesn’t matter what you tell ’em.
Oh I know that it doesn’t matter much what you tell them but rub their noses in it long enough and an idea or two might percolate through. By the way, the look on their faces is priceless when you congratulate on the wonderful effectiveness of their bird choppers AKA wind turbines.
In response to Leif’s comment:
Leif, your comments in this forum are from time to time obviously incorrect. I would assume you are aware the comments in question are incorrect, the comments are hence disingenuous. A disingenuous comment is a comment that is incorrect and the person making the comment is aware the comment is incorrect. A person making a disingenuous comment is making the comment in question to distract other readers from the truth, the implications in this case, that the standard solar model is incorrect, which is exactly two different solar specialists Gizon and Hanasoge state. Your above comment is not misleading it is disingenuous.
It appears you have agenda which is to push the paradigm that solar cycle changes did not cause the majority of the warming in the last 150 years.
Of course what you say or do no say in this forum does not affect the physics of what is current happening to the sun and how the current change to the sun will cause the planet to abruptly cool. Big surprise there are cycles of planetary warming and cooling that correlate with solar cycle changes. The solar cycle has been interrupted and the planet will cool. This is a falsifiable prediction.
What has found by helioseismological analysis is the convection motion in the solar convection zone is a 100 times slower than the solar standard model predicts. The standard solar model is BS, incorrect, falsified by observations.
Direct quote from GIzon
http://www.nyu.edu/about/news-publications/news/2012/07/09/researchers-create-mri-of-the-suns-interior-motions.html
The following are peer reviewed paleo climatic observations/analysis results that support the assertion that the solar cycle changes in a manner not predicted by the standard solar model (the standard solar model is not correct, has been falsified by observations, see above for details) to cause cyclic warming and cooling of the earth.
http://www.essc.psu.edu/essc_web/seminars/spring2006/Mar1/Bond%20et%20al%202001.pdf
http://www.agu.org/pubs/crossref/2003/2003GL017115.shtml
<blockquote Timing of abrupt climate change: A precise clock by Stefan Rahmstorf
Many paleoclimatic data reveal a approx. 1,500 year cyclicity of unknown origin. A crucial question is how stable and regular this cycle is. An analysis of the GISP2 ice core record from Greenland reveals that abrupt climate events appear to be paced by a 1,470-year cycle with a period that is probably stable to within a few percent; with 95% confidence the period is maintained to better than 12% over at least 23 cycles. This highly precise clock points to an origin outside the Earth system (William: Solar magnetic cycle changes cause warming and cooling); oscillatory modes within the Earth system can be expected to be far more irregular in period.
Note the cyclic warming and cooling of the earth occurs in both hemispheres with the same periodicity. There is no internal earth mechanism that is highly periodic and there is no earth mechanism that can affect both hemispheres. In addition there are cosmogenic isotope changes which are caused by solar cycle changes that correlate with the climate changes. There has been a cottage industry of researchers that have been altering the cosmogenic isotope proxy record in a silly attempt to push CAGW.
That is pathetic. Manipulation of the proxy record (climategate type shenanigans) will not change the physics of what is currently happening to the sun and will not stop the planet from abruptly cooling.
http://wattsupwiththat.files.wordpress.com/2012/09/davis-and-taylor-wuwt-submission.pdf
I would assume you are aware the comments in question are incorrect
Your assumption, as everything else you assert, is incorrect. My mistake to try to correct you, as that is a lost cause.
Greer et al. http://www.leif.org/EOS/Greer-Convection-2015.pdf shows that the analysis by Hanasoge et al. is not correct, so poof, there goes your paradox. But, I think this will have no effect on your know-it-all musings.
Low solar activity 1940s – high temperatures
High solar activity 1960s – low temperatures
Hahaha!! You obviously haven’t bothered looking at the latest doctored anomaly which clearly shows the 1940’s as having lower temperatures than the 1960’s..
Thanks for the laugh…
William Astley
” The solar cycle has been interrupted and the planet will cool. This is a falsifiable prediction. ”
Hi William,
I don’t believe Leif is being disingenuous at all, that’s just his style of commentary, if you say something like “the solar cycle has been interrupted” Leif will latch onto this and give you a hard time, and I’ll have to agree with Leif, when it clearly hasn’t been “interrupted” but even though Leif isn’t clear, I think it’s a poor choice of words to describe this weak cycle.
In your favour though, there has been a slowdown in the movement of the suns polar field, the polarities of which are beginning to move a lot slower around the sun compared to the last few solar cycles of the last century, this has caused a considerable decline in activity, (UV and x-ray are very noticeable and worth keeping an eye on) therefore in my opinion you should be explaining your point from the perspective of the suns polar field and try to understand what possible process can effect such an enormous polar field making it speed up producing increased spikes of intense solar activity or slowing it down reducing solar activity and prolonging solar minimums, increasing the amount of days of little to no sunspots…
Key points: The solar cycle has not been “interrupted”, the movement of the polar field has slowed down.
UV and x-ray (which penetrate deeper into earth’s oceans and crust) have been reduced.
In my opinion the main process effecting the movement of the suns polar field are exterior interactions with planetary mass in the solar system, notable evidence of orbital changes occurring throughout the 400 year sunspot record show a regular increase and decrease of the speed of the suns polar field, translating into stronger, shorter and more active solar cycles when the movement of the polar field increases, the outer orbits of the giant planets become tighter, faster and shorter.
The case is the same for weaker, longer and less active solar cycles, when the movement of the polar field decreases the outer orbits of the giant planets become wider, slower and longer.
Planetary orbits do increase and decrease in speed, two giant planets at the edge of our solar system have enormous orbital changing perturbations that resonate throughout the solar system including effecting the movement of the suns polar field…
I would even go as far to say, when these two giant planets at the edge of our solar system orbits change enough, the suns polar field can fall to rest at it’s geographic poles and cause a full blown Ice age on earth, this would be equivalent to having solar minimum conditions for decades, centuries or even millennia.
The timing of these major orbital changes also occur at the same frequency and time scale as the Ice ages recorded on earth.
So here is a perfect hypothesis of what causes glacials and interglacials on long time scales and also mini Ice ages and warm periods on much shorter time scales using both the suns polar field and changes in planetary orbits at a very basic level and using only known primary principles.
BtW the last orbital changing perturbation of the two outer giant planets occurred in 1999, it caused a minor change in their orbits, these minor orbital changes accumulate over time translating into major orbital change, this not only effects motion but it effects time itself as enormous gravitational stresses are evolved, invoking aspects of the theory of relativity.
Question. Specifically which planets are you referring to, Jupiter, Saturn, Uranus or Neptune? Can describe in more detail the perturbation, occurring in 1999, that you mentioned?
Uranus and Neptune, these are the only two giant planets in our solar system that have large orbital perturbations, in fact The planet Neptune was predicted before it was observed due to the observational change in Uranus’s orbit, The recent Perturbation between these two planets began early in 1989 and the conjunction occurred in 1993 and the Perturbation was complete in 1999, another interesting point about Uranus is that it’s poles rotate toward the sun, I measured the timing of this rotation (which was referenced in a paper) and it appears to be synchronised with the suns polar field reversals as if it was locked into the suns polar field,
I’ve also looked into Uranus’s density and mass which appears to be wrong, but that’s a different issue 😉
Thank you so much for your reply. The solar polar shifts is a new one for me to ponder. You may have a major tell, concerning the sun’s magnetic influence on planetary orbital dynamics that is going un-discussed. If you could provide the link to the study you referenced, it would be appreciated. My initial takeaway from your reply is that it is the conjunction of Uranus and Neptune that creates or is fairly and almost exactly correlative to their perturbation. Do you know which is the case? What happens when they are in opposition? Having studied this issue for the two planets in question, have you observed this perturbing behavioral affect any other of the large planets, such as Jupiter and Saturn, or Saturn and Uranus?
Personally, I’m switching from “it’s the sun” to “it’s cosmic rays” for some time.
What do you think regulates “cosmic rays”? you’d be better, switching to reading a book lol 😉
A faint partial halo coronal mass ejection was launched with an angular width of about 270 degrees. Most of the ejected material is heading well north and west of our planet but we are confident that at least a part of this plasma cloud will interact with Earth. A glancing blow will likely arrive at Earth.
http://www.spaceweatherlive.com/images/news/2016/200-c2.gif
Apology about the active .gif from space weather, it may slow down page download. Perhaps moderator could fix it as a passive link.
Hi Anthony
Even the Daily Mail is quoting this thread:
http://www.dailymail.co.uk/sciencetech/article-3444633/What-happened-sun-Solar-activity-remains-quietest-century-trigger-mini-ice-age.html
MODs it’s not like there to be a typo for this long… Ir has been a couple of months since…
Let me correct a few erroneous assumptions floating around on this post.
First, the 11-year solar cycles are often said to depict “solar activity”. As if it had some direct relationship to solar radiated power. Actually it depicts the sun’s magnetic behavior, related directly to the solar dynamo, which models the process which generates the sun’s magnetic field, not its thermonuclear power generation. So the TSI, the actual power radiated by the sun, is pretty much a constant, varying only 0.1% over a solar cycle. The variance in TSI caused by the variance in the Earth’s orbit around the sun is much larger, for example.
Secondly, SC24 is indeed one of the smaller cycles. But it isn’t that much smaller than SC19. Maybe 25 flux units smaller. So what’s the big deal? Like the ‘hottest’ year being 0.1C hotter than usual etc.
http://i63.tinypic.com/2gy0zh0.png
But what about the lulls between cycles? Typically the flux goes below 75 for 4 years or so (blue rectangles). If low solar “activity” causes cooling, then where are the signals from these periodic lulls in the temperature record?
Also note the late reprise in SC19 (green oval). So don’t be surprised if SC24 generates one last gasp of magnetic activity in a year or so. And remember that Johanus predicted it.
:-]
Secondly, SC24 is indeed one of the smaller cycles. But it isn’t that much smaller than SC19
Should be SC20, not SC19
> SC20, not SC19.
Oops, Cycle #19 (the so-called “grand maximum”) was ‘fixated’ in my mind. Thanks.
Johanus, The anomaly ( the difference to a long time average) is used in many fields of physics. Your question “How is that meaningful?” shows your lack of knowledge. The 10,7 cm Radioflux is for sure a good proxy for solar activity but the record is too short to compare the actual cycle with SC 5 or SC14. In your own words: “The Radioflux correlates nicely to SSN”, so the SSN is the best long time proxy we have.
http://up.picr.de/24583592ua.gif
And: The SC20 ( black) WAS much weaker than SC24 ( red). And: in the 70s it was global cooler then after 2009. What is your message?
The SC20 ( black) WAS much weaker than SC24 ( red)
No, look at your Figure again.
> The anomaly ( the difference to a long time average)
> is used in many fields of physics.
> Your question “How is that meaningful?”
Sunspots, by their ‘dark’ nature, are already anomalies compared to the bright photosphere. But if I understand correctly, you are computing “SC-anomaly” from the average intensity of sunspots themselves (the anomaly of an anomaly?) so an ‘average’ sunspot would have SC-anomaly=0. Is this correct.
If so, I fail to see how this is useful.
Also I agree with Leif, your SC-24 “thermometer” should show a higher value because temperatures are warmer now than in the 1970’s.
This gives 66% ( month 30 to 75). I don’t know why it’s a mistake to solve this integral from the start of the cyle on instead to use a arbitraraly date. You argue that a weak SC starts weak and a strong SC strong. That’s why the values from the timespan around the max. don’t differ much from the values when one uses the data from month one on for the integration. This illustrates good that the estimation of Waldmeier is right.
My “homegrown way” is the classic way to calculate a product ( SSN*time) from a function over time. It’s not “my way” ( or Frank Sinatras 🙂 ).
Well, after all the confusion it finally becomes clear what you are doing: simply calculating the total area under the curve. Why didn’t you say that in the beginning. Since the cycle 24 has not run to its end yet, you cannot say by how much the ‘cycle’ is lower, only that the integral so far is lower. And you still run into the problem if the cycles have different lengths. The correct way would then be to integrate to the end of both cycles regardless of their lengths and compare the integrals and not the averages [integral/length]. That would give you a measure of the ‘strength’ of the cycle as a whole.
And all that goes back to your Figure of the ‘anomalies’. since cycles have different lengths and the growth rates are different, you should not use a fixed number of months for every cycle. Simply compute the integral for the entire cycle for every cycle and plot that.
The SC 20 was much weaker from month 1 to month 86, the actual one. The strengh of a SC is not defined by the peak, it’s the SC-anomaly over the timespan of the whole SC. This is shown in the figure above.
http://kaltesonne.de/wp-content/uploads/2016/02/marv2-1024×609.jpg
Something went wrong with the picture, sorry!
Correct: The SC 24 IS much weaker than the SC 20! Some confusion here. 🙂
TSI variation over the course of a complete cycle is known to affect the amount of incoming TOA solar radiance. But its variance is quite small, it has to navigate the obstructions of our atmosphere, and doesn’t even show up on solar panels which do pick up the noise of our obstructing atmosphere.
http://www.pveducation.org/pvcdrom/properties-of-sunlight/solar-radiation-outside-earths-atmosphere
Pamela, the point here was NOT the impact of TSI on our atmosphere or climate. The point was: How strong/weak is the actual SC 24 vs. the SC b4., especially the SC 20.
@frankclimate
> The strength of a SC is not defined by the peak,
> it’s the SC-anomaly over the timespan of the whole SC.
I agree that the peak value is not the best estimate of the SC “strength”. But using the anomaly (difference between observed and expected values) seems to make even less sense. For example, if the values track the expected values perfectly then the anomaly (“strength”) would be zero. Anomalies measure the failure to track expectations. How is that meaningful? (Other than providing support for some pet theory)
A better measure of solar activity, IMHO, is the adjusted solar flux (10.7cm), which represents the intensity of solar magnetic activity and correlates very nicely to sunspot counts, but avoids the pitfalls in counting spots. So the mean value of this flux over time should provide a way of comparing the intensity of magnetic activity between various solar cycles.
Using the Penticton data here (http://www.spaceweather.ca/solarflux/sx-5-mavg-en.php) I computed the mean adjusted flux for the first 86 months of cycles 20 and 24, starting at 07/1964 and 12/2008 respectively…
sc20-meanflux = 124.9
sc24-meanflux = 109.6
… which is even closer than my eyeball estimate of 25sfu difference.
So I still think sc24 is not much different, in mean intensity, from sc20, and does not give much support to your cooling theories.
“SC24 [not SC25 as you claim] is only half of average” . You got it right and here was some confusion. 🙂 I corrected the typo SC24-SC25 b4. I hope it’s clear now. And I never made any claim about a (big) influence of SSN (TSI) on GMST.
I get 63%. The average of SC20 for the months 1-85 is SSNavg=106, for SC24 it’s SSNavg=66.6 with the latest data from here: http://www.sidc.be/silso/datafiles which I also used for the calculations of the figures.
“I hope that you are unlike like some others here who are immune to learning.”
I’m not immune, for sure! Anyway, I can’t see a failure to compare SC monthly up to now. I’ll reflect your arguments as I said b4.
I can’t see a failure to compare SC monthly up to now
If so, I have failed in the educational process. Perhaps upon some reflection you’ll see the light.
Regards
“I hope that you are unlike like some others here who are immune to learning.”
I’m not immune, for sure! Anyway, I can’t see a failure to compare SC monthly up to now. I’ll reflect your arguments as I said b4.
Johanus
“Let me correct a few erroneous assumptions floating around on this post.”
” First, the 11-year solar cycles are often said to depict “solar activity”. As if it had some direct relationship to solar radiated power. Actually it depicts the sun’s magnetic behavior, related directly to the solar dynamo”
Actually it depicts the movement of the sun’s polar field, if the suns polar field was at rest at the geographic poles and didn’t move, we wouldn’t be recording much activity including UV and x-rays thus effecting what “power” is recorded…
how’s that plan at correcting a few erroneous assumptions going?
Polar fields are magnetic entities. Exactly the point I was making. Yes, this activity enhances EUV and x-rays at times, but these are a minuscule part of the total EM power radiated by the sun, again the point I was making.
That was not your point, clearly, you didn’t mention “polar fields” or “magnetic entities” anywhere, your point was that “the 11-year solar cycles are often said to depict “solar activity”. As if it had some direct relationship to solar radiated power.” word for word… which is untrue/incorrect..
But that was my point. I clearly said: “Actually it depicts the sun’s magnetic behavior, related directly to the solar dynamo, which models the process which generates the sun’s magnetic field, not its thermonuclear power generation.”, which encompasses all of that magnetic stuff you mentioned.
The problem is that solar scientists tend to say “solar activity”, when they’re only talking about solar magnetic phenomena, such as sunspots. Since this kind of “solar activity” obviously changes a lot over the solar cycles, it often creates the false impression, to the uninformed lay public, that total solar power output is also automatically changing a lot.
I’m not saying that a link between solar magnetic activity and climate change can’t exist. Many more or less plausible theories have been proposed, but have not been widely accepted.
The suns polar field produces localized magnetic distortions when it’s polarities interact with each-other and short-out forming sunspots, increasing “power” output of UV and x-rays etc, there is a direct relationship of solar activity and “solar radiated power”.
You said “the 11-year solar cycles are often said to depict “solar activity”. As if it had some direct relationship to solar radiated power.”
What am I missing? you really did say there was no direct relationship between solar activity and solar related power…
Now you have said “I’m not saying that a link between solar magnetic activity and climate change can’t exist.”
What on earth do you think “solar magnetic activity” is?
*solar radiated power
@sparks
> What am I missing? you really did say there was
> no direct relationship between solar activity and solar related power…
I’m saying that “solar activity” (i.e. solar magnetic activity) is “independent” of total solar power output in the sense that virtually all solar power (99.9%) is generated by nuclear fusion in the core. So solar activity (i.e. magnetic activity) doesn’t generate solar power itself, but merely “modulates” this nuclear power output slightly, such that total solar irradiance (TSI) varies by 0.1%. That’s not enough to explain all of the warming/cooling entailed by “climate change”.
As Leif just pointed out in this post, that 0.1% modulation accounts for no more than 0.1C degree of “climate change”.
Since such a small change is not really observable, I don’t think we can say (yet) that “solar activity” has any real effect on solar irradiance to warm or cool the earth.
Yes, the enhanced EUV has an observable effect on the Earth’s upper atmosphere, enhancing ionospheric radio wave propagation. But still no widely accepted theories how this ends up as global warming/cooling.
Johanus
The interesting thing about total solar irradiance (TSI) is that when you lump a range of different spectral electromagnetic radiation together where much of it varies very little, such as in the intermediate wavelengths (visible region) and the long wavelengths (near infrared) the measured variation does not amount to very much measured over a unit area, in particular the shortest wavelengths which are in the Ultraviolet range vary a great deal more than both the intermediate wavelengths (visible region) and the longer wavelengths (near infrared) almost to ‘the tune of’ 100% from solar minimum to solar maximum, x-rays are not even measured as part of TSI and x-rays also vary from solar minimum to solar maximum to ‘the tune of’ almost 100%, and also take note that the power of electromagnetic radiation in the shortest wavelengths swamps the power of both the intermediate wavelengths (visible region) and the long wavelengths (near infrared). The variability of both UV and X-ray per unit area (which I’ve pointed out many times) is huge compared to that of the visible range and the near infrared.
UV and X-ray being more energetic in shortest wavelengths have a lot more power, they also have different properties than the intermediate wavelengths and the longer wavelengths, for example UV is absorbed by by snow and ice which any first grader knows by simply holding a UV light (black light) over snow and it penetrates deeper into the oceans where as the visible range and the near infrared is reflected by snow and ice clouds etc… UV and X-ray radiation is radiant for a longer time much more than visible and near infrared,
basic points are;
The power range of variability in watts per meter square of UV and X-ray in the more energetic shorter wavelengths is greater than the range of variability of visible and near infrared. .
TSI and it’s measured range of variability, flooded in the visible and near infrared is a very poor argument for suggesting the sun has very little variability. (in fact this TSI measurement is used in both ignorance and dishonesty for the intention of giving the impression that energy from the sun reaching the earth is a near constant, for obvious reasons).
Shorter more energetic wavelengths with the greatest variability between a solar minimum and solar maximum are absorbed by snow and ice.
This gives 66% ( month 30 to 75). I don’t know why it’s a mistake to solve this integral from the start of the cyle on instead to use a arbitraraly date. You argue that a weak SC starts weak and a strong SC strong. That’s why the values from the timespan around the max. don’t differ much from the values when one uses the data from month one on for the integration. This illustrates good that the estimation of Waldmeier is right.
My “homegrown way” is the classic way to calculate a product ( SSN*time) from a function over time. It’s not “my way” ( or Frank Sinatras 🙂 ).
Big pet peeve:
Effect: noun
Affect: verb.
Please type accordingly.
[Reply: Look up ‘Sisyphus’. -mod.]
isvalgaard: In the figure ( comparison SC24 with the average SSN SC1…23 and SC20) you don’t see that the activity of the SC 20 war very near the average and SC25 has so far only 56% activity of the average of the monthly SSN? I do. I also calculated it…
Johanus: The anomaly is the difference between the measured monthly SSN and the average of the monthly SSN of SC 1…23 of the correspondend month of the SC. It’s so difficult? And: I never claimed a link between SSN and GMST or a “SSN-Thermometer”. Your argumentation has something of “Beat the strawman!” .
“and SC25 has so far only 56% activity of the average of the monthly SSN?” please read: “SC24”! I was ahead of time 😀
you don’t see that the activity of the SC 20 war very near the average and SC25 has so far only 56% activity of the average of the monthly SSN? I do.
You are very confused. SC20 was average, SC24 [not SC25 as you claim] is only half of average, yet you claim that SC20 was weaker than SC24. That is what you say you do. Try again.
isvalgaard: “SC24 [not SC25 as you claim] is only half of average” . You got it right and here was some confusion. 🙂 I corrected the typo SC24-SC25 b4. I hope it’s clear now. And I never made any claim about a (big) influence of SSN (TSI) on GMST.
You also claimed that SC20 was much weaker than SC24, so more confusion.
“You also claimed that SC20 was much weaker than SC24, so more confusion.”
My figure ( and calculation) says it right: SC24 so far was much weaker than SC20. Okay?
Then why do [did?] you claim the opposite?
“Then why do [did?] you claim the opposite?”
You got it right: some verbal confusion. Both of my figures:
http://up.picr.de/24583592ua.gif
http://kaltesonne.de/wp-content/uploads/2016/02/marv2-1024×609.jpg
show it clearly!
But that was never in doubt in the first place [everybody knew that]. So what was your point?
I contradicted Johanus who claimed, that SC24 was not much weaker than SC20. http://wattsupwiththat.com/2016/02/11/solar-cycle-24-activity-continues-to-be-lowest-in-nearly-200-years/comment-page-1/#comment-2144043 . It was much because only 55% of the activity of the SC20. This is much as one can see in the SSN-anomaly also in relation to the other SC.
Actually SC24 is 75% of SC20. Get your numbers right: http://www.sidc.be/silso/DATA/SN_y_tot_V2.0.txt
I get around 63%. The average of SC20 for the months 1-86 is SSNavg=106, for SC24 it’s SSNavg=66.6 with the latest data from here: http://www.sidc.be/silso/datafiles which I also used for the calculations of the figures.
Ahh, I see…you took annual data… for monthly anomalies I used monthly data.
using monthly data on an 11-year cycle makes no sense at all. And if you do use monthly data SC24 [so far] is 81% of SC20. So, get your numbers right.
As long as one uses the same periode for all SC I can’t follow your argument that monthly data “make no sense at all”. The SC20 started in 10/1964 and the average of the monthly SSN until month 86 is 106. The same for SC24 (started in 12/2008) gives 66.6. So I can’t replicate your 81% which is also unlikely if one compares the SC visualy in the figure above.
The maximum monthly data was 192.3 for 1969/03 and 146.1 for 2014/02, thus 81%.
But monthly data is like weather vs. climate. And you cannot just use the same number of months in different cycles as cycles have different lengths.
One can use the monthly smoothed value [which is actually a 1-yr sliding mean] for visual confirmation, Here are the cycles for your visual inspection:
http://www.sidc.be/images/wolfmms.png
The smoothed maxima were 156.6 for SC 20 and 116.4 for SC24 (=74%).
Get your numbers right.
The SC20 started in 10/1964 and the average of the monthly SSN until month 86 is 106.
So, you actually did not use monthly values for the maxima.
“The maximum monthly data was 192.3 for 1969/03 and 146.1 for 2014/02, thus 81%.
But monthly data is like weather vs. climate.”
So you agree that the SSN- average over all months of the SC (as I used it) is a better value for SC “climate” than your comparison of single maximum- months which is more SC”weather”.
“And you cannot just use the same number of months in different cycles as cycles have different lengths”
This could make a bias in the end of the cycles, untill month 86 this is not the case. The shortest Cycle was SC2 with 106 months. SC20: 139.
So you agree that the SSN- average over all months of the SC (as I used it) is a better value for SC “climate” than your comparison of single maximum- months which is more SC”weather”.
What I pointed out was that when you said that you used monthly values to assess the size of the cycle, you did actually not. I just showed that you did not use a monthly value as the size. Now, you confess that you used the average of all the data for 86 months [and for the average it makes no difference if you use daily values or monthly values].
This could make a bias in the end of the cycles, untill month 86 this is not the case.
Very, very wrong. Large cycles rise much faster than small cycles, so the values at the start of the cycle are the ones that make the bias. It makes no sense to use the same number of months at the beginning of the cycle as a measure of the size of the cycle. The values to use are the yearly of smoothed monthly maxima, or the average of all the data in the whole cycle. What you do is simply not correct.
“So, you actually did not use monthly values for the maxima.”
Of course I did.
“The smoothed maxima were 156.6 for SC 20 and 116.4 for SC24 (=74%).
I don’t think that a comparison of maxima is the solution because the “lulls” ( periods with much less activity than normal) also influence the strength of a SC. And my numbers are right! You don’t need to repeat anymore. You compare the maxima of the SC and I compare the monthly average of the SSN. I think my way has more meaning. Maybe you agree.
I compare the monthly average of the SSN. I think my way has more meaning. Maybe you agree.
No, you compare the average SSN over 86 months [or days as the monthly means are just the average of the daily values]. And your way does not make sense as different cycles rise to their maxima in different ways [small cycles slowly, large cycles faster].
“No, you compare the average SSN over 86 months [or days as the monthly means are just the average of the daily values]. And your way does not make sense as different cycles rise to their maxima in different ways [small cycles slowly, large cycles faster].”
1st: I never would write: “And your way does not make sense as…” without an “IMO” or so, it’s a question of courtesy.
2nd: The comparison of monthly SSN and averages also reflects the fact that different cycles rise to their maxima in differnet ways. For the wanted weighting of different SC it should be an advantage. And yes: with the release of the monthly SSN for 02/16 I’ll compare over 87 months and I’ll write: The SC24 has SO FAR x% activity vs. the average. What is wrong with it?
3rd: daily values: This makes really no sense for a 11y- cycle. Anyway, it would not change the picture as a whole.
Facts do not need an IMO.
And what is objectively wrong with your scheme is that since different cycles rise at different rates, comparing the same number of months at the beginning of the cycles does not give you a true value of the size of the cycle. Cycle 24 is likely to be a bit longer than cycle 20, so what would you do when you run out of months for SC20 but there are still some coming for SC24? Again: it does not make sense to compare cycles using the same number of months.
3rd: daily values: This makes really no sense for a 11y- cycle.
The average of the first 86 monthly values is the same as the average of the first 2627 days as each monthly average is the average of the [on average 30.5] daily values.
“Very, very wrong. Large cycles rise much faster than small cycles, so the values at the start of the cycle are the ones that make the bias.”
Why do (large) SSN- values at the start ( of large Cycles) make a bias? They are an early hint? When you only compare the max. of the cycles you don’t include the development over the time and this is a failure in my eyes. Anyway, I’ll reflect your arguments. Hopfully you also mines, I’m afraid our ping-pong is too fast. 🙂
best
Frank
Waldmeier showed long ago that the development of the whole cycle is given by the maximum value. Check out the Figure on slide 3 of http://www.leif.org/research/The-Waldmeier-Effect.pdf to see how the maximum shifts to later and later the smaller the cycle is. This shift must be taken into account when comparing cycles, and that is why your scheme fails.
Finally you have two arguments when I see it correct::
1st: the circle ends “to late” and there are no more data for comparison.
The SSN-values at the end of a SC are very small compared to the earlier stages. A few months can’t change the picture.
2nd: “… how the maximum shifts to later and later the smaller the cycle is. This shift must be taken into account when comparing cycles, and that is why your scheme fails.”
With the monthly “tact” I take this into account and I can’t see that my scheme fails. The “time-delay” of a small SC is NOT reflected wirh YOUR method, comparing the max. in amplitude.
Waldmeier showed that the cycles follow a one-parameter family of curves determined only by the maximum value, so the one number that is important for the size and shape of the cycle is the maximum value, which falls later and later, the smaller the cycle is, and hence cannot [and should not] be got from comparing at a fixed number of months into the cycle. I am not arguing here, just try to educate.
We should stop at this point because I see some kind of selecitve cognition when you cite me uncompletely and with some intention when you write:
“3rd: daily values: This makes really no sense for a 11y- cycle.
The average of the first 86 monthly values is the same as the average of the first 2627 days as each monthly average is the average of the [on average 30.5] daily values.”
This is below your level because the complete cititation of mine would be:
” Anyway, it would not change the picture as a whole.”
There is no use to show me, that an average over a defined time is not changed when using different resolutuions. It’s not fair play! Why?
Well, you tried to be funny with
“3rd: daily values: This makes really no sense for a 11y- cycle.”
But, if you now disavow this one, I’ll let is pass.
As I said, I’m not arguing, but [hopefully] just educating. I hope that you are unlike like some others here who are immune to learning.
“I hope that you are unlike like some others here who are immune to learning.”
I’m not immune, for sure! Anyway, I can’t see a failure to compare SC monthly up to now. I’ll reflect your arguments as I said b4.
Leif, as announced I reflected your arguments and I want to make this approch:
http://up.picr.de/24603216wr.jpg
When you want to have a measure of the strength it’s not very useful to take the maximums, you calculate a rectangle in the figure above. A better value would be the area under the curve or the definite Integral from montht1 to the month n of the SC’s from the function of SSN against time. When you solve this ( mothly running addition from month1 to month 86 up to now) you get for SC 24 63% of the strength of SC20, that’s my result from yesterday. Sorry.
And you should be sorry. Your mistake is to start at 1. If you want to use your homegrown way, then calculate the average from [say] 30 to 75. This is a crude way of estimating some sort of average maximum for the cycle. Try that, and report back with the result.
This gives 66% ( month 30 to 75). I don’t know why it’s a mistake to solve this integral from the start of the cyle on instead to use a arbitraraly date. You argue that a weak SC starts weak and a strong SC strong. That’s why the values from the timespan around the max. don’t differ much from the values when one uses the data from month one on for the integration. This illustrates good that the estimation of Waldmeier is right.
My “homegrown way” is the classic way to calculate a product ( SSN*time) from a function over time. It’s not “my way” ( or Frank Sinatras 🙂
best, Frank
I calculated all integrals from above for all moths and SC’s and the integrals of the risetime of the SC reflect very well the “Waldmeier-behavior” ( “The Waldmeier Effect is the observation that the rise time of a sunspot cycle varies inversely with the cycle amplitude: strong cycles rise to their maximum faster than weak cycles.” from your source). The R² ( lin. Regression) of the integrals from the rise-time months to the SSNmax (13 month smoothed monthly SSN):
http://up.picr.de/24611325kn.jpg
A “forecast” of the SSmax with the help of the integrals to month 30 with linear Regression:
http://up.picr.de/24611345vd.jpg
In red the measured data, in black the failure for every SC.
best
Frank
Not to nit pick, but aren’t you referring to SC20 in the graph above?
There is a conviction among a certain section of AGW sceptics that solar activity can explain 20th century climate fluctuations. I reckon this conviction could ultimately prove to be very damaging to the sceptic argument. If we have reduced activity but increasing temperatures (as I think is more likely over the longer term) then the solar explanation is a bust. Then what? Move the goalposts? Pull another “lagged response time” out of the hat?
Far better we accept there is another explanation for increasing temperatures and that CO2, if not the whole story, is almost certainly a contributory factor. But the warming isn’t anything like the warming expected for high sensitivity and is not likely to be a major problem. That’s the argument that people like Lindzen, Spencer, Jack Barrett and others are making but the they’re being drowned out by solar-driven cooling nonsense which, unfortunately, is what grabs the tabloid press headlines.
The real argument is not about Cooling v Warming. That argument is lost. It’s about harmful Warming v beneficial Warming.
Co2 is not a source of energy, it’s not even a factor on a planetary scale being a trace gas, maybe it’s Cagw sceptic like you pushing nonsense in an attempt to sound reasonable (which you do not) is where the issue lays… according to alarmists the debate is over so why bother blaming sceptics of activity researching alternatives to all this CO2 driven nonsense!!
Co2 is not a source of energy,
who said it was? However emission spectra plots for space show that CO2 does impede the outgoing flow of energy from the earth’s surface particularly in the higher colder regions of the troposphere. As CO2 increases in concentration absorption and, more importantly, emission is likely to occur at .higher altitudes meaning the rate of emission will decrease (S-B Law), i.e. incoming solar energy will be greater than outgoing LWIR energy -> Warming
“plots for space” should be “plots from space”
Anthony:
One big reason the sun appears spot-free is that the AIA 4500 (white light band) instrument is failing.
The SDO folks have taken it off their image table of contents but still generate so we still see it. http://sdoisgo.blogspot.com/2013/12/sdo-is-almost-four-years-old-and-our.html says:
The best replacement for this image may be the HMIIC image, the small one is:
http://sdo.gsfc.nasa.gov/assets/img/latest/latest_512_HMIIC.jpg
See http://sdo.gsfc.nasa.gov/data/ for the full set.
The HMI observes at 617.3 nm, which is in the visible range, the yellow tone of the image is just to make it look close to what we’d see through a telescope. I assume the spectral line is for an emission line useful in determining the magnetic field, I don’t know if the contrast of the image is tweaked to be close to what we see or is adjusted to make the umbra/penumbra stand out better. Perhaps they try to match the AIA 4500 image of its better days.
Absorption line, not emission line. No tweaking of any kind [except for the color]
Oops, thanks for the catch and info.
There need not be much discussion of this, as solar activity since 1900 is well observed. Here is the variation of the number of sunspot groups since Cycle 14:
http://www.leif.org/research/GN-Since-1900.png
See http://www.leif.org/research/Reconstruction-of-Group-Number-1610-2015.pdf for details.
Figure 36 shows activity since 1610.
The correspondence between contrived global temperature variation and solar cycles is impressive.
That would be ‘doctored global temperature anomaly variation’… I would be surprised if any thought process went into that graph…
Nonsense. Temperatures go up, up, and up, and solar activity since the middle of the 20th century goes down down, and down.
Leif,
a squiggly line went up, up, and up in a doctored untrustworthy anomaly slapped over a sunspot record, with no sense of boundaries or relative scale… defend it all you like, seasonal temperatures on the other hand, on regional basis are clearly influenced by solar activity,
Even having a global anomaly such as satellites only proves that having active solar cycles warm the earth, when we don’t have active solar cycles it will prove having no activity will cool the earth.
on regional basis are clearly influenced by solar activity
As I always have maintained, YES. To the tune of 0.1 degree.
I remember you saying, it’s an interesting figure, is 0.1 degree the average difference between solar maximum and solar minimum? what would the average rate of losing 0.1 degree be for a period of 5 years or 10 years at solar minimum?
It seems like a lot.
We don’t ‘lose a lot’. That is not how the weather/climate works. The 0.1 Degree is the resulting total variation over the whole cycle.
A contrivance is “a thing that is created skillfully and inventively to serve a particular purpose.” Doctoring is a contrivance with a secondary meaning of “treat medically,” which is inappropriate.
verdeviewer,
“Doctoring” in this context means to change the content or appearance of (a document or picture) in order to deceive; falsify… there is no secondary meaning that is inappropriate, you made that up as an insult (or again for context, which you’re really bad at) ad hominem (of an argument or reaction) directed against a person rather than the position they are maintaining..
verdeviewer says:
“BTW, the the temperature part of the graph is plotted using the current version of NOAA’s dataset from”
Yeah it’s still a doctored untrustworthy anomaly slapped over a sunspot record, with no sense of boundaries or relative scale… 😉 it’s just my opinion but you should run with that graph.
Sparks, global temperatures are in no small part contrived, not just doctored, and, unless you’re just trying to live up to your moniker, I haven’t a clue why my response to your unfounded criticism of my graph and comment inspired such an inflammatory outburst.
A graph of global temperature anomalies from 1900 to 2015 doesn’t need a vertical scale to show a dubious relationship to a graph of solar cycles in the same time frame. I don’t feel I need to apologize for slapping one atop the other, however little thought process was involved.
A graph of global temperature anomalies from 1900 to 2015 doesn’t need a vertical scale to show a dubious relationship to a graph of solar cycles in the same time frame
You claimed that the agreement was ‘impressive’. I would say it is lousy, but people see what they want to see, so if you think the agreement is impressive, stay happy in your belief.
I continue to think the correspondence is impressively lousy, but will refrain from future facetiousness.
You claimed the agreement was ‘impressive’. Not lousy.
“You claimed the agreement was ‘impressive’. Not lousy.”
That’s true. Not lousy, just so inapparent that I mistakenly assumed no reader would take my comment literally and thus did not understand the response.
No one asked “where’s the correspondence?”–which is probably a good thing as I might have replied with “See those little temperature bumps at the peaks of cycles 14, 20, and 22?”
I mistakenly assumed no reader would take my comment literally
There is so much junk, pseudo-science, and silliness posted here that it is hard to separate the wheat from the chaff. So, your lesson here is to say what you mean or else mark it as junk, sarcasm, or the like [e.g. with /sarc].
BTW, the the temperature part of the graph is plotted using the current version of NOAA’s dataset from
http://www.ncdc.noaa.gov/cag/time-series/global
verdeviewer,
“Doctoring” in this context means to change the content or appearance of (a document or picture) in order to deceive; falsify… there is no secondary meaning that is inappropriate, you made that up as an insult (or again for context, which you’re really bad at) ad hominem (of an argument or reaction) directed against a person rather than the position they are maintaining..
verdeviewer says:
“BTW, the the temperature part of the graph is plotted using the current version of NOAA’s dataset from…”
Yeah it’s still a doctored untrustworthy anomaly slapped over a sunspot record, with no sense of boundaries or relative scale… 😉
I think if we had better reporting of on actual tropics temperature everyone would see what latitudes we are in currently with the solar cycle’s effect. Their weather models might even work then. As far as it remains they are inputting trash numbers into their models so they are receiving trash out. The Earth itself imo has not seen typical zonal management of temperature due exclusively to the current solar cycle. And why the current “godzilla nino” is actually a gecko.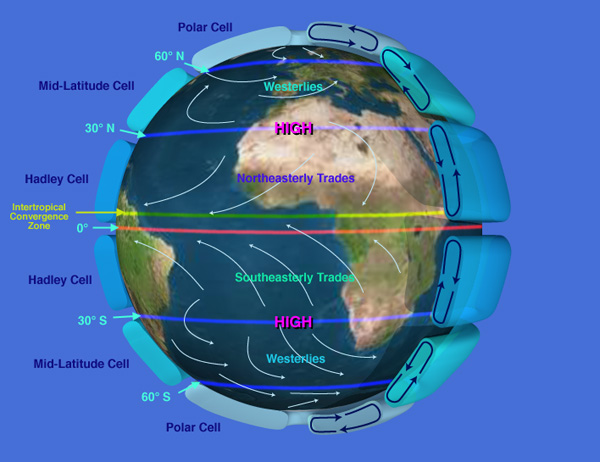
Temperatures are not going up, up, up anywhere, its just mixed into the atmosphere by way of dipping jet stream’s conveyor belt. The tropics are cool as a cucumber.
The graph ?w=700
showed otherwise…
Sure, there’s gotta be hot spots over 115F every other day in the tropics relatively speaking, i mean if we pasted that chart to our frontal lobes.
Thanks for the laugh Leif, the anomaly on that graph may as well be a flat line and the error bars would cover the chart top to bottom!
If my graph inspired laughter then it was not contrived in vain.
Soon, the shield may be clean.
http://sdo.gsfc.nasa.gov/assets/img/latest/latest_1024_HMIBC.jpg
It has been interesting to read this blog and the characters who comment here. Thank you all. Most of you seem to come to the same collusion. That’s its really hard to predict the future. I always wondered how measuring temperature, something that is in constant change, could provide any meaningful conclusions. Than I started thinking about all the things that could affect temperature. Then I started thinking about all the things main stream scientists have been wrong about in the past. Than I think about the gatekeepers as economist Thomas DiLorenzo calls them. Those that seem to be intentionally covering up or misleading others. It appears that poor government social policies is often the common denominator. Yet there continues to be those who think they can socially engineer society. If they would understand that the more ones thinks, the more one realizing how little they know and understand.
Then I started thinking about all the things main stream scientists have been wrong about in the past
Which is vastly less than all the things the crackpots and pseudo-scientists and the like have been [and still are] wrong about.
O sol é um vulcão. Adilson nagamine. Brasil
[The sun is a volcano. Adilson Nagamine. Brazil
?? Are you sure you expected it to translate that way?
Tem certeza de que esperava que traduzir esse caminho? .mod]
Something, not sure what, is really putting the kibosh in El Nino. California is facing dim prospects in the precipitation department. Feb is shaping up to be a bust and now people are whistling past the graveyard uttering “well there can still be a March miracle.” We’ll see about that.
The only question remaining in the global warming debate is how much case we’re going to blow, and how much wealth creation we will forego, to have zero discernible impact upon the climate.
http://wattsupwiththat.com/reference-pages/solar/ has been updated to display the HMI visible light image
instead of the AIA 4500 image shown at the top of this post. The damage to that instrument is severe enough
so that the SDO pages don’t refer to it, though it is still in their daily archives.