Ten killer questions that expose how wrong and ideologically driven they are

by Christopher Monckton of Brenchley, Willie Soon and David R. Legates
A century or so from now, based on current trends, today’s concentration of carbon dioxide in the air will have doubled. How much warming will that cause? The official prediction, 1.5-4.5 degrees Celsius (2.7-8.1 degrees Fahrenheit) per doubling of CO2, is proving a substantial exaggeration.
Professor William Happer of Princeton, one of the world’s foremost physicists, says computer models of climate rely on the assumption that CO2’s direct warming effect is about a factor of two higher than what is actually happening in the real world. This is due to incorrect representations of the microphysical interactions of CO2 molecules with other infrared photons.
As if that were not bad enough, the official story is that feedbacks triggered by direct warming roughly triple the warming, causing not 1 but 3 degrees of warming per CO2 doubling. Here, too, the official story is a significant exaggeration, as demonstrated by Professor Richard Lindzen of MIT, perhaps the world’s most knowledgeable climatologist.
The wild exaggerations of both the direct CO2 warming and the supposedly more serious add-on warming are rooted in an untruth: the falsehood that scientists know enough about how clouds form, how thunderstorms work, how air and ocean currents flow, how ice sheets behave, how soot in the air behaves.
In truth, we do not understand climate enough to make even an uneducated guess about how much global warming our adding CO2 to the air will cause. Other things being equal, we will cause some warming, but – based on actual measurements to date – not much.
The national science academies and the UN’s climate panel have profitably contrived what the late Stephen Schneider called “scary scenarios,” based on inadequate knowledge coupled with ideological bias. Etatiste (government empowered or paid) politicians and bureaucrats have gone along with them.
A quarter-century has passed since the panel first predicted how fast the world would warm. Measurements since then show the predictions were much overblown. But don’t take it from us.
Ask any climatologist the following ten killer questions.
1: What is the source of the warming that surface thermometer datasets now say has occurred in the past 18 years?
The official (simplified) theory is that photons interacting with CO2 molecules in the upper air give off heat that warms that air, which in turn warms the lower air, which warms Earth’s surface.
Yet the two satellite datasets show no global warming of the lower air for almost 19 of the 21 years of annual UN global-warming conferences. Even if CO2 had warmed the upper air as predicted (and the satellites show it has not), that warming could not have reached the surface through lower air that has not warmed. Therefore, if the surface has warmed in the past couple of decades, as the surface datasets now pretend, CO2 cannot have been the cause.
In 2006 the late Professor Robert Carter, a down-to-earth geologist who considered global warming a non-problem, wrote in Britain’s Daily Telegraph that in the eight full years 1998-2005 the Hadley Centre’s global temperature dataset showed no global warming at all.
Since then, that dataset (and all the other surface datasets) was recently adjusted upward to create global warming that actual measurements did not show. The Hadley data now indicate a warming trend over those same eight years, equivalent to more than 1.5 degrees C (2.7 degrees F) per century.
2: Why, just two years ago, did every surface temperature dataset agree with the satellites that there had been no global warming so far in this century? And why was every surface dataset altered in the two years preceding the Paris climate conference – in a manner calculated to show significant warming – even though the satellite records continue to show little or no warming?
3: Why do all the datasets, surface as well as satellite, show a lot less warming than predicted? Why has the rate of warming over the past quarter century been only one-third to one-half of the average prediction made by the UN’s climate panel in its 1990 First Assessment Report, even after the numerous questionable adjustments to the surface temperature datasets?
Figure 1.

The startling temperature clock (Figure 1) shows the UN panel’s 1990 predictions as orange and red zones meeting at the red needle that represents the IPCC’s then average prediction that by now there should have been global warming equivalent to 2.8 degrees C (4.9 degrees F) per century.
But the blue needles, representing the warming reported by the three much-manipulated surface temperature datasets, show little more than half that warming. The green needles, representing the satellite datasets, show only a third of what the UN had predicted with “substantial confidence” in 1990.
4: Why is the gap between official over-prediction and observed reality getting wider?
An updated temperature clock (Figure 2) shows the global warming that the UN’s panel predicted in its 2001 Third Assessment Report, compared with measured warming from then until 2015. The measured warming rate, represented by the green zone, is manifestly less than the warming rate since 1990, even though CO2 concentration has risen throughout this time.
Figure 2

5: Why is the gap widening between warming rates measured by satellite and by surface datasets?
It is legitimate to infer that the surface datasets have been altered to try to bring the reported warming closer to the failed but (for now) still profitable predictions. (That is, the altered datasets still bring profits in the form of money, fame and power to the failed prophets of climate doom.)
6: Why should anyone invest trillions of dollars – to replace fossil fuels with expensive renewable energy – on the basis of official predictions in 1990 and 2001 that differ so greatly from reality?
Plainly, this is not the “settled science” we were told it was.
7: Why has the observed rate of warming, on all datasets, been tumbling for decades notwithstanding predictions that it would at least remain stable?
One-third of all mankind’s supposed warming influence on the climate since 1750 has occurred since the late 1990s, and yet satellites show scarcely a flicker of global warming in almost 19 years.
Likewise, the strength and frequency of hurricanes, tornadoes, floods and droughts – and the rate of sea level rise – are still completely within the realm of natural variability and human experience, even though atmospheric CO2 levels have increased noticeably in recent decades. And that extra carbon dioxide is fertilizing plants, making crops and forests grow faster and better, and “greening” the Earth.
Not only the amount but also the pattern of warming fails to match predictions. To the nearest tenth of one per cent, there is no CO2 in the air. (400 ppm is only 0.04% of the atmosphere.) Yet the UN’s panel said in 2007 that carbon dioxide would warm the upper air six miles above the tropical surface at twice or thrice the surface rate.
That tropical mid-troposphere “hot-spot” (one of us gave it its name) was supposed to be the undeniable fingerprint of manmade global warming. Its existence would prove manmade warming.
8: So, where is the tropical upper-air hot-spot?
Satellites do not show it. Millions of measurements taken by balloon-borne radiosondes do not show it. It is missing. If warming is manmade, there should be a distinct difference between measured surface and upper-air warming rates. It has not been there, for decades.
Similarly, just as official predictions claim CO2-driven warming will be greatest in the upper air, which will in turn warm Earth’s surface, so they also claim that the near-surface air will warm the ocean surface, which will warm the deep oceans – and that is where the global warming has been “hiding.”
Yet measurements from more than 3,600 automated buoys throughout the ocean (that dive down a mile and a quarter and take detailed temperature and salinity profiles every ten days) show that the deeper strata are warming faster than the near-surface strata.
9: Why, if CO2-driven warming ought to warm the surface ocean first, is the ocean warming from below? And why has the ocean been warming throughout the eleven full years of the ARGO dataset at a rate equivalent to only 1 degree every 430 years?
As NASA thermal engineer Hal Doiron bluntly puts it: “When I look at the ocean, I see one of the largest heat-sinks in the solar system. While the ocean endures, there can’t be much manmade global warming.” And he had to get his heat calculations right or astronauts died.
Believers have silenced serious and legitimate scientific questions such as these, by unleashing an organized, well-funded, remarkably vicious campaign of personal vilification against anyone who dares to ask any question, however polite or justifiable, about the Party Line. Most scientists, politicians and journalists have learned that they will have a much quieter life if they just drift along with what most scientists privately concede is sheer exaggeration.
Believers also insist there is a “consensus” that manmade global warming is likely to prove dangerous.
10: Given that the authors of the largest-ever survey of peer-reviewed opinion in learned papers found that only 64 of 11,944 papers (0.5% of the total) actually said their authors agreed with the official “consensus” proposition that recent warming was mostly manmade – on what rational, evidence-based, scientific ground is it daily asserted that “97% of scientists” believe recent global warming is not only manmade but dangerous?
The “97% consensus” is a pure fabrication, used to justify harmful and even lethal public policies.
Millions die worldwide every year because they do not have cheap, clean, continuous, low-tech, coal-fired electricity, to replace the wood, grass and animal dung fires they must use to cook their food and heat their homes. Given the growing and flagrant discrepancies between prediction and observation that we have revealed here for the first time, the moral case for defunding the profiteers of climate doom and redeploying the money to give coal-fired light and heat to the world’s poorest people is overwhelming.
We are killing millions of parents and children today, based on a scientifically baseless goal of saving thousands who are not at risk “the day after tomorrow.”
____________
Christopher Monckton was an expert reviewer for the Fifth Assessment Report (2013) of the UN’s climate panel, the IPCC. Willie Soon is a solar physicist and climate scientist in Cambridge, Massachusetts, USA. David Legates, PhD, CCM, is a Professor of Climatology at the University of Delaware in Newark, Delaware.
It’a all “An Inconvenient Goof” ?
MIT and Caltech just made an announcement (10:30 EST) of the first direct detection of Gravity Waves.
Supposably Einstein’s predictions of their behavior are confirmed.
G
Hundert Autoren gegen Einstein (A Hundred Authors Against Einstein), published in 1931. When Einstein was a skeptic against the 99%.
A few more questions:
11. The global warming alarmists, including the IPCC, have a negative predictive track record, since every one of their scary predictions has failed to materialize.
– So why does anyone listen to these misguided fanatics?
12. Atmospheric CO2 lags temperature at all measured time scales, from ~9 months in the modern data record to ~800 years in the ice core record on a longer time scale.
– If atmospheric CO2 is the primary driver of global temperatures as the IPCC alleges, how does the future cause the past?
13. The Excess Winter Mortality Rate equals about 100,000 deaths per year in the USA, up to 50,000 in the UK and several million worldwide, even in warm climates.
– If global warming is such a threat, why is there a huge Excess Winter Mortality Rate, but NO significant Excess Summer Mortality Rate?
14. The global warming alarmists falsely predicted millions of refugees and deaths caused by global warming.
– So where are these alleged victims of global warming?
15. The global warming alarmists say they want to shut down energy production from fossil fuels and move to “green energy” schemes like wind power. Trillions of dollars have been squandered on green energy schemes that are not green and provide little useful energy.
– So why do we keep subsidizing these useless green energy scams?
Regards to all, Allan
Mr McRae’s questions are excellent.
Well said….and may I add to it: Why are politics driving a failed science hypothesis?
Don’t mess with the party policy. !!
markl at 8:22 pm said
… Why are politics driving a failed science hypothesis?
Global Warming/Climate Change politics will damage the economies which is the desired effect. Why? Because it will create more and more people dependent on government handouts. And those people will vote for governments that supply those handouts. The tipping point will occur when they become numerous enough to significantly affect elections.
In the US, almost 50% of citizens pay nothing in income taxes. The tipping point is here.
Because without global warming, there can not be a case made that sovereign nations can’t deal with “global problems.” Such problems REQUIRE a WORLD Government able to dictate at will what is needed to save mankind AND the planet from mankind. IPCC was intended to show that the UN needed to be a GOVERNMENT, not just an organization where nations attempted to settle problems between themselves. It needed to be the ONLY SOVEREIGN government in order to deal with global warming. If you can’t see that, then you are probably unable to be reached by any means. There has been no agenda prior to “cooking the world” where such a basic change could be forced on the people of the planet. Not even the potential of nuclear war has come close to creating a world government. This is not now nor ever has been about anything but the creation of the ultimate dictatorial government. Every COP() is about taking power from the nations and giving it to the UN, and it appears to be working too well, as little by little, those that want to give away the farm are succeeding.
Tom O – Agree. A centuries-old banking cabal stood on the cusp of cornering the world’s resources this century until the Internet rolled boulders onto their yellow brick road.
Their financial resources (estimated at two-thirds of the planet’s wealth) originated from wars financed (both sides, with first choice at the loser’s spoils) with high interest usury, and by the lending of fiat (paper money) operating loans (that their central banks in each nation printed for the cost of paper, ink, and press-time) to nations with similar high interest.
These paper money ‘loans’ required hard asset collateral from countries receiving them. The bankers generously carried their notes until nations could no longer pay interest on their ‘loans’ with their taxes; at which time the bankers began foreclosing on the countries’ government-owned hard assets—gold, silver, land, food, fiber, oil, gas, water, minerals, industry, information, jobs, people and hope; 21st century carpetbaggers picking up earth’s assets for pennies on the dollar; their end game being to own it all for themselves and with themselves in charge of their private planet and their UN (which they also own) version of a Bolshevikian World government that they dry-ran in Russia circa 1917-1944 (leaving some 140 million [+] dead by one count), a “manageable planet population” of about a billion (they’re eugenicists) , and their own version of Hunger Games for entertainment.
A bankrupt nation with no assets to trade, make things from, or pay an Army is a non-nation.
Global warming was to have been the bankers agreed upon cover to establish a world ‘carbon tax’ on each nation, payable annually to the UN; with which they planned to build their world government’s bureaucratic administrative base.
The U.S. was a major legal stumbling block for them, in that the constitution (well written) and its established case law was difficult for them to cast aside. So they had legislation drafted that ‘authorized’ the EPA during the 1970’s, and had congress to pass it. The EPA became the spring board from which they and their bureaucratic agency could draft administrative rules and regulations under the color of “Administrative Law” that carried with it large fines and/or imprisonment if they were not followed or ‘broken’; thus enabling them to by-pass congress and the Constitution.
The Internet’s outing of their global warming scheme seems to have forced them into a two-minute drill for which they weren’t prepared.
Couldn’t have happened to a nicer group.
Follow the money. The insurance conglomerates and big oil win big time.
How does “big oil” win when it is one of the entities the warmistas are trying to shut down and put out of business?
Think you’ll find mate that if Big Oil thought it was actually worthwhile they would buy into windfarms and solar generation big time (they are in the business of supplying energy, so why wouldn’t they get into something if they thought it was a viable money maker?). Answer, they have to protect their shareholders
money, and investing in poor quality energy sources does not do that..
In 40 years time I am afraid you’ll find that Oil/Coal are still supplying the bulk of energy, wind and solar
will still only be supplying 4~5% of the world energy market.
You see reality alwasy wins over anything else. So I’ll be backing Reality to win this time too.
cheers and have a good weekend
Jim
Chadee,
Make up your mind, the left claim that big oil hid the “fact” of global warming, now you claim they win? What is the next lie you will try to peddle?
Jim,
You are correct the large energy companies have looked at the economics of everything from batteries, solar, wind, to biofuels and based on sound technology and economics have decided not to risk their stockholders money on something that does not make sense. One thing they miss is stupid government subsidies probably because they know they would not be eligible. They are interested in making $$ and are not married to oil.
Trust me, I know they have invested a lot in research with the best scientists and engineers not the government hacks.
Both BP and Shell spent a lot on alternative fuels and cancelled before it caused huge losses. Even Exxon tried algae and stopped to cut losses.
“Etatiste” should be “Étatiste” according to the Académie française and also the Imprimerie nationale (the ones who used to print the francs):
http://www.academie-francaise.fr/la-langue-francaise/questions-de-langue#5_strong-em-accentuation-des-majuscules-em-strong
The accents are part of the spelling of a word. A word without an accent, or the wrong accent (like é instead of ê) is a spelling error. Another spelling error is an accent where none should exist, as for example in “Academié des Sciences, France” in the Joint science academies’ statement: Global response to climate change
http://www.nationalacademies.org/onpi/06072005.pdf
Also, there is Title Case in French. We don’t put capitals everywhere. So “Académie des Sciences” is spelled right but capitalized wrong.
“there is Title Case in French”
there is NO such thing as Title Case in French
(sorry)
simple-touriste,
2 scales to note:
1. a spelling error that causes no confusion: speling instead of spelling
2. a spelling error that causes only a moments confusion because a random word is substituted that is an obvious error: apple instead of appeal
3.a spelling error that causes lasting confusion because a word is substituted that alters meaning: form instead of firm (IBM is a form of note.)
a.faulty data due to a copy error: misreading a 0 as a 6
b.faulty data due to selecting only data favorable to a preferred premise
c.faulty data due to alteration with intent to fraud
Number 1 is least worthy of comment. What is your motive for doing so?
Is it because the post concerns itself with a. b. and c. ?
SR
I believe that in German, all Nouns are capitalized. Observationally, I also believe that all German Nouns are long. I’m thinking that long Nouns are simply a Dissertation on what the “Object” is.
Korean is easier for me than French; written or spoken.
On a trip to Geneva Switzerland, where for some reason they all speak French, instead of Swiss, I could not find any connection, between what the announcer on the train was saying over the PA system, and what was written on the screen. (like the name of the next train stop.)
Phonetics seems to have no meaning whatsoever in French.
g
But its’ written in English, not French.
It’s English pretending to be French, just like the entire document is propaganda pretending to be science.
The fact that they couldn’t even spell correctly is very telling. This is ridiculously bad PR.
simple-touriste commented: “…It’s English pretending to be French…”
Two questions….
1.Are you perhaps Inpector Clouseau?
2. Why would anyone/thing want to be recognized as being French when they clearly are not?
“Why would anyone/thing want to be recognized as being French when they clearly are not?”
What is “clearly” not French?
simple-touriste commented: “What is “clearly” not French?”
An Englishman? I hope this exchange is in jest.
An Englishman is a “what”, now?
In which languages are these words:
– Etatiste
– Academié des Sciences
?
Sorry, this is getting too involved. I’ve been satirizing the pedantic nature of the French to protect the purity of their language.
I happen to be in favor of a French language reform of an extreme kind (not the silly réformette proposed by the Académie française): abolish almost all the silly orthographic oddities and most grammatical rules nobody knows anything.
“But its’ written in English, not French.”
Now I wonder, what is written in English? Academié? Etatiste?
“What is “clearly” not French?”
John Kerry
simple-touriste,
2 scales to note:
1. a spelling error that causes no confusion: speling instead of spelling
2. a spelling error that causes only a moments confusion because a random word is substituted that is an obvious error: apple instead of appeal
3.a spelling error that causes lasting confusion because a word is substituted that alters meaning: form instead of firm (IBM is a form of note.)
a.faulty data due to a copy error: misreading a 0 as a 6
b.faulty data due to selecting only data favorable to a preferred premise
c.faulty data due to alteration with intent to fraud
Number 1 is least worthy of comment. What is your motive for doing so?
Is it that the post concerns itself with a. b. and c., but you have no rebuttal?
SR
just a test to see whether I can get a word in edgewise. 2 attempts failed.
SR
OK, my test worked. What happened to my comments?
SR
simple-touriste,
2 scales to note:
1. a spelling error that causes no confusion: speling instead of spelling
2. a spelling error that causes only a moments confusion because a random word is substituted that is an obvious error: apple instead of appeal
3.a spelling error that causes lasting confusion because a word is substituted that alters meaning: form instead of firm (IBM is a form of note.)
a.faulty data due to a copy error: misreading a 0 as a 6
b.faulty data due to selecting only data favorable to a preferred premise
c.faulty data due to alteration for purpose of personal gain.
No. 1 is least worthy of comment. What is your motive for doing so?
Is it that the post concerns itself with a., b. and c., but you have no rebuttal?
SR
“It depends upon what the meaning of the word ‘is’ is.
~ Bill Clinton
Official language of Britain was French once. That’s why there is the “banter” between the Franco’s and the English.
I believe it is Bill Walsh, copy editor at the Washington Post and author of a couple of advisory books on English usage, who maintains that English is and should be a language without accent marks–so accents in French words should not, in his opinion, be retained in an English-language text.
“It depends upon what the meaning of the word ‘is’ is.
~ Bill Clinton
“Is you is or is you ain’t my baby?” ~ B.B. King
simple-touriste said: “It’s English pretending to be French, just like the entire document is propaganda pretending to be science.”
Much like your comment is an attack on the article pretending to be linguistic advice?
simple-touriste said: “The fact that they couldn’t even spell correctly is very telling. This is ridiculously bad PR.”
The fact that you consider a series of comments on scientific (mis)conduct to be PR is very telling.
While there are certainly a significant number of ideologues on WUWT – conservatives and libertarians in large part – some like myself consider the site to be primarily focused on science.
Not PR.
That, we leave to the SkS and Lewandowsky types of the world.
“The fact that you consider a series of comments on scientific (mis)conduct to be PR is very telling.”
The fact that you think you can follow comments is very telling.
I love the way the trolls manage to change the subject whenever their own deficiencies are demonstrated.
By long-established custom in France, capital letters are not generally accented.
This is truly idiotic. About 40% of English words are from the French language, spelt using only the English alphabet. Admittedly, its good form if you Italicise a borrowed word that you spell it like the locals especially as the English version is “etatist”.
simple-touriste:
What is your point?
Not only did you not fail to recognize the word ‘Etatiste’, neither has anybody here failed to recognize the word.
Pump ‘Etatiste’ into a search engine and search engines find the word.
What you are doing la simple-touriste is a childish attempt at thread jacking.
Slipped into your rants is the phrase “…like the entire document is propaganda pretending to be science”; which I can only presume you are hoping that it will sail by unnoticed?
Again in that fraction of a phrase, you are complete wrong; egregiously so.
Lord Monckton’s article is scientific. In it he asks a number of relatively simple questions. Questions that should not be left unanswered, by the climate team.
Allow me to refresh your memory.
What all of the other logical commenters here have wondered is why has la simple-touriste gotten themselves in such a frenzy on one word and whether the accents are required spelling or meant for pronunciation?
There is not a problem with people, search engines or dictionaries knowing the word and it’s meaning. Which leaves us with the simple notion that la simple-touriste is afraid that people will notice the questions and realize why there have been such machinations to alter surface records.
A simple answer is that CAGW is a scam. A scam that la simple-touriste appears desperate to obfuscate…
Looks like someone can’t see the forêt for the trees.
So why are the Y and the Z swapped on a typewriter keyboard ??
I’m quite happy for the French people if they like to use their language.
I do NOT speak ANY other language; and I’m not all that competent in English.
One thing I do with all non English words I might use or attempt to use, is to Anglicize my pronunciation of those words. I refuse to try and accurately match native pronunciations of foreign words that I might say, even Spanish which tends to be the language of my household. (no I don’t speak Spanish)
I see no reason to do that. Here in America, we have immigrants from all over the world, and I don’t hear anyone being critical of their English speech or pronunciation. We just accept what they give us. Some ethnicities have English accents that uniquely distinguish their origin. Which doesn’t mean that every person from one of those places retains their accent. Some persons completely adopt ordinary English pronunciations. It seems to be entirely a matter of choice.
I choose to not bother to try and acquire any foreign accents (I guess I have one myself); especially when those pronunciations seem unrelated to the way it is written.
I couldn’t even imagine how Cholmondeley gets to be pronounced the way it is supposed to be pronounced.
g
So what?
Is that supposed to be a French word?
If so, why not use the correct spelling?
Also, why all the questions for a simple remark?
Simple- Touriste un touriste simple perhaps?
You have no room to discuss bad french mauve.
I love the way these ,,,,,er,,, simple people hijack a thread with irrelevant comment .
I suggest the mods delete this entire section of comment tout suite eh?
@RogueElement451
So why do you make EVEN MORE NOISE?
“capitalized wrong” … hmmm … that ought to have been as follows:-
capitalized wrongly (adverb).
Regards,
WL
What does this have to do with climate science or anything thing else?
That was just a small remark (not a critic) that caused too much noise, some of it by clueless people who accused me of being fake French, an hilarious accusation.
If Etatiste is a French word, it should have the accent. Now some people tell me it is an English word, and I can accept that, but then I don’t understand why it italicized.
The French have to make a big deal about their language, because it’s all they have left that they can call their own.
But it is not a French word! It comes from the Latin, meaning status or statist. It has the same meaning (Denotatively) as the English, statism. Chambre (French), chamber, cabinet and camera are the same words, variously transcribed across, Greek, Latin, French and English. I won’t defend the choice of word but it does better convey statism as a leftist project because that is the connotative meaning of Etatiste!
I’m a French to English translator, and I can tell you that the French don’t generally accent capital letters (unlike French Canadians who do). So Etatiste is correct in my opinion, and to insist on the É. would be pédanterie in the extreme
Right on!
Which also just goes to show once again that the Simple Tourist is not a native speaker of French, if he, she or it knows the language at all.
Besides which, “etatiste” has been borrowed into English, spelled sans la marque d’accent, whether capitalized or not.
Are you for real?
“French don’t generally accent capital letters”
And many French, esp. young, can’t even write simple sentences correctly; so what?
Many people don’t make the distinction between kW/h and kWh either. Or journalists between mSv and mSv/a. Or between radiation and radionuclides.
He and I are both for real, unlike you.
Granted that the Academy accents initial capitals, they’re often left off in ordinary publishing. Besides which, as noted, “etatiste” is a French loan word in English. You might as well insist that our word Munich use an umlaut, as in Muenchen.
Rigorous people still use accent on capitals.
Lack of accents is still considered a “faute”.
And spell checking flags these. I don’t even know how to turn that off. (Not that I would want to.)
And you are still very funny.
You are a hoot!
Apparently you don’t know what a loanword is. How often do you see the accent used on the French loan word “cafe”? On “fiance”? Sometimes an accent is used, but usually only when denoting a missing vowel, as in “hors d’oeuvre”.
Mozilla’s spell checking accepts café, not cafe.
I think people only type café because they don’t know how to produce accents on Windows.
translate.google.com/translate_t#fr|en|étatiste proposes statist and etatist, not etatiste.
That’s a ridiculous excuse, since it’s printed that way in published material, along with signs.
Etatiste is italicise, indicating a foreign word. However, this is at worst a trivial error in my opinion.
Also, English dictionaries include both etatist and etatiste as acceptable alternate spellings for the loanword.
Seaice,
Yes, it is in the post, but it needn’t be, as it has long been a valid English loan word.
Exactement!
The Academy deplores the decrease in the use of accents on capital letters, a tendency observed in manuscripts under the pretext of modernism, but (the members of the august body suspect) really to reduce the cost of composition (for printing).
So why do the French use a Z in place of a Y and a Y instead of a Z ?? Some words can become quite unpronounceable if you switch Y and Z or verse vicea.
G
simple-touriste
February 10, 2016 at 8:34 pm
The Académie française also said:
French road sign – no accent on ‘PRIORITÉ’. Plenty more where that one came from!
https://www.flickr.com/photos/neumeyer/12363299
Certainly an appropriate sign for this discussion! Let me know when we get back on the road to somewhere. I think I can see my own taillights
Foreign (non-English) road signs can be very confusing.
On a weekend trip to Munich some years ago, I was able to drive all over the city of Munich by finding the correct street and then just staying on it; it goes everywhere.
The name of that street on the signs is ” Einbahnstrasse “.
Every city should have an Einbahnstrasse, just for tourists.
G
So let me see if I got this right: The only thing you can find to carp on about in the entire article is a missing ‘ over an E. Must be a brilliant, scholarly and accurate article then if that’s the best you can do. And since you are such a gutless piece of slime as to not use your true name, we can safely assume you are a troll, pure and simple, with the dishonest aim of hijacking the comments away from the devastating truth of Monckton, Soon, and Legates’ analysis.
We are glad to know that you exist.
Can you stop your pathetic trolling?
Says the pathetic troll.
[Simmer down, please. All of you. -mod.]
Why isn’t Suzuki a member? Just today he wants to put Harper in Jail! Also saying that if Harper would have won “he’d book a flight to Mars” ( MSM news)
Oh I wish!
Read it here; http://www.msn.com/en-ca/news/canada/suzuki-harper-should-be-jailed-for-his-climate-positions/ar-BBp2yVx?jid=50109&rid=1&FORM=MD12OQ&OCID=MD12OQ&wt.mc_id=MD12OQ
How is it that a failed geneticist can parade himself in front of the world as an authority on anything- especially a field that is utterly outside of his area of relative expertise? Pompous ass! When Justin Trudeau kicks you out of the room for sanctimony- you know you’re in the ante-room of the loony bin. He should be jailed for the deaths of poor people who need cheap power.
The closest his research got to temperature issues was with heat-sensitive genotypes in fruit flies.
He doesn’t even know what UAH has to do with climate data.
An excellent set of ten questions to ask the nine doomsday profiteers depicted by Josh. And, the sad horribly serious consequence resulting from the the continuing miss-direction of assets by the world’s leaders from the plight of the poor to reacting to the phony climate crisis claims.
I agree entirely.
Totally agree John. And you were always my favorite Chicago-land TV weather guy.
And then put their answers through the Thomas Sowell wringer…his three questions about the arguments.
The first is: “Compared to what?”
The second is: “At what cost?”
And the third is: “What hard evidence do you have?”
https://necessaryandpropergovt.wordpress.com/2013/03/21/thomas-sowell-three-questions-that-destroy-most-liberal-ideas/
Regarding point 1). CO2 absorption can not heat the ‘air’, as the quantum mechanics describing absorption and emission has no net effect on the translational velocity of the CO2 molecule and only by collisions can molecules share momentum among each other even as collisions increase the probability that an energized GHG molecule will emit a photon.. Thermometer sensors react equally on a joule by joule basis to both molecules colliding with the sensor and photons absorbed by the sensor and can not distinguish between temperature consequential to energy transported by photons and temperature consequential to colliding molecules. There is a small velocity effect related to collisional broadening, except that state transitions are equally likely to speed up the molecule as they are to slow them down and the net effect on the translational velocity is zero.
“2: Why, just two years ago, did every surface temperature dataset agree with the satellites that there had been no global warming so far in this century? And why was every surface dataset altered in the two years preceding the Paris climate conference – in a manner calculated to show significant warming – even though the satellite records continue to show little or no warming?”
As it happens, I have a plot from two years ago, well, March 2014. It was shown in this September 2014 post. It is of course pre-Karl, and also uses Ver 5.6 of UAH. It is one of my back-trend plots, showing trends to present (Mar 2014) from the time on the x-axis. It shows the 3 land/ocean indices, HADSST3 and the two satellite indices, RSS and UAH5.6.
http://www.moyhu.org.s3.amazonaws.com/trend/pause/trnd19.png
RSS is down the bottom and yes, shows a negative trend from 2000 (but not 1999). And 3 surface indices, NOAA, HADCRUT and HADSST3, go negative in about 2001, which I suppose you could say is start century. GISS a little later, and only just.
But what is the light blue floating way above them all? Nowhere near a zero trend there? That is UAH, then. Of course, now it is down with RSS. That is adjustment!
And should you be inclined to be skeptical, here is Werner’s WUWT report from March 2014:
“UAH
The slope is flat since January 2005 or 9 years, 1 month. (goes to January using version 5.5)”
Every other data set dated from 2001 or earlier in his list.
So you believe you have destroyed one of Brenchley’s arguments. That leaves nine.
“That leaves nine.”
Well, I can’t match Lord M’s exuberant verbosity. But I scotched #1 here (no response). The radiative forcing that CO2 produces to warm the surface doesn’t require that the air be warmed. It requires that the DWLWIR be emitted by warmer air. This happens because with more optically dense air, the down IR comes from lower altitude, which is warmer by lapse rate.
I answered #3 there too.
#4 is just a epeat of #3, with the wrinkle that it may soon become untrue. Check at the end of the year whether the surface measures have caught up with prediction.
#5 Well, as I’ve said over and over, the surface and troposphere are different places. You might as well ask why Svalbard anomaly is diverging from London.
#6 is just tendentious. #7 – I’d like to see the graph. I doubt if the facts are true.
#8 is much argued in the literature.
#9 just makes no sense.
#10 is just tendentious.
and I’m out of verbosity.
Nick S.:
Each and every of your disputes of the 10 points is – at minimum – contentious. Obviously, it would take much time to refute them all so, as illustration, I merely ask for clarification of one of your assertions.
You say
Really!? It says
Please explain your difficulty in understanding those two clear questions which are written in plain English.
Richard
Richard,
“Please explain your difficulty in understanding those two clear questions which are written in plain English.”
But not plain science. No length scales are specified. At one level, the ocean warms from below because it is warmed by penetrating sunlight. That is on a depth scale of metres. But if he means further than that, it just isn’t true. SST is far more mobile in temperature than the depths, and has been rising rapidly.
And the claim 1°C in 430 years? Again no depth range specified. SST is rising far faster than that. If he means the whole ocean, well, of course the time scale for diffusion of heat kilometres downwards in very slow moving water is very long. No climate mystery there.
Nick,
I suspect that you fail to recognise that M of G is involved in a Political debate, rather than a Scientific one. He is arguing against those who are using dodgy metaphysics to justify their political argument for more power.
In a sense, with your singular pursuit of the Scientific, you may be tilting at the wrong windmilla.
Nick, have you looked at Lysenkoism? Heard about that mid- 20th Century European instance of what happened when Darwinist metaphysics was used to support state policy? Pondered over the wider personal responsibility of scientists who are existentially dependent on state funding?
“Darwinist metaphysics was used to support state policy”
Nothing Darwinist about Lysenkoism – it was a distorted Lamarckism. But state funding of scientists in the West predates the brief reign of Lysenko, and has survived since with no apparent damage to science or the state.
“It requires that the DWLWIR be emitted by warmer air. This happens because with more optically dense air, the down IR comes from lower altitude, which is warmer by lapse rate.”
What a load of BS. Unless there is a change in lapse rate within the atmosphere, the only effect of CO2 is to raise the effective radiation level of the atmosphere and as a result … because the temperature below this effective level is subject to the SAME lapse rate, all levels of the atmosphere would increase in temperature by the same amount.
The only way this would not happen is if you have another massive change IN THE ATMOSPHERE such as the convection rate (and change to lapse) and/or formation of clouds. And because these are preventing warming, this must necessitate negative feedbacks. So, your whole argument can only lead to the conclusion that negative feedbacks are taking place in the atmosphere that entirely counter the supposed warming.
So your whole argument is nonsense and doesn’t in any way support your intended conclusion.
Nick @ 2:12,
President Eisenhower disagreed with you about the danger of state-funded science.
Nick S.:
Thankyou for your clarification. I now understand your problem.
You say
Firstly, that says you agree the ocean warms from below in the region where radiation impinges on the ocean (i.e. the ocean surface layer).
You then claim “further than that, it just isn’t true”, I assume by “further” you mean ‘deeper’. If so, then you are being disingenuous because the bulk thermal transport between the depths and the surface is not known on a global scale. Indeed, warmunists use this lack of knowledge to assert that “missing heat” is hiding in the ocean depths.
So, you agree the statement of #9 is known to be true in the surface layer, but it may not be true of deeper regions so you claim it is not true of deeper regions. Hmmmm.
And as you say, yes, sea surface temperature (SST) “is far more mobile in temperature than the depths”, but, no, SST has NOT “been rising rapidly”. Indeed, the “rise” in SST was obtained by unjustifiable ‘adjustments’ made to ARGO data which indicated falling SST.
And that ‘adjustment’ to the ARGO data is very pertinent to the second question in point 9 which you address saying
Yes, “there is no mystery” and your admitting that “there is no mystery” adds to my puzzlement at your having claimed it “just makes no sense”.
Clearly, the statement that “the ocean {has} been warming” does refer to “the whole ocean” because otherwise it would have said “the surface layer of the ocean {has} been warming”.
Importantly, the ocean is a big heat sink. If – as it seems you agree – the ocean is warming at a rate of 1°C in 430 years then that inhibits the ability of global temperature to rise. And that “1°C in 430 years” assumes the “missing heat” is hiding in the oceans; i.e. it demonstrates that if the ‘missing heat’ exists then it cannot be a problem.
Richard
Nick Stokes
February 11, 2016 at 2:12 am
Nick,
President Eisenhower disagreed with you about the danger of state-controlled science.
Richard,
“If – as it seems you agree – the ocean is warming at a rate of 1°C in 430 years then that inhibits the ability of global temperature to rise.”
I certainly don’t agree. How could I? It seems a figure just plucked out of the air. No source is given, and again, no length scale is given. You have filled another page of waffle without yourself knowing, apparently, what length scale is meant. The whole ocean? Argo data goes to 2000m only.
I repeat. #9 makes no sense.
Nick re my post;
For the record, I asked three questions. You conflated the first two and got it badly wrong. And you did not make any response to the third question.
Nick says;
“The radiative forcing that CO2 produces to warm the surface doesn’t require that the air be warmed.”
I think that theory says that an IR photon absorbed by a molecule of gas at a pressure of around one bar will see its energy transferred, through collisions, to adjacent molecules, before it has a chance to be radiated.
CO2 may enjoy the privilege of fractional reserve accounting, but, normally, a particle cannot spend its energy credit in two different places at the same time.
Nick S.:
Your first reply to me said
I replied to that saying
To which you have responded
So,
1. you said it “just makes no sense”.
2. then you said “there is no mystery”
3. now you say “I repeat. #9 makes no sense.”
Oh dear. First you are mystified, then you are not, and now you are mystified again.
And you try to justify your swinging back and fro like a pendulum by claiming I – yes, me, I – “have filled another page of waffle”. No, dear boy, I have merely asked you to explain your carping and you have replied with inconsistent waffle: please google ‘psychological projection’.
Yes, ARGO only goes to 2 km depth. So, the “whole ocean” is only above the thermocline.
Are you really trying to claim AGW is heating ocean below 2 km depth?
Or are you merely wriggling because you have again been pressed to explain some more dubious carping which you have posted in a WUWT thread as is your common practice?
Richard
Nick Stokes
You are clearly a very clever man. Really enjoy your no nonsense posts. Thanks.
Stokes, as usual, wriggles like a stuck pig. Let’s just take his response to item 10, that it’s “just tendentious”. Let him download a copy of Cook et al.’s list of all 11,944 papers whose abstracts they read. They had themselves marked only 64 papers, or 0.5% of the sample, as having stated that recent global warming was mostly manmade – the definition of the consensus proposition that they had themselves stated in the introduction to their paper, and the definition that the IPCC itself uses. Yet by a series of flagrant pseudo-statistical prestidigitations they converted this 0.5% to 97.1%. But Stokes does not mind such freuds, because they support the Party Line he so enthusiastically but misguidedly espouses.
The fact is that global warming is not occurring at anything like the predicted rate. Any true and honorable scientist would ask why this was so, rather than ducking and diving and pretending it is not so.
“The radiative forcing that CO2 produces to warm the surface doesn’t require that the air be warmed”
So an atmosphere which is cooler than the surface can warm it?
There can be no net heat transfer from cold to warm, arguing about the relative components is meaningless.
Richard,
“Yes, ARGO only goes to 2 km depth. So, the “whole ocean” is only above the thermocline.”
You seem to have an odd idea about where the thermocline is. But OK, I did a calculation, and it looks as if Lord M’s 1°C in 430 years is based on heating the whole layer above 2000m uniformly. Which isn’t going to happen. Heat moves slowly in still water. Tropic waters are colder than British at a few hundred metres depth, and have been for millions of years.
The calc reminds me of the child who, warned not to put his hand in the candle flame, said that there was no need to worry; it would take an hour for the candle to raise his body temperature 1°C.
@ Nick Stokes February 11, 2016 at 11:22 am
Sounds like using an “average ocean temperature” is somewhat meaningless.
Wonder why that same concept isn’t applied to the average atmospheric temperature?
No you didn’t, Nick.
This in no way explains why warming would occur at the surface and not in the rest of the troposphere, and the rest is just painful gibberish. Even in the absence of convection, you would have to dig deep into your tool box of obfuscation to justify the observations were consistent with AGW.
JohnWho,
“Wonder why that same concept isn’t applied to the average atmospheric temperature?”
Indeed, the atmosphere varies in temperature by 40-60°C vertically within a few km, which does make an average fairly meaningless. Fortunately, those who calculate satellite indices have borrowed from surface practice and calculate anomalies, which they average. That is much more meaningful, as shown by its popularity here. Even so, troposphere anomaly calculations are more difficult, because they don’t have station histories. RSS, for example, gets the local normals from a GCM.
RobertB,
“This in no way explains why warming would occur at the surface and not in the rest of the troposphere”
What it shows is that you don’t need tropospheric warming to create the radiative forcing that warms the surface. That refutes the assertion of #1. Of course, it is still possible, likely even, that the troposphere, especially close to the surface, will warm.
And as I noted above, until last April, UAH was saying that the troposphere was warming, even faster than the surface. They have changed their mind. But it’s not a point on which you can say that the troposphere disproves the surface.
“What it shows is that you don’t need tropospheric warming to create the radiative forcing that warms the surface. That refutes the assertion of #1.”
This is getting almost as stupid as the more snow/less snow proves climate change. I’m likely wasting my time but here goes. There is a temperature gradient with altitude because of the lapse rate. The upper troposphere can warm up for a short time without warming the surface appreciably because the formation of the lapse rate is slow. The same can not be said of the surface because hot air rises.
Mr. Stokes: Some of your posts prove to me you’re gifted, so I’ll leave the science to others (mostly). I use words, and I see “Nothing Darwinist about Lysenkoism” in response to precisely the opposite assertion. This is a dodge, and not an artful one. And not your first, in fact your posts often include such dodges along with other points. And on the science (I did say “mostly”), you say “The radiative forcing that CO2 produces to warm the surface doesn’t require that the air be warmed.” wow. So the CO2 in the air captures heat rising in the air; and more CO2 in the air captures more heat in the air; and radiates it (not in every direction but somehow) to the surface THROUGH THE AIR. But it won’t require warming the air? Bill Nye will smirk at that (which is a good thing), but to the point-do you admit the team got the tropo hot spot wrong? Was the “science” supporting that prediction/projection wrong? Maybe you’re trying to be funny with the dodges, but it damages your other points, persuasion-wise (“The Apartment”). ‘Course, you’ll always have Simon the troll.
Nick Stokes says:
… the claim 1°C in 430 years?… SST is rising far faster than that.
So there you have it. Take a couple of data points, draw a straight line between them, and… Presto! A climate catastrophe!
“So the CO2 in the air captures heat rising in the air; and more CO2 in the air captures more heat in the air; and radiates it (not in every direction but somehow) to the surface THROUGH THE AIR. But it won’t require warming the air?”
No, you’re missing the logic. I don’t say that. I do think, and did say, that it would warm the air, and I also think the air has actually warmed. On that point, I’ll show just an extract (covering the “pause”) of the graph from Christy’s testimony:
http://www.moyhu.org.s3.amazonaws.com/2016/2/christy.png
The whole graph was presented to show discrepancy between model and data, but is often cited at WUWT to show supposed agreement between balloons and satellite (TMT, but that is rarely noted). But on this point, at least, they doesn’t agree. Folks can argue about whether the satellites show no warming, but certainly the radiosondes do.
Anyway, back to the logic. Point #1 said that a “killer” is that the surface has to be warmed by the atmosphere, and can’t be warming if the atmosphere isn’t. The underlying facts can and should be disputed. But the logic is wrong too, and misses the main mechanism of GHE. This says that at the GHG-active frequencies, there is a big layer that both absorbs and emits. Adding GHG effectively expands it. With lapse rate, the bottom is emitting from warmer lower air, and that’s what gets to the surface. At the top, it emits from colder higher air, and in radiative terms that is the insulating effect. Cooler means less, and since insolation heat must leave, that means other frequency bands must carry more. Something has to warm.
That mechanisms does not require warming of the air,and this refutes the “killer” logic. It doesn’t mean the air won’t warm, and it probably will, and has. That also refutes #1.
Well we have climate scientists all the time swearing up and down that mono, and diatomic gases DO not emit any LWIR thermal radiation either up or down. Other scientists swear up and down that thermal EM radiation is emitted by ALL matter that is above zero kelvin Temperature.
So which is it. Do Nitrogen, Oxygen and Argon in the atmosphere emit (or absorb) thermal radiation or not ?
Can’t have it both ways.
And I am firmly in just one of those camps.
G
“Can’t have it both ways.”
Both are true. Every body emits radiation, subject to an emissivity, which is freuency dependent. N2, O2 and Ar have extremely low emissivity for thermal IR. By Kirchhoff’s law, that is equal to the transmissitivity. So they emit very little, and are mostly transparent. GHGs have frequency regions of high emissivity, and very low in between. This plot shows the regions.
BTW, this is classical physics, not climate science. Tyndall first worked it out in about 1860.
Adjustments, sad to say, are necessary. And I am saying this as an ex-raw data advocate.
Even our (Anthony’s team’s) unperturbed data has to be adjusted for CRS bias and MMTS conversion.
What is necessary for our adjusted data is showing clearly the raw data and the adjusted data side-by-side, with explanation as to why the adjustment is necessary. (And, of course, it all has to be fully replicable — by anyone.
The problem is not that you can’t use the raw data as is. Its that computing power was sufficient and statistics well developed enough to do a good job even in the 70s. The “better” analysis since even 15 years ago has somehow managed to negate problems that sceptics had with the 20th C warming confirming AGW and, of course, the 21st C pause.
Taking the 70s estimates of changes in global temperatures with the 40s blip and all, and the 0.4°C of warming in the RSS from 1979 doesn’t cancel out the cooling of the 70s even with an extra 0.1 warming from 75-79. The past year most likely wouldn’t have been warmer than 1944 if the data was analysed like it was in the 70s.
So what are CRS bias, and MMTS conversion. Where in this thread are those shop talk terms defined ??
Nick
What would you make of this complication?
In Australia regional the difference between Acorn Tmax and UAH ver 6 in press has a strong stats relation to rainfall.
Could it be that the “different things’ measured by LT UAH and land surface Acorn have an intrinsic relation to humidity? Perhaps different horizontal slices thru the lapse rate profile at the time?
Geoff
I don’t know, Geoff – I’d have to see the data.
Mon Dieu, Nick Stokes – I don’t have the HadCrut data downloaded from late 2013 but do have an image of a plot of moving linear regressions. The last 10 years had a -0.03K/decade trend and the last 15 years had a 0.03K/decade. Pretty safe to assume that a 13 year trend was essentially 0.
Please argue when you have something valid to complain about.
Robert B,
“Pretty safe to assume that a 13 year trend was essentially 0.”
I’m assuming that is a response to my original post. The plot I showed does have HADCRUT, the red, crossing the x-axis in 2001 – ie trend from then to Mar 2014 is 0.As I said then
“NOAA, HADCRUT and HADSST3, go negative in about 2001,”
No not more French.
While I agree with every word of the essay, I’m not sure that it helps to call the accused parties “profiteers”, as this implies that their shrill crusade to putatively save the world from itself also includes cynical motives of personal enrichment, which I doubt is the case for all but a few.
No, what they have at stake is not personal cash but individual reputation, a more valuable commodity. Having nailed their academic colours to the mast by demonising the life-giving trace gas and all those ghastly humans who presume to enjoy a civilised life by emitting a bit of it, they have wilfully painted themselves into a corner, and none yet has shown any inclination to find a graceful escape route.
In “normal” science, when a tightly held hypothesis is shown to be false or highly exaggerated, most scientists are inclined to say, “That’s disappointing, but interesting!” and commence work to bring them closer to the truth. But not this lot. Their instinctive reaction is to come up with fanciful re-rationalisations, such as aerosols active only for a couple of decades, or heat that can magically dive into abyssal ocean depths without pausing to manifest itself in the water above. Even worse, they alter historical data to suit their agenda, a capital offence in any other field. (By the way, I have a nice big barrel of hot tar, has anyone got a truckload of feathers?)
While it is true that many billions of dollars have been needlessly wasted thus far on efforts to prove the unproveable, these guys are not doing it for the money. (OK, perhaps Gore is an exception.) No more so than those of us who take a different view of the available facts are hoping to profit from it – I’m still waiting for my very first cheque from Big Oil. Sure, they get to (unironically) fly off to conferences in nice places like Paris and Cancun (never Shit Creek), and no doubt they make free with their mini bars, stuffing Toblerones, macadamias and shower caps into their bags. But the only money they receive besides their professorial salaries goes to their teams of fresh-faced acolytes, who busily model away on ever-larger supercomputers to conclusively prove that bullshit * invalid assumptions + several million lines of code still = bullshit. Some others get to travel to frozen faraway wastelands to prove that it’s warm there, only to be rescued as shivering but unabashed wretches.
It is indeed regrettable that colossal amounts of cash have been wasted when there are so many other real problems in the world that could have been usefully addressed; but I would still hesitate to call them profiteers, merely grandiloquent wastrels suffering from more pride than wisdom.
You may be correct. They may be only useful idiots….in every sense of the meaning.
Not sure anyone else have heard that the CSIRO boss has just been forced to apologise for saying climate science is like a religion .
“I would still hesitate to call them profiteers,”
I think you may have forgotten about that guy who was accused of funneling grant money through his relatives. Not one of the gang of nine, but definitely a climate fraud profiteer.
Bob Highland:
You display a very American view when you write
Obtaining “individual reputation” is profiting because – as you say – reputation is a commodity.
Indeed, most of the “profiteers of climate doom” are ‘scientists’ working in academia. Their choice of employment demonstrates that Individual reputation is the profit they most desire. They would be some form of businessmen if money were the profit they most desired.
All commodities can be traded and academics trade individual reputation for money in the form of research grants, contracts for work, travel to conferences in exotic places, and etc.. But money is a bi-product of their most desired profit which is reputation.
Nobody works for only one type of profit. For example, a mother may work to feed her children because that is the profit she most desires, but she wants to feed herself, too.
Money is not the main profit desired by any working scientists. All working scientists need money to live, but financial reward is not their main desire. They would not be working scientists if money were their main desired profit; e.g. my brother has a higher degree in chemistry, entered industry, and transferred to management where he obtained much greater financial reward than he could have obtained by continuing in research.
Working scientists in academia most desire reputation which is obtained by publishing many – often trivial – papers. Those who work in industry most desire the excitement of solving seemingly intractable problems. All need money to live, but that is not the profit they most desire.
I would not care to try counting the number of times people have written, “Follow the money” on WUWT. That is a very American misunderstanding: true motivation is revealed by “Follow the profit”, and a desired profit is often NOT money.
Religious Scripture (1 Timothy 6:10) is right when it says
NIV
But excessive desire for money is not the only excessive desire which is “a root of all kinds of evil”.
I consider the above essay to be right in every detail including the motivation of “profiteering” which it ascribes.
Richard
Correct: what they suffer from is “Right-Man Syndrome.” (Google for it.)
Thanks rogerknights; Right-Man Syndrome is a perfect match to commenters on The Guardian articles. It’s kinda like narcissism, except it protects their knowledge not just their ego.
They are absolutely, without any shadow of a doubt profiteers. Hansen for instance made millions jetting around the globe spreading the doctrine of doom. Their careers and grants as well as their ideology are at stake.
Wind Energy Potential in Mexico’s Northern Border States, May 2012
Woodrow Wilson International Center for Scholars, Mexico Institute, Washington, D.C.
Produced by a non-science academic, lead author, which seems to be a guide to “wind-prospecting” in Mexico, IMO.
http://wilsoncenter.org/sites/default/files/Border_Wind_Energy_Wood.pdf
Money, profit, whatever!
Yup. The stakes in the “Green Energy” stampede sc@m are enormous.
Hansen isn’t the only profiteer. The whole clique of alarmist scientists and propagandists seem to be in it for the money: Mann, Algore, Jones, etc. And now a whole new crop of rent-seekers is being outgassed from the universities.
I’ll say this for them, no matter what happens in the real world, they keep their eye on the ball, parroting their alarmism and what must be done about it.
This is one result that I still chuckle over:
http://randomlylondon.com/wp-content/uploads/in-drought.jpg
That one’s funny. This one isn’t.
In most instances, enhanced reputation can be used to enhance ones income.
Her is the link
https://www.google.co.nz/url?sa=t&rct=j&q=&esrc=s&source=web&cd=1&cad=rja&uact=8&ved=0ahUKEwiE3NSRjO_KAhVGipQKHR41D8oQFggaMAA&url=http%3A%2F%2Fwww.abc.net.au%2Fnews%2F2016-02-11%2Fcsiro-boss-apologises-for-climate-religion-comments%2F7160288&usg=AFQjCNH6WmvOVLdTDdw6Kf6dZXC_rX4PPA&sig2=Y061rgghHPpbBahX_w6zsg
He was merely referring to the heated arguments, by comparing them to religious arguments. What’s wrong with telling the truth?
Robert said…Not sure anyone else have heard that the CSIRO boss has just been forced to apologise(sic) for saying climate science is like a religion .
And well he should!! It is a god dam& cult,which has nothing to do with religion, only to confuse and lead the stupid people,and steal taxpayers monies.
If one is forced to apologise then the apology is worthless.
Truth hurts?
Christopher Monckton of Brenchley, Willie Soon and David R. Legates,
No Briggs? No stats in this one I guess.
Well this ought to be good.
The Sun.
Surface temperature records did not all agree that there had been no global warming so far this century. They didn’t even agree that there had been no surface warming this century. Surface and/or lower tropospheric temperature trends are not the only, or even the most representative, indicator of net energy retention/loss in the climate system.
Loaded question, based on the above false premise. See my response to (5) for a counter-question along these lines.
Define “a lot”.
I know right? You think these shysters would do a better job of falsifying observations to match the desired output of “the models” /sarc
The real answer is probably a combination of CMIP5 running about 9% hotter than HADCRUT4 over the hindcast portion …
http://4.bp.blogspot.com/-WGX4QGtowJo/VrO2ze8qVWI/AAAAAAAAAlY/R1w630Lh32U/s1600/HADCRUT4%2Bvs%2BCMIP5%2BRCP8.5%2Bregression%2Bmonthly%2B2015-12.png
… due to what Gavin Schmidt calls “forcing issues in design” …
https://twitter.com/climateofgavin/status/606579820458332161
… as well as normal decadal-scale internal variability which the CMIP5 RCP ensemble runs do not attempt to predict. As many here have noted, this latest solar cycle is a bit dimmer than the last few, something else AOGCMs don’t attempt to predict.
That depends on which observations you’re comparing to the models, and how up-to-date you are on the current state of CMIP5 (see above).
This is kind of a repeat of (2). Much depends on which satellite data series you’re talking about: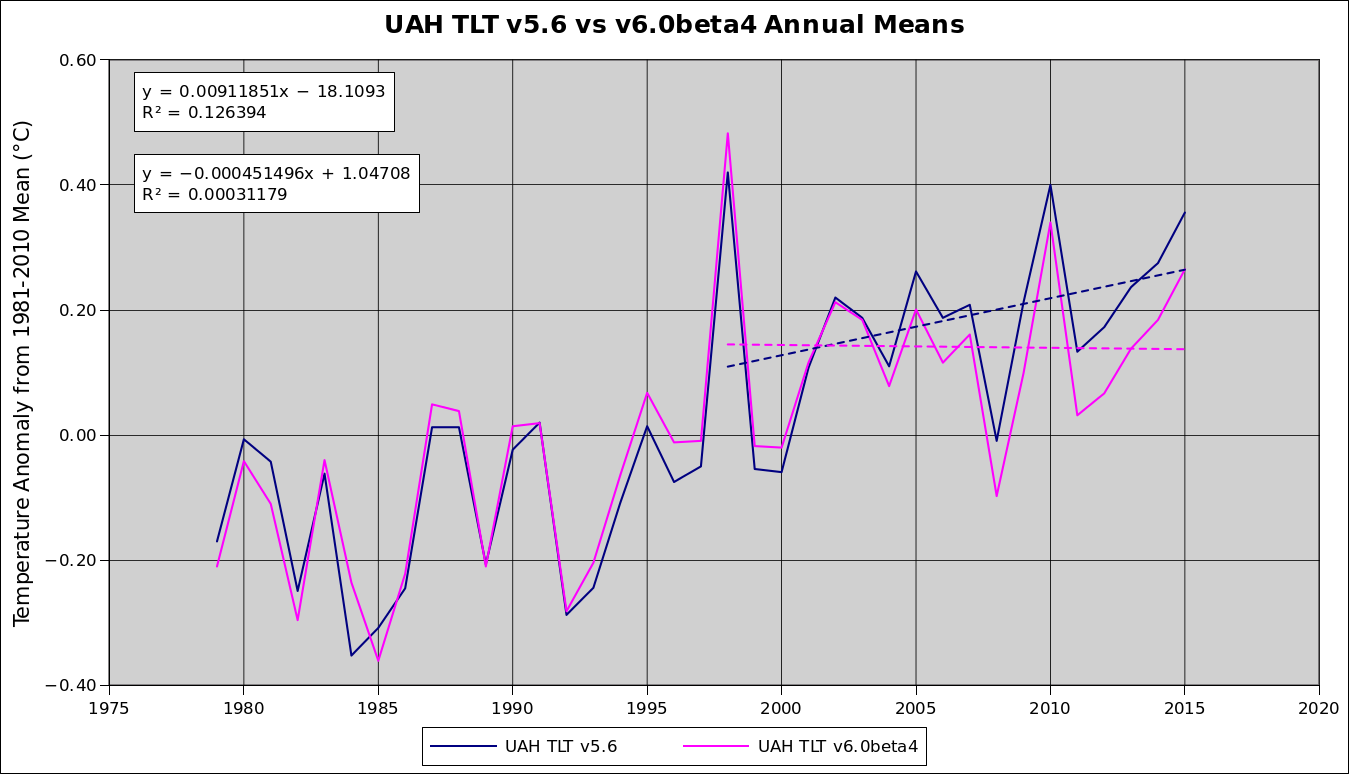
Counter question: why was UAH TLT v6.0beta released prior to Paris without benefit of peer-reviewed publication? Why has not the new code been released?
I hate to break this to you, but reality existed prior to the year we call 1979. See again the first plot in my response to (3).
Try this experiment: walk into your friendly neighbourhood seismologist’s lab and ask when the next large earthquake will occur in the region. When (s)he gives you a bounded estimate for magnitude and probability of occurrence over the next 30 years, triumphantly declare that the theory of plate tectonics is obviously not “settled science”. Then ask why we should be spending money on silly things like seismic retrofitting, additional engineering research to improve current and future construction — or the most illogical thing of all: why there strict building codes in quake-prone regions to begin with! I mean, earthquakes have always happened in the past, right? Wot’s the big deal, eh?
Snap a photo of his or her facial expression, taking care to capture the exact moment of maximum eyeroll.
I know of no predictions that warming would remain constant on decadal timescales. The answer to the first part of the question is implicit in the previous sentence.
RATPAC-A radiosondes are your huckleberry:
http://3.bp.blogspot.com/-rVss1ZRHvx4/VnsKTcQxreI/AAAAAAAAAg4/VQyhN-gPj6o/s1600/RATPAC-A%2BTemperature%2BTrends%2Bby%2BAltitude%2B1958-2015%2Bglobal%2Bvs%2Btropics.png
Note that if the sun were doing it, the prediction of a tropical tropospheric hotspot evolving also stands. The only so-called AGW “fingerprint” in that plot is the stratospheric cooling due to the radiative effects of CO2 increasing the rate at which the stratosphere is able to dump heat into space.
Funny how “killer lists of questions for climatologists” rarely bring up that particularly successful prediction.
I know of no evidence for such, and it should be obvious if it were: warming from the bottom would create vertical convection movements from the bottom that would be difficult to miss, and a vertical temperature profile that would also be obvious and probably difficult to miss.
This would be your cue to provide substantiation for your claim.
The upper 2 km layer accounts for between 53 and 54% of the total mass of the oceans, so one may multiply accordingly to obtain the energy required to change that layer by 1 K. Now for the data:
http://climexp.knmi.nl/data/iheat2000_global.png
Mean ΔOHC works out to 5.47E21 J/yr, over the entire interval, and ΔT works out to 0.0019 K/yr, the reciprocal of which is 526 years for 1 K change.
If the same amount of energy were absorbed by the atmosphere at the same rate, a 1 K change would take 132 years, but as you note the Argo floats are showing an accelerating rate of energy accumulation. Therefore, a linear trend extension is probably not the best method if we must insist on extrapolating.
But let’s run with it for sake of argument. Your 430 years for 1 K change over the Argo era translates to 108 years for the atmosphere, or 0.093 K/decade. We all trust RSS TLT here, right?
http://data.remss.com/msu/graphics/TLT/plots/RSS_TS_channel_TLT_Global_Land_And_Sea_v03_3.png
0.124 K/decade at the time of this post. Hmmmm.
Next time you talk to him, have him check these calcs:
Encourage him to get his response right as the ratio of astronauts to non-orbiting humans is rather teensy.
If you lot would actually bother to make proper citations and read what they actually say …
http://iopscience.iop.org/article/10.1088/1748-9326/8/2/024024
Abstract
We analyze the evolution of the scientific consensus on anthropogenic global warming (AGW) in the peer-reviewed scientific literature, examining 11 944 climate abstracts from 1991–2011 matching the topics ‘global climate change’ or ‘global warming’. We find that 66.4% of abstracts expressed no position on AGW, 32.6% endorsed AGW, 0.7% rejected AGW and 0.3% were uncertain about the cause of global warming. Among abstracts expressing a position on AGW, 97.1% endorsed the consensus position that humans are causing global warming. In a second phase of this study, we invited authors to rate their own papers. Compared to abstract ratings, a smaller percentage of self-rated papers expressed no position on AGW (35.5%). Among self-rated papers expressing a position on AGW, 97.2% endorsed the consensus. For both abstract ratings and authors’ self-ratings, the percentage of endorsements among papers expressing a position on AGW marginally increased over time. Our analysis indicates that the number of papers rejecting the consensus on AGW is a vanishingly small proportion of the published research.
… you might not ask such silly questions.
Brandon Gates:
Yet again you have copied and pasted reams of stuff which you don’t understand and nobody will bother to plough through.
Your assertion that, “Surface temperature records did not all agree that there had been no global warming so far this century.”
is equivalent to
“Oceania was at war with Eurasia; therefore Oceania had always been at war with Eurasia.”
Only one quotation is needed to demonstrate that everybody agreed the existence of the Pause prior to the ‘adjustment’ of the data sets to erase it.
It is Box 9.2 on page 769 of Chapter 9 of IPCC the AR5 Working Group 1 (i.e. the most recent so-called science report of the UN Intergovernmental Panel on Climate Change; IPCC ) and is here.
It says
GMST trend is global mean surface temperature trend.
A “hiatus” is a stop.
This discussion of “the cause of the observed GMST trend hiatus” is from the IPCC which is tasked to provide information supportive of the AGW hypothesis.
Richard
“Brandon Gates:
Yet again you have copied and pasted reams of stuff which you don’t understand and nobody will bother to plough through.”
I did. It was hugely funny and informative. You ought to try writing in this style Richard.
richardscourtney,
Yet again you demonstrate a tendency toward hyperbole, if not difficulty separating fanatasy from reality: my Cook (2015) abstract copypasta doesn’t constitute a “ream” in my book. If you think my response to Monckton’s et al. shopworn Gish Gallop was long and tedious, you should have tried writing the point-by-point response to it in the first place.
I think you’ve learnt the wrong lesson from Orwell a little too well.
Thank you for copy-pasting the above. Surely you understand that it refutes …
7: Why has the observed rate of warming, on all datasets, been tumbling for decades notwithstanding predictions that it would at least remain stable?
… more directly than my own response to same? As well, I’m sure you understand that it also substantiates points I made rebutting …
3: Why do all the datasets, surface as well as satellite, show a lot less warming than predicted?
… don’t you? By all means, keep kicking the ball into your own goal.
Academic. Far be it for you to note that I consistently do not dispute that mean surface (and tropospheric) trends are not constant on decadal time scales. I in fact often go out of my way to point out that …
http://3.bp.blogspot.com/-MW_NJp28Udc/VNS3EAEqpOI/AAAAAAAAAUs/hjhuLZFkdoM/s1600/hadcrut4%2Bhiatuses.png
… there are two 40-ish year “pauses” precedent in global surface temperature anomaly time series. Just as consistently, you and yours dodge the obvious: each subsequent “pause” begins at a higher temperature anomaly than the previous one did. Simple myopia doesn’t seem the best explanation. I have noted previously that there are generally only two relevant time periods here at WUWT: a bazillion years ago through the end of the LIA, and the past 19 years. It’s a punctum caecum writ large. I’m no ophthalmologist, but if I were I’d be wanting to rule out retinal damage.
The way the argument has been framed in the OP is not lost on me. I also understand several other things:
1) Your argument smacks of disingenuity. How often have we read in this space constructions such as, “yet another excuse for The Pause?” Why, there’s even a scoreboard for it on this very website: http://wattsupwiththat.com/2014/09/11/list-of-excuses-for-the-pause-in-global-warming-is-now-up-to-52/
2) You cannot be relied upon to accurately state the IPCC’s tasking. Brace yourself, here comes the copypasta: https://www.ipcc.ch/organization/organization.shtml
The Intergovernmental Panel on Climate Change (IPCC) is the leading international body for the assessment of climate change. It was established by the United Nations Environment Programme (UNEP) and the World Meteorological Organization (WMO) in 1988 to provide the world with a clear scientific view on the current state of knowledge in climate change and its potential environmental and socio-economic impacts. In the same year, the UN General Assembly endorsed the action by WMO and UNEP in jointly establishing the IPCC.
The careful and honest reader will note that their own statement of purpose is a tad less narrow than yours.
3) Similar to above, your implied definition of “global warming” is narrower than the IPCC. Here’s another “ream” of that which you, not me, apparently does not “understand”: https://www.ipcc.ch/publications_and_data/ar4/syr/en/mains1.html
Definitions of climate change
Climate change in IPCC usage refers to a change in the state of the climate that can be identified (e.g. using statistical tests) by changes in the mean and/or the variability of its properties, and that persists for an extended period, typically decades or longer. It refers to any change in climate over time, whether due to natural variability or as a result of human activity. This usage differs from that in the United Nations Framework Convention on Climate Change (UNFCCC), where climate change refers to a change of climate that is attributed directly or indirectly to human activity that alters the composition of the global atmosphere and that is in addition to natural climate variability observed over comparable time periods.
Warming of the climate system is unequivocal, as is now evident from observations of increases in global average air and ocean temperatures, widespread melting of snow and ice and rising global average sea level (Figure 1.1). {WGI 3.2, 4.8, 5.2, 5.5, SPM}
Heck, the IPCC definition of “climate change” is even broader than the UNFCCC in that the IPCC explicitly includes changes attributable to “natural variability” within the purview of its assessment interests.
The careful and honest reader will note that global surface temperature anomaly is not the only indicative metric cited, much less bulk upper air temperature. The same reader will perhaps scroll further down the same page and find …
Observations since 1961 show that the average temperature of the global ocean has increased to depths of at least 3000m and that the ocean has been taking up over 80% of the heat being added to the climate system.
… which serves to explicitly include vertically averaged bulk observations in reference to “ocean temperatures”, not just surface trends. It may also occur to the numerate reader possessing even a passing familiarity of the physical sciences that “80% of the heat being added to the climate system” might be a better candidate for a single best indicator of “global warming” due to ANY cause on the basis that the most obvious place to look for net energy gain/loss in a system is in its largest heat sink. With that in mind …
http://climexp.knmi.nl/data/iheat2000_global.png
… and noting that energy accumulation in the upper two kilometres of ocean has not only continued unabated since 1998, it appears to be accelerating over that interval — which rate increase is evident all the way back to the beginning of the satellite era. If there’s any call to be obsessed with post-1979 trends to the exclusion of all other indicators, that plot would have my vote.
Pause, slowdown, hiatus, plateau … what have you … in surface and bulk troposphere temps? Depending on choice of recordset, more arguable in some than others. Global warming hiatus since 1998? Where the bulk of energy is going suggests: arguably no.
4) The climate system could care less how you, I, anyone defines “this discussion”. Reality simply is. Our limited perception of reality is, and will always be, wrong; not least because it will always be incomplete. The best way I know of to ameliorate ignorance of the unknown is the exact opposite of being staunchly fixated on two decades of instrumental data when more than 15 decades are available, and ignoring more recently available data which better represent net flux into and out of the system.
The careful, honest, truth-seeking, properly sceptical reader will likely understand that distinction.
Funny how “killer lists of questions for climatologists” rarely bring up that particularly successful prediction.
I predict that the sky will always be blue. Funny how when people prove I’m wrong I can, apparently, still say that it’s blue for at least 40% of the day on a lot of days in a lot of places, so my science (all my data points are at noon for three months in the summer on the equator!) can’t be refuted.
Sorry, if you make a large set of predictions, and one of them is shown to be false, the hypothesis and/or model needs to be disregarded until it can be retooled to not fail that prediction type in the future. You don’t get to imply scientific disrepute by disregarding how the scientific method works.
… as well as normal decadal-scale internal variability which the CMIP5 RCP ensemble runs do not attempt to predict. As many here have noted, this latest solar cycle is a bit dimmer than the last few, something else AOGCMs don’t attempt to predict.
Let’s just follow this line of reasoning:
Because the models aren’t designed to take into consideration several large parts of our climate system we should give them a pass when they fail miserably and continue to consider them useful tools? You just dismissed ENSO, the AMO, the PDO, and solar fluctuations. By extension, the water cycle – including how water and carbon dioxide, as well as clouds, interact with the climate – was also just dismissed because that’s not properly modeled either. Not to mention that aerosols are treated as linear effects, as well. What’s left in the model that could be considered reliable for temperature prediction?
Continuing on, you imply that all of that is a known limitation which ultimately doesn’t matter. So, we should just assume that the models are robust and make policy decisions because….?
That depends on which observations you’re comparing to the models, and how up-to-date you are on the current state of CMIP5 (see above).
Have the current models taken it upon themselves to even test predictions against the temperature record going forward? See, that’s how you check that a model works in the first place – testing against observations. Hind casting might tell you that you are in the ball park, but that means nothing going forward.
But, of course, there is no rigorous testing against the future in steps to make it more and more accurate. Models ‘advance’ by going “Hey, we noticed process X wasn’t in our models, so we did to add it in.” And then it’s published and integrated into the model. There is no 10 – or even one – year period where they actually test this equation set within the model and refine it’s interdependence in the climate system before they run their model and publicly proclaim that “Our new model, the most realistic model yet, says that the earth will be lost in fire by 2010/2030/2050/2100.”
No. Alright? Just – no. This is not science. If this was a single concern, I would probably accept it. If this was even a handful of concerns, because of the complexity of the climate system, I would probably accept it. But, no – in every single piece and part of the catastrophic warming hypothesis, there is a significant and rampant issue. Hand waving one or two issues away as mere technicalities? Sure. All of them? No.
And then, quoting an abstract that specifically cherry picks what it wants to count (and which is then used as the primary political sound bite to quell dissent) and pretending that it somehow invalidates the point Monkton makes is nothing but a straw man. His point was precisely what you avoided: Why are so few papers in the body of research counted when the vast majority of them take no position at all?
This is bad politics using a bastardized version of scientific discovery to cloak itself as legitimate. How many times must we do this before we learn? How many deaths will we commit in the name of sciencized politics and crony governmentalism until we stop this charade? Have we learned nothing from eugenics? Lysenkoism? Soviet statistics? DDT?
Arsten,
Funny how simple it is to skewer a strawman.
All models are always wrong.
Hear hear.
No. A particular model run (or experiment) shouldn’t be expected to do something which is
a) apparently unfeasible at present
b) not consistent with their expressed purpose
An centennial-scale RCP projection is not going to be able to reliably tell us the min and max temperatures in downtown Toronto on a given day in 2100. At present, the centennial-scale CMIP5 ensemble hindcast, which used a common set of historical natural and anthropogenic forcings …
http://4.bp.blogspot.com/-WGX4QGtowJo/VrO2ze8qVWI/AAAAAAAAAlY/R1w630Lh32U/s1600/HADCRUT4%2Bvs%2BCMIP5%2BRCP8.5%2Bregression%2Bmonthly%2B2015-12.png
… runs about 9% hot compared to HADCRUT4. When scaled to fit that observational dataset, the ensemble reproduced 12 month trailing mean surface temperature anomalies within +/- 0.21 K of reality according to HADCRUT4. That gives me a rough idea of the best I could expect them to predict the future, IF and ONLY IF the same natural and anthropogenic forcings were known beforehand at the same or better level of certainty as used in the hindcast. Which is of course a ridiculously impossible expectation — I’d like to see you predict TSI at monthly resolution with less than 5% error out to 2100. Don’t forget to include every major volcanic eruption and their effects on aerosol optical depth, precise predictions of changes to surface albedo … not to mention exactly how much CO2, methane, ozone, CFCs will be in the atmosphere for each and every month until then due to human activities and natural responses to them.
Prediction of all those relevant factors is impossible, and also not the point. The RPCs are what-if scenarios. The best expectation is that RCP8.5 * 0.92 would come within +/- 0.2 K of HADCRUT4 if that scenario played out more or less exactly as conceived. The “actual” uncertainty is probably much larger, for reasons not limited to ones you mention further down.
No, you just invented another false argument again. ENSO, AMO, PDO, etc. are manifestations of internal variability. As the name implies, one component of internal variability is redistribution of energy within the system, however each of those oscillating phenomena contain a component of net flux in/out of the system as well. The general assumption has been that those cycles net out to zero over sufficiently long periods of time, thus the models used in the CMIP5 ensemble for centennial-scale projections proceed from the notion that those cycles will stay more or less within historical (instrumental) boundaries. Hence the common saying in the climate modelling community that climate is a boundary value problem, as opposed to weather forecasting which is an initial conditions problem. Or in Lorenzian chaos-speak, climate is the attractor and weather is the butterfly.
Obviously this assumption suffers no lack of critics and detractors, a few of which I consider well-informed enough to actually pay serious attention to. For example, with respect to AMO, there are concerns published in primary literature that large fresh-water influx from Greenlands diminishing ice cap are affecting thermohaline circulation in the north Atlantic, thus weakening the Atlantic Meridional Overturning Circulation (AMOC). There is a much-derided (and deservedly so) movie sensationally exaggerating the NH cooling which is expected to occur if the AMOC experiences a near or total “collapse” and “shutdown”. More level-headed and better-researched conclusions think AMOC shutdown isn’t likely any time during the 21st or 22nd century due to global warming, but cannot entirely rule it out either.
The concept IS a good example of a significant boundary value change that might very well throw forward-looking models all but completely off the scent. I personally think tempting Fate by nudging the attractor toward conditions not seen during the course of industrialized civilization is imprudent. YMMV.
AR5 cites clouds as one of the largest modelling uncertainties of the lot, and I very much don’t dismiss it.
I’m not entirely sure whether that is correct or incorrect.
I presented my case above. My question to you is: since you think “the models” are so awful, in the name of all that is prudent and rational, why are you not standing on my shoulders shouting from the rooftops that it might not be the brightest idea we’ve ever had to be changing the radiative properties of the atmosphere?
You infer wrongly.
In addition to my above appeal to common-sense and instincts of self-preservation in the face of uncertain possible futures (yes, plural):
a) CMIP5 centennial-scale hindcast/projection runs do not represent the sum total of what we think we know about past and present climate
b) hindsight is, if not 20/20, certainly better than driving blind-folded at top speed after dark in the fog on an unfamiliar road toward a sharpish curve
c) that the warming has taken some time to spool up suggests a similar lag for slowing it down
d) policy is probably more responsive to our influence than (c)
e) conversely: (c) is probably less responsive to (d) than we’d like
f) an ounce of prevention is worth a pound of cure
g) shoot first, ask questions later (or in the words of the previous administration: we don’t want the smoking gun to be in the form of a mushroom cloud)
Funny how this issue flips some stereotypical political attitudes on their heads, innit.
They are constantly being re-evaluated, re-tested, debugged, re-programmed, fed the latest observational data, etc. Much evidence of those activities is frequently published by our host himself in this very forum.
You don’t say. I bet nobody in the climate modelling community understands that very basic elementary principle. I’ll get right on it myself and sort them out for you.
Hindcasting is a form of testing against observations, and I agree with you, it does not guarantee future reliabilty — only suggests it.
Again, I marvel that one so down on “the models” as you apparently thinks that’s the deciding argument AGAINST policies designed to reduce emissions. I daresay it’s darn near bonkers.
If evidence of the future were so easy to obtain, we wouldn’t be having this discussion.
True.
1 year’s time is weather. 10 years is barely better. The WMO defines climate as the 30 year statistics of weather, but with observed oscillations on the order of 60-80 years over the instrumental record I would hesitate to make strong conclusions on timescales much shorter than that. You want to wait around a half-century to make sure the models you’ve just thrown under the bus are wrong? Go right on ahead. Just keep in mind that uncertainty is a two-faced beast.
In the meantime, I’ll be observing how things go for you from my spare planet.
The latter is what you would do well to think about. All models should be simple as possible, but no simpler. A renowned scientist allegedly said that. It makes sense to me regardless who said it.
Sweeping generalization is best used sparingly. Appeals to mass hysteria are no less fallacious than arguments from incredulity. Implicit demands that science must be nearly perfect … isn’t very scientific, and would in fact tend to negate the need to do science in the first place. In my not-humble opinion.
“97% of scientists” is the strawman. Cook (2015) makes no such claim. One might say Monckton et al. are clutching at straws here. Again. As usual.
66.4% of abstracts assessed by Cook & Co. themselves did not have a clear position. In the second phase of the study, where the authors themselves were asked to classify their own paper, only 35.5% took the agnostic position. That leaves 64.5%, 97.2% of which were self-rated as supporting AGW, or 62.7% of total responses. That leaves 1.8% of self-rated papers expressly rejecting AGW. In tabular form:
You want to howl that 62.7% is better representative of “the consensus” than 97.2% of papers which took an actual position? Fair enough, but let me ask you; why the thundering silence about the measly 1.8%?
It’s not entirely clear to me that you have learned any lessons from those very same things. You will note that Cook (2015) was a response to claims made that no AGW consensus existed in literature. Now the goalposts have been moved to “97% of [all] scientists” do not endorse AGW.
99.9999% of climate literature (give or take a few decimal places) are not about “consensus” of climate researchers at all, they’re about the planet itself — most of it published in for-profit journals in the finest tradition of free-markets everywhere. THAT’S Lysenkoism?
Wake up.
Does Brandon have a day job, or is this it?
MarkW asks:
Does Brandon have a day job, or is this it?
I’ve asked that myself. Commenting 24/7/365 on WUWT (and that doesn’t include all the other blogs he posts on) appears to be a full time job, with overtime. A few explanations come to mind:
• Inherited enough loot to do this day in and day out?
• Paid to argue alarmist globaloney?
• Proselytizing his eco-religion?
Maybe there are others that didn’t occur to me. But it’s certainly his full time job.
[snip – off the rails- quit it – Anthony]
The straight-man foil works best when one doesn’t edit out the farce.
Brandon Gates:
You say to Arsten
NO! I have refuted that falsehood when you have posted it previously.
A model is right when it makes predictions that agree with observed reality to within the estimated inherent errors of the predictions and the observations.
A model is wrong when it fails to make predictions that agree with observed reality to within the estimated inherent errors of the predictions and the observations.
Scientific models that are wrong are rejected for use until they can be and have been adjusted to be right.
Climate models are wrong. None of them is fit for use except as heuristic tools.
Please desist from posting stuff which you have already been informed is not true.
Richard
richardscourtney,
A model that is never wrong is called reality.
That is called a useful model:
http://www.climate-lab-book.ac.uk/wp-content/uploads/cowtan.png
Note that reality according to HADCRUT4 lies within the uncertainty bounds of the post-2005 projections, even prior to the adjustments made to the model (NOT observational) data. Figure from Cowtan et al. (2015): http://onlinelibrary.wiley.com/doi/10.1002/2015GL064888/abstract
Co-author Ed Hawkins explains findings: http://www.climate-lab-book.ac.uk/2015/an-apples-to-apples-comparison-of-global-temperatures/
Read your own words “inherent errors” again. Carefully.
What a load of rubbish. The general process is that models improve as they are used and the ways in which they are wrong are discovered.
Yes, by definition.
Ok, and the heuristic suggests that if CO2 levels stabilized, so would long-term temperature trends. One does not need to know how hot it MIGHT get IF CO2 doubles to understand that the question is moot IF CO2 levels don’t continue to rise.
Not for the first time I wonder if your “confusion” is NOT deliberate.
Seek to amend your own behaviour before calling others’ into question.
Looks like Brandon has spent his time away gathering even more meaningless charts.
Brandon, you quote the Abstract for Cook’s 97% claim, but fail to contradict Monckton’s point that only 64 papers agreed with the official “consensus” proposition that recent warming was mostly manmade.
This is no doubt because you know full well what he says is correct.
The SkS website provides an analysis tool which shows how many studies fit into which category.
Under “Explicitly endorses and quantifies AGW as 50+%”, it lists 65 papers (not 64!):
As we all know, most scientists would accept that man has some effect on the climate, even if it is only UHI or Land Use, so what the Abstract claims is pretty meaningless.
In Cook’s Introduction of the paper, he states:
We examined a large sample of the scientific literature on global CC, published over a 21 year period, in order to determine the level of scientific consensus that human activity is very likely causing most of the current GW (anthropogenic global warming, or AGW).
Plainly, under his own terms, the level of consensus he has found is vanishingly small!
Since you have chosen to grossly mislead readers on this one particular point, I can’t see any point in wasting time looking into your other allegations.
Well done, Paul. That is a great consensus rebuttal sound bite.
Paul Homewood,
You fail contradict the point of my rebuttal, which is that “‘97% of scientists’ believe recent global warming is not only manmade but dangerous?” is a strawman, and which Cook (2015) does not claim.
Gee, isn’t this a fun game. Ok, I have no doubt that you deliberately missed the point because you know what Monckton said is deliberately misleading.
In the grand scheme of things, I think if one wants to understand what’s going on with climate, Cook (2015) would be the least priority in the reading queue.
62.7% of self-rated abstracts explicitly supporting AGW is vanishingly small? Since when did over half become tiny?
Yeah, whatever.
Amusingly, there were 10 “killer questions” on this list, 9 of which actually more or less dealt with the actual science, all of which I answered. But you can’t be bothered to deal with those. Not that I personally would ever rush to judgement on such thin anecdotal evidence — but were I so inclined, I might conclude that I’m 90% science and 10% politics, while you’re 100% politics.
At any rate, one wonders which looks more like propaganda.
Brandon Gates:
Having twice copied and pasted two loads of irrelevant twaddle, you now try further deflection by attempting discussion of the definition of irrelevant.
The facts are that up to a year ago the so-called ‘consensus’ agreed the Pause existed and had posted dozens of mutually exclusive excuses for it. Since then, the data sets of global average surface temperature anomaly (GASTA) have been adjusted to erase the Pause, and the ‘consensus’ have changed their narrative to say the Pause did not exist (“We have always been at war with Eurasia”). But the reality is that (as I referenced, cited, linked and quoted) the most recent IPCC scientific report (IPCC AR5 WG1) discussed reasons for the “the cause of the observed GMST trend hiatus” (i.e. the Pause).
Nothing you copied and pasted to here addresses those facts but – you admit – was posted to support the new narrative (“We have always been at war with Eurasia”). Your posts were merely irrelevant and long-winded bloviation.
Richard
richardscourtney,
As I replied previously: 1) Your argument smacks of disingenuity. How often have we read in this space constructions such as, “yet another excuse for The Pause?” Why, there’s even a scoreboard for it on this very website: http://wattsupwiththat.com/2014/09/11/list-of-excuses-for-the-pause-in-global-warming-is-now-up-to-52/
Thank-you for making your true argument explicit.
As I have also quoted previously: Warming of the climate system is unequivocal, as is now evident from observations of increases in global average air and ocean temperatures, widespread melting of snow and ice and rising global average sea level (Figure 1.1). {WGI 3.2, 4.8, 5.2, 5.5, SPM}
GMST is not the sole indicator of energy gain/loss in the climate system.
The reality is that you conveniently leave out salient points in your selective quotations. Very next paragraphs:
Internal Climate Variability
Hiatus periods of 10 to 15 years can arise as a manifestation of internal decadal climate variability, which sometimes enhances and sometimes counteracts the long-term externally forced trend. Internal variability thus diminishes the relevance of trends over periods as short as 10 to 15 years for long-term climate change (Box 2.2, Section 2.4.3). Furthermore, the timing of internal decadal climate variability is not expected to be matched by the CMIP5 historical simulations, owing to the predictability horizon of at most 10 to 20 years (Section 11.2.2; CMIP5 historical simulations are typically started around nominally 1850 from a control run). However, climate models exhibit individual decades of GMST trend hiatus even during a prolonged phase of energy uptake of the climate system (e.g., Figure 9.8; Easterling and Wehner, 2009; Knight et al., 2009), in which case the energy budget would be balanced by increasing subsurface–ocean heat uptake (Meehl et al., 2011, 2013a; Guemas et al., 2013).
Owing to sampling limitations, it is uncertain whether an increase in the rate of subsurface–ocean heat uptake occurred during the past 15 years (Section 3.2.4). However, it is very likely that the climate system, including the ocean below 700 m depth, has continued to accumulate energy over the period 1998–2010 (Section 3.2.4, Box 3.1).
http://climexp.knmi.nl/data/itemp2000_global.png
Oh look, since 2010 it’s kept right on going.
Twice now you have been thoroughly rebutted and refuted on these points. Wake me up when you’re ready to honestly deal with what the IPCC says about the science, and how empirical evidence is consistent with the FULL context of what’s written in AR5.
Brandon,
Your answer to #1 “The sun.”
The question was not “what is the source of the warmth?” it was “what is the source of the warming?”
“Warming” is an increase in “warmth”. Your attribution of that warming to the sun is contrary to AGW orthodoxy and makes you a “doubter”.
As for your ‘Define “a lot”‘; It was clear that Monckton had considered the amount of warming “a lot less” and it was therefore defined. You could just say “I don’t think that’s a lot.”
mebbe,
My über-pedantic, hair-splitting nit-picky semantic response remains: the Sun.
Nice try, but no dice. Show me a warmunist who thinks we wouldn’t freeze solid if the sun winked out tomorrow and I’ll reserve the padded room for him or her myself.
Why anyone continues to “ask” this question as if it were in earnest is quite beyond me. The textbook answer as I understand it is:
CO2 and other GHGs impede the loss of radiation from the surface to roughly the level of the tropopause, thus reducing the rate of heat loss and causing a net energy flux imbalance in the downward direction. All else being equal, solar energy accumulates, causing a rise in temperature until outbound radiation — which varies as the 4th power of temperature — increases to the point that radiative balance is restored.
The proximate cause for most temperature rise since 1950 is rising CO2. The ultimate cause is still retained solar energy. I’m not such a stickler for chain of causality that I would invoke the Big Bang.
Thus neatly demonstrating why I am a stickler for quantification over qualification whenever possible, which in this case it is. I’d say the Viscount’s argument would much improve if he weren’t promoting the absurd notion that 19 years of flattish bulk upper air temps somehow falsifies AGW, but the other 9 arguments aren’t much better — I thought “the ocean [is] warming from below” was a real howler. Where does he get this stuff?
Mr Gates makes an ass of himself as usual. To take just one of his points, Cook et al. eventually circulated their datafile showing how they had marked each of the 11,944 papers whose abstracts they read. That datafile marked only 64 papers out of 11,944, or 0.5%, as having stated that recent warming was mostly manmade – the official definition of the “consensus” proposition, and one that they had themselves stated in the introduction to their paper. Yet by a series of statistical prestidigitations they reported this as 97.1%. The fact that Mr Gates finds such flagrant academic misconduct acceptable casts doubt upon the rest of his garbage.
Brandon Gates and Simon:
Brandon, you have replied to my complete rebuttal of the screed of irrelevant stuff you copied and pasted to here by posting more irrelevant stuff you copied and pasted to here. I refer you to my rebuttal and ask that you read it because if you had then you would not have posted another long and irrelevant load of stuff.
Simon, I agree that posts by Brandon are “hugely funny” but despite your request I will continue to make posts that are relevant and, therefore, I will not copy Brandon’s behaviour.
Richard
Brandon, in one click.
richardscourtney,
You have an odd definition for the word …
ir·rel·e·vant
adjective:
not connected with or relevant to something.
synonyms: beside the point, immaterial, not pertinent, not germane, off the subject, unconnected, unrelated, peripheral, extraneous, inapposite, inapplicable; unimportant, inconsequential, insignificant, trivial;
off-topic;
You see, when I’m not using my own words — and the above sample clearly clearly fits the bill — it’s usually to demonstrate that whomever I’m replying to is simply making stuff up. This is (another) one of those times. It’s one way honest people stay grounded in reality, a concept I have not much doubt is troubling to you as we humans often become uneasy in the presence of unfamiliarity.
The preceding paragraph contains my own words. Should you again wish to deflect by claiming I copied them from elsewhere, you might do well to demonstrate how it is you have reached that conclusion. Else, we will have yet another example of your apparent willingness to write patent falsehoods, and repeat them ad naseum as if they had never been soundly rebutted. As I said previously, I think you’ve learnt the wrong lesson from Orwell a little too well.
Just in case you’re feeling particularly slow on the uptake today, the prior paragraph was also written by me, and not copied from elsewhere.
Lather. Rinse. Repeat. At some point, you might actually get it.
/recursion
Brandon Gates:
My rebuttal of your latest attempt to deflect from you having posted irrelevant bloviation is in moderation but it seems that it will appear in the wrong place. It is awaiting moderation here.
Richard
@Bob Highland
Well said. It’s my opinion that a true scientist or truth seeker relishes the moment when a widely held hypothesis found to be untrue. It should be a moment of great revelation and celebration when contemporary human understanding is turned on it’s head. They refuse to see the humility of man and our feeble understanding of the universe.
The following is the conclusion subsection of my latest book “Climate Change & its Impacts: Ground Realities” [by Dr. S. Jeevananda Reddy, February 2016, Hyderabad/India]:
V.6.2 Conclusions
1. Data: To prove the theories related to global warming and thus climate change and their impacts on nature needs an accurate, evenly distributed in space and time network of stations that measure temperature and greenhouse gases at global scale. They must cover climate system and as well general circulation system. There is no such network before 1960s and even after 60’s, though, the network has been improved in number but they are not uniformly covered over space and time. Since 1979 though satellite measurements are available that covers climate system and general circulation system, warmists and modelers are not accepting them by saying that satellites do not measure temperature as they present far lower temperature trend over the ground based temperature trend. This must be resolved. However, individual nations must build accurate met data series for individual stations without indulging adjustments and provide the same for research institutions in the respective countries for agro-climatic and agro-meteorological analysis to assist in water resources and agricultural planning on which local economy depends.
2. Global Warming: From the definition of IPCC that the increased global average temperature anomaly since 1951 has two parts, namely (1) one caused by the greenhouse effect and (2) the other caused by non-greenhouse effect. The former’s contribution to the global average temperature since 1951 is extremely likely that more than half; and thus the latter’s contribution is less than half. Also, at the same time the anthropogenic greenhouse effect component has two components, namely (1a) the anthropogenic increase in greenhouse gas concentrations and (1b) the other anthropogenic forcings. (1b) is associated with volcanic eruptions and associated aerosols — a natural phenomenon — and man induced aerosols. (2) For this a new entry is filth — covering oceans & land surfaces –. However, IPCC is not sure of the quantitative contribution of these three groups on the global temperature. Thus, global average temperature anomaly is not global warming.
Historical temperatures versus carbon dioxide relationship to date show an opposite to Global warming theory, wherein warmer waters of the ocean release carbon dioxide in to the atmosphere and cooler waters of the oceans absorb carbon dioxide from the atmosphere with a time lag. Thus ocean acidity changes accordingly. Also recent studies showed the carbon dioxide life in the atmosphere is limited to 40 years and not to 1000 years. Also, IPCC through trial and error process continuously is reducing the sensitivity factor of converting energy in to temperature in carbon dioxide bands.
The global average temperature anomaly presented hiatus/pause for the last 19 years. Though the global average temperature anomaly was built from spurious data, data managers to remove this hiatus-pause adjusted the data series. The data managers lowered the past data and the current data was moved upwards. This type of data manipulations also effects the natural inbuilt oscillations and thus affects the weather forecasting mechanism world over. This will be a major disaster in coming decades, unless we stop harping on global warming and its impacts. We must remember the fact that the global average temperature anomaly doesn’t reflect the condition of a location-region and thus its impacts on nature at that location-region. To get better insight in to the problems and thus take remedial measures, the location-region specific studies must get priority.
Thus there is no global warming as such. The word global warming is a misnomer. The global average temperature is sum and total of widely varying patterns over the globe. This average consists of several components with location-region specificities. Global warming component is only one part of this average and that too it is also a location-region specific activity with negligible contribution beyond 280 ppm as all the light emitted by the surface in the strongest carbon dioxide bands was completely absorbed at pre-industrial levels [< 280 ppm] and thus the Earth stabilized at 15 oC.
3. Climate Change: Climate change is real. Climate change is not global warming. Climate change was there in the past and will be there in the future. We need to adapt to them. Climate change is highly location-region specific, interwoven with the climate system and general circulation patterns. They form part of all meteorological parameters, more particularly precipitation and temperature. Wind & pressure are part of general circulation pattern. Indian rainfall is topography specific, which is part of climate system. Natural variability form the main part of climate change. The local-regional changes do influence these natural cycles.
The so-called impacts on nature such as floods-droughts, cold waves – heat waves, ice melt-glaciers retreat, sea level change [rise-fall], etc were there in the past and will be there in the future, as they are part of natural variability in climate change and also they are climate system-general circulation system specific activities. Natural variability plays the critical role in success and failure of Water resources availability and agriculture. This has lead to change in civilizations-migrations, changes in the course of mighty rivers, etc in the history over different parts of the globe. However, they are modified with natural disasters associated with volcanoes, earthquakes; etc coupled with modern human greed related activities over different parts of the globe.
Therefore, governments & UN agencies must encourage agroclimatological and agrometeorological studies using location-region specific data. There is an urgent need to consolidate the natural cycles in precipitation and temperature over different parts of the globe for better planning in water resources utilization and planning for agriculture.
4. Truncated data series: If a given data series present a cyclic variation, a truncated part of the cyclic variation present misleading inferences. This is exactly what is happening in many research reports using meteorological data series that were given hype by media world over. Indian Southwest Monsoon precipitation data and the global average temperature anomaly present 60-year cycle [presented in previous Parts of the book]. 60-year cycle means a sine curve of 60-years. In the sine curve by joining minimum to maximum it shows a steep rising trend; and by joining maximum to minim it shows a steep falling trend. The global average temperature anomaly presents both trend and superposed on it the 60-year cycle. The trend shows 0.6 oC per century rise. If we select the minimum to maximum period of sine curve, it shows there is steep increasing trend; the surface temperature data anomaly during the satellite period [1979 to date] shows exactly this. If we select maximum to minimum period of sine curve, it shows there is steep falling trend; exactly this has happened when a minister informed the Indian parliament that the southwest monsoon precipitation is decreasing.
5. Pollution: Individual governments and UN agencies must give top priority in reducing/controlling pollution [air, water, soil & food] and as well minimizing food waste. Pollution is the root cause of health hazards world over. In India adulterated food joins the pollution.
Stefan Molyneux uses stock brokers as a metaphor to explain why he changed his mind about Climate Change.
http://youtu.be/3QmkHr0W5Vk
Very interesting speech by Mr. Molyneux.
Here is a something which puts in into perspective.
https://youtu.be/4kib9asbp6s
Regards,
WL
Here’s something that puts the politics of CAGW in to perspective:
“Power tends to corrupt and absolute power corrupts absolutely. ”
There is no “tends” for absolute power. Absolute corrupts everyone who gets it. Other than that minor misquote a lucid and well thought out position. You get the behaviour you reward.
In Lord Acton’s letter to Bishop Creighton, he wrote:
You’re stating exactly what it says;
Power tends to corrupt…
absolute power corrupts absolutely.
Two thoughts in the one sentence.
Interesting that the climategate mob at CRU are ignored. Does this mean they are no longer considered important enough to be mocked? Surely they haven’t been forgiven?
Superb article. Thank you very much.
Interesting that the CRU crowd are not part of the.cartoon. Are they no longer considered important enough to count. Surely they haven’t been forgiven: forgotten?
AlanK
Too many questions and only one is necessary for alarmists and Luke warmists alike:
Why does the planet Venus show zero greenhouse warming despite almost it’s entire atmosphere consisting of CO2?
Responses that cite Venus’s surface temperature rather than its temperature at 1000mb are to be taken as proof of the respondent’s corruption or incompetence.
Is there any reliable evidence that overall global temperatures have dropped in modern times ( say the last 50 years) , or even stayed level? There seems to be a fair bit of evidence that they have indeed risen. Is there any evidence that they will fall in the near future?
If Lord Monckton could refer to good sets of evidence that answered these basic question in a manner which supported his claims he would probably get more support outside this blog.
How about the period between 1960 and 1979? http://weatheradvance.com/home/weather/weatheradvance.com/wp-content/uploads/2013/03/GIS-US-temp-adjustments.gif
Of course you can start earlier than 1960, lol – and go to1979 http://weatheradvance.com/home/weather/weatheradvance.com/wp-content/uploads/2013/03/GIS-US-temp-adjustments.gif
The question is not whether temperatures have risen. They have. We have been emerging from the Little Ice Age for more than a hundred years.
The question is whether any part of the temperature rise is due to anthropogenic emissions of carbon dioxide.
I’m not worried about Christopher Monckton’s public support. In spite of a full court press by the alarmists, public belief in CAGW continues to slip. Once folks have heard enough hyperbole, misrepresentation, and outright fraud, they realize that what’s really going on.
Climate started warming before the end of the LIA. It started in the depths of the LIA, after the coldest part of the Maunder Minimum. But longer-term, the earth has been cooling since at least the height of the Minoan Warm Period, over 3000 years ago, but possibly since the Holocene Climatic Optimum, which ended around 5000 years ago.
“Why, if CO2-driven warming ought to warm the surface ocean first, is the ocean warming from below? And why has the ocean been warming throughout the eleven full years of the ARGO dataset at a rate equivalent to only 1 degree every 430 years?”
Good question. And can we really say that we know for certain that even with that data that the ocean is warming at all? Consider that one degree every 430 years is 0.0023255813953488372093023255813953 of a degree per year. *SMH*
But President Oboma said that 14 of the last 15 years are the warmest on record – unfortunately many believe him and the mainstream media. People in the west complain about outdoor air pollution, but the indoor air quality in many third world countries is far worse. Oh well, the greenies say, if they want electricity it must come from solar panels or windmills, not that nasty coal, even if the lack of electricity is shortening their lives. There is a direct correlation between energy poverty (especially electricity) and the average lifespan.
world wide extreme cold and snow from the last few weeks,
US- Weekend Cold Could Break Records
Iran – Snow and blizzard shut some northern areas
Kazakhstan – 208 people and 58 vehicles released from snowdrifts
Blizzard surprises Siberian motorists
Blizzard conditions expected in SE Massachusetts
Two refugee women freeze to death in Bulgaria
India – Heavy snowfall in higher hills of Himachal Pradesh
Turkey – 1,747 village roads closed due to heavy snowfall
Iceland – Most Roads in the West Fjord Remain Closed
Iceland Monitor – “We’re totally snowed in”
Accumulating snow for U.S. Northeast
Snowfall in China has broken all records of previous years
China – Heavy snow strands ‘nearly 100,000′ at rail station
Bangladesh – At least 286 children hospitalized with cold-related diseases in 24 hours
Trump says a threatened blizzard on caucus day could threaten his victor
Mexico – Coldest winter in history:
Heavy snowfall catches Saudis by surprise and joy
Blizzard warning for Iowa
Lighting fires under buffalo to keep them warm –
Vietnam – Record cold kills more than 50,000 livestock and poultry
Snowstorm to bury Denver, then move east
Heavy snowfall in Saudi Arabia
Winter storm – Blizzard warnings – watches for 13 states
Cold kills almost 2,000 cattle in northern Vietnam
Iran – 7,450 people injured due to snow
Mexico declares emergency in 23 states due to severe cold
Cold brings rare snowfalls to tropical Laos
‘First time ever’ snowfall in Kuwait
Big-time snowstorm to hit Rockies, Plains, Upper Midwest
Philippines – More cold on the way
Still Buried in Baltimore
Turkey looks like Siberia – Single-story houses completely buried under the snow
Fishing boats trapped in ice in China – Incredible photos
Vietnam – Worst cold in history of Nghe An Province
Pakistan – Biting cold brings life to halt
Thailand – More deaths reported from cold weather
Record snowfall in South Korea
Taiwan – Hundreds of people trapped by snow
Parts of Vietnam see first snow EVER
First Snow in Guangzhou, China in 88 Years
Thailand – Two die as cold bites Central region
Laos – Extreme cold in Northern Lao provinces
First snow EVER on Okinawa
Record snowfall in Japan
Hanoi – Coldest Spell In Nearly Four Decades
Moscow – Most January snow in 50 years
China battles snow and freezing cold
China – Worst cold in decades
Poland – Snow covers the entire country
China – Temperatures drop to minus 40C (-40F) and more
Heavy snow blankets western, central Japan
Cold kills more than 85 people in Taiwan
Record snowfall in New York City
Philadelphia – An entire winter’s snow in two days
Biggest snowstorm ever recorded for three cities
Second largest snowstorm in New York City history
Baltimore, New York City and D.C. Areas Buried Beneath More Than 2 Feet of Snow
Record snowfall and record cold in Japan
Taipei, Taiwan – First Snow in 80 Years
Eleven states declare states of emergency
Killer blizzard could be one of five worst in New York City history
All-out blizzard all the way from Virginia to Connecticut
Paralyzing blizzard could rank near top 10 to hit Eastern US
Panicked Shoppers Ransack Grocery Stores
Tennessee, Pennsylvania, Maryland, Virginia and North Carolina declare states of emergency
Potentially historic snowstorm, says Washington Post
Severe cold on Korean Peninsula
China – 90 percent of country gripped by extreme cold
India – Twang valley covered with a thick blanket of snow
Ukraine – 78 settlements without power
Heavy snowfall in Ankara, Turkey –
Major winterstorm expected in North and South Carolina
Blizzards in Moldavia – Entire villages snowbound
South Korea – Record power demand brought on by severe cold
Heavy snowfall in northern Japan – Residents evacuate
Mongolia experiencing dzud (mass death of livestock)
Japan – Heavy snowfall cuts power to more than 50,000
Heavy snowfall across Greece
Moscow has already DOUBLED normal January snowfall
Snowfall Wreaks Havoc in Ukraine
Ice freezes windmills in Sweden
Potential MONSTER snowstorm for D.C area
Continuous heavy snowfall in Kosovo and Albania
Luxembourg roads closed after trees collapse under snow
France – Snow and ice alert for 11 departments
Heavy snowfall closes roads in four Ukraine regions
Electricity cut to hundreds of towns in Bulgaria
Blizzard wreaks havoc in Romania
Snow and cold in Denmark
France on alert for up to 6 inches of snow
Snow on the road to Mecca
Canadian bridge splits due to extreme cold
It was so cold in Minnesota that camera batteries froze
Record cold in Finland
Heavy snowfall in Central Russia
Heavy snow paralyzes St. Petersburg
Heavy snowfall in South-West Iceland
Major snowstorm hits southern, central Finland
Freezing air heading to Northern Europe
Iran – Snow and blizzards in 12 provinces
Armenia snowfall much higher than average
Record number of turtles rescued from frigid waters off NC coast
Richard,
“Extreme”
What is your definition of “extreme” (in your weather report summary) ?
WL
record breaking,
of course it has probably been worse over the last 1000 years, Of course interesting to read when we have apparently had a warm January.
Richard, you left out a lot of stuff.
There are about 2,000,000 million towns and cities in the world. The expected conditions for each place and the actual conditions are not always the same. A description of how each expectation differed from its realization for one day could fill a library.
Expectations are not always satisfied, and sometimes they are exceeded. That’s “normal”.
😐
Reblogged this on Climatism and commented:
The most important and ‘inconvenient’ question in the climate debate, IMHO…
5: Why is the gap widening between warming rates measured by satellite and by surface datasets?
Equally, why the divergence between surface and satellites combined, to IPCC CMIP5 (overheated) models? Climate models that single handedly drive the trillion dollar “climate change” industry ?
3: Why do all the datasets, surface as well as satellite, show a lot less warming than predicted?
Partly because Lord Monckton is using a forcing scenario that did not transpire.
As the IPPC did not know how climate forcings would develop the 1990 report published 4 conditional projections under 4 scenarios. They labelled them A-D, and selected A as their ‘BAU’ case, meaning no controls on emissions and certain assumptions about economic growth.
With hindsight we can now look back and see which of the scenarios came to pass, and no it was not A. Forcings actually developed nearer to scenarios B & C, A turned out to be an overestimate. For a fair assessment we should examine what IPCC forecast under Scenarios B & C, but as they were pretty close to the actual temperature change, they have been silently airbrushed away by His Lordship.
But don’t take my word for it … “Scenario A was its business-as-usual scenario, and it had incorrectly predicted a far greater rate of forcing, and hence of temperature change, than actually occurred”
Source
Was the amount of CO2 was above what was estimated for the business as usual scenario? Using economic growth as an indicator of CO2 when we have actual measurements of CO2 seems rather silly.
Phil Clarke is, as usual, wrong. The head posting did not use any “forcing scenario”: it used the predictions made by the IPCC in 1990 on its “business-as-usual” case. The rate of CO2 emissions growth from 1990 till the present is actually somewhat higher than on the IPCC’s 1990 “business-as-usual” case, but the predicted rate of global warming did not occur. See the Technical Note in my monthly temperature updates for details and sources.
To understand the relationship between temperature and CO2, look at this WoodForTrees chart.
OK, that gets them off the hook to some extent:, but not entirely: They still made a climate-related blunder in over-estimating the release of methane.
Despite the attempt at re-writing history, actual CO2 growth has exceeded the worst case, business as usual scenario.
“In 2006 the late Professor Robert Carter, a down-to-earth geologist who considered global warming a non-problem, wrote in Britain’s Daily Telegraph that in the eight full years 1998-2005 the Hadley Centre’s global temperature dataset showed no global warming at all.”
Do we still have that pre-adjustment data set so that we can confirm Prof. Carter’s statement.
Check out this 11 year period, although a bit longer than you asked for:
http://www.woodfortrees.org/plot/hadcrut3gl/from:1998/to:2009/plot/hadcrut3gl/from:1998/to:2009/trend
Check out this 11 year period, although a bit longer than you asked for:
http://www.woodfortrees.org/plot/hadcrut3gl/from:1998/to:2009/plot/hadcrut3gl/from:1998/to:2009/trend
Good summary of SOME of the issues. The obvious feedback loop of rent-seeking investors and politicians and “scientists” seems a larger issue, and is what I think drives the controversy.
Never underestimate the importance of moral preening political correctness: “I CARE about the environment, as you can see by my support for the environmentalist position. If you disagree it can only be because you are a greedy selfish, overconsumer who is indifferent to dirty air. Therefore you should be on the moral defensive and silent in my presence as my ideas, and I, take precedence.”
Political correctness is the secular equivalent of Praying in Public, and that is not a mild effect in human affairs.
Q11: Does placing a candle in front of a mirror change the temperature of the flame?
If you’re indoors, it may change the brightness of the room you’re in (the Watts per square metre) but does the colour (read= temperature) of the flame change?
Simple enough experiment because most of us are able to distinguish all 24 million colours (out of a very narrow spectrum compared to the IR spectrum) that the machine we’re presently looking at can display and we have other machines miles better than our own eyes.
The result is……
It works if you put a mirror around the filament of an incandescent light bulb.
Lord Monckton says:
“In truth, we do not understand climate enough to make even an uneducated guess about how much global warming our adding CO2 to the air will cause. Other things being equal, we will cause some warming, but – based on actual measurements to date – not much.”
So we can’t make even an uneducated guess but we can tell that the effect will not be much. i don’t get that. Isn’t there something a bit inconsistent there?
There is no scientific proof that there even is an effect. The supposed effect is all model-based, not observation-based. Thus we fall back to the null-hypothesis.
You really should learn the difference between a projection and an observation.
We don’t know enough to make projections.
By observing the actual climate we can see that CO2 doesn’t make much of difference.
Alba:
It is perfectly consistent: we don’t know anything but “actual measurements to date” suggest.
Richard
“9: Why, if CO2-driven warming ought to warm the surface ocean first, is the ocean warming from below?”
________________
Who’s claiming that the global ocean is warming “from below” and is there any evidence for this claim?
As I understand the theory, the heating of the ocean is the result of the cool surface layer warming up. This reduces the temperature gradient between the warmer bottom and the cooler top of this very thin layer, slowing the rate at which heat can leave the ocean and enter the atmosphere.
DLR from increased greenhouse gases isn’t warming the ocean; the sun still does that. CO2 warming just slows down the rate at which accumulated solar heat is lost from the ocean. More heat energy is then available to be distributed through the ocean by currents, etc, causing the temperature to rise.
” CO2 warming just slows down the rate at which accumulated solar heat is lost ”
Do you think that the time element for the slowing of the rate of heat loss is about the same order of magnitude as the amount of time a room full of mirrors stays lit after turning out the lights?
Thomas,
The difference is that the ‘CO2 warming’ light doesn’t go out when the ‘lights’ do.
The increased DLR carries on 24/7. When the sun goes to bed the greenhouse gasses don’t even notice.
The ocean continues to receive its extra dose of warming at night as it does by day.
This is also how I understand the theory, but I have never seen a paper that quantifies the effect.
Simply multiplying the theoretical forcing from DWLW radiation by the surface area of the oceans must surely overstate the theoretical gain in OHC, compared to the indirect ‘insulating’ effect of warming the thin film layer.
Until I see such a paper the whole issue of potentially dangerous increase in OHC is simply alarmist hand waving.
Old’un,
Have you seen this paper (pdf): http://journals.ametsoc.org/doi/pdf/10.1175/1520-0426%282001%29018%3C0994%3ATMAERI%3E2.0.CO%3B2
DWR54 thank you for the link. I will read it with interest.
DWR54 The paper that you referenced deals essentially with measurement technique, but there is a later paper using a similar (or the same) instrument on a NZ research vessel (don’t have ref to hand) that takes the next step, of measuring the effect of downwelling radiation on the temperature gradient of the top few millimetres of ocean surface. I think that they used cloudy conditions to ensure significant radiation levels.
What I am still looking for is a paper that actually quantifies the reduction of ocean heat LOSS due to the change in temperature gradient caused by increased DWR from CO2. As this relates to 70% of the earths surface, it seems incredible to me that this calculation hasn’t been attempted despite the miriad assumptions that would have to be made in doing so. Without this figure, the jury is still out as far as I am concerned, on the magnitude of increased OHC due to rising CO2.
“What I am still looking for is a paper that actually quantifies the reduction of ocean heat LOSS due to the change in temperature gradient caused by increased DWR from CO2.”
I don’t think the loss can reduce. Almost all of the incoming solar must exit, else there will be rapid warming. The thing to quantify is how warm does the surface have to get to maintain the loss, taking account of DWLWIR.
Nick Stokes. Yet scary analogies such as so many Hiroshima bombs worth of heat being gained per hour would have everyone believe that heat loss must be reducing. The proposition is that this is due to the insulating effect of a change in the temperature gradient at the surface caused by the additional DWLWR from increasing CO2. Unless someone attempts to quantify this effect we cannot attribute the cause of the rise in OHC objectively.
I’m a long retired engineer knocking on eighty, I guess there may be a correlation between age and scepticism and I certainly don’t like to take important issues such as claims of potentially catastrophic climate change at face value. I like to dig to make my own judgement on the probability of them being soundly based. Understanding the numbers is an important part of this, hence my frustration at the apparent failure of the climate science community to put some to this critical mechanism.
You don’t fancy having a go?
Regards, Old’un
Nick Stokes:
You say;
“Almost all of the incoming solar must exit, else there will be rapid warming. The thing to quantify is how warm does the surface have to get to maintain the loss, taking account of DWLWIR.”
The surface temperature changes need not be great, and global temperature need not change.
Thermal energy has to be radiated to space and the energy radiated is in proportion to the fourth power of the temperature (i.e. T^4) of the radiating surface. Sea surface temperature (SST) has a maximum limit and, therefore, temperature rise is severely limited in the tropics. Any variation in the thermal distribution from the tropics towards the poles will alter the global radiative heat loss.
All the global temperature rise of ~0.8°C since 1900 could have resulted from a variation in the rate of thermal distribution from the tropics towards the poles.
Richard
‘Millions die worldwide every year because they do not have cheap, clean, continuous, low-tech, coal-fired electricity, to replace the wood, grass and animal dung fires they must use to cook their food and heat their homes. Given the growing and flagrant discrepancies between prediction and observation that we have revealed here for the first time, the moral case for defunding the profiteers of climate doom and redeploying the money to give coal-fired light and heat to the world’s poorest people is overwhelming.’
Non sequitur, Argumentum ad Misericordiam.
“Gamecock” appears to have a more than usually tenuous grasp of logic. If millions (or, on some estimates, tens of millions) are dying now because they are being deprived of fossil-fuelled electricity, and if – as is the case – part of the reason why they still have no electricity is the campaign against fossil fuels by Socialist elements in the West, then that campaign is contributing to their deaths. On the other side of the account, global warming that is not happening at anything like the predicted rate is not killing anyone. The utilitarian metric requires that we defund the global warming nonsense and spend the money instead on providing Africa with electricity, which would lift more people out of poverty per dollar spent than just about anything else.
It is a scandal that people like “Gamecock” can express their contempt for the world’s poor from behind a cowardly cloak of anonymity.
Thank you for your reply.
‘defunding the profiteers of climate doom and redeploying the money to give coal-fired light and heat to the world’s poorest people is overwhelming.’
Two different subjects. Defund the profiteers without the pity party. The lurch to “the world’s poorest people” does not follow from what preceded. Defunding the profiteers is not related to the worlds’ poor.
“contempt for the world’s poor”
More Argumentum ad Misericordiam. Please develop your case for building coal-fired plants, instead of appending it to unrelated thread without development. Your declaring my contempt is not like you; I’m sorry I have upset you. I consider you to be a very important person.
Over two dozen comments on this thread are from behind a cowardly cloak of anonymity. It’s the internet. Get used to it.
It’s is uncanny how often Christopher M starts his rebuttals with an insult. It’s almost like he is programmed to play the man before he thinks about the ball.
“Gamecock” appears to have a more than usually tenuous grasp of logic.”
“Stokes, as usual, wriggles like a stuck pig.”
Mr Gates makes an ass of himself as usual.”
Simon:
Factual statements are not insults.
The evidence presented in each case was more than sufficient to demonstrate that the following are examples of factual statements.
“Gamecock” appears to have a more than usually tenuous grasp of logic.”
“Stokes, as usual, [pruned]”
Mr Gates makes [pruned] as usual.”
Richard
Mods:
Simon posted statements which are not pruned.
I replied that those statements were justified but my copies of those statements in my reply have been pruned.
The pruning implies that I wrote other than the statements made by Simon: I did not.
Richard
[Noted. We are working through about 1200 comments a day. Takes a while. .mod]
Gamecock, who continues to lurk behind a cloak of furtive anonymity and cites the cowardice of others as the pretext for his own, is of course entitled to fail to see the connection between the Greenshirts’ hate campaign against coal, oil and gas and the lamentable lack of universal electric power, most notably in Africa.
However, as my lovely wife says, now that we’ve won the scientific argument it’s time to advance the moral argument, which is that perhaps tens of millions are dying worldwide – some of them even in the western countries – because of the Greenshirts’ vicious and unprincipled campaign against hydrocarbons.
Gamecock is entitled to look the other way and pretend there’s no connection. But he is not entitled to label a justifiable argument in favor of the victims of the Greenshirts’ policies as an argument from misplaced pity, because the pity is not misplaced. Back to the logic textbooks.
My contempt is for the rich who use “the worlds poorest people” as a shield.
The world’s poorest people are the indigenous people of the world. The UN says there are about 370,000,000 of them. They live in traditional ways, without modern medicine, electronic communication, without electricity.
They have a universally recognized right to be left alone. Yes, left alone, with high infant mortality, cooking with dried dung, and no electricity. Saying you are going to build them a power plant does not put you on the moral high ground. You could correct by saying you are going to build an electric plant for the world’s second poorest people, but that’s not the effect you were looking for.
Additionally, building coal-fired power plants is dependent on many things, like logistics, skilled labor, population density, security, and property rights. The idea that you are going to fix ‘Millions die worldwide every year because they do not have cheap, clean, continuous, low-tech, coal-fired electricity’ by plunking down power plants is naive – so much more must be fixed first.
‘cowardly cloak of anonymity’
More irrelevance; it refutes nothing.
It’s not a non sequitur as Lord Moncton has explained and it’s not an appeal to pity.
That millions die as a result of no access to cheap reliable electricity is not given as evidence that the dangerous human-induced global warming hypothesis is untrue, but as a consequence of policies based on that false claim.
Quote:
Therefore, if the surface has warmed in the past couple of decades, as the surface datasets now pretend, CO2 cannot have been the cause.
____________________________
But albedo could be the cause.
R
[snip . . you would need to supply evidence of that extreme claim . . mod]
A citation, please.
Sorry for formatting. Relevant testimony about halfway through the pdf document:
http://www.desmogblog.com/sites/beta.desmogblog.com/files/roy%20spencer%20peabody%20energy.pdf
IV.
SENSITIVITY VALUES
14
Q.
What is climate sensitivity?
15
A.
Climate sensitivity S is the warming in
degrees Kelvin (K) that would be
16
caused by a doubling of the CO
2
concentration. The
sensitivity S is defined
17
by the simple equation,
T= S log(C
2
/C
1
)/log(2), where
T is the warming
18
caused if the atmospheric concentration of CO
2
increases from the initial
19
value C
1
to a final value C
2
.
20
Q.
How are climate sensitivity values determined?
21
A. Ideally, climate sensitivity shoul
d be determined by experimental
22
observations of how changes of the
Earth’s temperature are related to
23
changes in the concentrations of CO
2
in the atmosphere. In practice this is
24
very difficult since many other
factors besides atmospheric CO
2
affect the
25
Earth’s temperature. These factors,
few of which are understood very
26
William Happer Direct
OAH 80-2500-31888
MPUC E-999/CI-14-643
7
6986686
quantitatively, include solar influences
, clouds, aerosols, volcanos, massive
1
ocean instabilities like El Ninos, etc.
2
One can also try to determine the sens
itivity purely theoretically, with the
3
aid of computer models that include
as much of the climate physics as
4
possible. The physics, including clouds
and complicated fluid flow in the
5
atmosphere and oceans, is so complicat
ed that few scientists have much
6
confidence in purely th
eoretical calculations.
7
Q. What is the track reco
rd of climate models used by the IPCC that have
8
tried to predict cl
imate sensitivity?
9
A.
Nearly all of the IPCC
climate models have pr
edicted several hundred
10
percent more warming over the past tw
enty years than has actually been
11
observed. There is something seriously wrong with the models.
12
Q. What are “feedbacks”?
13
A. Feedbacks are changes in the atmosphe
re that amplify (positive feedback) or
14
attenuate (negative feedback) the dir
ect surface warming from changes of
15
CO
2
. For example, if more CO
2
induces more high-a
ltitude water vapor or
16
cloudiness, it would amplify the warming and there would be a positive
17
feedback. If more CO2 were to indu
ce more low-altitude clouds, they would
18
reflect more sunlight and keep the su
rface from heating as much as before.
19
This would be a negative feedback.
20
Q. What is the impact of fee
dbacks on climate sensitivity?
21
A. With no feedbacks, doubling CO
2
concentrations will increase the average
22
surface temperature by about S = 1 K.
The IPCC has used large positive
23
feedbacks to claim “most likely” doubling
sensitivities of S = 3 K or larger.
24
Models with such large doubling sensitiv
ities have predic
ted several hundred
25
per cent more warming than has actually
been observed over the past 10 to
26
William Happer Direct
OAH 80-2500-31888
MPUC E-999/CI-14-643
8
6986686
20 years. Observations are consistent
with little, and perhaps even negative
1
feedback, corresponding to doubling se
nsitivities of S = 1 K or less.
2
Q. What do IPCC climate models assu
me as to climate sensitivity values?
3
A. The IPCC states, “equilibrium climate
sensitivity is likely in the range 1.5 K
4
to 4.5 K (high confidence).”
5
Q. In your opinion, are these assu
med values accurate and reliable?
6
A. Even the lower limit, 1.5 K, is hard
to reconcile with the almost complete
7
lack of warming since the year 1998.
8
A.
In your opinion, what is the proper
range for climate sensitivity values
9
based on the latest scientific literature?
10
A.
My opinion is that the sensitivity is
somewhere between S = 0.5 K and S=
11
1.5 K, with a most likely value close
to the feedback-free sensitivity, which
12
is approximately S = 1 K.
[We cannot make sense of this entry, nor can other readers.
1. Select all of this text, or, from your original text document, select all of this text, and copy it to your PC buffer.
2. In a text editor or MSWord saving as text only, remove the “Carriage return” scripts (html coding) from the end of each line, or where they reside in the text.
3. Go to the “Test” thread in this web site, and “test” your corrected text. When satisfied, THEN return here and re-post.
The mods will leave this up for a bit, then delete it later. .mod]
Thank your for the response, but I don’t think that’s it.
What Dr. Happer said in that testimony was, “My opinion is that the sensitivity is somewhere between S = 0.5 K and S=1.5 K, with a most likely value close to the feedback-free sensitivity, which is approximately S = 1 K.” This feedback-free sensitivity doesn’t seem far off from the 5.35 x ln(2) / 3.2 = 1.16 degrees Celsius the authors contended in their “irreducibly simple” paper that the consensus value is.
If Dr. Happer said what the authors seem to say he did, it must have been elsewhere, presumably after that (June 1, 2015) testimony.
Joe,
Happer also said this in the linked testimony:
“Nearly all of the IPCC climate models have predicted several hundred percent more warming over the past twenty years than has actually been observed. There is something seriously wrong with the models.”
Several hundred percent would be more than twice, ie a factor of two.
Sorry; I see we’ve been talking past each other.
I was interpreting the head-post passage as a comment on what the sensitivity would be if there were no feedback. The part of Dr. Happer’s testimony I quoted seemed largely consistent with what I understand is the consensus view of that, no-feedback quantity.
As you observed, on the other hand, Dr. Happer disagrees with the consensus view on a different quantity, namely, what the with-feedback value is. I agree with you on what his testimony indicates is his position about that quantity.
Joe,
Probably due to my formatting problem and timing of my response to Mods request that I fix it.
Hope this testimony by Happer contained what you wanted.
That testimony isn’t what at least I thought I wanted, because, as I said, I interpreted the above-quoted passage as referring to the no-feedback sensitivity, whereas the Hopper testimony you brought to my attention concerns with-feedback sensitivity.
The reason why I interpreted the above-mentioned head-post passage as I did is that it was followed by the following:
However, Lord Monckton’s reasoning can be somewhat muddled, so you may be right about what the authors actually intended.
Thanks anyway for the response.
You’re welcome if it were helpful.
How about this final sentence as a summary:
“My opinion is that the sensitivity is somewhere between S = 0.5 K and S = 1.5 K, with a most likely value close to the feedback-free sensitivity, which is approximately S = 1 K.”
Relevant testimony about halfway through the pdf document:
http://www.desmogblog.com/sites/beta.desmogblog.com/files/roy%20spencer%20peabody%20energy.pdf
Again, thanks.
But, again, I don’t think that’s it, for the reason I gave above.
Joe,
You asked for a citation for this statement:
“Professor William Happer of Princeton, one of the world’s foremost physicists, says computer models of climate rely on the assumption that CO2’s direct warming effect is about a factor of two higher than what is actually happening in the real world.”
I cited this testimony by Happer:
“Nearly all of the IPCC climate models have predicted several hundred percent more warming over the past twenty years than has actually been observed. There is something seriously wrong with the models.”
IMO that satisfies your request.
It seems so to me too, G.M. . . but Joe Born’s reasoning can be somewhat muddled, so he may not realize it ; )
(Well done, I say)
John Kniight:
I don’t expect that that you will be able to respond with any thing like clarity, but I’ll give you the opportunity to make the attempt. I am fairly sure that you will fail, since I have seen many such lightweights, like Lord Monckton, at this site. Still, I hope you won’t fail. I long for a worthy interlocutor.
1. Lord Monckton says , “Professor William Happer of Princeton, one of the world’s foremost physicists, says computer models of climate rely on the assumption that CO2’s direct warming effect is about a factor of two higher than what is actually happening in the real world.”
2. Anyone of even modest analytical ability would interpret that passage, in light of Lord Monckton’s follow-on statement that, “As if that were not bad enough, the official story is that feedbacks triggered by direct warming roughly triple the warming, causing not 1 but 3 degrees of warming per CO2 doubling,” as stating the Dr. Happer had reservations not only about the consensus with-feedback sensitivity value but also about the consensus no-feedback sensitivity value.
3. Despite little hard evidence to the contrary, I am skeptical of that value, even though I see few people, even among us skeptics, who question it. Therefore, I am quite interested in any evidence, particularly from Dr. Happer, that would tend to support my skepticism; I would find the above-mentioned head-post statement congenial. Unfortunately, my experience is that Lord Monckton is quite cavalier about the facts, so I require proof before I believe anything he says, however congenial to my inclinations it may be.
As Lord Monckton and his colleagues have, you have failed to provide any proof that Dr. Happer has said what the head post’s authors have contended he did. I would be happy to find that Dr. Happer had indeed said it and given real support. Sadly, however, I see no evidence.that either you or Lord Monckton is a serious person who can support his claims.
Most people believe what they want to believe. Now, in truth, I confess to believing that there are more things in heaven and earth than are dreamt of in one’s “philosophy.” At this site, though, we should deal only with science, which should involve only in what we see evidence for. Unfortunately, few who comment at this site seem to see science in that way.
That’s a long way of asking, Do you have any evidence that Dr. Happer has questioned the no-feedback sensitivity? If you have, I would welcome it. Otherwise, you’ve submitted a groundless comment and are not a serious person. Sad to say, you have plenty of company.
Joe Born:
Thankyou, thankyou, thankyou for writing this comedic gem!
An intellectual pygmy boasts that John Knight, Viscount Monckton, Gloateus Maximus and all others who have trounced him here are not “worthy interlocutor(s)”!
Laugh? I almost fell off my seat.
Richard
Joe Born,
“That’s a long way of asking, Do you have any evidence that Dr. Happer has questioned the no-feedback sensitivity?”
Well, I can’t be sure of course, but my impression is that you may be reading more into this sentence than was intended, in terms of what Mr Happer himself said;
” Professor William Happer of Princeton, one of the world’s foremost physicists, says computer models of climate rely on the assumption that CO2’s direct warming effect is about a factor of two higher than what is actually happening in the real world.”
It seems reasonable to me to think the authors consider “what is happening in the real world” to be most likely reflected by what the satellite/balloon records show, which is (as I understand it) substantially below the 1 degree “sensitivity” direct warming estimate Mr. Happer makes.
Mr Born is his usual spiteful, trolling self. I decline to answer his sordid comment.
CAGW stands and/or falls on three basic, simple points:
1) Anthropogenic’s net 4 GT/y CO2/carbon contribution is trivial in comparison to the 45,000 GT in reservoirs and 100s GT/y in fluxes.
2) The 2 W/m^2 of additional RF due to the CO2 added between 1750 and 2011 is lost in the magnitude and uncertainties of the overall power flux: e.g. 340 W/m^2 ToA, 240 W/m^2 OLR +/- 22!!!!!! W/m^2, 101.4 W/m^2 reflected solar +/- 11.7 W/m^2!!!!!, etc.
3) By IPCC’s own admission the GCM’s haven’t and most likely can’t accurately model the atmosphere.
All the rest of the yakking, temperatures, glaciers, polar bears, sea levels, yadda, yadda, is just noise, sound and fury, and pretty much beside the point.
Here is an idea to cloud source. Do it for your own region and report for all to see.
Start with daily time series data from a longer term station say with raw Tmax and Tmin from 1900 on.
Start looking at the % of variability explained by other factors. Pull them into multiple regressions one after another starting with CO2 then local rainfall next. Add in baro pressure and relative humidity and so on until well cooked and served.
You could find that 10 to 40 % of the T variation over time is statistically explained by rainfall. In short, rain cools. Plenty of physics to support this.
You get clearer results if you then use a scalpel at the main break points and treat the data over these smaller times.
Rainfall cools.
This is a rough first pass approach. Maybe for California the higher historic temperatures go hand in hand with lower rainfall. Maybe GHG has little part to play.
This could merit a separate pomst, eh mods?
H/T Dr Bill.
The Bonk will experience real Climate Change in Ottawa and Montreal these next few days. However we call it weather. http://pm.gc.ca/eng/news/2016/02/05/prime-minister-host-meeting-united-nations-secretary-general-ban-ki-moon These next few will be the coldest of the winter -22 C
I think than the way IPCC highlights radiative forcing but fail to mention the net energy absorption is remarkable.
In the contribution from Working Group I to the fifth assessment report – IPCC highlights the net anthropological radiative forcing:
“The total anthropogenic Radiative Forcing for 2011 relative to 1750 is
2.29 [1.13 to 3.33] W/m² …”
Ref.: WGI; AR5 – Page 13
IPCC does not mention with a word, in the summary for policy makers, that the anthropogenic radiative forcing is countered by:
“.. an increase in outgoing radiation inferred from changes in the global mean surface temperature ..”
Ref: WGI; AR5 – Figure TFE.4, Figure 1 The Earth’s energy budget from 1970 through 2011
IPCC does not mention with a word in the summary that a central estimate for the current net surface warming is 0.6 W/m²:
“considering a global heat storage of 0.6 W/m² (imbalance term in Figure 2.11) based on Argo data from 2005 to 2010 (Hansen et al., 2011; Loeb et al., 2012b; Box 3.1).”
Ref: IPCC;AR5;WGI;page 181; 2.3.1 Global Mean Radiation Budget
And IPCC does not mention with a word that the central estimate for current total feedback from clouds is also 0.6 W/m²:
“Based on the preceding synthesis of cloud behaviour, the net radiative feedback due to all cloud types is judged likely to be positive. …. the central (most likely) estimate of the total cloud feedback is taken as the mean from GCMs (+0.6 W m–2 °C–1).”
Ref: WGI; AR5; 7.2.6 Feedback Synthesis; page 592
That is quite important isn´t it? The central estimate for cloud feedback effect is about equal to a central estimate for net global warming – and the cloud feedback effect is caused by the warming.
More here:
Without cloud feedback there would be no global warming!
I think I can answer these questions – or, at least, tell you what the answer you will get will be if you ask them:
…1: What is the source of the warming that surface thermometer datasets now say has occurred in the past 18 years?
The source is the carbon pollution which we are putting out every year. This is basic science which is irrefutable.
2: Why, just two years ago, did every surface temperature dataset agree with the satellites that there had been no global warming so far in this century? And why was every surface dataset altered in the two years preceding the Paris climate conference – in a manner calculated to show significant warming – even though the satellite records continue to show little or no warming?
Datasets are adjusted for a variety of technical reasons. Satellite datasets are also adjusted. It is coincidence that the adjustments in 2014/5 happened to go upward.
3: Why do all the datasets, surface as well as satellite, show a lot less warming than predicted? Why has the rate of warming over the past quarter century been only one-third to one-half of the average prediction made by the UN’s climate panel in its 1990 First Assessment Report, even after the numerous questionable adjustments to the surface temperature datasets?
Though it is agreed that carbon pollution raises temperatures, we still need to fund a lot more research before we can provide precise predictions.
4: Why is the gap between official over-prediction and observed reality getting wider?
I refer you to my answer to Item 3
5: Why is the gap widening between warming rates measured by satellite and by surface datasets?
I refer you to my answer to Item 4
6: Why should anyone invest trillions of dollars – to replace fossil fuels with expensive renewable energy – on the basis of official predictions in 1990 and 2001 that differ so greatly from reality?
The threat from carbon pollution is so great that we cannot wait to get the science absolutey precise.
7: Why has the observed rate of warming, on all datasets, been tumbling for decades notwithstanding predictions that it would at least remain stable?
I refer you to my answer to Item 5
8: So, where is the tropical upper-air hot-spot?
The tropospheric hot-spot has been found by statistical examination of wind-speeds.
9: Why, if CO2-driven warming ought to warm the surface ocean first, is the ocean warming from below? And why has the ocean been warming throughout the eleven full years of the ARGO dataset at a rate equivalent to only 1 degree every 430 years?
I refer you to my answer to Item 7
10: Given that the authors of the largest-ever survey of peer-reviewed opinion in learned papers found that only 64 of 11,944 papers (0.5% of the total) actually said their authors agreed with the official “consensus” proposition that recent warming was mostly manmade – on what rational, evidence-based, scientific ground is it daily asserted that “97% of scientists” believe recent global warming is not only manmade but dangerous?
…
The UK Met Office and NASA are not responsible for flawed external surveys. Our internal surveys show that 100% of scientists believe in Global Warming.
Whose internal surveys are those?
Is your comment meant to be satire? Surely you aren’t serious.
How can CO2 possibly be a pollutant? It is vital to life on earth. More of this presently dangerously low essential trace gas is better and has greened the earth.
The alleged increase from 285 ppm in AD 1850 to 400 ppm in 2015 has been a good thing for the planet, without having any detectable negative effects. During its longest period of monotonous rise, ie from c. 1945 to 1977, earth cooled dramatically. During its highest period, ie c. 1996 to 2015, global average temperature stayed about the same or fell slightly.
More CO2 would be better, not worse, for life on earth. Ideal would be actual greenhouse concentration at up to 1300 ppm.
Satire.
9: Why, if CO2-driven warming ought to warm the surface ocean first, is the ocean warming from below? And why has the ocean been warming throughout the eleven full years of the ARGO dataset at a rate equivalent to only 1 degree every 430 years?
I refer you to my answer to Item 7 (work back)
I refer you to my answer to Item 5
I refer you to my answer to Item 4
I refer you to my answer to Item 3
Dodgy Geezer
So. The entire argument now comes down to:
1. Trust me, because me and 100% of my colleagues – who also want more money next year – agree with me, even though none of us can measure at all (much less measure accurately) what we claim to be measuring because what we cannot measure accurately is irrefutable evidence because we said so.
2. Give me more money, because of the above.
3. Continue destroying the world’s economies, continue causing millions of innocents to die and billions more to continue living in hardship and poverty because we feel the world might be in danger of something we fear but cannot measure accurately and cannot predict accurately even in the next 20 years – much less 150 years of hardship caused by OUR fears of a danger (which we cannot measure).
My unscientific internal survey is to ask each of the hundreds of scientists of my acquaintance what he or she thinks of the hypothesis of catastrophic man-made global warming. The result is that those whose careers depend upon supporting the hypothesis “believe in” it, most of those who don’t rely on it for funding don’t, and others honestly state they don’t know enough about the contention to decide conclusively either way. I’d say that a majority thinks that humans have some effect on at least local climates, warming some and cooling others. The net human effect on global climate, however, cannot be known, if any, even as to its sign.
To which rent-seeking, taxpayer-funded profiteering quango does “Dodgy Geezer” belong? Whichever it is, it should be entirely defunded and all the soi-disant “scientists” sacked. The correct scientific answer to the question “Do you believe in global warming?” is that science is not a matter of belief, and that the survey question should be refined so as actually to mean something. That the “scientists” gave such a dopey question the political answer they were expected to give, an answer upon which their fat income-streams depend, does not bode well for the future of true science.
I think you may have misinterpreted Dodgy’s position on the matter.
Read Dodgy Geezer’s post again, and with more attention.
As Chris Hanley says “I think you may have misinterpreted Dodgy’s position on the matter.”
Dodgy Geezer
I should indeed apologize to Dodgy Geezer for misinterpreting his comment as suggesting that he belonged to one of the profiteering quangos. They should still be defunded and shut down, though.
“The UK Met Office and NASA are not responsible for flawed external surveys. Our internal surveys show that 100% of scientists believe in Global Warming.”
You forgot the part where they’ll be fired if they don’t “believe” in Global Warming.
“The threat from carbon pollution … ”
That term is deliberately designed to mislead and inflame. It should be avoided
Thank you authors!
Look for the prime flaw: “pre-industrial and pre- CO2 acceleration temperatures”
Can someone please explain to me how the “+1C /century” can be established given the distribution and accuracy of the data points during the 2 ‘pres’ are taken into account? Surely the current calculation required that the pre measurements were within 0.1 C? I will make a stab at predicting the accuracy was within 3 C
We need a historian with their tenacious ability to do the hard research. I would love to see a map of data point locations used for each decade of the 150 year record
There was a rural weather data station in my own location throughout the early 20th century. I doubt that the thermometer could be read to 0.1 C. Why would they bother? My understanding is that a volunteer read it and rung the info through. 2 or 3 degrees here or there – why would it matter unless it was unusually hot or cold? A normal human would take a quick glance and make a stab at the nearest 1C. The same would go for bucket temps
Imagine a student proposing a PhD project designed to establish results of precision of 0.1C based on this history. There was a time when it would be thrown in the trash bin. Now billions of dollars are committed on the same basis
This stuff does not require just science and maths. It requires simple logic and common sense. The basic principles are not rocket science
Given the paucity and low quality of the ground based temperature network, it’s ridiculous to think that we can use it to measure the earth’s temperature to within even 5C.
As you go back in time, the problem gets worse.
Why did BP call for global carbon tax on 2-11-16?
Here’s a guess. If the coal industry is out of business, they’ll sell more oil.
“If the coal industry is out of business, they’ll sell more oil.”
Oil is not used to generate electricity in the US and hasn’t been for decades. Coal is going to be around for a long time yet. Maybe 15% of the old coal capacity will be retired and replaced with fossil fueled, CO2 producing, natural gas fired combined cycle plants because gas is cheap and CCPPs are twice as efficient as the traditional Rankine steam cycles.
BP sells natural gas as well.
Go along, get along.
PS: BP was probably pressured into making such a statement; Greenies are well funded and well organized and habitually engage in twisting corporate arms.
“Why did BP call for global carbon tax on 2-11-16?”
Don’t need to be a weatherman to know which way the wind blows.
No Idea is more valid than its Premise – if its Premise is Bogus the Idea is Bogus.
The Premise upon which the whole AGW movement is based is the notion that a Warming Earth is Evil, Wrong, Immoral, Bad, Dangerous, Harmful, Unhealthy, etc…, etc…
IF the Premise that a Warming Earth is Evil is Bogus THEN the whole AGW movement to stop it is Bogus.
Thank you. BUT in future please re-write 2nd to last paragraph –
OLD
“Millions die worldwide every year …..”
NEW –
“Millions of children under age five die every year because their parents don’t have access to …..”
This is more powerful and it has the virtue of also being true.
To the dogmatist a single death may be a tradgedy but a million is just a statistic. But they cannot argue the death of children is necessary to save the planet. That goes beyond the Pale.
Thank you again.
The earth’s population grew to 7 billion (which would fit easily in half of the Grand Canyon) because of a declining death rate, not an increasing birth rate. Birth rates are falling in most developed countries, even below replacement numbers. The prospect of 8, 9, 10 billion people is becoming less likely every year.
I defer to Hans Rosling who has stated that we have reached ‘peak child’. Hans identifies peak population at 10 to 11 billion. I think 8 or 9 is too low without global Maoist type policies ‘in the bedroom’ as Hans would say.
Also using data we can see that longevity and declining death rates relate primarily to a decline in global child mortality. Declining birth rates also correlate most closely with declining child mortality rates. If your child is likely to survive and support you in old age, there is not incentive to bear 6 or 7 kids.
IMO, eight billion is baked in the cake, nine million probable, but ten billion possibly not.
Should stabilize around ten billion, IMO, which is not the unsustainable catastrophe Malthusians imagine.
Ten billion people living at the density of Mong Kok, Hong Kong (130,000 people per sq. km.), would fit in an area of less than 77,000 sq. km, ie smaller than the Czech Republic. However the farmland to support them would cover a larger area, of course.
The Earth’s population will stop growing in 10 to 20 years, and start falling rapidly after that.
Robert makes a good point: children are at least as vulnerable as adults to the policies of hate pushed by the Greenshirts.
Dear Christopher Monckton, Willie Soon & David R. Legates,
I find that your item/question #1 is the key strategic and the most fundamental scientific issue of your ten. It is sufficient to “kill” (Monckton’s, Soon’s and Legates’ word) the ‘hypothesis that AGW** is significant’ .
That said, your other nine items/questions are good for establishing diverse multiple lines of reasoning and evidence to show purposeful exaggeration to achieve subjective goals based on pre-science premises (ideology).
** AGW is GW from burning fossil fuels
John
OK, not so much a parody; more like a metaphor of the actual situation . . . . : )
John
Propheteers. Same old, same old.
A “killer question” for you Christopher.
Were you previously aware that global sea ice area has recently reached its lowest ever level (since the Cryosphere Today satellite records began)?
http://GreatWhiteCon.info/2016/02/global-sea-ice-area-at-lowest-ever-level/
Jim Hunt,
No, that’s just natural variation. And it’s not the “lowest EVAH!!”
http://arctic.atmos.uiuc.edu/cryosphere/IMAGES/global.daily.ice.area.withtrend.jpg
Thanks DBS,
Actually it is the lowest ever (since CT satellite records began) as I stated. I can assure you that this has been rigourously peer reviewed!
Also I think you will find that my original question was addressed to the author of this article rather than to your good self.
Please, Jim, let’s strive for accuracy; it’s my ‘great’ self. ☺
Anyway, Cryosphere says global ice isn’t the … Lowest EVAH!!
For some strange reason that comment I keep banging on about still hasn’t made it’s way out of moderation. Could somebody (anybody?) dig it out please? [Reply: Please re-post. There is nothing in the Spam folder. -mod]
Meanwhile CT global sea ice area just posted a new all time low reading today. Since their records began of course, in 1979.
14.359 million square kilometers
Jim Hunt,
Please forgive me for replying to your comment, since it was undoubtedly directed to someone else. But if you wouldn’t mind, please explain why Arctic ice is special?
Mr Hunt, in his desperation to promote the purely political but now collapsing cause of shutting down fossil-fuel corporations that were once the major donors to his hated Republican opponents, displays a shameful disregard for, or ignorance of, elementary statistical method. He founds his case on a single data point, and one that is little different from similar data points in 2006 and 2011.
However, as he will learn when he attends his first Statistics 101 course, to place undue weight on a single data point is to err. Grown-ups determine trends on multiple data points. As Mr Hunt will learn from the graph helpfully posted by Mr Stealey, to whom he is as churlishly ungrateful as most of his sort are, the trend on the daily observations of global sea-ice extent by the satellites since 1979 is remarkably close to zero.
There has, of course, been some global warming since 1979, though only one-third of what the IPCC predicted in 1990. Naturally, one consequence of the little warming that has occurred might be a very small loss of global sea ice.
For life on Earth, of course, ice is not generally a good thing. The less of it the better.
Christopher – As I hoped you would have realised by now I hail from Soggy South-West England and am therefore not entitled to vote in any elections in the Good ‘Ol US of A.
In addition I fear that you fail to comprehend the point I am in actual fact attempting to make, not least because a previous elucidatory comment of mine is still “awaiting moderation” here. Perhaps you might be able to have a word in the WUWT webmaster’s shell like about the issue?
Re: dbstealey February 16, 2016 at 8:57 am
In case you hadn’t noticed I’ve been banging on about GLOBAL sea ice here. That’s because history strongly suggests that, for reasons best known to himself, Viscount Monckton likes to bang on about that particular metric too.
[so do you, with a blog dedicated to it. do you have a point? -mod]
Phil Clarke is, as usual, wrong. The head posting did not use any “forcing scenario”: it used the predictions made by the IPCC in 1990 on its “business-as-usual” case.
Huh? What is the ‘BAU case’ if not a scenario?
The rate of CO2 emissions growth from 1990 till the present is actually somewhat higher than on the IPCC’s 1990 “business-as-usual” case, but the predicted rate of global warming did not occur
But, as you correctly stated, “Scenario A was its business-as-usual scenario, and it had incorrectly predicted a far greater rate of forcing, and hence of temperature change, than actually occurred”
Both of these statements cannot be true, unless you are relying on non-CO2 forcings. Under Scenario A the radiative forcing for 2010 was approximately 3.5 Watts per square meter (W/m2) as opposed to 3 W/m2 under Scenarios B &C. The actual number 2.8 W/m2,
For CO2 only, Scenario A CO2 forcing was 1.85 W/m2 by 2000 and 2.88 by 2025. A peer reviewed paper has the value for CO2 forcing at 1.82 W/m2, in other words by 2011 we were still below the value Scenario A had more than a decade earlier.
The title of the peer-reviewed paper was:- ‘Why models run hot: results from an irreducibly simple climate model, by Christopher Monckton of Brenchley, Willie Soon, David Legates and Matt Briggs.
Clearly Scenario A (BAU) did not come to pass, the comparison is bogus.
I found an atmospheric heat/power flux balance diagram among Bing images that is labeled “Fig 10 Trenberth et. al. 2011.” Some of you might recognize the paper. What is interesting is that there are eight values and an average displayed for each of the major state points. From what I can tell they are eight different studies/data bases/calcs and in some cases with quite different values. What happened to consensus? A couple of the variation ranges/uncertainties are an order of magnitude greater than anthropogenic CO2’s 2 W/m^2 RF. And there is the 333 W/m^2 perpetual (GHG?) power flux loop between earth’s surface and sky, i.e. lower troposphere.
A summary table:
………………………..ave W/m^2…..+/- %…+/- W/m^2
ToA net…………………342.1……..1.5……..…..5.13
OLR…………………….243.9……..9.0……..…21.95
Albedo, %…………………29.8……..3.5……..…..1.04
Surface Radiation……..398.0…….2.5……..……9.95
Back Radiation………….338.3…….8.5…………28.76
Evapo transpiration…….85.1…….9.0………..…7.66
Reflected Surface………..27.4…….5.7……….…1.56
Reflected Solar…………..101.4….11.5….…….11.66
Latent Heat……………….88.1…… 8.0……….…7.05
Per IPCC AR5 the cumulative CO2 RF between 1750 and 2011 is about 2 W/m^2. OLR is +/- 22 !!!!!!! Reflected solar +/- 12!!! Even RCP 8.5 gets lost in uncertainties this large. How can anybody claim significant confidence in the present or future global temperatures with such huge uncertainties?
Phil Clarke is, as usual, wrong. The IPCC, in its 1990 First ASSessment Report, put forward its estimate of the anthropogenic emissions of CO2 that the world would make. Like it or not, our emissions are above those that the IPCC predicted, yet the amount of warming it predicted did not occur.
It is, of course, part of my contention that the IPCC has in the past overstated the radiative forcing from CO2. Phil Clarke now confirms, citing the most authoritative of reviewed sources (me) that that is indeed the case.
The fact is that there has been far less warming than the IPCC predicted, even though our emissions since 1990 have been if anything a little greater than predicted. that means the IPCC got it wrong. If it was wrong then, why should we believe it now?
I guess we will have to assume nefarious tactics of climate science from these PT Barnum types do no extend into their tax filings and reporting of taxable income from such activities. I suppose routing the gains through a nonprofit organization with high salaries and travel expenses is an option for them. A blind eye from tax agencies would also help.
Let’s see the list of nonprofit orgs associated with each cartoon character, or is the list too long to fit on the page?
i admire the work you done to build this informative content.
Many thanks to alinaangel and many others for their very kind comments. It’s astonishing that no one else has done a systematic review of the extent to which measured temperature change matches past predictions.
your clock diagram is great.
the perspective view makes it loom.
does its job with panache.
Many thanks to gnomish too for his kind words. Dial-graphs show the discrepancy between prediction and observation very clearly. We’re going to do our best to keep them updated.
With respect to #2 and #5 on the list by Monckton/ Soon/ Legates, I have only one thing to say about NASA’s GISS and NOAA on this Saturday morning.
** AWE = Anthropogenic Warming Exaggerators
John
Phil Clarke is, as usual, wrong. The IPCC, in its 1990 First ASSessment Report, put forward its estimate of the anthropogenic emissions of CO2 that the world would make. Like it or not, our emissions are above those that the IPCC predicted, yet the amount of warming it predicted did not occur.
Everyone is entitled to their opinion, but not their own facts.
Q The IPCC did not know in 1990 how forcings would develop and so they ran their models using 4 Scenarios labelled A-D. Scenario A they called ‘BAU’ as it was a continuation of the recent trajectory, it had the fastest rate of warming. True or False?
Q These words were written by His Lordship here at WUWT “I had not recalled that IPCC had made its 1 k by 2025 prediction under Scenario A. However, Scenario A was its business-as-usual scenario, and it had incorrectly predicted a far greater rate of forcing, and hence of temperature change, than actually occurred” True or False?
The paper cited above had observed forcing from CO2 at 1.82 W/m2 in 2011. Scenario A had 1.85 W/m2 in 2000, so reality was behind Scenario A by a decade or more. True or False?
Scenario A cannot be reasonably used in an assessment of the skill of the 1990 models, citing emissions in a single year does nothing to alter that fact. Scenarios B & C were far closer to the actual outturn. True or False?
Questions open to anyone, and easily checked.
I would go with prostitutes of climate doom.
Most skeptics ask questions that start too many steps up the climate change “assumption ladder”.
(This article is an example.)
They should focus on questioning the popular high level climate beliefs and assumptions.
They should ask questions that point out how little is actually known about climate change.
I offer a list of 12 ‘high level’ climate questions.
I believe most of them can’t be answered.
Without decent answers to high-level climate change questions, do the more detailed questions in this article really matter?
For example, does it really matter if the average temperature in 2015 was slightly higher, the same, or slightly lower, than in 1998?
Twelve High-Level Climate Change Questions:
(1) What is a normal climate for our planet?
(2) Is average temperature a good proxy for the climate of our planet?
(3) What is a normal average temperature for our planet?
(4) What is a normal average temperature range over a century?
(5) Are real time thermometer averages from 1880 to 2015 worth studying when there are no comparable data for the prior 4.5 billion years (99.999% of Earth’s history)?
(6) What evidence proves the future climate can be predicted?
(7) What evidence proves that CO2 rising from 300 to 400 ppmv caused any global warming?
(8) Is it likely that average temperature data for the 1800s had a margin of error of less than +/- 1.0 degrees C. ?
(9) What evidence supports NASA and NOAA claims of tiny margins of error for their 1880 to 2015 average temperature data? (+/- 0.1 and +/- 0.09 degrees C. claimed margins of error, respectively)
(10) What evidence proves the change in the average temperature since 1880 has been abnormal?
(11) What evidence proves climate change since 1940 has harmed humans, animals and/or plants?
For example:
(a) Is the Earth becoming less “green”?
(b) Is the growing season shrinking?
(c ) Is agricultural output decreasing?
(12) Have “climate scientists” on government payrolls provided taxpayers with anything of value to justify paying any attention to their climate predictions … and continuing to employ them?
My climate blog for non-scientists.
No ads.
No money for me.
A public service.
This comment was an excerpt from a post on that blog.
http://www.elOnionBloggle.Blogspot.com
PS:
I have no intention of smearing true science heroes such as Christopher Monckton, Willie Soon and David R. Legates, who all face enough ridicule without me piling on.
I’ve been searching since 1997 for scientific proof that CO2 caused ANY of the warming in the past 150 years, but I have not found it.
Does that mean I should stop searching for that proof … and focus on far less important issues such as tiny “adjustments” to average temperature data, and whether or not 2015 was really warmer than 1998?
Richard Greene commented: “….Most skeptics ask questions that start too many steps up the climate change “assumption ladder”….”
Your assessment of the issue is spot on. Skeptics have allowed the warmists to frame the narrative into minutiae that’s either arguable or not provable. They’ve accomplished this by design and managed to keep the MSM away from asking those simple questions that would resonate with the people…..easy to understand, and thought provoking by claiming “conspiracy theory”.
The Mad Men caricature were brilliant.
In debating warmists, all that is needed is just one “killer question.” It will stop them in their tracks every time.
It is this:
“Please state the catastrophic man-made climate change hypothesis in which you believe. Please state it in scientific terms so that its predictions can be measured to real-world observations. Thus, it must include a timeline (years, such as 1970, etc.) with corresponding CO2 concentrations in the atmosphere (ppm) and the corresponding increase in annual mean global temperature increase (in Celsius, per decade increase) predicted.”
90% of the time, the warmists cannot state a hypothesis.
For the 10% that can, they will, of course, be forced to state the hypothesis upon which all those dozens (as many as 150?) computer models were based. And almost all of those clustered around a .3-.4 degree Celsius per decade increase in temperature, starting from back in the ’90s when about 2 ppm of CO2 were being added to the atmosphere each year as a result of man-made emissions. Once they have done that, of course, then like Mr. Watt’s point #6 above states, you can simply point out that this hasn’t panned out (some skeptics would also point out that their predictions were 300%-400% more than what actually occured, at least as far as the last 19 years are concerned). Thus, their hypothesis has failed.
For the 90% that can’t even state the hypothesis, congratulate them for supporting the First Amendment because Freedom of Religion is guaranteed to them and they are free to believe and propagate any silly nonsense they like. But end with the rejoinder: please, Mr. Religionist, just don’t call it science.
Does this come from the book- Climate Change- Just the Facts
This is a great article. Thank you for sharing this with me on Twitter. 🙂
Once they have done that, of course, then like Mr. Watt’s point #6 above states, you can simply point out that this hasn’t panned out (some skeptics would also point out that their predictions were 300%-400% more than what actually occured, at least as far as the last 19 years are concerned). Thus, their hypothesis has failed.
I notice that January global anomaly according to NASA was 1.13C, this is higher than the CMIP model ensemble under scenario RCP8.5 projected and between Hansen’s 1988 Scenario B (BAU) and Scenario A (extreme) predictions for around now.
I guess the ‘warmist’ reponse might be to point out that Hansen’s model had a sensitivity of around 4 C as opposed to the concensus value of nearer 3C.
Would Messrs. Monckton, Soon and Legates care to comment on the fact that today NSIDC global sea ice extent reached the lowest level ever since satellite records began in 1979? The associated linear trend is of course “down” and not “remarkably close to zero”.
CT global sea ice area also hit a new “all time” low today, for the umpteenth time this year.
[instead of just being your typical taunter (it’s what you do) why not provide the links to the exact graphs you are so worried about? Too hard or do you just want people to take you at face value? -mod]
Re: Mod February 18, 2016 at 11:13 am
Sure. I was working on the assumption that it was the links that were causing my comments to disappear without trace. Let’s see how this one comes out shall we?
http://GreatWhiteCon.info/wp-content/uploads/2016/02/Global-Extent-2016-02-18.png
[3 or more links sends any comment to spam, as spammers tend to load up links. but this is your plot, not NSIDC’s …where is the official plot from NSIDC? Since you have an agenda, your plots may or may not be accurate -mod]
[UPDATE: here’s Cryosphere today’s official plot while we have a single area point that is lower than the rest, the global anomaly isn’t anywhere near the lowest.
http://arctic.atmos.uiuc.edu/cryosphere/IMAGES/global.daily.ice.area.withtrend.jpg
and here
http://arctic.atmos.uiuc.edu/cryosphere/iphone/images/iphone.anomaly.global.png
Mr. Hunt just seems to be engaging in his usual cherrypicking to garner attention and derail this thread with his off-topic comments, probably best to simply ignore him -mod]
Jim Hunt,

I prefer this chart:
That’s at 30%, which eliminates most of the wind-blown bergs. It measures the thicker ice cover, so it’s a more accurate representation.
You can see 2016 starting to move up after a strong 2015 finish.
Re: Mod, February 18, 2016 at 1:38 pm
Can I safely assume your surname isn’t Monckton, Soon or Legates? [Reply: yes, you can. ~mod] When will one them be around to answer a question or three? [Reply: Not our job to know. ~mod]
I wouldn’t dream of putting three links in a single comment. Maybe 3 images if I was endeavouring to explain something difficult to the hard of understanding. The one that seems to have vanished without trace contained but a single link, to the WordPress blog of Clive Best.
There isn’t an “official plot” from NSIDC. They produce separate Arctic and Antarctic graphs, which make interesting viewing at the moment:
http://nsidc.org/arcticseaicenews/charctic-interactive-sea-ice-graph/
If you want to do a Clive Best impersonation (AKA “peer review”) the data can be downloaded from the link at the bottom of my most recent graph. Change to “south” to “north” to get the other half.
Are you aware of the difference between sea ice “area” and “extent”? Clive wasn’t, but he is now. See the Storify of our conversation. Where is that hiding by the way?
[i don’t think any of them with bother with your off-topic question. as said earlier, your entire m.o. is to launch a taunt, and it doesn’t merit a response since this isn’t any particularly noteworthy event. -mod]