Guest Opinion: Dr. Tim Ball

They are physically cleaning up after the “Blizzard of 2016” in the northeastern US. The job is not as onerous as anticipated and is going slowly because the government is in charge. However, it is time for an intellectual clean-up because of what went on. The entire sequence of events is a classic example of environmental and climatic exploitation that parallels the anthropogenic global warming (AGW) deception. [That same sequence] shows what is wrong with weather and climate forecasts, and how it is all amplified and perpetuated by people who don’t know what they are talking about, or, worse, want to know.
The underlying objective was to hype the potential for catastrophe against a backdrop of implications that the event is unnatural. The actors on the stage were the weather office bureaucrats at National Weather Service (NWS) and the National Oceanic and Atmospheric Administration (NOAA) who are key players in the global climate deception that is the Intergovernmental Panel on Climate Change (IPCC). Mainstream media TV meteorologists were seeking sensationalism under the guise of warning and protecting the people and supported them as usual. Regular mainstream media ambulance-chasing reporters, looking for extremes and creating them when necessary followed them on stage. They later produced stories explaining how the storm was evidence of climate change and global warming. They did this as they ignored the physical evidence, reality, the historical context, and the actual mechanisms of climate change.
The Buildup
The Slate headline threatened,
“This “Blizzard for the Ages” Headed for the East Coast Is Very Much the Real Deal.”
“Since early Saturday, nearly every single run of every major model has shown the potential for a foot or two of snowfall on a track to hit somewhere between Northern Virginia and Boston. What’s amazing—perhaps even more so than the impressive potential snow totals—is that all the major weather models are already locked in so far in advance. Simply put: There’s definitely a big storm coming, it’s just the details that are still being worked out.”
Notice it is ‘definite’ because all the models agree. In another speculative report, the rhetoric and hyperbole all heightened the anticipation.
“Winter storm Jonas is set to affect almost 76 million people as several feet of snow hit the north-east US, causing travel chaos for millions as internal flights are grounded and international flights under threat of cancellation.
The storm is expected to bring heavy snowfall to 15 states, with blizzard warnings, plunging temperatures and coastal flood warnings in place from 22 to 24 January.”
As usual, in today’s PR controlled and directed media, they produced slogans including Snow-mageddon and Snow-pocalypse and Snowzilla.
The Basis For the Hype
I am sure many skeptics reading the Slate quote immediately ignored what it said when they read the phrase “every major model.” Once again they are justified as the failed predictions attest. In this case, it is not just a single model failure but all of them. There is one interesting difference from previous failures that may reflect a growing awareness in the weather agencies that a credibility gap is growing. In an article titled “Snowstorms forecasters under fire as ‘historic’ accumulation failed to materialize” the spokesperson for the US National Weather Service said,
“My deepest apologies to many key decision-makers and so many members of the public,” wrote Gary Szatkowski, the meteorologist in charge of the organization’s office in Mount Holly, N.J. “You made a lot of tough decisions expecting us to get it right, and we didn’t. Once again, I’m sorry.”
Does he make the same apology for the failed IPCC predictions his agency promotes?
The spokesperson for the Canadian weather office was more defensive in his remarks.
“There is still a lot of complexity and it is still an imperfect science,” said Peter Kimbell, warning preparedness meteorologist at Environment Canada. However, he rejected the notion that forecasters get the weather wrong most of the time. “We actually get it right a lot of the time,” he said. “And it all depends on your perspective of what getting it right is. If we say we’re going to get 15 centimetres of snow and we get 12, is that good or not good?”
The claim of a 3-centimeter error is clever because it puts it within a tolerable range, but that is not what happened. Besides his agency doesn’t acknowledge the imperfect science when it makes global warming predictions for the next few decades.
While Philadelphia, New York and New Jersey had braced for 30 to 60 centimetres of snow, they got far less than that. New York City received about 20 centimetres, Philadelphia a mere 2.5 centimetres or so. New Jersey got up to 20 centimetres.
This is not a surprise because New Scientist reported that Tim Palmer, a leading climate modeller at the European Centre for Medium-Range Weather Forecasts in Reading England said:
I don’t want to undermine the IPCC, but the forecasts, especially for regional climate change, are immensely uncertain.
What people overlook is that these are the same agencies, the NWS, NOAA, and EC, who are the IPCC. They are the same agencies telling political leaders and the public that the IPCC forecasts are accurate and must form the basis of political action. In the case of the snowstorm forecast, the political leaders are left without options. They believe they must over respond because a failure to prepare is political suicide. The politicians are in no position to challenge their weather bureaucrats, as Maurice Strong knew when he set up the IPCC through the World Meteorological Organization (WMO).
Historical Context
The storm of 2016 was a standard “Nor’easter”. They are so normal that there is a separate entry in Wikipedia. These storms develop as low-pressure systems along the Polar Front, the boundary between the cold polar air and the warmer subtropical air. They begin in the lee of the Rocky Mountains and are often called Alberta or Canadian Clippers. In the interior of the continent, the circulation brings moisture from the Gulf of Mexico to create legendary blizzards. When the Cold Front pushes toward the Atlantic coast, it tends to run parallel to the coast and the low-pressure system circulation means moisture is picked up from the Atlantic Ocean, and the prevailing northeast winds provide both the name “nor’easter” and the heavy snow conditions.
Lack of knowledge of the mechanisms and failure to check the history of such storms didn’t only hamper politicians.
False Attribution To Global Warming.
In a Business Insider article about “The Blizzard of 2016 (aka Winter Storm Jonas)” Tanya Lewis argues, “Massive snowstorms don’t disprove global warming – in fact, quite the opposite.” This statement is wrong for two major reasons.
1. Meteorologically, because the IPCC claim that greater warming will occur in the polar air than the tropical air. If true, this decreases the temperature difference across the Polar Front. The intensity of storms is determined by that temperature difference, known as the Zonal Index.
2. Historically, because there was a much greater storm in 1888 that followed the same path as the storm of 2016. Global temperatures were lower at that time.
The details and impact of “The Blizzard of’88” are described in a 1976 publication by the US Depart of Commerce, National Oceanic and Atmospheric Administration (NOAA), Environmental Data Service written by Patrick Hughes and titled “American Weather Stories” (see image). Here is what one report outlined.
The blizzard cutoff and immobilized Washington, D. C., Philadelphia, New York City, and Boston. Snowfall averaged 40 to 50 inches over southeastern New York State and southern New England, with drifts to 30 and 40 feet. In Middletown New York, snowdrifts were reported to have covered houses three stories high. The townspeople had to tunnel through the snow like miners, even shoring up the passageways with timber. For two days, frequent gale force to near hurricane winds accompanied below freezing temperatures which ranged from near zero to the low 20s over much of the area.
Men, women, and children died in city streets, in country fields and on ice-choked ships and boats. Over 400 died, 200 in New York City alone. Thousands more suffer everything from exhaustion to amputation of frostbitten limbs.
The great storm buried trains all over the northeast, marooning passengers for days in some cases for a week or more. The blizzard was a marine disaster from Chesapeake Bay through New England. Some 200 vessels were sunk, grounded, or wrecked and abandoned. At least 100 seamen died in the storm they called the Great White Hurricane. Of 40 vessels in Philadelphia’s Harbor, only 13 escaped destruction or disabling damage, and at least 30 crew members perished.
Maximum wind velocities recorded range from 48 mph at New York City to 60 mph at Atlantic City and 70 mph at Block Island.
Ironically, the report notes,
“The Blizzard of ’88 was not the most violent storm to visit the northeast.”
Summary
Michael Crichton identified the overall challenges in analysing the events preceding, during, and following the Blizzard of 2016.
The greatest challenge facing mankind is the challenge of distinguishing reality from fantasy, truth from propaganda. Perceiving the truth has always been a challenge to mankind, but in the information age (or as I think of it, the disinformation age) it takes on a special urgency and importance.
As a finale and evidence of unwillingness to face facts the NWS claim
‘This storm ranks up there with the great blizzards of the past 100 years in terms of amount of snowfall, size of impacted areas and population affected,’
A very unhelpful, unscientific, statement that reveals the political hyperbole that drives the story. Not to be outdone NOAA report,
Last weekend’s historic blizzard has been revealed as the fourth most largest snowstorm ever to hit the Northeast, according to the National Oceanic and Atmospheric Administration.
It is nice to learn that NOAA has records covering the entire multi-billion-year history of the region as the word “ever” indicates. Maybe they could use these to put their claims about the record warm in 2015 in perspective.
The Blizzard is a classic example of how those with a political agenda took a normal, natural, event and turned it into a potential catastrophe. They gave their claims legitimacy with computer models. The compliant sensation-seeking media repeated and amplified the story until politicians were left with no choice but to overreact. In fact, this is a self-inflicted wound because the politicians lead people to expect the government to look after them.
The final fiasco is that disciples of the false story about human-caused global warming saw an opportunity to further their agenda. They ignore the fact that the models were wrong about the blizzard and make claims that are scientifically inaccurate. Of course, they will never give up as long as they ignore reality and their jobs and careers are dependent on maintaining the deception. The storm of 2016 shows how the deceptions are occurring at the local and global scale.
===============================
UPDATE:
The Washington Post reported that airport weather observers lost their snow-measuring device in the blizzard. National Oceanic and Atmospheric Administration spokeswoman Susan Buchanan would say only that “questions were raised about the reading.”
As a result, she said the National Weather Service would assemble an internal review team to assess how snow measurements are taken at Reagan National and other locations.
Uh, “centimetres” [sic]? I think you mean inches. 20 centimeters (5″) is just a basic winter snowfall in New York, Pennsylvania, or Jersey.
We got 16″ (~40cm) in north Richmond VA. My son in Winchester measured 24″ (~60cm). DC got upwards of 20″ (~50cm).
“A centimetre (international spelling as used by the International Bureau of Weights and Measures; symbol cm) or centimeter (American spelling)”
Sigh…
Well, here in merica, we use inch, feet and Fahrenheit. We don’t need none of those fancy French metric system units here.
“We don’t need none of those fancy French metric system units…”
Except for when we buy giant bottles of soda. Small sodas we buy by the ounce, bigguns by the liter. Not litre.
“Except for when we buy giant bottles of soda.”
Hah, I knew it… It’s a conspiracy to makes us all fat!
Officlal Canadian Government spelling as issued in the 70’s when we went metric is metre for length and meter for a device that measures flow like in a water meter or gas meter.
Thing is, the Canadian Federal, Provincial, and Municipal governments can’t read their own standards but when we first went “Metric” the government bureaucrats made sure all Engineering Consultants followed the rules so the spelling is completely ingrained in those of us who went through the Metrication in the 1970’s. The indoctrination was so complete that I actually have to think about the difference between mm and cm because on Engineering Drawings we used only mm and metres. Building drawings, for example, were almost always in mm so 3 feet became 900 mm, 2 feet was 600 mm, 4 inches was 100 mm – pipe sizes all went to mm in general – 50, 100, 150, 200, 300, 600. Pipeline right of ways and roadways were typically in metres – 10 metre R/W; 20 metre R/W – and long distances of course in km. When I see ski reports in cm, I automatically convert to mm because I worked in those units for 40 years even though we all know there are 2.54 cm to an inch. Course I measure my horses heights in hands – which is to the top of the wither. One hand is 4 inches or roughly 100 mm. Then again, how many Firkins in a Hogshead? The Brits will know.
The human mind is an interesting place.
http://www.thecanadianencyclopedia.ca/en/article/metric-conversion/
“Wayne Delbeke says: January 31, 2016 at 5:54 pm”
It’s even worce than that. Engineering drawings I had to read in metric, and the machine I had to use was in imperial!
I prefer the hand-stone-fortnight system.
” by the liter. Not litre”
It comes from the French, so it is written according to French rules. But what can you expect about a country so ignorant they can’t even write aluminium right. Only pig-ignorant Americans would misspell litre, but what can you expect. Actors on American TV shows pronounce “solder” as “sodder”. Amazing that they can rule the free world. But not for long. The IPCC will fix you bad-spelling lot up quick smart.
And why does this site have an American spell-checker. It keeps marking perfectly good words with a little red squiggle underneath.
5 cm is 2 inches. 30 cm is 1 foot. 100 cm is 1 meter. 3 meters is 10 feet. approx.
The metric system is hopeless for navigation. It is a decimalized distance from the equator to the north pole. Metric maps for navigation are a disaster.
The nautical mile in contrast is a unit of time, based on the earth’s rotation, dividing the earth into 360 degrees.
This gives us present day latitude and longitude. 1 degree of latitude is 60 nautical miles. 1 degree of longitude is 60 nautical miles cos latitude. 360 degrees * 60 nautical miles/degree = 21600 nautical miles = circumference of the earth. 1 knot = 1 nautical mile per hour.
This allows onboard navigators to directly determine ship or aircraft position using a clock and the position of celestial bodies in the sky, using the “equation of time”. The equation of time is the difference between mechanical clocks and a sundial. Electronic navigation such as GPS replaces celestial bodies with satellites.
“Metre” would be pronounce “Met” – “Tree”. Clearly the wrong spelling.
20cm is 8ins.
20cm =~8 inches, sorry.
Tim…..shouldn’t this be “don’t” want to know?
“who don’t know what they are talking about, or, worse, (don’t) want to know.”
“We actually get it right a lot of the time,” he said.
…I can do the same thing with a coin
““We actually get it right a lot of the time,” he said.
…I can do the same thing with a coin”
But your “coin” wouldn’t tell us the area the storm affected. The strength of the storm, or the depth of the snow or it’s start/end.
Now would it?
The usual “they always get it wrong” knee-jerk comment. … To which the answer is of course.
That’s just as impossible as always getting it right.
Clue: coz it’s a forecast – (with and inherent probability of being correct).
The answer lies in between and increasingly towards the correct end – even, as in this case as much as a week beforehand.
Unless you want to specific ridiculous detail.
Yes the article is confused and wrong as people have pointed out.
Some of that material relates to a storm forecast in early 2015, not 2016.
Tim should consider whether that should be made clearer.
I have to disagree with some snow fall amount you gave for New York area. Central Park received 26 inches just shy of the 26.4 they received in 1947. I skied in New Jersey at that time. Here in Westchester we had 17 inches and my nephew in Landsdale, Pa said he had 18. North of us was much less. It really varied all over the place but we coped fine. New York City had every one get off the roads by 2:30 pm so they’d could be cleaned. Sunday every thing was pretty much back to normal. Washington can not handle snow. They couldn’t when I lived there in the early 1960s and they can’t now.
The snow data were “adjusted”, just like global temperature data. As Dr. Ball says, the models were all wrong and there was hardly any snowfall at all.
/sarc?
Except for the 37″ in a north west suburb of Baltimore. The article is garbage.
Thanks Dr. Ball: In question and answer period in the House of Commons Canada last week the MP’s are use the term Greenhouse Gases much more. And in my opinion are backing away from the term Climate Change. Justin Trudeau I believe he is using a subliminal messages try to lump Co2 as pollution. PS their was nothing more silly then Oct 24, 2015 – An enhanced satellite image showing Category 5 Hurricane Patricia at landfall near Cuixmala, Mexico at 6:15 p.m. CDT, Oct. 23, 2015. CNN had egg all over their face with that one.
Yes, Patricia’s eye seemed to suddenly disappear Just before landfall !!
What has COBALT – Co on the table of elements – have to do with your comment?
Do you mean Carbon Dioxide? – CO2?
NASA, NWS and NOAA need a lot more than just a clean up, they require a complete fumigation to rid us of all those Glo.Bull Warming Alarmist cockroaches !
Easy Nellie !!
You ever had to predict a storm that might affect 10’s of millions ?
The media is gonna write what they’re gonna write.
Yeah, well, people are actually beginning to laugh at alarmists, if they don’t just ignore them. Scientists are quietly distancing themselves from the worst of the rhetoric, too.
Not the end, not even the beginning of the end, buy the end of the beginning
I don’t “buy the end”. Still $$ on the march.
There is always going to be a lot of hoopla and hubbub as a storm brews. It is actually part of the fun. Don’t let the Global Warming Alarmists ruin the joy of a good storm.
In New Hampshire we didn’t see a flake of the last nor’easter, but I had great fun scanning through the web and seeing the ruckus down south. We taxpayers up here get a sort of relish (a bit mean-minded I fear) when Washington DC gets clouted and we don’t.
A couple of images made me chuckle. First was the mayor of Washington hunkered down in the Homeland security emergency management bunker, basically telling everyone to stay inside, and the second was pictures of crowds sledding down the hill the US Capital is on. Apparently it was the first time sledding was allowed there in a hundred years, which likely got some official in trouble, but he probably figured terrorists don’t go out in the snow.
I’d hate to be the guy who has to forecast such storms, because there’s always places that get less than expected, and always places that get more.
Alarmists get their fun by making up excuses for snow further south than last year, and I get my fun by shooting their excuses full of holes, which is easy to do. Usually it only takes a history book.
The best way to enjoy a storm is to get your driving done before it starts.
Former NH resident; now in FL – Caleb’s last line is truth.
I hadn’t heard anyone mention it here this year, so I guess I have to take on the task. Ah – someone did elsewhere. When I saw all those sledders in DC, I said to myself “RFK Jr is wrong.”
http://donsurber.blogspot.com/2016/01/dc-suffers-curse-of-rfk-jr.html reminds us of his regretable impression of David Viner from 2008:
Surber closes with:
Gaia seems to have an ear out for absolute statements regarding weather trends, particularly from warmistas.
They seem to have almost perfect timing in declaring droughts to be permanent just before record and epic rains return, calling for an end to cold winters or snow just before frigid winters and record blizzards, etc.
This record of failed predictions must be added to the rest of their record of wrong predictions and alarmist warnings.
The other thing I find noteworthy about this tendency toward epic fail predictions is a near perfect record in acknowledging their errors: It is always terrible things predicted that we must all wring our hands over, but never come the sighs of relief or all clear signals when the predictions prove completely wrong.
Who has ever heard a warmista thank their lucky stars that the grave catastrophe of a less frozen Arctic wasteland proved unfounded?
Another great picture I saw was of a man in Virginia who “did not own a sled”, but made one to tow his toddler about in, by attaching a rope to two holes punched in a large, trimmed, disposable diaper box.
Where there’s a will there’s a way.
Philadelphia got a lot more than a few centimeters. About two feet all around Center City and South Philly, about 30 inches on the Main Line in many of my friends’ back yards…
Anyone does not believe it I have a ton of pics sent by friends. Several people heard thunder and saw lightning during the storm. And winds were near or at 35mph for many hours, although the buildings tend to keep snow from blowing into blinding whiteouts in built up areas, so blizzard conditions are had to get.
Joe Bastardi called this storm months before on his weekly Saturday update.
+10
I’m 100% certain that it was the worst winter storm since last winter, and if I shred my records it will be worst storm since records began.
“I’m 100% certain that it was the worst winter storm since last winter…”
Only in the east.
Out west has had some humdingers already, including one that killed cattle by the tens of thousands in Texas and New Mexico, mostly by suffocation under giant drifts, one early season one that was unusually heavy, across the northern plains, and several in the Sierras and Rockies.
+1!
Do you mean 97% certain?
“False Attribution To Global Warming.”
I think people must be getting PhDs in “False attribution to global warming” at may universities worldwide.
Dad: Hey, what are you going to major in?
Kid: False attribution in climatology. If I can’t get in on the bandwagon, it will be good for politics as a fallback.
Dad: Great. You always had a good head on you.
If we believe their rubbish about all the disasters to come because of so called CAGW, we also know that it will not change through any mitigation efforts from the OECD countries.
Even their icon Hansen called COP 21 BS and a fra-d, because he knows that at least 90% of new co2 emissions until 2040 will come from developing countries like China, India etc. Also Lomborg’s PR study tells us that we can expect no measurable difference to temp by 2100, even if the COP 21 idiocy was followed to the letter.
Saw a great cartoon recently.
It was a picture of St. John’s, Newfoundland buried in snow. The caption read something like, “You call it the greatest blizzard ever, we call it Wednesday.”
Storms like this are by no means unprecedented, and media has been hyping and people overreacting to big snowstorms since I was a child. The run on stores in advance of even a few inches of snow is legenday in the Philadelphia area. Mainly because people hate to run out of the staples when everyone will be mostly inside for several days in a row, and everyone understands that one must take predictions with a grain of salt.
One other minor disagreement with the lead post…nor’easters are, as far as I have ever heard, distinct from Alberta Clippers.
Clippers are typically fast moving secondary lows which move southeastward out of Canada on the northwesterly winds behind a big storm or Arctic front. They are usually moisture starved, small, and fast moving, and almost never drop snow after crossing the Appalachian mountains. Nor’easters come up the coast, and there is often a transfer of energy to an induced low off the Carolina coast which then bombs out, meaning that air pressure drops rapidly and snow intensifies suddenly and winds pick up dramatically. These are notoriously difficult to forecast accurately, as the transfer of energy may happen slightly east or west of the anticipated location, and then the track may take the storm more offshore or more hugging the coast. A small difference in position and track can be the difference between a rain event in the major cities, a big snow storm, or nothing if it tracks out to sea.
This storm had no energy transfer, as the surface low and the upper low merged over land, and that was one reason for the unusually long duration, heavy snowfalls farther south than is common, and the prediction several days in advance.
As far as I could tell, models pick up on the correct storm track and heavy snow while the low was still out over the Gulf of Alaska. Trying doing that by eyeballing synoptic charts.
From AccuWeather.com
“An Alberta Clipper, or clipper for short, is a low-pressure system that develops on the lee side of the Canadian Rockies (in Alberta), gets caught up in the jet stream and travels southeastward into the northern Plains, on through the Great Lakes and eventually off the mid-Atlantic coast into the Atlantic Ocean.
A clipper will usually bring smaller amounts of snow (generally 1-3 inches) because of its speed and lack of deep moisture, but higher amounts are certainly possible. Along with the quick burst of snow, a clipper generally brings colder temperatures and often times gusty winds.”
http://vortex.accuweather.com/adc2004/pub/includes/columns/newsstory/2013/590x422_02041505_map_640w_590.jpg
I have been a forecast meteorologist and research scientist in Alberta for many many years. You are exactly correct in your description of Alberta Clippers. Nor’easters are not Alberta Clippers. The formation and movement of the two are quite separate, as you point out. Any competent meteorologist in Canada would know this.
There is no way a meteorologist would have been able to forecast this storm well in advance without the use of models.
Another poor scientific statement made by Mr. Ball is “They ignore the fact that the models were wrong about the blizzard…”. What is meant by “wrong”? Was the position of the snow wrong, were the snow amounts all wrong, was the track of the low center wrong, were the winds too high/low, etc? A good scientist would never make such a broad statement without a detailed analysis and discussion.
All in all, a poor summation of the storm by Mr. Ball. I hope his other climate analysis is on a much more scientific basis.
Northeasters can be especially destructive to the coastlines of the Mid Atlantic states. Imagine one that lasts three days. Google “The Great Atlantic Storm of 1962.”
This post was intended for Menicholas.
Don’t forget WUWT has search function too. It’ll suggest my http://wattsupwiththat.com/2012/03/06/50-years-ago-the-great-atlantic-storm-of-1962/
Good article. Thanks.
Very true Richard. Nor’easters have shaped the coastlines in many places to their present configuration.
There was terrible flooding from this storm along the New Jersey coast. I have friends and family living there, and owning vacation homes. Cape May had what was reported to be worst flooding on record.
Other shore towns nearby were cut off during the high tides which occurred.
I saw it coming, and warned friends, via social media, to expect bad flooding days before the storm hit, knowing that the full moon and proximity to perihelion would enhance tides and hence flooding.
@Ric, re the article about the ’62 storm, that was a great read, enjoyed it immensely the writing was great and precise none the wishy washy baloney you see today!
Accuweather, who tells me it’s raining when it’s not, and tells me it isn’t raining when it is. Entrails are more accurate.
N. N. Tales notes the correlation in weather prognosticators of academic-like tenure and their lack of skin in the game, doxastic commitment. They don’t get fired for lying or screwing up.
Well, parts of the northeast and mid-Atlantic. Northern New England (Vermont, New Hampshire, and Maine) got essentially nothing to go along with the paltry less than a foot (30 cm) we’ve had the rest of the season. From home, just north of Concord NH:
http://wermenh.com/images/snow_stake_20160131.jpg
The stuff on the ground is really sintered sleet from a “mixed precip” storm
a month ago. However, it will probably succumb to a warm spell and rain on Wednesday.
While I was really in the mood for a good blizzard, any storm that misses us
and hits Washington DC is still a win in my book. 🙂
That’s a cool measuring gauge. I’ll have to find one for my back yard. 🙂
It is cool, thanks. It does have an extra two foot section that will stack under this section with the arrow. Problem is, I can’t add it mid-season. I suppose I could start with the low section, but most seasons one section is fine.
It is copper, so it does melt more nearby snow than I’d like, so I have to get down with the snow to read the depth well.
Ric, I’m just north of you near Laconia. It appears we have less snow than the Capital Area and even less after this weekend. Winnipesaukee isn’t frozen over so the Ice Fishing Derby may not happen. I have heard more than a few folks say it’s all the fault of AGW, but I reminded them what the previous two winters were like and they shut up and went away.
I did enjoy watching the snowy ‘meltdown’ in the affected areas and commented more than once on various forums that what they call a calamity we call normal up here.
Dude, spend some time driving with these people and you wouldn’t say that. The lack of skill is horrendous when it’s 60 and sunny. Put any of that white stuff on the road and it’s carmaggedon. A day before the big storm hit a light dusting came through. No measurable accumulation to speak of, but the entire region of engulfed in car wrecks. Trust me, when it snows in the Baltimore/Washington area you do NOT want to be driving!
The article in CBCNews quoted here is dated 27 Jan 2015, and had nothing to do with the Jan 2016 storm, which did yield very large totals including at Washington D.C (B/W airport 29.2 in/74 cm)., Philadelphia (airport 19.4 in/49 cm)and New York (airport 30.5 in/77 cm), and which seem more-or-less in line with the forecasts of 30 – 70 cm.
For the failed 2015 storm, Philadelphia never had forecasts by well-known credible weather forecasting outfits past 20 inches (51 cm). Where did 60 cm for Philadelphia come from?
‘They are physically cleaning up after the “Blizzard of 2016” in the northeastern US. The job is not as onerous as anticipated and is going slowly because the government is in charge.’
“…and is going slowly because the government is in charge.”
Thank you very very much for a good chuckle. That line still brings a smile to my face as I type this. Oh, and how true.
Why are we calling it “The Blizzard of 2016” ? Seems a bit premature to assume it will be the worst storm of the year.
Maybe “The First Blizzard of 2016″ would not sell as much advertising?
Generally there’s only one “worst” storm that people remember. Things get really confused when there are multiple storms. Someone really ought to name them – Oh wait – I take that back. I hate the weather.com names for reasons I haven’t figured out completely.
Hurricanes have names because, well, they are hurricanes. Strong weather systems in themselves regardless of whether they hit land or not.
Winter storms of the past have earned a name. (Blizzard(s) of ’78?)
The Storm Channel names systems that produce snowfall to promote their own importance?
Maybe to give the impression that a winter storm is unusual?
Maybe hoping that this winter storm is worse than last year’s?
OK. I don’t know either.
(Someone tell me when they start naming thunderstorms.)
“(Someone tell me when they start naming thunderstorms.)”
I understand they are already naming dust devils.
Yes, there’s one that goes by the name “Taz”.
And naming water spouts as hurricanes…Naw that wouldn’t happen would it? Although I remember something in the way of a disaster reported: Insy winsy spider went up the water spout….
One reason it makes sense to have names for tropical cyclones is multiple cyclones can be out there simultaneously. Distinguishing them as “the storm that formed last week” or “the storm that destroyed the Honduran banana crop” just doesn’t work.
OTOH, I’ve been explaining the difference between the midwest and New England blizzards of 1978 since before I wrote my web page on the latter.
Let us hope we never get to the point that we are retiring the names of winter storms.
Cold really is worse that warmth.
Have to jump in for my namesake here. In any case late 80’s several nor’easters retrograded south. Took years to fix the beach erosion. I’ll get interested in named storms when I see the criteria for retiring a particular name.
And who got to name the storm and why Jonas? At least if you go alphabetically the name gives a relative reading of when in th season
So now ‘predictions’ are called ‘models’ and ‘weather’ is called ‘climate’. The only difference is the level of hype, half truths, and blatant misdirection being spewed by the MSM at the behest of organizations driven by ideology. Temperature, precipitation, and historical records are no longer important to adjust our daily living preparations by as they are for political agenda. “They’ll tax the air you breath” used to be a joke.
Science has become a political tool. The way to control the masses is to control information and knowledge.
” Propaganda is a form of communication, often biased or misleading in nature aimed at influencing and altering the attitude of a population toward some cause, position or political agenda in an effort to form a consensus to a standard set of belief patterns” Here’s some law history http://scholarship.law.berkeley.edu/cgi/viewcontent.cgi?article=2877&context=californialawreview
There’s a lot to critique in here. Most doesn’t matter all that much to a lot of people, but it’s all important to us New England snow freaks.
First, the recent storm was not an Alberta Clipper. It came ashore in California and trekked across the country. I’m not sure what it brought to the Gulf states, perhaps someone has the time to fill that in. These southern storms pick up a lot of Gulf moisture and with the storm track south, there’s cold air to the north, and after making the transition to a coastal storm they can clobber the mid-Atlantic states.
The blizzard that hit at the end of the Copenhagen CoP that forced President Obama to bail a day early may have been one of these, the 1993 “Storm of the Century” formed in the western Gulf of Mexico and spun up quickly there.
Alberta Clippers start out moisture starved, travel across the northern US, transfer their energy to the coast around southern New England and may “bomb out” in the Gulf of Maine. They generally bring me just a few inches of nuisance snow.
The best storms for me generally bring rain to Boston. They come up the coast, but come inland west of Boston and east of me. However, they miss out on some of the moisture feed off the Atlantic and it turns out the biggest snow storms here are smaller than the NWS records in Portland ME, Boston MA, Worcester, MA, and Hartford CT. We just keep the snow longer than they do.
Here are some good notes on the 1993 storm – http://www.srh.noaa.gov/tlh/?n=march1993_superstorm
I seem to remember a few nor’easter’s that bombed out and then just stalled, where it took days for the snow to stop. I think “The Hundred Hour Snow” might have been in 1969.
The 1997 Super Storm didn’t stall. It was just a monster, and came roaring up the coast.
I meant the 1993 Superstorm. 1997 Was the April Fool’s Storm.
I think the statement “people who don’t know what they are talking about, or, worse, want to know” should read “people who don’t know what they are talking about, or, worse, don’t want to know.”
So true. Especially since the original phrasing can be read as “people who don’t know what they are talking about, or, worse, people who want to know” or “people who don’t know what they are talking about, or, worse, people who don’t know what they want to know.”
Thank you Dr. Tim Ball.
Your “broadside” smashes a hole in their great global warming (gravy train) nonsense.
Excellent article indeed.
Thanks, Dr. Bell. Good article, and thanks for mentioning Michael Crichton, his “State of Fear” (2004) was the book that got me interested in the climate deception. In 2006 Al Gore with his “An inconvenient Truth” really got me going.
Sorry, I meant to write “Dr. Ball”.
Dr. Ball you need to fix your reporting. The blizzard might have been overhyped but your completely wrong (not inaccurate, wrong) figures for the snowfall totals make you look like a raving lunatic.
I’ve been lurking here for a long time, and this is my first post, mainly because I believe the truth is much more important than anything else. Don’t drag this website down with this garbage.
Agreed, in the Philadelphia/NJ region the forecast was spot on, slightly underestimated NYC but as typical for such storms in this region the northern boundary can be quite sharp and a few miles variation can make a large difference.
I was expecting 20″+ and we got ~23″, I had to dig the most snow from my driveway in the 30 years I’ve lived here. The strong winds (also accurately predicted) caused some drifting, the bottom of the drive was 30″+ deep. We were lucky that the storm hit over the weekend allowing the snow clearance crews to do a great job in clearing the roads. Should the forecasts for this week be as accurate we’ll see the mid 60s on wednesday (not a record but 15ºF above average).
Regarding: “While Philadelphia, New York and New Jersey had braced for 30 to 60 centimetres of snow, they got far less than that. New York City received about 20 centimetres, Philadelphia a mere 2.5 centimetres or so. New Jersey got up to 20 centimetres.”
Actual snowfall totals:
NY City:
Central Park: 68 cm
LaGuardia Airport: 71 cm
JFK Airport: 77.5 cm
Philadelphia (PHL airport): 57 cm
Atlantic City NJ: 32 cm
Newark NJ: 71 cm
..I think it should be inches ??
Donald L. Klipstein commented:
“Actual snowfall totals:
NY City:
Central Park: 68 cm
LaGuardia Airport: 71 cm
JFK Airport: 77.5 cm
Philadelphia (PHL airport): 57 cm
Atlantic City NJ: 32 cm
Newark NJ: 71 cm”
For January 22 – 24, 2016 your numbers are WAY off, bogus, wrong. Where did you get these numbers?
I translated to the nearest .5 cm from the combined inch figures (by multiplying by 2.54) in the daily climate reports for 1/22 and 1/23 from the National Weather Service. Links:
http://www.weather.gov/climate/index.php?wfo=phi
http://www.weather.gov/climate/index.php?wfo=okx
Oops my bad on comment to Donald Klipstein…..your numbers are correct, I was the one that made the error.
Weekly wrap-up: Blizzard of 2016 ranks 4th among worst winter storms of past 100 years TO HIT THE NORTHEAST !!
https://www.ncdc.noaa.gov/snow-and-ice/rsi/nesis
So then it was pretty bad
Ummm NO , It’s called winter weather…!
This storm rating is based on several parameters which may or may not be relevant to a particular person or a particular place. This storm was rated bad because many large cities had very high total snowfalls, there was a lot of damage at the shore points due to flooding, some locations that rarely see heavy snow got a very large amount, and the storm persisted over a wide area for a longer than typical amount of time.
Not saying if it is or is not hyped up compared to historic storms on this list due to it being recent (Tony Heller has what I considered a very funny post this evening, pointing out the difference between global warming caused blizzards and global cooling caused blizzards.) and thus due to what is now called “climate change”. When warmistas say those words, it must be understood that they are referring to CAGW, using the obfuscatory language which they favor.
Dear Tim,
I keep banging on about the use of the term “climate change”.
They (the IPCC and the headline grabbing media) have hijacked this expression so much, that many people don’t even question it when they read it or say it.
I should be pleased if you would kindly consider using (in your next articles) the more correct term “climate(s)” or “climate systems” instead of climate change.
The CLIMATES about the earth do of course change every split second of time and so it makes no sense to repeat their misleading expression.
I do hope you agree and I know a few others (here on this thread) who would also appreciate this request.
Thank you for yet another splendid “broadside” of paragraphs which blow a bloody great big hole right through the nonsense.
Regards,
WL
Yay. I read this after making the comment in reply to Marcus just above.
I agree completely Warren.
I disagree completely. Climate is the system of weather parameters which have a known range of values. Only persistent occurrence of values”out of range” qualifies as climate change. The known range limits haven’t even been briefly visited for centuries.
Brian H,
There is no such thing as climate change.
Regarding nor’easters beginning in the lee of the Rocky Mountains and often being called Alberta clippers at that point: Most nor’easters don’t start as Alberta Clippers, but start somewhere farther south – usually in or southeast of Colorado. A few move into the southern or south-central Plains from California. Some form in the Gulf of Mexico, and a few begin in the southeast US or even offshore of the US east coast.
The Wikipedia article does not say that many nor’easters start as Alberta Clippers or Canadian clippers, although they mentioned one that did start as an Alberta Clipper.
Regarding: “Historically, because there was a much greater storm in 1888 that followed the same path as the storm of 2016. Global temperatures were lower at that time.”:
The Great Blizzard of 1888 did not follow the same path as the January 2016 one, but took a more northerly path. New York City received 21.0 inches from the Great Blizzard of 1888, and more than that in three more recent storms including the January 2016 one.
The Great Blizzard of 1888 had higher winds and probably a lower central pressure than the January 2016 one, but had less moisture to work with. There are places farther north where records set by the Great Blizzard of 1888 still stand, but it snowed for a longer period of time there because the storm stalled or nearly stalled.
I find it more interesting to measure snow by the can.
From Lisburn, PA.
Jonas finished the sixpack!
Dr. Ball: Readers may be confused because you mixed information about the recent 2016 nor’easter (dubbed Jonas by the media) and a potential nor’easter in January 2015 that didn’t produce much snow.
1) For the most part, snowfall from Jonas was at the upper end of the forecasts: 2-3 feet in the hardest hit areas. Philadelphia airport received 22″. La Guardia (NYC), 27″. Dulles (Washington DC area), 28″. Storm surge on the Jersey and Delaware coasts reached to 9 feet. (Peak surge was 13 feet during hurricane Sandy, but this Nor’easter impacted more coastline.) https://weather.com/storms/winter/news/winter-storm-jonas-latest-storm-reports-blizzard
2) Gary Szatkowski apologized for a storm in January 2015 (a year earlier) that didn’t develop into a nor’easter. Forecasting snow storms in the Mid-Atlantic is difficult because the amount of snow depends greatly on the track the low take as it moves up the coast. Storms moving northeast from the Gulf of Mexico traveling just off the coast mix moist air from the Atlantic with cold air from the north and produce large amount of snow over a band about 50 miles wide to the east of the path taken by the low. Those traveling over land or too far from the coast do not.
With Jonas, the “fear-casting” by the media warned citizens of a dangerous storm. The snowplows didn’t reach my neighborhood in Northern Virginia for 4 days. As for the Blizzard of 1888, it started as rain in Washington DC and had its greatest impact further north, in NYC and especially the interior of New England. See the snowfall map at 00:11 in this video.
http://www.accuweather.com/en/weather-video/video-weather-history-the-great-blizzard-of-1888/2220051069001
While the Blizzard of 1888 may have been the most powerful Nor’easter in history, it probably wasn’t the worst storm in the Mid-Atlantic (Philadelphia to Washington DC). And Jonas produced almost no snow in Central New England, where the Blizzard of 1888 dropped up to 4 feet. In my experience, we get nor’easters similar to Jonas about once a decade, which means that some of them produce record snowfall in some locations. In many cases, systematic local records extend only about a century into the past, so The Blizzard of 1888 isn’t in many record books. While some alarmists believe that it may be hotter now than at any time in the past one or two millennia, none of them claim to know much about record storms for more than an century.
You are correct in noting that none of these storms have anything to do with GHG-mediated climate change. And the weather-prediction programs that succeeded with Jonas and failed a year before have nothing to do with the AOGCMs that predict 3+ degC of warming from doubled CO2. The former have been validated comparing their forecasts with observations. Experience teaches that they are reasonably accurate several days in the future and lose all skill more than a 1 week in the future. We know that AOGCMs have no skill hindcasting and forecasting on a decadal time scale and they disagree about regional climate change. It will take a half-century or more to know whether any of today’s AOGCM has any skill at predicting future climate change.
Ah yes, that’s the major disconnect in the essay. This article at http://www.cbc.ca/news/snowstorm-forecasters-under-fire-as-historic-accumulation-failed-to-materialize-1.2933628 is dated last year, Jan 27, 2015.
The biggest challenge in the recent storm is that one of the models, the NAM, headed off on its own calling for a more northerly track and snow extent. Ultimately it verified pretty well. The snow depth gradient along the northern boundary was extremely steep and just a few miles travel brought people to extremely different conditions. The rest of the storm I believe was forecast quite well.
Excellent summary Frank.
And thank you Ric and Frank for pointing out that the article mixes up details of two separate storms a year apart without making this clear.
IIRC, the storm last year which was an epic fail did nonetheless hit points further north fairly hard, contributing to the record snows in Boston last year.
I think the storm last year had come on the heels of a string of more accurate forecasts, and due to this the cautious uncertainty that forecasters typically use in their storm calls was almost completely skipped, and the warnings went out is if confidence was very high. The Mayor of New York closed the city and cancelled train service over a day in advance, and thus many millions were greatly inconvenienced for what turned out to be no reason. But, again, further north the storm did hit, and so it was an error of placement most of all.
Having grown up in Philadelphia, I can vividly recall many times epic snows were predicted and nary a flake wound up falling, but in the dim distant past people were less likely to be snowed by an inaccurate forecast, being very skeptical until snow was actually falling. Philly is often on the rain snow line during winter storms, and the difference of a few tens of miles in the storm track is the difference between no precipitation, epic snow, or 33 degree heavy rain, which is by far the most unpleasant weather to have to endure outside.
I grew up down the road in Delaware. In the 50’s there was “Wally Keenan the weatherman”. (Channel 3, I think) Our rule of thumb: “not to worry” when he called for heavy snow and “watch out” when called for only a few inches. There was so often a sharp divide in precipitation in our area such that we referred to it as the “canal effect” (for the C&D canal). Snow north and rain south or vice versa. Fun days.
India receives severe cyclonic storms in pre-monsoon season, monsoon season and post-monsoon seasons, wherein temperature shows a decline from pre- to post-monsoon seasons. The cyclonic storms are basically depends upon the general circulation pattern that provide wind and temperature gradients at that time. The PR warmist groups made it a point, when a disaster affects Indian region, they were quick to issue a press statement and the media gives sensational hype. When we write to the Prime Minister of India on real causes and sent to media, they rarely publish them. In India, all most all important cities have PR groups of IPCC/Al Gore. Most of the PR groups have no basic knowledge of meteorology & oceanography.
Dr. S. Jeevananda Reddy
Regarding “produce large amount of snow over a band about 50 miles wide to the east of the path taken by the low”: Nor’easters producing heavy snow in the mid-atlantic and/or northeast coastal USA (and as far inland as the Appalachian foothills, even the Appalachian Trail from Massachusetts southward) tend to do so in a band west of the track taken by the low pressure center, at least the surface low pressure center. A surface low pressure track of a major snowstorm nor’easter in these areas usually has much of the precipitation being rain.
Tim says “It is nice to learn that NOAA has records covering the entire multi-billion-year history of the region as the word “ever” indicates.”
You are quoting a random web site not NOAA. But good job deceiving people…
Nothing warms the heart more than watching the powerful folk in wash dic experiencing real power from a little snowstorm … but be of good cheer … whether at the office pushing around piles of papers or stuck home for a week due to a couple feet of frozen water crystals, the rich and powerful get paid without fail … unlike real people that really have to work and produce.
Hey, I know many places get big snows on a regular basis, but two feet is not, I do not think, a “little snowstorm” much of anywhere.
Routine in lake effect snow belts and mountain passes perhaps, but even in these places they are not little.
In such places there are not large buildings with flat roofs, people all have snow tires and also chains in their trunk, and cities do not lack snow removal equipment.
There you go again with all those stereotypes … and yes, a couple feet is a little snowstorm, even here in Buffalo … it only causes a problem when the forecast is wrong and the plows are still in the garages when the snow starts or the snow keeps on coming and coming and is measured in yards+. But then we do what we’re always doing … we deal with it. And what fantasy world is it where all have snow tires and chains? Where? Maybe on emergency vehicles; otherwise, if it’s really bad, stay home an extra couple hours till the plows have done their work plowing and salting the streets until they’re clear … or mostly clear. And if you can’t wait, drive a bit slower. The only place I’ve ever been where snow tires came in handy were the rural areas of the Great Plains, where roads aren’t plowed .. or salted … ever.
And as for those poor paper pushers … they couldn’t even handle an inch of snow that came before the main event … how can anybody so embarrass themselves by not being able to handle an inch of snow??!! I keep my slippers on when there’s only an inch out when heading out to the mailbox.
Even in Buffalo?
What does that mean?
You must have a great boss if you can “just stay home an extra couple of hours if it is really bad”
No one can drive through two feet of snow. You said yourself it causes a problem if the plows cannot plow it.
So, which is it…two feet is nothing, or it is reason to be hours late for work until the ploughs catch up?
Here in Florida it is 90 degrees every day from May until October, and no one calls it a heat wave, like they do in places that do not see long stretches of 90 degree weather.
But if I was to say 90 degrees is not even hot, and no one worries about it unless their air conditioner breaks or the power goes out, that would be the rough equivalent of what you are trying to claim.
So you have rubber slippers that do not get cold and wet unless there is more than an inch of snow…so what?
Two feet of snow is two feet of snow. In places where plows can clear every road in a couple of hours…it is not a paralyzing disaster like in places where that cannot happen and the city closes down.
And tell me, do the airports in Buffalo just let the planes circle for a few extra hours while the plows clear out two feet of snow…or do the planes just take off and land in it because that is nothing up there?
“Two feet of snow on a roof can weigh 19 tons. Because of that, emergency rescue crews are dealing with numerous roof collapses across western New York following the second round of lake-effect snow, county officials said. VPC”
“Much of northern and western New York will be hit by heavy snow through Friday, with an additional 2 to 3 feet possible, AccuWeather meteorologist Alex Sosnowski said. ”
Just picking at article at random, we see two to three feet (same amount as fell from Jonas) described in new York near Buffalo as “heavy snow”.
http://www.usatoday.com/story/weather/2014/11/20/buffalo-lake-effect-snow/19315879/
Well it seems Dr. Ball confused storms in two different years, but had he been right, I see this kind of reporting as done in an echo chamber. I wonder if there is some way to hammer home to a broad audience the deceptions and hyperbole that DOES constantly assault us from the clime-syndicate fantasies that never get rectified. Isn’t there some kind of ‘crowd sourcing’ or some such way to broadcast obvious malfeasance. I guess only expensive ads in newspapers and TV. I’m sure the failing lefty press would be reluctant to turn down any revenue these days.
“You made a lot of tough decisions expecting us to get it right, and we didn’t. Once again, I’m sorry.”
Should that be “You made a lot of tough decisions expecting us to get it right, and we didn’t, once again. I’m Sorry.”?
Can anyone please tell me do the weather stations for NOAA use micro wave technology to measure temperature the same as the satellites and what doctors use nowadays to measure temps? I am having argument with someone who says the land thermometers are much more accurate than the satellites.I heard Will Happer say they all use the same tech. Thanks
Trev, you asked a huge question, but the short answer is “no”.
They are not the same.
Doctors have a few different sorts of touchless thermometers I think, and all are different from the sensors used in the new MMTS weather station recorders. Docs and laser thermometers use infrared lasers, MMTS use a sort of thermistor, which contain a device with a certain sort of metal in which electrical resistance varies depending on temperature, IIRC.
And both are different from what is used by satellites.
There is no shortage of articles and long conversations on this topic here at WUWT. Our host led a project to identify badly sited weather recording stations, which found many that were in spots that were guaranteed to give inaccurate results, usually way too hot.
Also in no short supply are opinions regarding which is the best way to record temperature data.
Most people who are what I refer to as global warming skeptics think the surface thermometer data is all but worthless, owing to many factors, not the least of which is the so-called Urban Heat Island affect (UHI), by which increasing urbanization tends to warm readings by dint of ever increasing amount of hard paved surfaces, more and more buildings, and air conditioners, and heat sources, and all manner of other things that tend to alter what was found in years past, and alter them in an increasingly significant amount.
Use the search box here using keywords.
No, you will have to wait for my longer answer to clear mods.
I don’t of what these “laser thermometers” are. I have a nice (Kintrex IRT0421) infrared thermometer. While it has a red laser, it’s used for aiming the thermometer, the IR secition has a fairly narrow field of view. Medical thermometers use the same infrared tech, but don’t have the laser, and I believe try to “see” an artery. The manual is unclear.
They aren’t used in weather stations, They work best when used on something significantly warmer than the thermometer’s “optics” (which is also radiating at infrared wavelengths)
The satellites are looking at microwave emissions from oxygen. Roy Spencer notes at http://www.drroyspencer.com/2010/01/how-the-uah-global-temperatures-are-produced/ :
As for ground level measurements, the MMTS used by observers is that thermistor based tech Menicholas described. That replaced reading liquid based thermometers. The automatic stations used at unmanned weather sites use something like that, but it has a warm bias, especially when failing, see http://wattsupwiththat.com/2008/01/10/inside-the-asos-ho83-tempdewpoint-sensor/ for more.
Trev,
Surface station thermometers are anywhere from ±1ºC to >5ºC out of tolerance:
http://www.surfacestations.org/Figure1_USHCN_Pie.jpg
Satellite measurements are the GOLD STANDARD. Land-based measurements don’t come close.
Is this graph for real?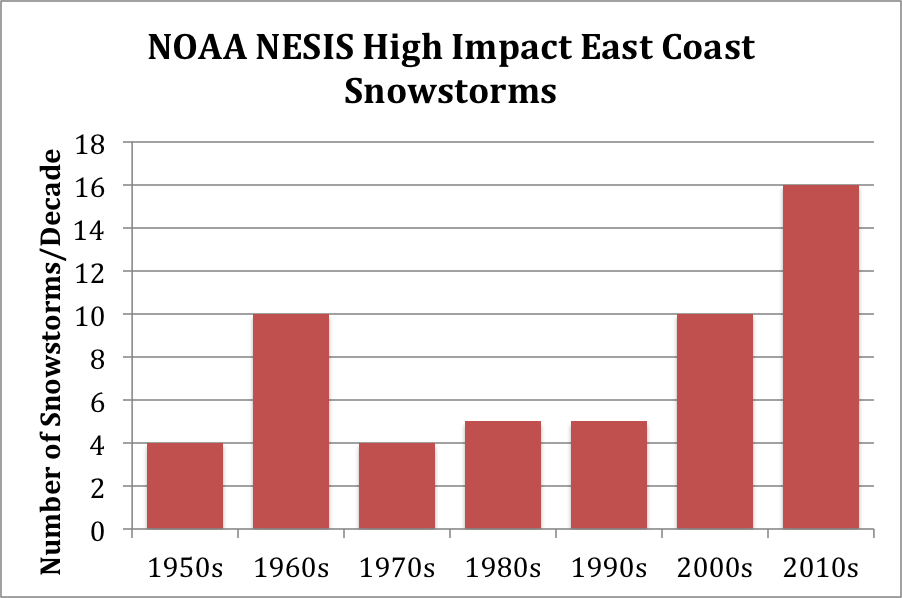 ?w=440
Keep in mind that NOAA is a political organization. And the current administration considers global warming to be the biggest threat to the country. And anyone who works for the government, who disagrees with this, and speaks out on their contrary view…is not likely to have a job for long.
Also, note that the phrase “high impact” does not appear to be a very scientific term.
People are much wimpier now, and get upset if their tootsies get chilly. But panic at the thought of being hot.
Apparently.
Menicholas,
It’s a government agency which is ideally supposed to be non-partisan. Just like the Supreme Court. Obviously there is always going to be some disconnect between ideals and reality.
And if Trump wins — which is altogether within the realm of possible outcomes — (C)AGW will surely be near the top of his list of things to deprioritize.
Similar allegations were made in the opposing direction during the GWB administration. Reality on such points is murky, something I think of as being a sort of design feature of politics no matter who is running the show. I obviously have a tendency to be less dubious of stories, narratives, rumors — what have you — which align best with my own partisan biases.
It flat out isn’t scientific in the sense that “scientific” in this context means to me precicely defined and observationally quantifiable within stated bounds of uncertainty. Such definitions do exist, but they’re not often reported in mass media — which is a problem.
No matter who is running the show or which direction media moguls and PR flacks are attempting to steer public attitudes and opinions, the physical reality of the planet is what it is. I hold myself personally responsible for attempting to discern that ground truth the best way I know how, which is to learn it from the ground up by way of general first principles, and work my way toward domain-specific findings in peer-reviewed primary literature.
My only other option is to believe whatever I want, which is not an acceptable practice in my personal case. My prior experiences strongly suggest that what I want to be real and what is real are often very different, and in a few notable cases that has had dire consequences for me and other people.
I b!tch about both, and am not panicked about either. I don’t think of myself as an outlier in that respect, but then again most people in my circles are more like-minded than not. And again, I tend to respect opinions more from people with like-minded opinions and behaviors than not. Neither of those tendencies is accidental; even when seeking sameness is not consciously deliberate, my subconscious biases are still hard at work.
I think this post should be redacted until the factual errors are corrected: e.g. connecting this storm to Alberta Clippers, apparent confusion of a 2015 and the 2016 storm, incorrect snow amounts.
An Alberta clipper (also known as a Canadian Clipper) is a fast moving low pressure area which generally affects the central provinces of Canada and parts of the Upper Midwest and Great Lakes regions of the United States, precipitating a sudden temperature drop and sharp winds.
This storm came out of the south and reformed off of the coast and had little or no effect on the area identified in the definition. That southern path is common in my experience for heavy snows that have hit the mid Atlantic. Alberta Clippers tend to bring cold but dump their snow in the Appalachians before they get to the DC area.
I like watching Bernie Rayno videos on Accuweather when a storm is coming. He doesn’t hype the storms or use stupid names for them.
Lack of “agreement”:
[Done. . mod]
Climate change hype was injected into this storm situation. If you can scare people enough they will be willing to do anything or pay anything to be saved.
The U.S has some of the most violent weather in the world. There are plenty of weather related events in the past 100 years to prove this.
Nothing wrong with warning the public and if it doesn’t happen or is not as bad then just be grateful.
I wonder where this quote came from:
“While Philadelphia, New York and New Jersey had braced for 30 to 60 centimetres of snow, they got far less than that. New York City received about 20 centimetres, Philadelphia a mere 2.5 centimetres or so. New Jersey got up to 20 centimeters.”
I live just outside of Philadelphia and we got a little over 20 inches of snow. That would add up to a mere 50 cm from my back of the envelope calculation. C’mon. Let’s get the facts right.
Tim quoted an article from over a year ago. It’s bizarre.
You aren’t paying attention. The URL (for the article from last year) is listed twice above.
So Ball takes a Slate article from this year’s storm. (One that dropped 33 inches of snow on one of my siblings’ house in NE New Jersey, and 27 inches on another in Brooklyn, and over 40 inches )
Then, under his aptly titled section “The Basis for the Hype” he links to a CBC.CA article from January 2015 – talking about a different storm where the weather forecasting wasn’t accurate like this one was.
Then he jumps back in time (and out of context) to a 2008 New Scientist story that talks about regional -climate- predictions, not -weather- predictions.
Then he mixes up Nor’easter and Alberta Clipper – two entirely different weather phenomena (they both have Wikipedia articles, and Nor’easters are not the ones that start near the Rockies).
All to claim a big storm wasn’t a big storm? Not sure what he’s trying to say here.
“Winter Storm Jonas: Fourth Strongest Nor’easter since 1950”
http://www.wunderground.com/blog/JeffMasters/comment.html?entrynum=3235
to complete one sentence: “over 40 inches of snow in West Virginia.” http://wvmetronews.com/2016/01/25/berkeley-county-community-heads-list-of-snowfall-totals/
This isn’t the first WUWT post to have a big mistake, it won’t be the last. WUWT policy has been to leave the post up, possibly with a disclaimer, instead of making it disappear like some lesser sites do. One my posts leaped to a bogus conclusion because I hadn’t consider there might be a time of observation issue. One frequent poster posted a few major errors but refused to acknowledge he might be wrong (he has his own blog now).
I’m a bit disappointed Dr. Ball hasn’t been by to comment, I’ll warn Anthony this post needs attention.
This post already has attention what more do you want?
The NWS has a duty to report that major storm conditions are developing. It’s impossible to predict exactly what will happen under these circumstances.
The wrong comes in blaming the cause on climate change.
..Accuweather…” Weekly wrap-up: Blizzard of 2016 ranks 4th among worst winter storms of past 100 years TO HIT THE NORTHEAST !! “
While ever their incomes and prestige depend on their false beliefs, they will hold true to those beliefs. Even if they know the truth in private, in public their grants depend on them.
Last weekend’s historic blizzard has been revealed as the fourth most largest snowstorm ever to hit the Northeast, according to the National Oceanic and Atmospheric Administration.
The National Oceanic and Atmospheric Administration seems to employ people who are as good at weather forecasting as they are at speaking or writing English as shown by the words most largest.
That was from a site called ‘Breaking 911’ not NOAA.
Perhaps missing a hyphen: …fourth-most largest storm…?
Just a charitable guess.
‘This storm ranks up there with the great blizzards of the past 100 years in terms of amount of snowfall, size of impacted areas and population affected’
You would think alarmists would be relieved.
It appears that the NOAA “scientists” quoted above, failed their English exams in addition to their science exams.
“as the fourth most largest (sic) snowstorm”.
Proving their grasp of grammer equals their grasp of meteorology – whilst we are being pedantic about weights and measures!
Here in not so bonny Scotland, we have the same doom and gloom numpties giving us weather forecasts.
Mind you I have not had a round of golf for over 3 weeks. Now that is serious January weather.
It’s articles like these that totally undermine the skeptic perspective. It is clear that Jonas was a major, historic storm. Here in NYC we received a solid 24″ as did many other areas along the coast. Shoreline flooding was widespread and winds were in excess of 35mph for several hours, classifying this as blizzard, at least using the watered-down version common today. So really, What’s Up With That?
This is for Marcus: Expect more severe weather as is the normal case for the beginning of a mini-ice age as the arctic fronts start working their way further south, just like in polar vortexes.Trump says a threatened blizzard on caucus day could threaten his victory. Just think, global cooling is now helping the lefty causes
Russell, I do not disagree with your statement . As a Canadian, I find Global Cooling extremely frightening !
Marcus: Thanks for the response I live about 15k on the west side of Montreal. This is the first winter I spent North. For the last number of years spent on Singer Island, Fl.,miss it but the good old looney keep me home. Oh well.
Is this one of Uncle Al Gore’s prediction.
People in Kuwait still in shock over the first time ever snow.
http://www.nbcnews.com/news/weather/blizzard-warnings-blanket-plains-midwest-forecasters-predict-18-inches-snow-n508416. Did you notice it stays south of Montreal! Ice Age Returns.
I just had to show these photos : a little levity is always good. https://www.google.ca/search?q=kuwait+snow&biw=1024&bih=498&tbm=isch&tbo=u&source=univ&sa=X&sqi=2&ved=0ahUKEwis07buydbKAhVIFj4KHXP_A1AQsAQIOg&dpr=1.25
Ha Ha.. I love the frozen dinosaur pic !
It is ranked number 4 or number 5 depending on what objective scale you are talking about. THIS STORM WAS NOT OVERHYPED. IT BROKE ALL TIME RECORDS IN NYC, BWI, IAD AND MANY OTHER PLACES. Record high tides hit the delmarva to south Jersey, beating Sandy and March 1962 south of ACY. roads still werent cleaned 5 days later in spite of a thaw. It did not beat 1993, the superstorm for instance, but the heaviest of snow was not in the DC to PHL corridor ( a foot fell with that, here it was 1-2 feet DC and PHL and over 2 feet bwi and NYC. ACCUMULATIONS OF 2-3 FEET SMASHED THE AREAS FROM NORTHERN VA INTO PA AND NORTHERN NJ. The storm was UNDERDONE in NYC 2 days before, not overdone. While Sandy was no the strongest storm ever to hit the east, this is the equal of trying to pooh pooh Sandy in snowstorm terms. While it should not be climate change missive, pulling out a quote from last years storm that missed NYC but shut down the major hubs of southern New England. and btw Gary didnt need to apologize for that either as it wasnt like no one got hit That storm became part of the warmist snow is because of global warming propaganda because of the severity in southern New England
So if the 4th greatest hurricane hits the east coast, are you going to say it was overhyped Storms like this are worthy of their advanced billing
This is as wild as it comes between the snow, the wind and the major beach erosion and tidal flooding. You beat March of 62 with that, then set all time single storm records at dozens of stations, it is not a case of hype
March ’62 didn’t have snow along the shore. (Snow was further inland.) But the Delaware and Maryland beaches were obliterated by the three day nor’easter. Rehobeth experienced 40 foot waves. The record all time high tide in Lewis is still the ’62 storm.
My grandparent’s house on Long Beach Island NJ was destroyed in the March ’62 storm and was just a street or two from one of the three breeches across the island. I didn’t pay much attention the beach erosion in this storm, so I don’t know where the major damage was.
And Gary was apologizing for a blown forecast last year.
I think Joe Bastardi was making the point I made upthread Ric…that the failed prediction of the storm last year was of location…the storm last year missed New York City proper but did impact areas to the north and east, IIRC.
Not the same as predicting a storm and no storm materialized, just not as far south as had been warned.
And one more thing, unlike the false idea about the warm eddy last year off New England having something to do with the snow, warm water off the east coast in a widespread fashion did help out with this. The eddy idea was wrong because if anything convective feedback from that well to the east may have competed with that storm. That is a known phenomena to meteorologist that study event like this But wide spread warm water like we have now in such a large area formed the basis for why we had so much snow this winter in the east in spite of it not being that cold a winter.. that a couple of blockbuster storms, beach bashers as I said in August, would occur. But warm water certainly helped this because it was there in the direct path of the storm in a widespread fashion
I think Dr. [Tim] Ball dashed off this post in too much of a hurry. I can see what he was trying to say, I think, and am planning to sit down and see if I can write what-I-imagine-he’s-driving-at better than he did. (I’ll make sure not to publish without fact-checking).
Back in the old days the newspapers had people who did nothing but fact-check, to make sure that reporters didn’t write stories that they’d later be embarrassed by, and have to retract. Sadly the modern media seemingly has not the time, money, or even the inclination to fact-check to that degree any more.
Any of us need a fact-checker, when we are writing in the heat of the moment, and all sorts of stuff gets published on the web these days that could use a good fact-checker. It is a form of peer review.
I suppose the fact-checking and peer review is now up to us, here in the “comments” section of WUWT. I’d like to thank you, Joe, for so often being the fact-checker when it comes to weather events. Your brain is like an encyclopedia of weather maps.
What I’d like to do is compare the two storms, nearly exactly a year apart, and also compare the two media circuses. There’s a lot that became apparent. I think I might call it, “A Tale Of Two Storms.” I think I could write about it in a way that would make people chuckle, rather than rage.
I’ll bet the people out on Long Island wondered, last year, when they read in the City papers that the storm was a “bust”. Only 20 miles east of NYC the deep snows started. They are the only folk who really got both year’s storms. This year we didn’t even get a flake, up here in New Hampshire, while last year (because I’m on a hillside facing east) we got nearly three feet of wind-whipped powder. That storm sure wasn’t a “bust” up here.
You can’t judge the whole world from your own back yard.
Blast! I meant Dr. Tim Ball, not Dr. Tom Ball. You see? We all need fact-checkers.
[Fixed – Ric (not really a mod.)]
Caleb,
+100
Michael Crichton (1942-2008) and Tim Ball helped identify the prototype of the pseudo-science myth making process. I thank both of them.
I lay the cause of the pseudo-science myth making process entirely at the feet of a certain school of scientists.
I never met Michael Crichton. I look forward someday to meet Tim Ball.
John
Wow. Have not seen such crap for ages. Criticism of models that turned out to be right because of a storm that wasn’t as bad as predicted a year earlier?? Mixing up inches and cm?? Maybe the author should lay off the red when ranting??
To say nothing of commenters who don’t read the comments where Dr. Ball’s error is fully described….
I expect there will be update today to the main post.
Read first, post second, please.
In MY LIFETIME, the 1993 Superstorm is the gold standard by which I judge winter storms. This one wasn’t remotely close. Not in coverage, not in strength, not in anything.
I was forecast to get 18-24″. Ended up with 12″, due to several hours of sleet in the middle, and a dry slot much bigger than the models predicted. This didn’t even rank a top 10 in my area. It was slightly larger than a normal winter storm for us.
I don’t quite understand two interlinked but apparently illogical facts:
1. The American people as a nation are extremely skeptical about global warming.
2. The American people continue to tolerate politicians and lobbyists who promote policies which result from something the American people don’t believe in.
Every survey out there says that the American people do not prioritise action on global warming, hence they really shouldn’t be voting for people who do. They shouldn’t be satisfying themselves with a two party oligopoly where the lobbyists control the spokespeople on both sides.
I don’t understand why they tolerate media moguls plugging global warming when they don’t believe in it. I don’t understand why they read newspapers which plug it, when they don’t believe in it.
Most of all, I’m amazed so many of them come to read WUWT so often yet still go out and tolerate the whole of the USA being controlled in exactly the opposite way!
This issue is no longer an issue of science, although of course there is plenty of science about the climate still poorly understood.
It is no longer an issue of public priorities.
It seems to be an issue of the American People rediscovering what caused them to found their nation in the first place and to found political organisations which allow them ‘to pursue happiness’, which will usually be equated with living in dry, warm homes both in the summer and in winters (when heating is required); it will be equated with accurate weather forecasts and a media which aims to make the American people happy, not neurotic; it will be equated with educating children truthfully about the weather, historical climate and the science which underpins it; and it will be equated with applying the principles of economics to the real problem of finding cheap sustainable sources of power for the USA at whatever time the extraction and utilisation of coal, oil and gas becomes economically unrealistic.
It’s exactly the same in my country, the UK. The thing is, here though: no-one set out in any Declaration/Bill of Rights that the destiny of the British people was ‘the inalienable right to pursue happiness’. We were simply told to bear allegiance to the Crown, trusting to God that the nefarious process of genetic reproduction produced monarchs through the ages who were philosopher kings rather than sex-obsessed nitwits. Your ancestors fought a War of Independence to reject that premise…….
Even if we are subsumed into the European Union, we don’t have the right to elect politicians to enact laws for us at a European level. They merely rubber stamp what faceless officials in Brussels tell them to rubber stamp.
So really it is the American people who still, until someone abolishes your beloved Constitution, have in your hands the inalienable right to elect Presidents, Congress(wo)men and Senators who allow you pursue happiness through the sustainable production of cheap, environmentally acceptable forms of energy.
rtj1211 commented:
“1. The American people as a nation are extremely skeptical about global warming.
2. The American people continue to tolerate politicians and lobbyists who promote policies which result from something the American people don’t believe in.”
Only 40% of Americans vote so it’s guaranteed that the majority doesn’t get represented. Why? We’re living the good life and complacent. So far AGW has affected the people minimally and our newfound PC lifestyle thinks saving the world by killing off people is OK….as long as it isn’t them. They are slowly figuring out that it’s not temperature but fossil fuel and industry that’s the target. RIght now AGW is on very few voters’ radar but continued energy price escalation, industrial decay, and resulting unemployment will put it there. The biggest problem is the Left/Socialists have gained control of the media and are using it to their advantage. 30 years ago “Socialism” was an ideology associated with Europe.
Absolutely bloody SPOT ON !
The “Blizzard of the Ages” turned out to be no big deal here. About 2 ft of snow (considerably more nearby), but no power outage here & actually very few recorded. I could have gotten out on the road on Monday (snow ending Sunday afternoon) if I’d tackled the 5 ft deep blockage in front of my vehicle then. Neighbor even helpfully cleared out a space beside my car w/his farm tractor on Monday, along w/my other neighbors.
So seems, w/helpful neighbors and experience w/recent heavy snow events (36″ here in a single storm in 2010), recovery is surprisingly quick w/little inconvenience. Mild weather after the snow helps too.
I always though Gore looked more like a used car salesman than a diplomat.
From the OP:
Other comments here have pointed to a number of flaws in Dr. Ball’s article, which I think is to be commended. That said, I think that Dr. Ball does make a good point above, and I agree with him that the headline is dead wrong, albeit for a different major reason — namely that one single weather event does not “prove” or “disprove” global warming due to any cause. As well, a major blizzard is not inconsistent with global warming due to any cause.
As the body text of the article explains, heavy storms are actually expected due to increased precipitable water in the atmosphere, which is a stronger statement than “not inconsistent with” to be sure. The veracity of those statements is not my point here (but an important conversation nonetheless).
My main critique of the news article stands, however. My personal practice is to scan headlines to get an overall sense of what goes on in the world, then drill down on what interests me. Sometimes the first few paragraphs are enough, especially since it is standard journalistic practice for the lede paragraph and first few subsequent blocks of text to contain the most salient points, with supporting details added further down.
If the headline does not accurately reflect the body text of the article, then I am potentially getting misleading information in my news scan. If I didn’t already know better and hadn’t read the entire piece, this headline would have misled me, and that’s a problem. No two ways about it.
Microwave Radio Frequencies dominate the Earth with millions of subscribers.
Since the late 1950’s, Microwave Radio Frequencies have become the dominant form of communication for TV’s, Cell Phones, Weather Stations, and a host of others uses. Each of these companies having MILLIONS OF SUBSCRIBERS! Satellite antennas and Earth antennas transmit UHF and higher microwave frequencies all over the planet. Just like aVacuum tube in old electronic technology, microwaves are insulated by the vacuum of space. Because the vacuum of space acts as an insulator, microwave radio frequencies are scattered through our atmosphere at an accelerated rate. The Earth is a rotatingelectromagnetic field containing a dielectric material called water. Sending oscillating microwave radio frequencies through an electromagnetic field into a dielectric material, such as water, creates radio frequency heating (also called RF heating) at the molecular level of water. Because Earth’s electromagnetic field points directly towards the North Pole and the Earth’s atmosphere is circulating the warmed air through ordinary convection towards the North pole, the radio frequency heating is guided directly towards the Polar Ice Caps. This is melting the Polar Ice caps. Since our atmosphere is made of water and the Earth is covered with water and ice, microwave radio frequencies pass through our atmosphere, oceans, and ice caps. Because the wattage levels are minimal, warming is caused by a constant flow of waves that are never turned off. It is similar to cooking food in the microwave oven at a lower wattage setting. It takes longer, but still achieves it’s goal. Global Warming history completely coincides with the history of artificial satellites and the use of microwave radio frequencies. The industrial Revolution happened at the beginning of the 1800’s. Yet, in the late 1950’s is when Global Warming became an issue. The timeline of Global Warming does not coincide with the Industrial Revolution or Automobiles at all.
http://globalmicrowave.org/
That site says:
I fear the only appropriate response is to wave back.
Ric,
Regarding microwave radio frequencies I am NOT knowledgeable but you and others might know …
‘jmorpuss’ begins with radio frequencies associated with communications but to interact with water (and cook food) the radiation needs to be of a higher frequency than ordinary radio waves. Or so I read. Thus, it seems that most of the concern expressed by ‘jmorpuss’ is meaningless.
So, yes, let’s wave back.
Indeed Brandon:
“Meteorologically, because the IPCC claim that greater warming will occur in the polar air than the tropical air. If true, this decreases the temperature difference across the Polar Front. The intensity of storms is determined by that temperature difference, known as the Zonal Index.”
Mr Tisdale:
Nope:
It is winter and the deltaT at the PJS level is at a maximum with unmeasureable difference to pre-AGW jet strength.
The Arctic amplification (greater warmth) is vertically mixed overwhelmingly only in the summer when the air becomes unstable and the Arctic’s decreasing albdeo (more heat in at the bottom vis open waters) raises tropospheric heights.
Also a “storm” or mid-latitude depression has a number of factors governing its strength. The PJS strength is but one. More crucial is the position of the jet aloft of the surface Low, it’s curvature (left exit being most developmental ) and the strength of WAA entrained into the “storm”. The release of LH from the condensation of the snow from preciptable water also adds considerable energy.
Apologies to Mr Tisdale – Dr Tim Ball is, of course, the author of this article.
Um. New York here. Two misapprehensions in this article:
1. The predictions were somehow wrong or false. Nope, NYC was exactly as claimed—meteorologists were abundantly clear from the get-go that we could get anywhere from 2 inches to 20-something, depending on where the northern edge of the storm hit.
As it more and more clearly began to move north of the city, the snowfall predictions rose—and in fact, we closed out at 26-something (depending on where you read). EXACTLY what was predicted. So no, “snowmageddon” was in no way, shape, or form a failed prediction–on the contrary, spot on.
2. Cleanup was slow “because the government was in charge”. Again, false. NYC was up and running by Monday morning, thanks to the timely, effective actions of the government. It’s down south in the Blue states, where government is “the enemy”, that you had issues with snow removal.
Don’t get me wrong, I’m no fan of the current NYC administration, and am not a slavish fan of government. But this time they got it right–even to the point of having snowmobiles trek down from upstate to help out. The only complaint was some locations in Queens, where the streets are simply to narrow to accommodate snowmobiles (but I’m sure the citizens don’t want to give up 6+ feet of sidewalk!).
Bottom line: This piece was a double fail. I’ll be a tad more skeptical of anything by Dr. Ball going forward, because this is something I happen to be familiar with, and he got it 180 degrees wrong.
in the msm weather forcasts often reside next to horoscopes:
lots of readers equal anonym weatherman next to shamanism.
The absurd outcome:
CAGW alarmism is ‘scientific’ because written by prof. redactions.
Scientific drawn weather forecast ranks near crossword enigma.
xcuse my dinglish – Hans
‘CAGW alarmism is ‘scientific’ because written by prof. redactions.’
When it’s just yellow press.
And that same professional redactions aime for the Pullitzer Prise – founded by the inventor of yellow press, Pullitzer:
a world wide Stachonow System.