From the “fresh melt water will disrupt the planet” department, except that this ongoing alarm has already been debunked by NASA, see: NASA refutes Mann and Rahmstorf – Finds Atlantic ‘Conveyor Belt’ Not Slowing
![436189main_atlantic20100325a-full[1]](https://wattsupwiththat.files.wordpress.com/2015/03/436189main_atlantic20100325a-full1.jpg?resize=720%2C360)
Melting Greenland ice sheet may affect global ocean circulation, future climate
University of South Florida and international scientists find influx of freshwater could disrupt the Atlantic Meridional Overturning Circulation, an important component of global ocean circulation
TAMPA, Fla. (Jan. 22, 2016) – Scientists from the University of South Florida, along with colleagues in Canada and the Netherlands, have determined that the influx of fresh water from the Greenland ice sheet is “freshening” the North Atlantic Ocean and could disrupt the Atlantic Meridional Overturning Circulation (AMOC), an important component of global ocean circulation that could have a global effect. Researchers say it could impact the future climate in places such as portions of Europe and North America.
Their study on the influence of freshwater influx on Labrador Sea convection and Atlantic circulation is published in a new issue of the journal Nature Communications.
“We derived a new estimate of recent freshwater flux from Greenland using updated GRACE satellite data,” said USF professor Tim Dixon. “The data suggest that the influx of freshwater from Greenland is accelerating, and has changed the Labrador Sea in ways that could lead to a weakening of the AMOC.”
Freshwater flux from Greenland is composed of melt runoff from ice and tundra runoff as well as ice discharge (“calving” of icebergs). The amount of freshwater flux from Greenland was relatively stable from the late 1970’s to the mid 1990’s, and then began to increase. Increased freshwater flux could weaken the AMOC, resulting in a number of consequences, both local and global, said the researchers.
“Focused freshwater flux into the Labrador Sea has the potential to increase the buoyancy of surface waters and reduce formation of dense, deep water that helps drive the overturning circulation,” said co-author Don Chambers , USF College of Marine Science associate professor.
How much of the enhanced freshwater flux actually winds up in the Labrador Sea?
Because of the clockwise nature of ocean circulation around Greenland, most of the freshwater increase, up to 70 percent, is being driven toward the Labrador Sea, magnifying its impact and increasing the possibility of significant effects on the AMOC, said Qian Yang, the paper’s first author and a PhD student at USF whose dissertation, in part, includes this research.
According to the researchers, not only are changes in the AMOC difficult to measure, it’s also difficult to separate natural climatic variation from climate changes induced by human activity.
The potential consequences of a weakened AMOC include changes in climate.
“The AMOC transports a large amount of heat into the North Atlantic where it is given up to the atmosphere and helps regulate the climate in Europe and North America. The major effect of a slowing AMOC is expected to be cooler winters and summers around the North Atlantic, and small regional increases in sea level on the North American coast,” explained Chambers.
According to Dixon, the global impacts are less certain, but potentially more consequential.
“The AMOC and Gulf Stream are part of a complex global ocean circulation system that is still not completely understood,” said Dixon. “If human activities are starting to impact this system, it is a worrying sign that the scale of human impacts on the climate system may be reaching a critical point.”
Continued long-term observation is required to understand the impact of the freshwater influx.
“This shows the need to continue to look at different components of the climate system, including the ice sheets and oceans, in an integrated sense,” concluded Paul Myers, study co-author and Professor of Oceanography at the University of Alberta.
###
Damn–another dreadful scenario to not worry about.
Yawner from the junk science crowd.
” According to Dixon, the global impacts are less certain, but potentially more consequential.”
Indeed not to worry about opinions because that is a healthy and sound strategy, called common sense.
Awww man, get your wallets out because there is yet another required study to gather more data and try to integrate the Gulf Stream into the new and improved model of all the ocean currents.
I swear that if I wrote up a grant proposal that mentioned “climate change” and was a study of the sexual preferences of cockroaches that I would get $100,000 or so. I might even get another grant if the first study had a few remaining questions concerning the average temperatures if we used satellite or surface weather data.
Gums sends…
Given that all of these circulations survived the MWP, the RWP, and the Minoan WP, all of which were warmer than today and global from all evidence, I call BS. The escathological cargo cult of the CAGW is a history denier.
“The escathological cargo cult of the CAGW is a history denier.”
+1 for sentence construction and vocabulary, and definitely a quotable quote, but in the spirit of the accuracy this web site proffers … I believe the word is eschatological (from the Greek eschat, eschato, eschaton – uncountable last)
So that would be … The Eschatological Cargo Cult of the Church of Anthropomorphic Global Warming is a history denier? (ECCCAGW)
Hey ShrNfr! While I may personally agree with your assessment, any good CAGW enthusiast can give at least five reasons why the conveyor belt will stall:
1) History is bunk. The physical properties of water have changed since the MWP (which never happened anyway!)
2) Peer review says that the conveyor will stall.
3) Look! A squirrel!
4) It is simple, high school physics!
5) Kumbaya
CAGW actually has even more reasons for the upcoming catastrophe, but those five are the most important.
Well, that convinces me! The whole theory is a house on sand.
Worse. It’s a house of cards on sand, and the cards of made of straw. How’s that for a mixed metaphor. ^¿^
Measure something in the real world, then compare it to previous measurements…. and get back to me. So tired of guestimate-based nonsense. You would never know that money was a useful and scarce commodity by the amount that is flushed down the collective academic toilettes
They confirmed in news today that there is a 9th planet in our solar system. 10 times Earths mass, 200 AU (200 times Earth distance) from Sun, 20,000 to 30,000 year, highly elliptical orbit.
The Aliens living on it suck heat and CO2 from Earth oceans to provide warmth and to breathe…
/Sarc…first para true as reported
Nah, it is a coagulation of all the lost e-mails that have got lost in the cosmos and never arrived.
“The scientists who made headlines this week by announcing evidence for a new planet in our solar system are basing the claim entirely on a mathematical model. Nobody’s seen the thing, but the math says it’s there….”
http://fivethirtyeight.com/features/how-math-and-not-a-telescope-may-have-found-a-new-planet/
It did occur to me that this planet if it exists then it may have a gravitational affect on the Earth every 15-30 k years and would this affect long term climate cycles? I also find it amusing how they have a big press release about a planet that ‘may’ exist. I would have thought more appropriate when they actually found it.
Details of planetary discovery: http://xkcd.com/1633/
Well, it could be coincidence. Hopefully a more concerted effort could nail it down, given the mathematical evidence narrows down the location a bit.
That reminds me of those old planet Gor novels, which were about a duplicate Earth-like planet that was 180° around Earth’s orbit so it could never been seen. Maybe we should call the 9th planet Gore……
I thought I understood Pluto was discovered by investigating a gravitational aberration? So there is a good use for models (then followed by actual observations) I’m a solar system luddite so any new planet would have to be number 10 or at least 9.5
pbweather,
“It did occur to me that this planet if it exists then it may have a gravitational affect on the Earth every 15-30 k years and would this affect long term climate cycles?”
If the nearest point in the orbit is 40 times as far away from the Sun as Neptune, you might have more effect on the long term climate cycles ; )
But they still haven’t found it yet, just like they haven’t found CAGW.
Another whack a mole paper. This gets tiresome. How did this get thru pal review when already debunked.
…. But it’s a NEW model…..
So if it warms it’s our fault, and if it cools, it’s our fault too. Got it.
Include, “Either way, ‘the some’ need to control what the rest of us are doing.” and you’ve nailed it. 😎
“Much that passes as idealism is disguised hatred or disguised love of power.”
– Bertrand Russell
@piper paul…wasn’t Russell something of a misogamist himself? I see to recall a quote from Bertrand to the effect that we hadn’t yet come up with a method to stop the proliferation of mankind disease and war not withstanding and implying that that was a bad thing.
. . . .“This shows the need to continue to look at different components of the climate system, including the ice sheets and oceans, in an integrated sense,”
In other words…” Give us more MONEY !! “
because, although ‘the science is settled’ we need to make it more settled
That makes me…very unsettled !
@ John in Oz, 4.49 Jan 22 Well there are always the three % that need to be “convinced”.
How does the conveyor turn cold water to hot in the Pacific off the west coast of Canada?
A hot model said so?
(She’s a climate scientist.)
+1 gunga!
The answer is under the thimble in the centre.
I suspect the artist who drew the picture might not have majored in geography. Note the absence of the Gulf Stream and Kuroshio currents. For a more conventional picture of warm surface currents, see http://www.dummies.com/how-to/content/going-with-the-flow-in-geography-ocean-currents.html
[Simplified surface currents only, but a clear graphic of El Nino, La Nina areas. .mod]
i’m still confused as to why, with the melting ice sheet, the WWII planes were recovered at a depth of 270 feet. I realize that its a big island and there will be different changes in different areas, but if there is an an average add of 6 feet per year at the surface that means that there is an average melt underneath of greater than 6 feet per year.
Again, I realize that it is just one location on a big island, but 270 feet ice added over 46 years seems like crapload for an island that is supposed to losing ice.
The magic molecule, CO2, is very clever.
Funny how sea level trend has remained constant.
So if more water is being added to the sea from Greenland, it must be exactly balanced by less being added somewhere else.
There sure are a lot of convenient coincidences going on.
I am reminded of the little green man who lives under my stairs. What shade of green is he? An invisible shade… Every time I don’t see him adds to the evidence that he exists.
A combination of the snow under them slowly consolidating into ice and lots more snow falling on top of them burying them.
It snows a lot in central Greenland and I understand the height above msl of the top of the snow is increasing at the moment.
You never know, maybe it is losing more ice because more ice is being made at present.
‘i’m still confused as to why,’
Well, I’m gonna explain once.
Greenland interior is not net melting or sublimating. It gains mass, surface mass, and the ice level fails to grow up only because the ice also flows slowly towards the sea.
The ice sheet SMB growth and outflow of the ice are very near to balance. The ice sheet grows usually about 200 km3 / year due to precipitation, and it looses slightly more due to calving and melt around the central glacier.
With the recent ice loss, it would take millenniums to melt. The only way you can make a scare is to either miscalculate the net ice loss, or speculate on massive new developments in future. They do both.
Hugs
No. Not true – But you have to know the unique Greenland geology and geography to see why. This approximation assumes the central greenland ice cap is a single high dome, that dome then pushing ice away from the dome into the sea by the “usual” Alpine glacier movement. (Ice gains mass up high on the mountain top, weight of ice pushes ice downhill into valley and stream bed, ice flows downhill into warmer climate or sea from mountain, sea and warmer climate melts icy glacier at lower elevation.)
In Greenland, ONLY the outer 25-50 kilometers of ice-covered slopes AROUND the central ice dome can flow like that. ONLY that outer 50 km ring can spawn Alpine-like glcaiers whose ice flows towards the coastal waters to melt.
But in Greenland, the coastal mountains ring the entire island. The interior ice is trapped BETWEEN two massive long mountain ranges that ring the island (east, south, west, and north – there are no “paths” for the central ice to flow out towards the sea. So, as ice and snow fall in the interior, the ice builds up vertically ever higher and higher. The edges of this ice cap ARE pushed out by the mass of ice further inland, but it cannot flow sideways but instead is pushed uphill towards the passes and peaks of two “continental divides” (“edge rings” actually) that surround the central dome.
Only that minute amount of ice at these far edges high enough to get pushed far enough sideways to cross the mountain passes between the peaks, then flow sideways far enough to start new glaciers on the outer banks of the mountains can flow downhill. The rest is trapped. Now, you can only see the ring of mountains surrounding the central valley of Greenland. And the bottom of that central valley has been pushed down below sea level by the weight of the ice above.
This is merely an insurance policy for potential cooling that could happen in the north Atlantic. Since the AMO is entering into its major cooling phase, I find this a rather clever “study.” It will give another excuse for an extension of the Pause, which does not allegedly exist, but making up excuses for it covers the posterior ends of certain quarters. Regardless, it is all our fault and it is worse than “we” thought. Gee, it could stop the alleged melting of the Greenland ice cap too. Oh this is one tangled web being woven.
Regime change is positive in the tropical Pacific, but negative in the North Atlantic. The Gulf Stream nor melting of Greenland has nothing to do with it, Russia and Barrens Sea Ice does it.
One of the significant pieces of evidence for this comes from a description of the “Great Salinity Anomaly” put together by Robert Dickson (Fisheries Laboratory, Suffolk, England) with other European oceanographers. The Great Salinity Anomaly (GSA) can be characterized as a large, near-surface pool of fresher water that appeared off the east coast of Greenland in the late 1960s (see figure at upper right). It was carried around Greenland and into the Labrador Sea by the prevailing ocean currents, in the counterclockwise circulation known as the subpolar gyre. It hovered off Newfoundland in 1971-72 and was slowly carried back toward Europe in the North Atlantic Current, which is an extension of the Gulf Stream. It then completed its cycle and was back off the east coast of Greenland by the early 1980s, though reduced in size and intensity by mixing with surrounding waters. The origin of the Great Salinity Anomaly is thought to lie in an unusually large discharge of ice from the Arctic Ocean in 1967. Its climatic importance arises from the impact it had on ocean-atmosphere interaction in the areas it traversed.
http://www.whoi.edu/oceanus/v2/viewArticle.do?id=2344
And the Russians are measuring it currently. From 2012
Drastic cooling all over the Northern Hemisphere. The thing is that according to their calculations, “a great salinity anomaly” is coming, which will cause the fall of average temperature and bring about frosty winters in the coming years. The oceanologist and doctor of physical and mathematical sciences Nikolai Diansky has for years compared data about change of salinity of waters of the Arctic regions with weather changes on the planet. He took reference data from his colleagues in every corner of the globe. The scientist’s diagram prove that the global warming leads to massive melting of glaciers and increase in spillover of the Siberian rivers. As a result the Arctic Ocean has collected a lot of fresh water, which is will soon start pouring out through the Canadian and Greenland straits to the Northern Atlantic.This is where Gulf Stream, the main “bed warmer” of Europe flows. Its warm salty water is going to be covered with cold fresh water. Thus, the heat will not be let out and thus the climate in Europe and entire Northern hemisphere is going to cool down. – See more at: http://russia-ic.com/news/show/13458#.Vo15ZkOBqPw
“Since the AMO is entering into its major cooling phase..”
It’ll be in its cold phase next from the mid 2030’s, and coldest in the mid 2040’s. Negative NAO will increase again through this solar minimum, and warm the AMO again. Note that there was a warm AMO through the late 1800’s Gleissberg solar minimum.
A cold AMO varies in phase with solar cycles, and warm AMO varies anti-phase with solar cycles, so a temporary mild AMO cooling around this recent sunspot maximum follows that pattern:
http://www.woodfortrees.org/plot/esrl-amo/from:1880/mean:13/plot/sidc-ssn/from:1880/normalise
Should I be [embarrassed] to say I studied climatology and physical geography at USF?
This guy was not there at the time…unless he was that guy sitting in the back row not paying attention.
Hey, a word got erased somehow.
It was…Should I be embarrassed to say…
Tim Dixon is a geologist, if he’s the same person I’m thinking of. A bit out of his area …
“Scientists from the University of South Florida…”
I live in Florida and Floridians of all people should know that any fresh water entering the ocean from ice sheets up north is more than offset by the zillions of gallons of salty, acidic water dumped in the ocean daily by beach-going kids, drunks, tourists, and anyone else who decides to ‘go’ in the sea rather than stand in line at the port-o-potty. If ocean acidification were true the Florida Keys would be a bleached-out underwater wasteland by now. So I’m not buy any of this nonsense.
The usual tripe. Suggest a problem, give flimsy evidence, followed by the inevitable plea for grants…”Continued long-term observation is required to understand the impact of the freshwater influx.”
27000 journal articles a week.
Peer review is broken.
The loss of scientific credibility is escalating.
Is that the estimate of additional journal articles based on GRACE gravitational measurement?
Did it take account of the fact that the mantle of real science is actually sinking under the weight? 🙂
This is the real problem, and it applies even beyond science. In every aspect of our lives, from politics to law, to commercial advertising; the information world is dominated by special interest groups. Even today’s journalists aren’t indifferent to the reality of the news and construct and spin to suit their( or their sponsors) point of view. Try watching RTV news for the master’s course on making b.s. believable.
A little common sense would tell you why we need not fear Greenland to melt and raise sea levels. For one, how many Americans even know where it is? Do they know that the vast majority of Greenland is north of the northern most point of Alaska? The glaciers are one to two miles high. Air gets colder by about 3 degrees every thousand feet of elevation. With criteria like that a short summer melt is all that is possible.
It’s a tag team effort with Antarctica to prop up the pub mill.
Phishing for climate $$
Obviously we here will be skeptical about a prediction that is based on a confident assessment of what GRACE data tells us. But there is no consensus conclusion regarding the amount of ice-loss indicated by GRACE.
For example here in the introduction to a 2012 paper in Nature:
“Recent estimates of Antarctica’s present-day rate of ice-mass contribution to changes in sea level range from 31 gigatonnes a year (Gt yr−1) to 246 Gt yr−1, a range that cannot be reconciled within formal errors. Time-varying rates of mass loss contribute to this, but substantial technique-specific systematic errors also exist. In particular, estimates of secular ice-mass change derived from Gravity Recovery and Climate Experiment (GRACE) satellite data are dominated by significant uncertainty in the accuracy of models of mass change due to glacial isostatic adjustment”
From: http://www.nature.com/nature/journal/v491/n7425/abs/nature11621.html
So, the entire enterprise described in this post relies upon the GIA guesswork/modelling. And now we are told that x amount of melting would cause…blah blah blah to happen. Even though we haven’t really settled on a consistent narrowing of the estimates of x.
As usual – the output from one load of computer models is used as the input for the next!!!
Meanwhile, back in the real world…
http://pmm.nasa.gov/education/videos/thermohaline-circulation-great-ocean-conveyor-belt
Would less salty water near surface not slow down the pump. Thus transfer less heat to the northern region?
Another scarestory , this time about the oceans running AMOC
The climate system has run AMOC.
I wish someone would transfer all that unseen Glo.Bull Warming to Ontario, Canada…I’m really getting tired of freezing my ^$%#@$% balls off !!
…And other associated parts !!
Which are private?
Marcus they might be still there. Cold can create a condition known as English Walnut Syndrome, an effect I’ve personally experienced many times while fly fishing when I’ve blundered into water that overtopped my waders. The condition in circumstances such as I’ve described is temporary though I suspect for Canadians its duration may be longer, perhaps seasonal in extent. Several hours in a sauna or Turkish bath would probably confirm the diagnosis of EWS. If not well…..
Freshwater melt, real or fictitious, is the only aspect of AMOC that these m0r0ns allow themselves to talk or even think about. Otherwise they would realise that AMOC is where all climate change comes from – and their AGW scam gravy train is busted. This black comedy will continue a while longer before climate Nuremburg.
Funding for this study will be awarded in fiscal year 2147 pending confirmation of the results. Until then the money will be held in escrow.
And the salinity in the ocean in the area in question has changed by exactly ZERO. The paper doesn’t address this issue one iota.
The AMOC starts under the sea ice throughout the entire Arctic Ocean basin. Somehow climate scientists have convinced themselves that the deep water formation of the AMOC is next to Greenland. There is no way to correct them because they don’t actually care what the facts are, just what gets them published in the climate theology field.
Yes and glacial deposition isn’t all fresh water its fall of sediments! I’d like to have seen them actually sample and compare the mineral and salt content of glacial with river run-off!! There seems to be a deliberate confusion with sea ice here. And of course glacial ice bergs also contain solids that dissolve when they melt!
Bill, I think you are the right person to ask.
If the AMOC were to slow and cool the North Atlantic and its coastal lands would that not also cool Greenland and stop it melting so fast?
Come along, Sir, you are applying logic. That will never do on climastrology.
Bill
Somehow climate scientists have convinced themselves that the deep water formation of the AMOC is next to Greenland. There is no way to correct them because they don’t actually care what the facts are …
+1
It was basic first year oceanography when I was at Uni that NH deep water formation is in the Norwegian Sea, some way west of Greenland.
Sorry east of Greenland not west
The sea surface temperatures in the Norwegian Sea range from +2.0C to +10.0C.
The Arctic Bottom Water is -0.5C to -1.0C and is 3000 metres deeper. it has nothing to do with the Nowegian Sea.
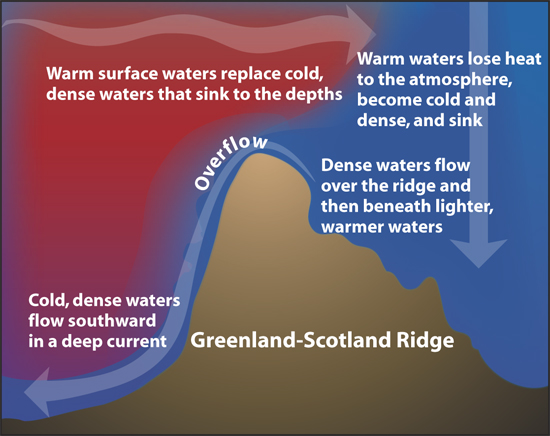
The Arctic Bottom Water overflows the canyons and chokepoints out of the Arctic Ocean basin, particularly the Fram Strait canyon, the Denmark Strait and the Greenland-Scotland Ridge.
http://90-north.com/wp-content/uploads/2013/05/bathymetric_map_Arctic_Ocean.jpg
This map is the best explanation of the AMOC with the dark blues in the Arctic Ocean basin being the sinking part of the AMOC, the Arctic Bottom Water.
http://www.whoi.edu/cms/images/arcticocean_circulation_main_206633.jpeg
This water forms under the sea ice in the Arctic as the water immediately underneath the ice is -1,5C or so (cold and dense) but once its gets an extra flush of salt leaching out of the newly forming sea ice, it now becomes the coldest densest water on the planet and sinks fairly fast actually right to the bottom of the Arctic 4,000 metres down.
This video shows this process in action and it is fascinating.
This water can spend hundreds of years or more at a time in each different basin slowly being pushed out of the Arctic (by the newly forming Arctic Bottom Water coming from above) until it gets to the one of the chokepoints.
http://ars.els-cdn.com/content/image/1-s2.0-S0012821X15001442-gr001.jpg
And then it literally overflows these chokepoints and falls to the bottom of the Atlantic Ocean 5,000 metres deep. The Denmark Strait overflow is actually the biggest waterfall on the planet. It continues flowing out at the very bottom of the Atlantic finding the deepest channels it can find because it is the densest water there is in the northern hemisphere. It continues flowing south until about 20S where it runs into the Antarctic Bottom Water which is slightly more dense and it flows over top of it (to somewhere else)
THIS is the start of the AMOC. The ice on Greenland plays no part whatsoever except that helps keep the Arctic cold through sunlight it reflects.
That’s me told. Thanks Bill!
The cold (somewhat fresher lets say) water coming off of Greenland on its eastern side, actually becomes part of the greater Labrador Current. It is strictly a surface ocean current and has nothing to do with the AMOC. It is still 33.5 psu salinity which is really not much different than the rest of the world’s ocean but it is still far off the salinity of the AMOC sinking water.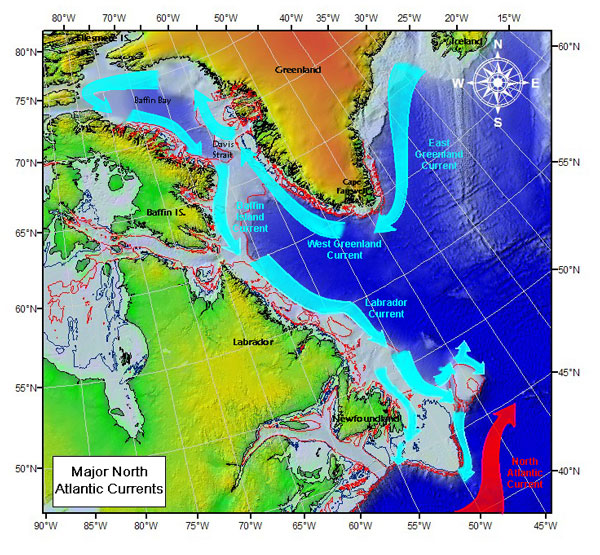
It literally flows all the way around Greenland even going north on its western side and then does a u-turn to flow down the eastern side of Labrador and Newfoundland (usually in the other order but not in this case).
It then hits the Gulf Stream just south of Newfoundland but still on top of the continental shelf here (signifying it is not part of the AMOC – the AMOC is now 5,000 metres deep in the deepest part of the Atlantic nearby).
The Gulf Stream rapidly warms this water back up and it actually becomes part of the Gulf Stream itself (although some still flows down the eastern seaboard for a little while before it also warms up).
This is exactly where the water coming off of the eastern side of Greenland ends up and re-enters the Gulf Stream.
http://disc.sci.gsfc.nasa.gov/education-and-outreach/additional/science-focus/locus/images/NAB_2003_AprJuly_SST_areas.jpg
One can go to the Global Hycom ocean model from the US Navy (ie the biggest world experts on the ocean that there are) and see what this current has been doing for the past 30 days or 365 days.
Open “The Last 30 days (gif)” in the SST section to see the whole area in (real – not climate science) action. (it would probably load too slow to link directly on the page).
It is all a “Surface” current and it literally joins up with the warm Gulf Stream.
http://www7320.nrlssc.navy.mil/GLBhycom1-12/natspg.html
Actually, i should have also noted that takes this journey very rapidly. It probably only takes 90 days to complete the trip from the northern eastern side of Greenland to reach the Gulf Stream. 90 day AMOC?
Bill
Don’t you just love the sound effects of the ice freezing and crackling under water. I loved watching the finger of death track the little starfish. I kept screaming run away, run away… but to no avail. The little dudes just couldn’t figure it out in time and got froze up real hard.
Real time NH ssts from yesterday (today pretty much the same). Unless I’m reading this wrong the Kuroshio and Gulf Stream show as 10 C meandering rivers that are actually COLDER than the 15 C water to the south. These “warm” currents fail reality check along with the rest of the THC.
gymnosperm
I am an appreciator of your valuable contributions on topics such as palaeoclimate and palaeontology, so I’m a little disappointed that you disbelieve in the THC. Sure there are chaotic eddies – how would there not be.
But there are still general movements. This was tested and proved in the most unambiguous way possible. The Hbomb tests of the 1950s-60s introduced a pulse of tritium into the worlds sea surface. This has been followed as a tracer to show that deep water formation really does happen in the Norwegian sea, and the southward bottom flow, as oceanographers have been saying for the best part of a century already. There is a reason why they are saying this. It is because that is what happens. Radiotracer is the normal way industrial fluid flow is tracked. It was done with the THC, and that they found the THC behaves like the THC.
Many thanks for your highly informative comments below.
Fascinating.
Yes, I agree. Thank you for that Bill Illis. Really appreciate it.
The AMOC contains a nonlinear instability which is the reason for the difference between the north and south hemisphere climate oscillation. Transition periods such as the YD show that while the SH oscillates smoothly, the NH shows sharp fluctuations. The nonlinear instability of the AMOC comes from the salinity feedback – gulf stream increases salinity in the North Atlantic which drives deep water formation which in turn drives the Gulf Stream itself. Freshwater from Greenland could be the negative feedback that chokes off the salinity positive feedback causing it, like all positive feedbacks in climate, to be limited.
https://www.google.co.uk/search?site=&source=hp&ei=OeCiVp_JNsLmUpfMlcAG&q=bill+illis+greenland+DO&oq=bill+illis+greenland+DO&gs_l=mobile-gws-hp.3…3871.23302.0.25177.24.24.0.1.1.0.286.4418.1j11j12.24.0….0…1c.1.64.mobile-gws-hp..2.13.2473.3.bcR1XtYkgsE#q=bill+illis+greenland+YD+png&prmd=insv&start=10&imgrc=0A2Uup7u1GIPOM%3A
Try this link:
https://plus.google.com/106773082695179128197/posts/YmuLUVfxaeA
““This shows the need to continue to look at different components of the climate system, …”
Say what? They even conclude that global warming on other habitable exoplanets probably killed off aliens!!! Different components, S’truth!! Climate science looks a lot like the “kitchen sink” natchos at my favorite pub, including the red graphics. There is a web site somewhere that lists hundreds of things effected by every conceivable aspect of dangerous climate change.
Hey, thanks for reminding me about that list, Gary.
Here it is:
http://www.numberwatch.co.uk/warmlist.htm
what a list.
how sad and funny at the same time.
It has already been established, from sediment studies in the narrow Gulf Stream passage between the tip of Florida and Cuba, that the AMOC speeds up during ocean warming and slows with ocean cooling. This makes total sense in terms of the viscosity of water, warmer = faster, cooler = slower.
Lordy. And I suppose they think they can calm the waters? Next they’ll be telling us they can walk on top of it.
Please don’t tell them i drive my F250 on the water every other day this time of year.
That’s done in Iceland.
An influx of fresh thought would run amok with the flow of climate science, threatening the global circulation of grant money 😉
Looking at the picture, the Greenland runoff should be entering the circulation right at the point where the water dives down and becomes the cold return stream. Is the lack of salt really enough to override the temperature WRT density difference, after dilution?
But this gush of ice cold fresh water has happened.
As the ice sheet retreated north, what is now the MacKenzie River was blocked by the ice, a lake covering most of what is now the Northwest Territories of Canada formed.
Then when the ice gave way this lake drained rapidly and huge amounts of sediment were carried out into the Beaufort Sea.
So the feared deluge has already happened, how come these activists can produce no evidence for their fears?
Less than 20 000 years ago, should be no problem for these fabulists to fake up some “data”.
doesn’t look like anyone here including Anthony actually read the paper…
http://www.nature.com/ncomms/2016/160122/ncomms10525/abs/ncomms10525.html
Results still based on a model. Meaningless garbage!
‘We suggest that recent freshening in the vicinity of Greenland is reducing the formation of dense LSW, potentially weakening the AMOC. Recent observations are beginning to document declines in the AMOC62, 63, 64, consistent with our hypothesis. Longer time series will be required to confirm this link, but our preliminary results suggest that detailed studies of Labrador Sea hydrography and proximal sources of freshwater, including Greenland, have the potential to improve our understanding of AMOC variability and sensitivity to anthropogenic warming.’
The abstract itself is full of caveats and IMO rightly so.
‘ have the potential to improve our understanding of AMOC variability and sensitivity to anthropogenic warming.’ is very carefully written so that if AW proves to be dwarfed in its effect on ‘AMOC variability’,then the statement still stands true.
What is your objection?
I can read the paper, your mind not so much.
Count the “could” ‘s.
http://i66.tinypic.com/206kahw.png
I count six.
So it could: disrupt (x2), lead to weakening, impact, have global effect, or weaken …based on whatever a large bolus of freshwater release into the Atlantic is capable of.
“Could” must be the climate pseudoscientistist’s favorite verb.
Could is a modal verb, it can mean in the past tense, as “Roger Bannister could run 1 mile in 4 minutes,” or “I could run really fast when I was young, but now I am old and can’t.” Both are affirmative of something that was reality in the past.
Or could is an auxiliary verb, where is is more like “might.” As in the AMOC might slow slow if….(such and such, like 10,000 H-bombs were simultaneously detonated in the North Atlantic).” But who wants to use might in a press release? Unless you need to add impact where there is little to none in the findings.
So the pseudoscientistist uses “could” when “might” would be a more correct choice. But “could” conveys a double, but subtle affirmative meaning in the past tense, but in the future tense… it is subject to all kinds of mischief.
+1
The English language is very rich in that it allows you to convey degrees of certainty by choice of words.
Greatest certainty is described – Definitely, will, does, is, very likely.
Lesser likely hood – probably, could, might
Probabilities less than 50% are the mirror image of the above descriptors with the word ‘not’ appended.
The principal exponent in the scientific field of quantifying documents was? Lord Darwin ( Asimov – Foundation Trilogy).
I would judge ‘could’ as 65%.
6 ‘coulds’ gives 65% ^ 6 = 7.5%
To allow for possible duplication one should double this = 15%
To commemorate Lord Dorwin, the accuracy of the paper should be described as % Dorwin.
i.e. 15% Dorwin. (unlikely?)
Dorwin – not Darwin.
Isn’t there a lot more to the ocean’s circulation than fresh/salt water? Like the spinning of the planet and tidal forces…convection currents…wind and storms? Never mind that it would probably take a lot more melting than what’s going on now – and the amount of time that would take.
The image at the top of the post of the global circulation pattern puzzles me somewhat . It shows the warm section of the current running up the eastern side of the Atlantic and returning as a cold subsurface current down the western side , ie down the east coast of the US .
However the recent sea surface temperature anomalies given in the ref pages here :
http://www.emc.ncep.noaa.gov/research/cmb/sst_analysis/images/monanomv2.png
show the warmer part of the North Atlantic running up the east coast of the US and a colder area between the British isles and Greenland.
Am I confusing anomalies , the difference between current temperature and the “normal” temperature , with the actual temperature .
However even the temperature map below the anomaly map on the WUWT reference page seems to show a warmer current running up alongside the Carolinas (lovely name) .
So, in short , has the global circulation map at the top of the post got the currents twisted in the North Atlantic or am I , as usual , just embarrassingly ignorant .
The image at the top is very much a schematic diagramme, not an accurate chart of exactly where the currents are. For example, the warm current south of Cape of Good Hope is very narrow and close to the coast and runs quite fast, not as shown on the diagramme.
This in one of these pictures which should have “Not to be used for navigation” on it.
Also remember the blue coloured currents are at the bottom of the sea.
Climate science is chock full of urban legends.
World Wide Discrete Ocean Conveyor Urban Legend
There is no discrete ocean circulation system for a melt pulse to interrupt. The silly picture drawing of a world covering thermal haline ‘conveyor’ system has no scientific basis. That urban legend develop from a picture Wally Broeker drew in a paper with zero scientific justification.
Interrupt to North Atlantic Drift Current has anything to do with cyclic abrupt climate change Urban Legend
The largest melt pulse in last 15,000 thousand years occurred more than 1000 years before the Younger Dryas abrupt cooling event. It caused no cooling. Even if a melt pulsed could interrupt the North American drift current atmospheric/ocean modeling indicates Europe would only cool 2 to 3 degrees Celsius. The primary reason Europe is warmer than east coast of the US in the winter is the same reason why the west coast of the US is warmer than the east coast of the US in the winter. Due to the rotation of the earth the jet stream and the prevailing winds flow from west to east. The ocean warms in the summer due to increased sunlight in the summer. That heat is released in the winter and is more than order more than the heat released by the North Atlantic drift current.
Wally Broeker also started the myth that the cyclic abrupt climate change is caused by an interruption to the North Atlantic drift current. The North Atlantic drift current is not ‘part of the solution’ of what causes abrupt cyclic climate change.
The third urban legend in climate ‘science’ is that the planet’s climate has a ‘tendency’ to jump from one state to another. Rocks do not jump up hill. There is a physical reason for the Younger Dryas abrupt climate change at which time the planet when from interglacial warm to glacial cold with 70% of the cooling occurring in less than a decade, at a time when insolation at 65N was at a maximum. The Younger Dryas abrupt cooling ‘event’ lasted for 1200 years. During the YD abrupt cooling event the North Atlantic ocean froze each winter to a latitude of Northern Spain and the UK had an average temperature of -3C. Abrupt climate change is caused by a massive cyclic forcing change which is caused by an interruption to the solar cycle and is caused by a massive change to the geomagnetic field that occurs when the solar cycle restarts. Remember the burn marks on the surface of the earth on different continents and at different latitudes, that correlate in time with Younger Dryas abrupt cooling event? There is the largest change in C14 in the geological record that correlates with the YD abrupt climate change and there is geomagnetic excursion that correlates with the YD abrupt climate change event.
http://www.sciencedaily.com/releases/2009/05/090513130942.htm
http://www.americanscientist.org/issues/pub/the-source-of-europes-mild-climate
http://www.atmos.washington.edu/~david/Gulf.pdf
Montreal”s contribution for adding fresh melt. PS and this is the Montreal Mayor D. Coderre that this week refuses to allow the western pipe line from Alberta to eastern Canada. .http://globalnews.ca/news/2330913/why-is-montreal-dumping-8-billion-litres-of-sewage-into-the-st-lawrence/
The importance of the Gulf Stream to European climate has been (and continues to be) vastly exaggerated, so says Richard Seager, a fully paid-up member of Team Alarm:
http://www.ldeo.columbia.edu/res/div/ocp/gs/
Without the Gulf Stream, Western European coasts would have roughly the same climate as Seattle (which doesn’t have a warming ocean current), i.e. pretty much unchanged.
Goodness gracious, if we ever get as warm as the Medieval Warm Period, farmers might move back into Greenland again!
The data suggest …
One one of the most unprecedented worm-word constructs. Can data suggest? Don’t researchers suggest that the data provides supporting evidence? Don’t activists suggest that we restructure the accumulated wealth of the entire world because models show “global temperature” is changing at an unprecedented rate, and may have serious social and economic consequences many decades from now? I suggest the immediate social and economic consequences of their approach will affect our children NOW. Must we disinherit them tomorrow for what might befall our grandchildren? Is there no hope they can solve the problem of survival on this nondiscriminatory planet on their own, as have humans for hundreds of thousands of years?
If multiple attempts to discover overturning circulation disruption has resulted in nada, who the frick allowed this granted study to proceed??? I wonder if it was a granting body that was formed simply to grant each other’s projects? I know how this works. The application author excuses him/herself from the meeting so that the voting isn’t biased. Then he/she comes back in while another application author excuses him/herself from the meeting so that the voting on that project isn’t biased. And on it goes.
http://i142.photobucket.com/albums/r103/HocusLocus_photos/OceanFlowDymaxion.png
The Masked Mercator to Dymaxion-izer strikes again! Print, cut out and fold over flaps to create an icosahedron to put on your desk. Unfortunately this projection’s whole purpose is to keep landmasses together so this demonstration of ocean flows fails miserably. But such quibbles do not discourage the Masked Mercator to Dymaxion-izer.
This is one of Wally Broeker’s urban legend papers the ‘Angry Beast’ paper, complete with the elementary school picture drawing that illustrates the deep climatology concept (urban legend no logic to justify the statement) that ‘climate’ is an angry beast.
P.S. There are burn marks on the surface of the earth that correlate with the last cyclic abrupt climate change the ‘Younger Dryas’ abrupt climate change. Climate is not an ‘angry beast’. The sun is the angry beast. The planet resists climate forcing changes. The cyclic massive abrupt climate change that is observed in the paleo climate record has a physical cause (Big revelation/epiphany, we live in a physical world, things happen in the physical world, including cyclic abrupt climate change and the glacial/interglacial cycle, for physical reasons, there are no magic wands.)
The idiotic cult of CAGW scientists have no idea what is currently happening to the sun and have no idea how what is currently happening to the sun will cause abrupt cooling. It outside the realm of scientific possibility/imagination that the sun and stars could be significantly different that the standard model.
There are hundreds of astronomical observations in peer review papers that support the assertion that the sun, stars, galaxies, and ‘quasars’ are significantly different than the standard models. The difference between cosmological theory and observation is comical/surreal, astonishing. Some of the cosmological observational paradoxes have been known and ignored for almost 30 years. There are now month by month new observational paradoxes concerning every logical pillar of the standard cosmological theory. An intelligent undergraduate student with no prejudice and a little imagination could solve the cosmological ‘puzzle’ using the available piles and piles of observations in a fortnight.
http://cosmicrays.oulu.fi/webform/query.cgi?startday=23&startmonth=12&startyear=1969&starttime=00%3A00&endday=23&endmonth=01&endyear=2016&endtime=00%3A00&resolution=Automatic+choice&picture=on
Oh well, well, well, back to talking about Wally Broeker and his friends’ climatology urban legends.
See Figure 5. which is Wally’s friend’s picture of an angry beast. Note there is zero explanation as to what causes the glacial/interglacial cycle or what causes cyclic abrupt climate change, the essential message of the ‘paper’ is climate is ‘angry’ beast’ because the paleo climatologists have no clue as to the physical reason for the glacial/interglacial cycle or cyclic abrupt climate change.
As noted above the North Atlantic ocean probe data (only 8% of the deep ocean probes moved into the deep ocean 92% moved into the general ocean) indicates that there is no discrete worldwide thermohaline circulation ocean conveyor. Atmospheric/ocean modeling indicates the heat transported by the North Atlantic drift current is an order of magnitude less than the summer heat that is released and transported by the prevailing winds in the winter to explain why the west coast of Europe is warmer than the east coast of the US.
http://www.soest.hawaii.edu/GG/FACULTY/POPP/Broecker%201999%20GSA%20Today.pdf
“The data suggest that the influx of freshwater from Greenland is accelerating, and has changed the Labrador Sea in ways that could lead to a weakening of the AMOC.”
..and the measurements says you’re full of it…
http://www.bio.gc.ca/science/data-donnees/archive/woec/labsea/images/ls_s-ta1.gif
When you Alarm-est explain now 400 feet of solid new ice on Greenland 10 k from the coast. and do not give me this location has more but the other has and the land is rising and it,s cloudy ..>http://www.nytimes.com/1988/08/04/us/world-war-ii-planes-found-in-greenland-in-ice-260-feet-deep.html
Liberals hate reality !!
http://americanlibertypac.com/2016/01/lawmakers-attempting-to-silence-scientific-dissent-on-climate-change/?utm_source=160123ALPACNEWOPENSDBMSP3&utm_medium=email&utm_campaign=160123ALPACNEWOPENSDBMSP3
Marcus I was wondering when you would wake up. I can now stop posting and go back to watching CNN.
What seems to be missing from the conversation is why this circulation exists. The reason is that evaporation exceeds precipitation in the tropics and precipitation exceeds evaporation in polar regions. If the circulation did not refill the tropical oceans over time all of the Earth’s ocean water would collect at the poles. Gravity fixes this by pushing water down at the poles which pushes tropical oceans up from below.
Isn’t it just the 2nd Law in action?
dbstealey,
The second law about entropy. The only relevant law here is Newton’s law of gravity (or GR if you prefer). Of course, entropy and equilibrium are always connected.
Apologies for not being clearer. What’s happening is that water is circulating from warmer to cooler areas. That’s why talk of ocean circulation ‘shutting down’ is nonsense.
Hey, do not forget about all the excentrifugal forz at the equator. Makes heap big bulgie bulgie, water get fat, lazy. Lazy water not like de coldy coldy. Makes de warmy warmy.
One of the very nastiest parts of this oceanic conveyor silliness is that they NEVER show the Gulf of Mexico involved in the N Atlantic flow. They CAN’T, because if they did, they’d have to acknowledge that the Gulf Stream is driven not by sinking waters off Iceland but by winds and the Coriolis effect due to the rotation of the Earth (and deflected eastward by the N American coast). To stop all of that requires the Earth to stop spinning. As long as the planet rotates, the angular momentum MUST drive water north, with a nudge to the east.
The current flow IN the Gulf is what picks up the heat. If all that heat energy didn’t get transported up to N Europe, where would it go to?
Anytime you hear talk of the oceanic conveyor that does not include discussion of the heated water slowly circulating in the Gulf of Mexico, you know they are lying. And any map that doesn’t include that loop is lying.
Imagine the amount of angular momentum in all of the water in each of the ocean basins?
And adding some tiny amount of fresh water at the surface in one spot is going to bring that to a grinding halt?
Those maps of the conveyor loop are not to be confused with currents, but are more of a gradual trend in flow, superimposed on the much more energetic pattern of oceanic gyres. If they even exist as mapped out in this and similar diagrams. Seems to be some disagreement on this. Lots of people believing something does not make it so. I would like to see the original research demonstrating this flow that occurs where no current exists.
The Gulf Stream actually starts next the coast of Africa at the equator. The Trade Winds and Coriolis effect, start the Gulf Stream on its journey.
One would have to shut-off the Trade Winds and then the mid-latitude Westerly winds or decrease the sea level next to Florida to change the Gulf Stream.
[Note in many parts of the ice ages, the Gulf Stream probably did not flow into the Gulf of Mexico and then around Florida because the ocean wasn’t deep enough next to Florida at this time because of sea level decline. A big ocean current like the Gulf Stream needs at least 200 metres of ocean depth to flow properly. When there is not a deep enough channel to allow continuous flow, the large ocean current will find the next best option because all the water coming in behind has to go somewhere. The Gulf Stream in many parts of the ice ages probably flowed out around the Caribbean Islands and then dissipated rather quickly in the mid-Atlantic rather than its current course. As sea level went up and down, it probably took different tracks at different times –
which just MIGHT just be the very BEST explanation for the Dansgaard–Oeschger events and the Dryas events in the northern hemisphere. The Gulf Stream alternated between flowing up into the north Atlantic and/or dissipating in the mid-central Atlantic as sea level changes alternately shut down or opened the Florida channel for the Gulf Stream flow.]
“The amount of freshwater flux from Greenland was relatively stable from the late 1970’s to the mid 1990’s, and then began to increase. Increased freshwater flux could weaken the AMOC, resulting in a number of consequences, both local and global, said the researchers.”
The increased melt from the mid 1990’s was due to an increase in negative North Atlantic Oscillation. Negative NAO episodes drive slow AMOC simultaneously with Greenland melt events, e.g. summer 2012. (click on graph to enlarge):
http://www.rapid.ac.uk/
“According to the researchers, not only are changes in the AMOC difficult to measure, it’s also difficult to separate natural climatic variation from climate changes induced by human activity.”
Not so, increased forcing of the climate increases positive NAO. What really needs explaining is why negative NAO increased from the mid 1990’s, the complete reverse of what increased CO2 is expected to do.
http://www.ipcc.ch/publications_and_data/ar4/wg1/en/ch10s10-3-5-6.html
There is only one explanation that makes any sense to me, the decline in solar wind strength since the mid 1990’s:
http://snag.gy/HxdKY.jpg