Guest Post by Bob Tisdale
NOAA revised their global surface temperature product in June 2015 to show more global warming during the post-1998 period. Those data manipulations supposedly ended the slowdown in global warming over that period. The changes to NOAA’s global ocean surface temperature product were the primary cause of the NOAA’s hiatus-disappearing act. That dataset, NOAA’s new Extended Reconstructed Sea Surface Temperature dataset, version 4 (ERSST.v4), received a lot of media and blog attention when NOAA published Karl et al. (2015) Possible artifacts of data biases in the recent global surface warming hiatus back in June 2015.
The new NOAA ERSST.v4 sea surface temperature dataset has since been included in both the NOAA and the GISS global land+ocean surface temperature products. Because the oceans cover about 70% of Earth’s surface, the new NOAA ERSST.v4 data are a critical component. But there are numerous oddities in the new NOAA “pause-buster” sea surface temperature data. I’ve published a series of blog posts about those curiosities. In addition to the post-1998 period, those posts also dealt with oddities found in the earlier data as well. This article provides a summary of the past posts. I’ve also added and clarified a few discussions where necessary.
This post confirms that Congressman Lamar Smith should be questioning NOAA’s recent revisions to their sea surface temperature product.
ADDITIONAL PAPERS SUPPORTING NOAA’s ERSST.v4 DATA
In addition to Karl et al. (2015), NOAA scientists have published 3 other papers about the new ERSST.v4 data:
- Huang et al. (2015) Extended Reconstructed Sea Surface Temperature version 4 (ERSST.v4), Part I. Upgrades and Intercomparisons,
- Liu et al. (2015) Extended Reconstructed Sea Surface Temperature version 4 (ERSST.v4): Part II. Parametric and Structural Uncertainty Estimations, and
- Huang et al (2015b) Further Exploring and Quantifying Uncertainties for Extended Reconstructed Sea Surface Temperature (ERSST) Version 4 (v4) – Preliminary Accepted Version
PRELIMINARY NOTES
The source of the data and climate model outputs presented in the post is the KNMI Climate Explorer. Global and hemispheric ocean surface temperature data and climate model outputs are limited to the latitudes of 60S-60N. This is done because data suppliers (and climate modelers) treat regions with sea ice differently.
THE NIGHT MARINE AIR TEMPERATURE DATASET USED BY NOAA FOR BIAS CORRECTIONS OF SHIP-BASED TEMPERATURE MEASUREMENTS DO NOT SUPPORT THE EXCESSIVE WARMING RATE OF THE NOAA ERSST.v4 PRODUCT SINCE 1998
Figure 1 was presented in the post Open Letter to Tom Karl of NOAA/NCEI Regarding “Hiatus Busting” Paper (WattsUpWithThat Cross post here). For the global oceans (60S-60N), it includes NOAA’s “pause-buster” ERSST.v4 sea surface temperature data and UKMO’s HadNMAT2 Night Marine Air Temperature data. NOAA used the HadNMAT2 data for bias adjustments of ship-based (buckets of various types and ship inlets) sea surface temperature measurements over the full term of their ERSST.v4. In other words, NOAA adjusted the ship-based sea surface temperature measurements so that they mimicked the UKMO HadNMAT2 data from 1880 to 2010. Night marine air temperature data are a curious reference for sea surface temperatures. Global temperature data suppliers have historically shied away from night marine air temperature data because of the reduced number of observations (they eliminate most daytime observations) and because of the additional biases in the marine air temperature data. (See the Hadley Centre FAQ webpage here.)

Figure 1
The graph starts in 1998, because that was one of the start years for the “hiatus” used in Karl et al. (2015). The graph ends in December 2010, because that’s when the night marine air temperature data end. According to Karl et al. (2015), the ship-based temperature adjustments were the primary cause of the increase in the warming rate during the “hiatus” compared to their former sea surface temperature reconstruction, ERSST.v3b.
In addition to adjustments for the biases in ship-based observations, NOAA also adjusted their ERSST.v4 product for biases between ships and drifting buoys (which are not ARGO floats). Buoys have become the dominant sea surface temperature measurement in recent years. The ship-buoy bias adjustment, and the additional weighting given to buoys because of their “greater accuracy”, were the additional primary reasons given by Karl et al. (2015) for the higher warming rate during the “hiatus” in their new ERSST.v4 sea surface temperature product.
There are no ship-buoy biases in the HadNMAT2 data. Why then do NOAA’s global ERSST.v4 sea surface temperature data have a noticeably higher warming rate than the dataset (HadNMAT2) that NOAA used for ship-based temperature adjustments?
One suggestion for the difference has been that the one of the datasets is infilled while the other isn’t. That is, UKMO HadNMAT2 data are not spatially complete, meaning UKMO does not infill ocean grids without data. On the other hand, the NOAA ERSST.v4 data have been infilled, meaning that NOAA uses statistical methods to create data for grids where none exist, providing the appearance of a spatially complete dataset. For those new to this topic, you’re probably wondering where that would have the greatest impact.
Historically, the surface temperatures of the Northern Hemisphere oceans have been sampled better than those of the Southern Hemisphere. Even in recent years, there is very little ship traffic in the mid-to-high latitudes of the Southern Hemisphere. As a result, vast portions of the Southern Hemisphere oceans have been without ship-based ocean surface temperature measurements, both sea surface and night marine air temperatures. The drifting buoys have helped sea surface temperature measurements there over the past decade (but not marine air temperature because buoy-based air temperature measurements are excluded from marine air temperature datasets).

Figure 2
As an example, Figure 2 is a map of night marine air temperature anomalies for December 2010 that’s available at the UKMO HadNMAT2 webpage here. I’ve highlighted the equator and the latitudes of 60S and 60N. There are only a few 5-deg latitude by 5-deg longitude ocean grids without night marine air temperature samples in the Northern Hemisphere, while there are many ocean grids without data in the Southern Hemisphere from 45S to 60S.
So, if the infilling used by NOAA was the reason for the difference in warming rates between the ERSST.v4 “pause buster” data and the HadNMAT2 reference data shown in Figure 1, we should expect the differences in trends from 1998 to 2010 to appear mostly in the Southern Hemisphere where there would be much more infilling. But, as shown in Figure 3, the warming rates of the ERSST.v4 and HadNMAT2 data are the same (not similar, the same) for the Southern Hemisphere over that timeframe.

Figure 3
From 1998 to 2010, the excessive (about 0.1 deg C/decade) difference in the warming rates between the ERSST.v4 “pause buster” data and the HadNMAT2 reference data appears in the Northern Hemisphere, where there should be much less infilling. See Figure 4.

Figure 4
The question Why do NOAA’s ERSST.v4 “pause-buster” data have a noticeably higher warming rate during the “hiatus” than the reference HadNMAT2 data? remains unanswered.
ACCORDING TO THE LATEST GENERATION OF CLIMATE MODELS, MARINE AIR TEMPERATURES SHOULD HAVE A HIGHER TREND THAN SEA SURFACE TEMPERATURES IN RECENT YEARS…NOT THE REVERSE AS NOAA HAS THEM IN THEIR NEW ERSST.V4 PRODUCT
In the post Pause Buster SST Data: Has NOAA Adjusted Away a Relationship between NMAT and SST that the Consensus of CMIP5 Climate Models Indicate Should Exist? (WattsUpWithThat cross post is here), we discussed how NOAA had based one of their adjustments to the ERSST.v4 data (the adjustment with the greatest impact during the slowdown in global warming) on the outputs of one earlier-generation climate model, not a consensus of the latest generation of models. This could lead some readers to conclude that NOAA cherry-picked that climate model because it provided the answer they desired. And we showed that, based on the consensus of the latest generation of climate models, NOAA appears to have adjusted away a relationship that the consensus of newer models indicate should exist. See the post linked above for quotes and additional information.
Specifically, NOAA’s assumption that marine air temperature can be used to adjust sea surface temperature data comes from the outputs of their out-of-date GFDL CM 2.1 climate model, which was replaced by the GFDL CM3 in 2011…well before the publication of the new NOAA ERSST.v4 data. That is, based on the outputs of their out-of-date climate model, NOAA assumes the temperature difference between night marine air temperature and sea surface temperature is relatively constant, and as a result, the sea surface temperature data could be adjusted to mimic the marine air temperature data. Additionally, NOAA assumes the relationship between sea surface temperatures and night marine air temperature is similar to the relationship between sea surface temperatures and marine air temperature (both day and night). They provided a reference for this latter assumption.
To confirm there is a relatively constant relationship between marine air and sea surface temperature, NOAA presented Figure 4 in their Huang et al. (2015) paper Extended Reconstructed Sea Surface Temperature Version 4 (ERSST.v4) – Part I: Upgrades and Intercomparisons. I’ve included their Figure 4 as my Figure 5. In the caption, NOAA notes the trend of the climate model-simulated difference between marine air and sea surface temperatures for the global oceans (60S-60N) is only -0.08 deg C/century (-0.008 deg C/decade) for the period of 1875-2000. Curiously, that graph ends in 2000, while we’re interested in the “hiatus” period of 2000 to 2014, because that was one of the periods NOAA focused on in their Karl et al (2015) “pause-buster” paper.

Figure 5 – Figure 4 from Huang et al. (2015)
Using the model-mean (which represents the consensus or groupthink) of the latest generation of climate models, I then confirmed that the new and improved climate models agree that the climate model-simulated difference between marine air and sea surface temperatures for the global oceans (60S-60N) is -0.08 deg C/century (-0.008 deg C/decade) for the period of 1875-2000. See Figure 6.

Figure 6
NOTE: For this post, I have reversed the color coding of the sea surface and marine air temperature curves used in the prior post so that they better agree with Figures 1, 3 and 4 above. [End note.]
In my Figure 6, we can see there is a noticeable change in the apparent trend of the simulated temperature difference starting in the 1970s. That is, there appears to be a low trend from 1875 to 1970 and a higher trend afterwards. So, using the outputs of the new and improved models, I plotted the modeled temperature difference for the period of 1971 to 2000. As shown in Figure 7, the trend of the temperature difference for the period of 1971-2000 is much greater (-0.21 deg C/century or -0.021 deg C/decade) than the longer-term trend.

Figure 7
That certainly undermines the NOAA assumption that the temperature difference between marine air temperature and sea surface temperature is relatively constant and that sea surface temperature data could be adjusted to mimic the marine air temperature data.
And for the Karl et al. (2015) period of 2000 to 2014, there was an even larger difference in trends between the simulated marine air and sea surface temperatures. See Figure 8.

Figure 8
However, in that previous post, I did not present the simulated trends of the marine air and sea surface temperatures for the period of 1998 to 2010, so that we could compare them to Figure 1 above, which is the comparison graph between the ERSST.v4 “pause-buster” data and the HadNMAT2 reference data. I have included them in this post as part of my Figure 9.

Figure 9
According to the consensus (groupthink) of the latest generation of climate models, global marine air temperatures should be rising at a slightly faster rate than sea surface temperatures for the period of 1998 to 2010. But in NOAA’s world of excessive temperature adjustments, they reversed the relationship.
The questions raised by this portion: Did NOAA cherry-pick an out-of-date climate model as a reference because it provided them the answers they desired…that marine air temperature can be used as reference for ship-based sea surface temperature bias adjustments? And, why has NOAA adjusted away (reversed) the relationship between the warming rates of marine air and sea surface temperatures that the consensus of the latest generation of climate models indicate should exist? Is NOAA suggesting the consensus (groupthink) of the latest generation of climate models is wrong?
THE TWO CURIOSITIES IN THE RECENT NOAA PAPER ABOUT THE UNCERTAINTIES IN THEIR ERSST.v4 “PAUSE-BUSTER” PRODUCT
NOAA recently published a paper that presents the uncertainties in their new ERSST.v4 dataset. That paper is Huang et al. (2015b) Further Exploring and Quantifying Uncertainties for Extended Reconstructed Sea Surface Temperature (ERSST) Version 4 (v4). (The Preliminary Accepted Version is available here.)
I discussed two curiosities found in that paper in the post NOAA’s New “Pauses-Buster” Sea Surface Temperature Data – The Curiosities Extend into the 1st Half of the 20th Century… (WattsUpWithThat cross post is here). The first oddity was an obvious “typo” that was repeated in the paper.
Huang et al. (2015b) includes (my boldface):
A recent study (Karl et al. 2015) indicated that the trend of globally averaged SST in ERSST.v4 in the most recent decades (0.99°C century-1; 2000-2014) is as large as in the longer period of 1951-2012 (0.88°C century-1).
Why is it an obvious typo? If the trend for the most recent decades (2000-2014) was 0.99 deg C/century while the trend for the period of 1951-2012 was less at 0.88 deg C/century, wouldn’t NOAA be claiming that global warming had accelerated during the “hiatus”?
With their new ERSST.v4 data, for the period of 1951-2012, the trend actually listed in Table S1 of the Supplementary Materials for Karl et al. (2015) is 0.100 1.00 deg C/century. See my Table 1, which is highlighted version of the Karl et al. Table S1. The trend of 0.88 deg C/century is for the former (“old”) NOAA ERSST.v3b reconstruction, not the “new” ERSST.v4 “pause-buster” product.

Table 1
The second curiosity is that the trends (warming rates) of the new NOAA global ERSST.v4 data reside near the high ends of the trend uncertainty ranges shown in Figure 6 from Huang et al (2015b). See my Figure 10.

Figure 10
Note: I’ve added the lines for the “ensemble average trends” for this post. [End note.]
And if you’re wondering about the ERSST.v4 data trend for the period of 1901 to 2014 (Cell a in Figure 6 from Huang et al. 2015b), the data for the latitudes of 60S-60N (global excluding the polar oceans) present a linear trend of 0.073 deg C/decade (0.73 deg C/century)….which is slightly higher than the “ensemble average trends” listed in the caption for Figure 6 from Huang et al. (2015b).
The question raised in this portion: Why are the actual trends of the global ERSST.v4 data for the periods of 1951-2012 and 2000-2014 near the high ends of their trend uncertainty histograms?
NOAA’s ERSST.v4 “PAUSE-BUSTER” SEA SURFACE TEMPERATURE PRODUCT IS THE ONLY SEA SURFACE TEMPERATURE DATASET WHERE THE WARMING RATE IN THE FIRST HALF OF THE 20th CENTURY IS LOWER THAN THE WARMING RATE FOR THE PERIOD OF 1951-2012
This curiosity in the new NOAA ERSST.v4 product was also discussed in the post NOAA’s New “Pauses-Buster” Sea Surface Temperature Data – The Curiosities Extend into the 1st Half of the 20th Century… See that post for specifics about the numerous sea surface temperature datasets presented in Figure 11.
I presented that oddity because of the following statement in Huang et al. (2015b) (my brackets):
The trend ranges from 0.7°C to 1.0°C century-1 [for the period of 1951-2012] which is higher than the long term trend shown in Figure 6a [for the period of 1901-2014], indicating stronger oceanic warming since the middle of the 20th Century.
Many persons might believe that NOAA is suggesting that global warming is accelerating with that statement.
Anyone who has studied sea surface temperature data understands that the ocean surface warming shown in the second half of 20th Century (or for the period of 1951-2012) is higher than the long-term trend. All ocean surface temperature data show that relationship. (See the graph here.) HOWEVER (big however), they also understand that the warming rate of the first half of the 20th Century is higher than the long-term trend (See the graph here.)
And those of us who study sea surface temperature data understand that, prior to the release of the new ERSST.v4 “pause-buster” data, all sea surface temperature datasets showed warming rates in the first half of the 20th Century that were comparable to, or slightly higher than, the warming rates since 1951. See Figure 11. That is, only NOAA’s “pause-buster” ERSST.v4 data have a noticeably lower warming rate in the first-half of the 20th Century.

Figure 11
For those who would prefer to see those graphs split into 2 50-year periods, see the illustration here.
Recall that NOAA uses the UKMO HadNMAT2 marine air temperature data to bias adjust the ship-based sea surface temperature observations for their new ERSST.v4 “pause-buster” data. Oddly, as shown in Figure 12, even the HadNMAT2 data do not support the lower warming rates in the first half of the 20th Century shown by the global ERSST.v4 data.

Figure 12
If NOAA had corrected their ERSST.v4 product for the 1945 “discontinuity” and trailing biases presented in Thompson et al. (2008), discussed next, it’s likely the new NOAA data would have a lower warming rate after 1951 than in the first half of the 20th Century. And that brings us to…
NOAA FAILED TO CORRECT FOR THE 1945 “DISCONTINUITY” AND THE TRAILING BIASES IN ITS NEW “PAUSE-BUSTER” ERSST.v4 PRODUCT
We discussed this oddity about the new NOAA ERSST.v4 product in the recent post Busting (or not) the mid-20th century global-warming hiatus, which was also cross posted at WattsUpWithThat (here) and at Judith Curry’s blog ClimateEtc. (here). See that post for specifics and further information about the problems with the post-World War II sea surface temperature observations.
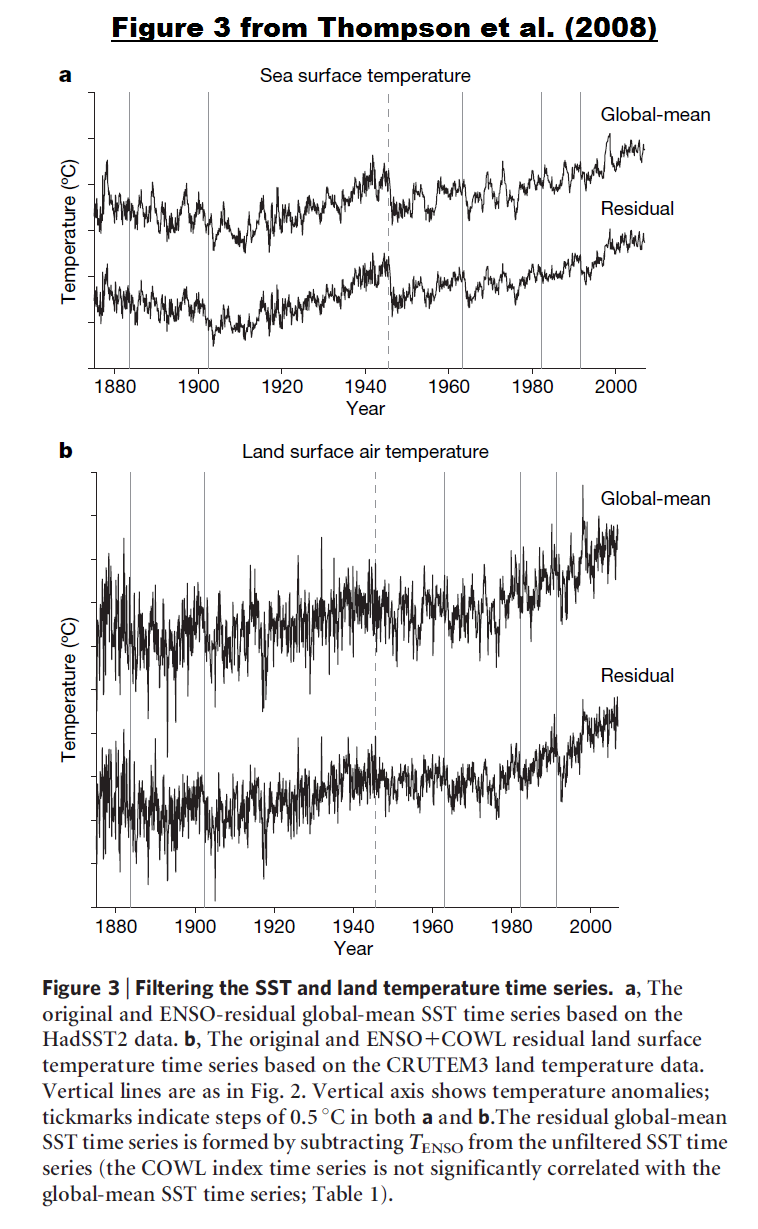
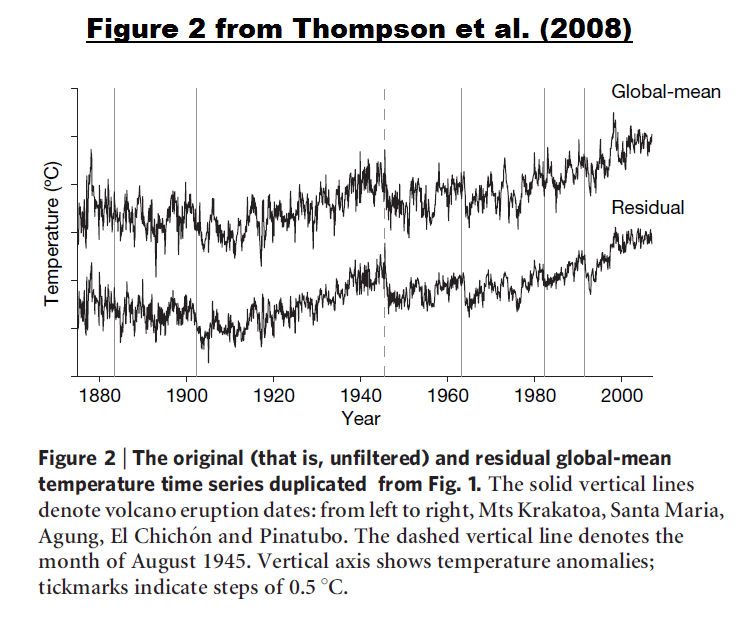
In 2008, Thompson et al. A large discontinuity in the mid-twentieth century in observed global-mean surface temperature (paywalled) brought attention to the sharp drop in sea surface temperatures in 1945, which is the last year of World War 2. They used a number of metrics, including an ENSO index and stratospheric aerosols, to show that the sharp drop-off in sea surface temperatures in 1945 (See Figure 13.) was not caused by volcanos or by the transition from an El Niño to a La Niña.

Figure 13
I’ll repeat a portion of my earlier post here, with the Figure numbers changed for this one.
Thompson et al. write about sea surface temperature (SST) data:
The most notable change in the SST archive following December 1941 occurred in August 1945. Between January 1942 and August 1945, ~80% of the observations are from ships of US origin and ~5% are from ships of UK origin; between late 1945 and 1949 only ~30% of the observations are of US origin and about 50% are of UK origin. The change in country of origin in August 1945 is important for two reasons: first, in August 1945 US ships relied mainly on engine room intake measurements whereas UK ships used primarily uninsulated bucket measurements12, and second, engine room intake measurements are generally biased warm relative to uninsulated bucket measurements6,7.
Hence, the sudden drop in SSTs in late 1945 is consistent with the rapid but uncorrected change from engine room intake measurements (US ships) to uninsulated bucket measurements (UK ships) at the end of the Second World War. As the drop derives from the composition of the ICOADS data set, it is present in all records of twentieth-century climate variability that include SST data.
Thompson et al also note the 1945 discontinuity does not exist in the land surface air temperature data (I’ve included links to their Reference 5 and their Figures 2 and 3 in the text):
The step in late 1945 does not appear to be related to any known physical phenomenon. No substantial volcanic eruptions were reported at the time, and the nuclear explosions over Hiroshima and Nagasaki are estimated to have had little effect on global-mean temperatures: ~100 Hiroshima-sized explosions are predicted to lead to a global-mean cooling of ~1.25 deg C (ref. 5), thus two such explosions might be expected to lead to a cooling of less than 0.03 deg C. Furthermore, ocean and land areas should both respond to an external forcing, but the step is only apparent in SSTs (Fig. 3). The global-mean land time series does not exhibit warming from the middle of the century until about 1980, but there is no large discrete drop in late 1945 in the unfiltered land series and only an indistinct drop in the residual land series (Fig. 3b). As is the case for the global mean time series in Fig. 2, the drop is apparent in the unfiltered global-mean SST time series but is highlighted after filtering out the effects of internal climate variability.
You may be noting in Figure 13 (above) that the discontinuity also appears in the HadNMAT2 night marine air temperature data. The support paper for HadNMAT2, Kent et al. (2013) paper Global analysis of night marine air temperature and its uncertainty since 1880: The HadNMAT2 data set, discussed the World War 2 and post-war periods in their Key Results and Remaining Issues (my boldface):
It is possible though that the adjustments applied to the data after WW2 are not applicable to the data in the region 15 to 55S, since there is a relative cool bias of about 0.4 C here during the mid-1940s to mid-1950s, as compared to the HadSST3 ensemble median.
The HadNMAT2, unlike MOHMAT4 and HadMAT1 is not dependent on time-varying SST for any adjustment, although at the cost of a shorter data set. The requirement for the Suez adjustment was removed by the exclusion of observations rather than using SST anomalies. WW2 biases in NMAT are adjusted using daytime marine air temperature anomalies, as in previous data sets. The adjustment appears to have slightly better results than that used in MOHMAT4 and is applied over a shorter period. However, comparisons with collocated land anomalies suggest that HadNMAT2 remains too warm during WW2. Further investigation of the daytime marine air temperatures is therefore required. Additionally, our analysis suggests that the data prior to 1886 are also erroneously warm and should not be relied upon.
In other words, the discontinuity in the night marine air temperature may also result from observation biases, which then get passed on to the NOAA ERSST.v4 data. Regardless, Thompson et al. (2008) found there was no basis for the 1945 discontinuity, yet NOAA did not correct for it in their ERST.v4 “pause(s)-buster” data.
The UKMO adjusted their HADSST3 sea surface temperature data to account for the 1945 discontinuity and the trailing biases. See the two support papers for HADSST3:
- Kennedy et al. (2011) Reassessing biases and other uncertainties in sea-surface temperature observations measured in situ since 1850, part 1: measurement and sampling uncertainties
- Kennedy et al. (2011) Reassessing biases and other uncertainties in sea-surface temperature observations measured in situ since 1850, part 2: biases and homogenisation
NOAA, on the other hand, did not adjust their ERSST.v4 product to account for the 1945 discontinuity and the trailing biases. The differences between global HADSST3 and NOAA’s ERSST.v4 data for the period of 1940 to 1975 are shown in Figure 14.

Figure 14
What impact does NOAA’s failure to correct their ERSST.v4 data for the 1945 discontinuity and trailing biases have on the 1951-2014 global sea surface temperatures? See Figure 15.

Figure 15
NOAA’s ERSST.v4 “pause(s) buster” product shows a warming trend from 1951 to 1975, while the UKMO’s HADSST3 data show cooling. NOAA’s ERSST.v4 product also shows a noticeably higher warming rate from 1951 to 2014 than the UKMO’s HADSST3 data.
Why did NOAA fail to make the necessary mid-20th Century adjustments to their ERSST.v4 sea surface temperature product—corrections that were shown to be needed by Thompson et al. (2008)? There are three likely answers: (1) NOAA did not want to decrease the warming rate starting in 1951 that would have resulted if they had made those corrections. (2) A decrease in the post-1951 warming rate would likely have resulted in the ERSST.v4 data showing more warming in the first half of the 20th Century than the second half. And (3) NOAA wanted to show a more continuous warming since 1950, which would not have existed if they had made those corrections.
IMPORTANT NOTE
Figure 16 presents the meteorological year (December to November) global surface temperature anomalies from 1998 to 2015 for the three available versions of the GISS land-ocean temperature index. The three versions are based on different sea surface temperature datasets available from NOAA. See the post The Three Faces of the GISS Land-Ocean Temperature Index (LOTI) for additional information. As shown, it makes no difference to the GISS land-ocean temperature index which sea surface temperature dataset is used: 2015 would still be showing “record high” surface temperatures. As noted in the illustration, it makes one wonder why NOAA wasted their time creating a problem-filled sea surface temperature dataset (ERSST.v4) when everyone suspected the next strong El Niño would bring an end to the “hiatus” in the surface temperature products…an end that was also contributed to in 2014 and 2015 by the naturally occurring phenomenon called “The Blob” in the eastern extratropical North Pacific.
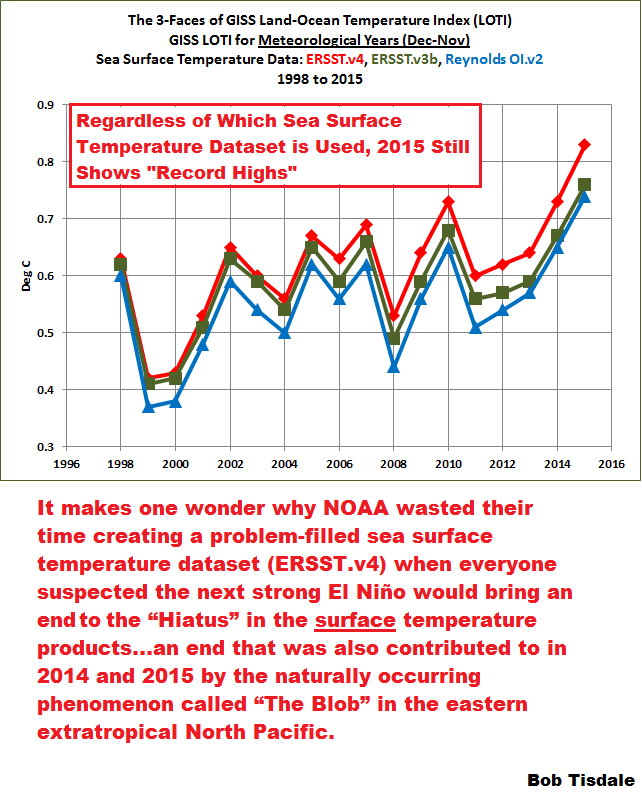
Figure 16
Looking at Figure 16, does it appear to you that taxpayers are getting anything of value from NOAA with their new problem-filled sea surface temperature product, ERSST.v4? All three show upticks in 2014 and 2015. The general public doesn’t care about the values of the anomalies or that one has a warming rate that’s a teensy little bit higher than the other versions. And if the public took the time to understand all of the oddities in the new NOAA ERSST.v4 product, they’d likely lose any confidence they might have had in NOAA.
For more information about “The Blob’s” blatantly obvious impacts on 2014 and 2015 global sea surface temperatures, see General Discussions 2 and 3 in my free ebook On Global Warming and the Illusion of Control – Part 1 (25MB .pdf). Simply click on those general discussions in the ebook’s Table of Contents.
CLOSING
NOAA’s new ERSST.v4 dataset is problem filled, as illustrated and discussed in this post. Yet the climate science community embraced it with open arms. Nothing surprising there.
A month ago, after months of delays, NOAA forwarded staff emails to Congressman Lamar Smith regarding the new NOAA ERSST.v4 “pause-buster” product. See the December 16, 2015 article NOAA Officials FINALLY Surrender Staff Emails To Lawmakers in The Daily Caller. Hopefully, this post and the posts linked to it will help Congressman Smith’s staff better understand the numerous problems that exist with that dataset.
GISS switched from Reynolds/HADISST to ERSST in Jan 2013.
I asked Reto Ruedy at the time why, and he said it was mainly for convenience.
One wonders if moves were already afoot to adjust ERSST to remove the pause. Clearly it would then make sense for GISS and NOAA to be singing from the same hymn sheet
Reto’s reply is here
https://notalotofpeopleknowthat.wordpress.com/2016/01/19/giss-the-tampered-ersst-dataset/
Paul,
A month or so ago I got really annoyed at the thought of GISS, a branch of NASA, seemingly ignoring the satellite data in their various and sundry pronouncements on temperature records. I went on the GISS website and found no references of any substance at all on the matter of satellite data. I did find Reto Ruedy as the contact for questions not addressed in the FAQ section. I emailed him and the following was our email exchange:
Does GISS use the atmospheric temperature data derived from satellite measurements to verify climate models. If so, how is this done and if not why not?
Mark Silbert
Dear Mr. Silbert,
Yes we do and have been doing so ever since those data became available and the computation of temperatures that correspond to the various satellite measurements have been a standard GISS model diagnostic ever since that time. http://pubs.giss.nasa.gov/abs/sh01000b.html shows the abstract and a link to one of the earlier papers about that topic.
Our paper http://pubs.giss.nasa.gov/docs/1995/1995_Hansen_etal_3.pdf discusses comparisons between Satellite data, surface temperature data, and model results.
Thank you for your interest,
Reto Ruedy
Dr Ruedy,
Thank you for your speedy response.
Can you provide me with something tangible I can reference or read that is more recent than 1995?
Regards,
Mark Silbert
Dr. Ruedy,
To be more specific in my question/request, could you provide me with information on:
How is satellite temperature data used in verification and development of GISS/NASA’s GCM?
Is there a systematic effort made to compare and understand differences between GISS surface temperatures and satellite temperatures?
Thank you and I look forward to your response.
Mark Silbert
Mr. Silbert,
As I tried to indicate in my previous email, those particular questions were asked and answered 20 years ago.
Reto Ruedy
Kind of feels like he avoided giving me a direct answer, but the implication I take from this exchange is that NASA/GISS basically don’t use the satellite temperature data for much if anything. As a US tax payer, it makes me wonder what we are really funding NASA for.
Bob Tisdale:
Thankyou for providing yet another of your excellent and cogent reports. It more than justifies its conclusion
I was struck by this point
A range of models enables selection of the model output that most closely provides what is wanted (this is not a sarc), and I am sure you are aware that .
Richard
I really cannot understand how anyone can call an engine room intake temperature an accurate “sea surface temperature”.The E/R intake can be anything from 15 to more than 30 feet below the sea surface on the same 12,000 ton cargo ship at different times depending on amount of cargo and/or ballast.
Another point I notice is the statement that night temperature records were fewer in number than those during the day. When I was on weather reporting cargo vessels we took readings at 0600, Noon, 1800 and M/N local time every day. These were entered into a Met Office log book and also sent to Portishead every day by the Radio Officer in Morse code. (Sending all these numbers used to send them banannas; I still often wonder how many groups of numbers were actually correctly written down at the other end.)
I was an RO on cargo vessels sending weather messages every 6 hours. They all go through. The numbers did get through, you go into ‘auto’ mode after a few months of sending and receiving Morse,
I do not think I am bananas or mad, but my friends may think otherwise!!
You may say that, Steve, I couldn’t possibly comment.
Thanks for the reply.
And I wasn’t suggesting that the sent messages were wrong but that those in a cushy chair in SW England maybe, sometimes, didn’t write down exactly what you sent.
Thank you for a full review of the many revisions and resettings done by NOAA to cool the past and heat up the present. It is disgusting, stupid and ultimately will fail. They are rowing away from reality at a higher and higher speed and this can’t go one forever. Already too many people notice this game they are playing thanks to sites on the internet like this one and many others.
Thank you for your hard work, by the way.
Throw out the accurate Argo and bouy SST datasets as well as the satellite-derived ocean skin temperature measurements which were also assumed to be accurate …
… and use the trends from ship-based engine intakes which need all kinds of quality control and really cannot be accurate because of this.
… and then, even crazier, the ship-based engine intakes don’t even have the warming trend that the newly adjusted ERSSTv4 has.
Just on its face, this is proof that these agencies do not produce reliable data anymore. We should keep repeating the above everywhere until the climate science community stands up and recognizes that the adjustments have to reversed if they want the community to recover its integrity.
The agencies collect temperature data (of questionable accuracy) and produce temperature estimates (of questionable reliability).
Mr. Tisdale,
Excellent and informative as always. However, I again object to referring to made up temperature estimates as “data”. (“…NOAA uses statistical methods to create data for grids where none exist, …”)
Reblogged this on Canadian Climate Guy and commented:
An epic post! NOAA at it again with adjusted tempurature data to “bust the pause”.
I do not think that any informed person can have much confidence in the Karl et al paper, but assume, just for argument’s sake, that it is correct. Just imagine! The effects of CAGW are so astoundingly catastrophic that the warming went undetected for over 18 years before being documented by Karl et al. How can something be so horrifying extensive that it is (so we are told) destroying the planetary biosphere, but at the same time be undetectable without extreme hoop jumping?
Hi Bob.
Another great article explaining the mysteries of NOAA’s ERSST.v4 temperature constructions.
Just a minor typo in your text preceding your Table 1, in reference to Karl et al’s Table S1. You state: “With their new ERSST.v4 data, for the period of 1951-2012, the trend actually listed in Table S1 of the Supplementary Materials for Karl et al. (2015) is 0.100 deg C/century.”
Table S1 is in deg C/decade. So the new value for the Ocean trend for that period should be 1.0 deg C/Century.
When you get a chance, perhaps you could explain why all the new values appear to have significantly improved 90% confidence intervals compared to the old values, particularly in three latest periods in the bottom half of that table. Did Karl et al change the methodology for determining these confidence intervals as well?
Paul Pappas, thanks for finding the typo. I’ve corrected it. Sorry, I haven’t studied Karl et al. sufficiently to answer your question on the new versus old confidence intervals.
“the NOAA assumption that the temperature difference between marine air temperature and sea surface temperature is relatively constant and that sea surface temperature data could be adjusted to mimic the marine air temperature data…”
Ya know, all these oceanographic institutes are sailing around everyday digging mud from the bottom, buzzing geophysical instruments over faults, sea mounts, etc. etc. Is it too much to ask that they settle the question on the relation between marine air temps and sea surface temps. The community tends to bemoan climate/weather chaos of complex coupled atmosphere-ocean-land interactions, but seem to eschew gathering the data that we can with confidence.
Does Steve McIntyre have to go out in a boat with buckets, thermometers and a notebook to make it unnecessary for NOAA to have to assume the relationship between air and sea? In another post, Mosher commented on SI Standards for validation of balloon, r. sondes, satellites, etc. but excused it not being done because they are expensive and time consuming!!! Egads, how much did it cost to launch the satellites, balloons and radio sondes? Is the data important or not? Steve McIntyre queried why the last couple of decades of tree ring data were not updated. The reply from Mann? Well it takes time and money to go back into the field and collect this. Steve set himself a challenge. He went to the Rocky Mountains in Colorado where bristlecone pines had been sampled decades ago and showed that he could get the data from this site and be back in the afternoon at Starbucks in Boulder, Colorado (?). He accomplished this task.
Anthony Watts’s surfacestations.org project succeeded with volunteers to visit and photograph the surroundings of almost all 48 States’ climate network of NOAA and to evaluate the quality category of each much to the embarrassment of the government agency which responded writing papers to try to pre-empt what was coming down the pipe from this an set their blog bulldogs on to him.
I think if we want to know what is going on in climate we might have to take over the job of properly collecting and analyzing data. Our global temperature network of data may be beyond repair. Original data has been lost (Phil Jones) and what we have is the mission oriented adjustments of political science.
Is there a way to give Lamar Smith a heads-up when these posts are published?
Thanks yet again to Bob Tisdale, for an extensive information on the manipulations ar GISS and NOAA. Converting the US ships’ engine room intake temperature measurements and UK ships’ uninsulated bucket measurements, and engine room intake measurements into science records graduated in one hundredths of a degree is the trick of the Century.
Carl is evil
http://youtu.be/jJOwdrTA8Gw
A very interesting paper. Thanks. But can Mr. Tisdale (or anyone else) tell me how ERRST.V4 compares with ERRST.V3, ERRST.V3b, ERRST.V2 and ERRST (the first version published in 2003)? A new version every three years. Would I be wrong in thinking that each version showed more warming than its predecessor?.
Appears to me that, with all their machinations, they don’t seem to be able to produce a warming greater than 1C per century. Doesn’t look too worrisome.